
Abstract
Active transportation (AT), walking/bicycling for transportation, in school-aged children (K-12) provides a variety of health benefits for those who participate. One state-funded initiative which attempts to increase AT among schoolchildren are Safe Routes to School (SRTS) programs. These programs implement education and encouragement projects, as well as infrastructure-related construction. Although these programs have shown significant success in increasing AT behavior and safety throughout many communities in the United States, various demographic populations continue to see disparities in AT participation and injuries/death (e.g., low-income, communities of color, disabled individuals, non-English speakers, etc.). Additionally, there is a lack of literature (academic and technical) concerning strategies to reaching disadvantaged populations. This mixed-methods study attempted to understand the common barriers, best practices, and desired resources to providing equitable programming to disadvantaged populations. Surveys were sent to state SRTS representatives (n = 59), and 22 states completed the survey and these were analyzed. Results suggested that there were many barriers seen when attempting to reaching disadvantaged communities, including within leadership, grant application process, and community implementation. There were various barriers seen throughout states in the U.S.; however, incorporating training/education materials concerning how to successfully reach disadvantaged populations, creating strategies to improve overall funding mechanisms toward these initiatives, and bringing in individuals with public health backgrounds may help initiate equitable and sustainable SRTS programs throughout disadvantaged populations in the U.S.
Physical activity (PA) is one of the most beneficial health behaviors for decreasing the risks of non-communicable diseases, including cardiovascular disease, type 2 diabetes, high blood pressure, obesity, osteoporosis, and some types of cancers ( 1 ). Among children and adolescents, PA has demonstrated positive effects on mental health and well-being; yet, most children in the U.S. are insufficiently active ( 2 ), based on current PA guidelines ( 3 ). One potential, time-efficient way in which individuals can receive the recommended levels of PA is through participation in active transportation (AT) ( 4 , 5 ). AT, commonly seen through the act of bicycling and/or walking to/from school, has been shown to provide youth with significant health benefits ( 6 , 7 ).
Although the benefits of AT are well known, there are still disparities seen in AT participation, as well as inequities in injuries throughout disadvantaged or high-need communities (including, but not limited to communities of color, disabled children, low-income communities, rural communities, LGBTQ+ communities, and more). People of color are killed almost three times as often while walking or bicycling, when compared with their white counterparts ( 8 ). These inequities may be attributed to the lack of community resources and AT promotive infrastructure in lower-income populations and communities of color ( 9 – 12 ). Additional social and environmental norms may influence the participation of marginalized communities ( 13 , 14 ). To work toward transportation equity and justice, programs and policies should be developed to increase the access of AT options which may be systemically hindered by the lack of multi-modal infrastructure, highway systems, noise pollution, high-speed areas, and law enforcement ( 15 , 16 ). Although infrastructure projects may increase overall AT participation, more research is needed concerning the effects and best practices in disadvantaged communities. This is shown in previous literature, where results show that higher-income communities responded better to the implementation and construction of bicycling infrastructure, compared with a low-income community ( 17 ). Achieving this goal may be benefited by involving community-level organizations (i.e., schools), which have had previous success in increasing the participation of AT and PA through programming, education, and evaluation in all individuals, including children and disadvantaged populations ( 18 – 21 ).
One public health initiative that has received considerable federal attention and has shown success in increasing AT participation in children are Safe Routes to School (SRTS) programs. SRTS programs are designed to make walking and bicycling safer and more accessible for children’s transport to and from school (K-12). The Safe Routes Partnership, a national non-profit organization engaged in increasing the success of SRTS programs, encourages SRTS projects/programs to follow the “6E Framework” for implementation, which includes six key “Elements” for providing successful AT implementation: education, encouragement, engagement, equity (added in 2015), engineering, and evaluation ( 22 ). Funding for SRTS may include two types of initiatives: infrastructure and non-infrastructure. Infrastructure projects can include, but are not limited to sidewalk and crosswalk construction, bicycle facilities/parking, speed reduction measures, and traffic diversion techniques. Non-infrastructure projects are as important, and may include campaigns for community awareness, education for traffic safety, classes for bicycling, and other training courses ( 23 ). Previous literature has suggested that non-infrastructure investments are effective in low-income populations and communities of color ( 24 ). In general, these SRTS strategies have proven to be successful ways to increase AT in children throughout the U.S. ( 25 – 30 ).
Significant funding for these programs comes from the federal government and flows through state Department of Transportations. State SRTS representatives are typically in the foreground to disperse these funds to the schools, districts, and communities based on an application process determined by the state. From 2005 to 2012, SRTS initiatives received federal funding through a standalone federal SRTS program as part of the transportation bill, SAFETEA-LU. In June 2012, Congress passed a new transportation bill, MAP-21, under which, SRTS programs were added within the Transportation Alternative Program (TAP). SRTS remains an eligible use of funding under TAP to this day, and some states have changed “SRTS representatives” to “TAP coordinators” ( 31 ). Although there is much literature surrounding best practices for implementing education and encouragement SRTS programming, there is little evidence concerning SRTS programming toward disadvantaged and underserved populations. The Safe Routes Partnership report on state-level policy and support for walking and biking from 2020 stated that only 13 out of 51 states (including Washington, D.C.) reported efforts to “support equitable SRTS programming,” such as funding or other support (e.g., publications, pamphlets, consultants, etc.) for local programs to better engage with one or more disadvantaged populations (e.g., low-income, communities of color, disabled individuals, non-English speakers, etc.) ( 32 ). Additionally, only 19 out of 51 state representatives reported providing any type of special consideration for funding toward higher need communities during the grant application process ( 32 ).
The Safe Routes Partnership released a guide on how to implement SRTS programs into low-income populations. This guide, which may be currently outdated (from 2010), described the basic steps of developing partnerships, understanding the community’s needs and resources, and identifying of key stakeholders ( 33 ). These basic steps follow similar themes which were found in studies relating to the organizational capacity for coalitions to reach underserved populations through bicycling ( 34 , 35 ). Owing to the lack of resources, literature, and understanding of the current activity promoting SRTS programming in disadvantaged communities, the first aim of this study was to understand how state SRTS leadership operates throughout the U.S. The second aim was to understand the common barriers seen when implementing SRTS programs into disadvantaged communities, as well as to understand barriers throughout the application process for funding. The third aim of this study was to understand potential desired resources and changes which should occur to make SRTS programming more equitable throughout the U.S.
Methods
Participants and Procedures
Invitations to a web-based survey (Qualtrics, Provo, UT) were distributed to participants (n = 59) via email, which were identified through the Safe Routes Partnership’s webpage ( 31 ). In states that did not have a “state SRTS representative,” similar individuals were found from the U.S. Department of Transportation Federal Highway Administration webpage ( 36 ). Participants had the title of “State SRTS Coordinator” or “TAP Coordinator” (hereinafter “SRTS coordinator” or “coordinator”). To increase response rate, invitations were distributed through our partner, the Safe Routes Partnership, a national non-profit organization advocating for the advancement of SRTS programs across the U.S. Email invitations contained a description of the study, along with a hyperlink to access the survey. Participants were required to be 18 years or older, as well as an active coordinator of SRTS programs in their state. If participants did not meet these inclusion criteria, they were asked to forward the email invitation to the correct contact person. Among states with two coordinators, surveys were sent to both (there were no instances of multiple responses from states). On opening the hyperlink to the online survey, informed consent was presented to participants. No financial compensation was given for participation in the study. The response rate for the survey was 45.8% (n = 27). After unusable incomplete data were discarded (n = 5), the final sample was 22 coordinators from different states, resulting in a completion rate of 81.4% from those who responded. The Pennsylvania State University Institutional Review Board approved this study.
Measures
The survey included ~35 questions in multiple choice, rank ordered, and open-ended format. Questions focused on the state’s SRTS leadership, the participant’s leadership background and education/experience, effectiveness of SRTS programs, participation in the SRTS Es (“Elements”), creation of equitable opportunities for high-need communities, and additional questions concerning equity throughout the state’s SRTS programs. The survey design and questions were developed with the help of online SRTS resources ( 37 ), previous studies concerning strategies to reach underserved populations ( 34 , 35 ), and consultation with SRTS staff. Participants were instructed that within this study, underserved/disadvantaged populations include, but are not limited to, communities of color, disabled children, low-income communities, rural communities, and LGBTQ+ communities.
State and SRTS Coordinator Demographics
Participants were asked which specific state their SRTS program represents. All states were then categorized into four regions (West, Northeast, South, Midwest), based on previous CDC literature ( 38 ). Participants were also asked to report their gender identity and race/ethnicity. They were then asked to report their personal background experience, education, and/or expertise related to SRTS initiatives (i.e., public health, research/academia, transportation planning, engineering [any type], legislation/policy development, education, and/or urban design).
State SRTS Leadership
Participants were then asked to indicate their SRTS employee role (State Employee, Contractor [private or non-profit], Unsure/Don’t know, or no statewide coordinator [TAP or similar]). If the participants stated they were a “State Employee,” they were asked to indicate which department they are affiliated with (Department of Health, Department of Transportation, community organization or similar, or describe another department). Participants were then asked to qualitatively describe their state’s SRTS leadership.
Program Effectiveness
Participants approximated how many schools, communities, or both, in their state have implemented SRTS in the past five years and stated how effective they believe their programs are (not effective, slightly effective, moderately effective, very effective, extremely effective). They were then asked to respond to two open-ended questions about how their state defines effectiveness in their programs, and to describe the top three best practices which make SRTS programs more effective.
Strategic Plans and Program Frameworks
Participants were asked if their state has a SRTS strategic plan for programming. If they responded “yes,” they were asked how often it is updated (every year, every 1 to 5 years, every 6 to 10 years, every 10+ years) as well as to describe the plan’s materials, strategies, and/or resources pertaining to reaching disadvantaged communities. Participants were then asked if their SRTS programs utilize and promote the 6 SRTS E Framework (engagement, engineering, equity, encouragement, education, evaluation) ( 22 ). If they did utilize this framework, they were asked to rank the Es based on what their state prioritizes the most into their programming from most (1) to least (6). After this, the participants openly answered why they prioritize their first ranked E more, and why they do not prioritize last ranked E as much. The survey then asked participants to address what resources they believe the federal government or Safe Routes Partnership should offer for their state to produce/implement a plan/framework to include equity, or to update their current plan.
Equitable Grant Application Process
Participants were asked to report how many of the applications received throughout the year for SRTS funding come from disadvantaged/underserved communities (0%–100%) and were additionally asked to report how many (0%–100%) of those applications receive funding. Participants were then asked to describe commons barriers preventing high-need communities from receiving SRTS funding, strategies employed by their state to help make the application process more equitable (e.g., training, consultants, other resources), and factors that could help high-need communities to successfully receive more grants. Participants were asked to indicate if their state provides special consideration for funding opportunities in high-need communities throughout the application process. If their state provides special consideration, they described what the special consideration process entails in their state and approximated its level of influence on the decision-making process.
Equitable SRTS Program Implementation
Participants then described what types of barriers are seen when funded SRTS programs are attempting to implement SRTS into underserved/disadvantaged populations (i.e., low-income, racial/ethnic minorities, disabled, LGBTQ+). Participants were asked to describe any current or previous resources that they provide to encourage equitable strategies for SRTS implementation, and future desired resources that should be promoted from Safe Routes Partnership or federal organizations. A definition of equitable strategies was given to participants before answering these questions: “Any strategy involved in programming to tailor or implement strategies to reach disadvantaged populations (including, but not limited to low-income, LGBTQ+ communities, communities of color, rural, disabled).”
Data Analyses
Quantitative statistical analyses were performed using SPSS Version 26.0 (Armonk, NY). Frequencies and descriptive statistics were used to characterize the sample. Qualitative analysis (Atlas.ti, Berlin, Germany) examined trends from open-ended survey questions and key illustrative quotes were added throughout the manuscript’s results to provide a more in-depth insight into the suggested results.
Results
It is important to note that throughout this section of the manuscript, the results (quantitative and qualitative) are based on representative’s personal narrative and understanding of the state’s successes and barriers in SRTS programming.
State and SRTS Coordinator Demographics
Geographically dispersed SRTS coordinators (n = 22) represented 22 out of the 51 United States (including Washington, D.C.). Most states represented in the sample were found in the Western region (31.8%; n = 7) of the United States; however, participants were geographically dispersed among regions: Midwest (27.3%; n = 6), Northeast (22.7%; n = 5); and South (18.2%; n = 4). Table 1 shows the complete frequencies of participant and state demographics. The majority of SRTS coordinators who responded to the survey were women and predominately white. Additionally, the majority of coordinators had background experience, education, or expertise in transportation planning, education, or both.
Safe Routes to School (SRTS) Coordinator Demographics, Background Experience, Education, Expertise, and Type
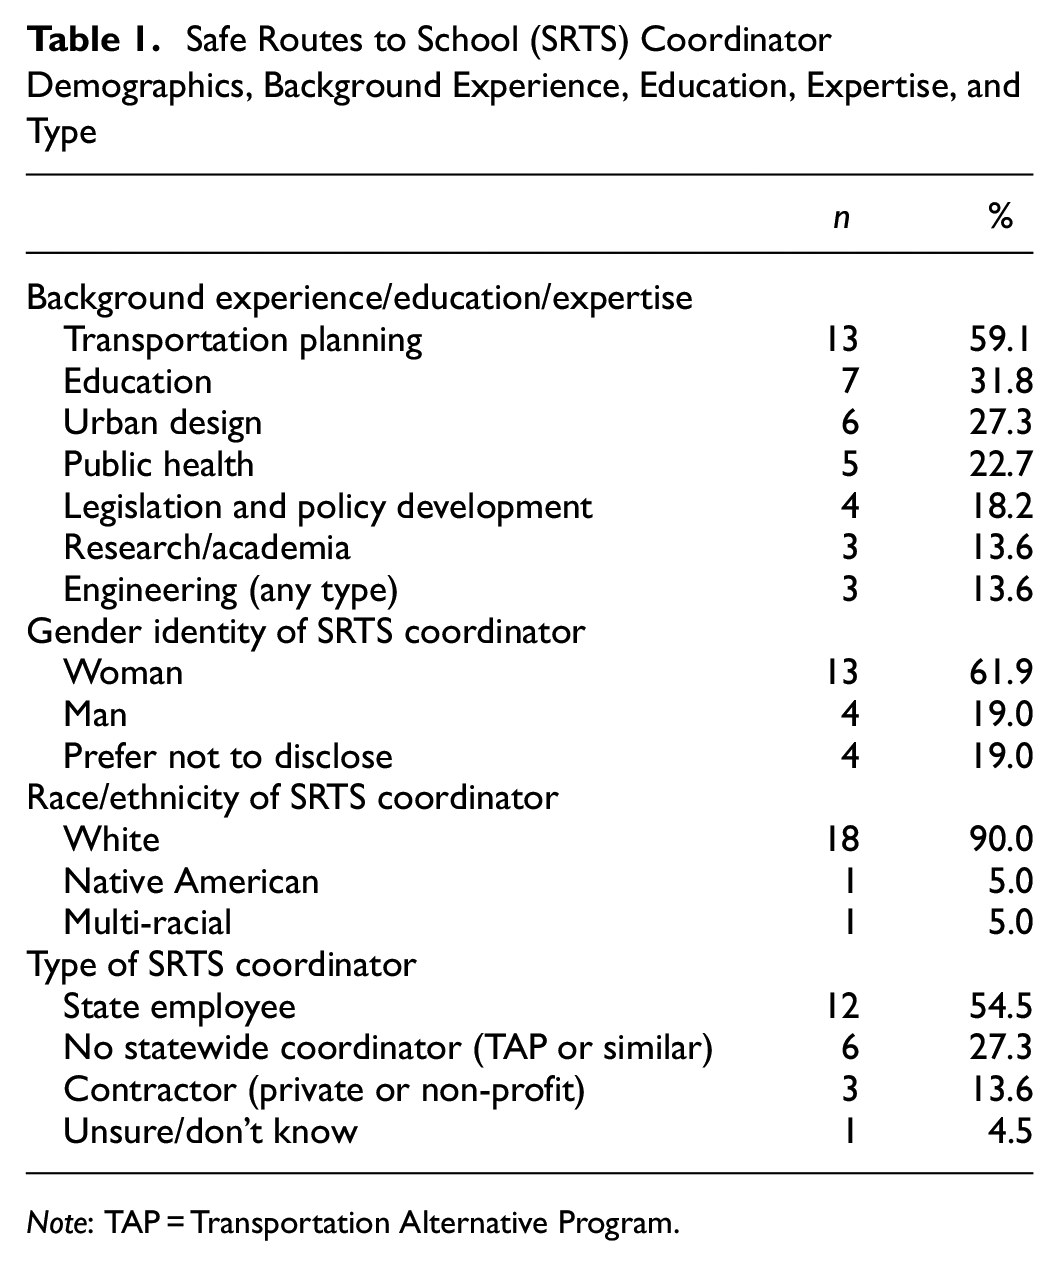
Note: TAP = Transportation Alternative Program.
State SRTS Leadership
The majority of coordinators were state employees, and all of these individuals were located in the State’s Department of Transportation. On average, there were 6.26 (SD = 7.24, Min = 1, Max = 30) people in the state’s SRTS leadership. Full frequencies of type of SRTS coordinators can be found in Table 1.
SRTS leadership varied differently from state to state, however, many states brought together a “committee” which met frequently to speak about SRTS programming. One coordinator stated that the “[Committee] combines the expertise of multiple state agencies with national/local partners to provide the resources needed, and includes members representing cities and counties, regional planning organizations, non-profit organizations, educators and health professionals, and statewide agencies and organizations” (Midwest), as well as another stating that the “SRTS coordinator is also the Bike/Ped coordinator and the Transportation Alternatives Manager at the state” (Midwest). A state from the southern region of the U.S. described a unique SRTS leadership team, stating that they have one state SRTS leader for the whole state, and then have “divvied [the state] up into 7 districts” and “one of the bike/ped members in each [district’s] Safety Office covers SRTS” throughout that specific district. Additional illustrative quotes describing state’s SRTS leadership can be found in Table 2.
Additional Safe Routes to School (SRTS) Illustrative Quotes Concerning Program Leadership and Effectiveness
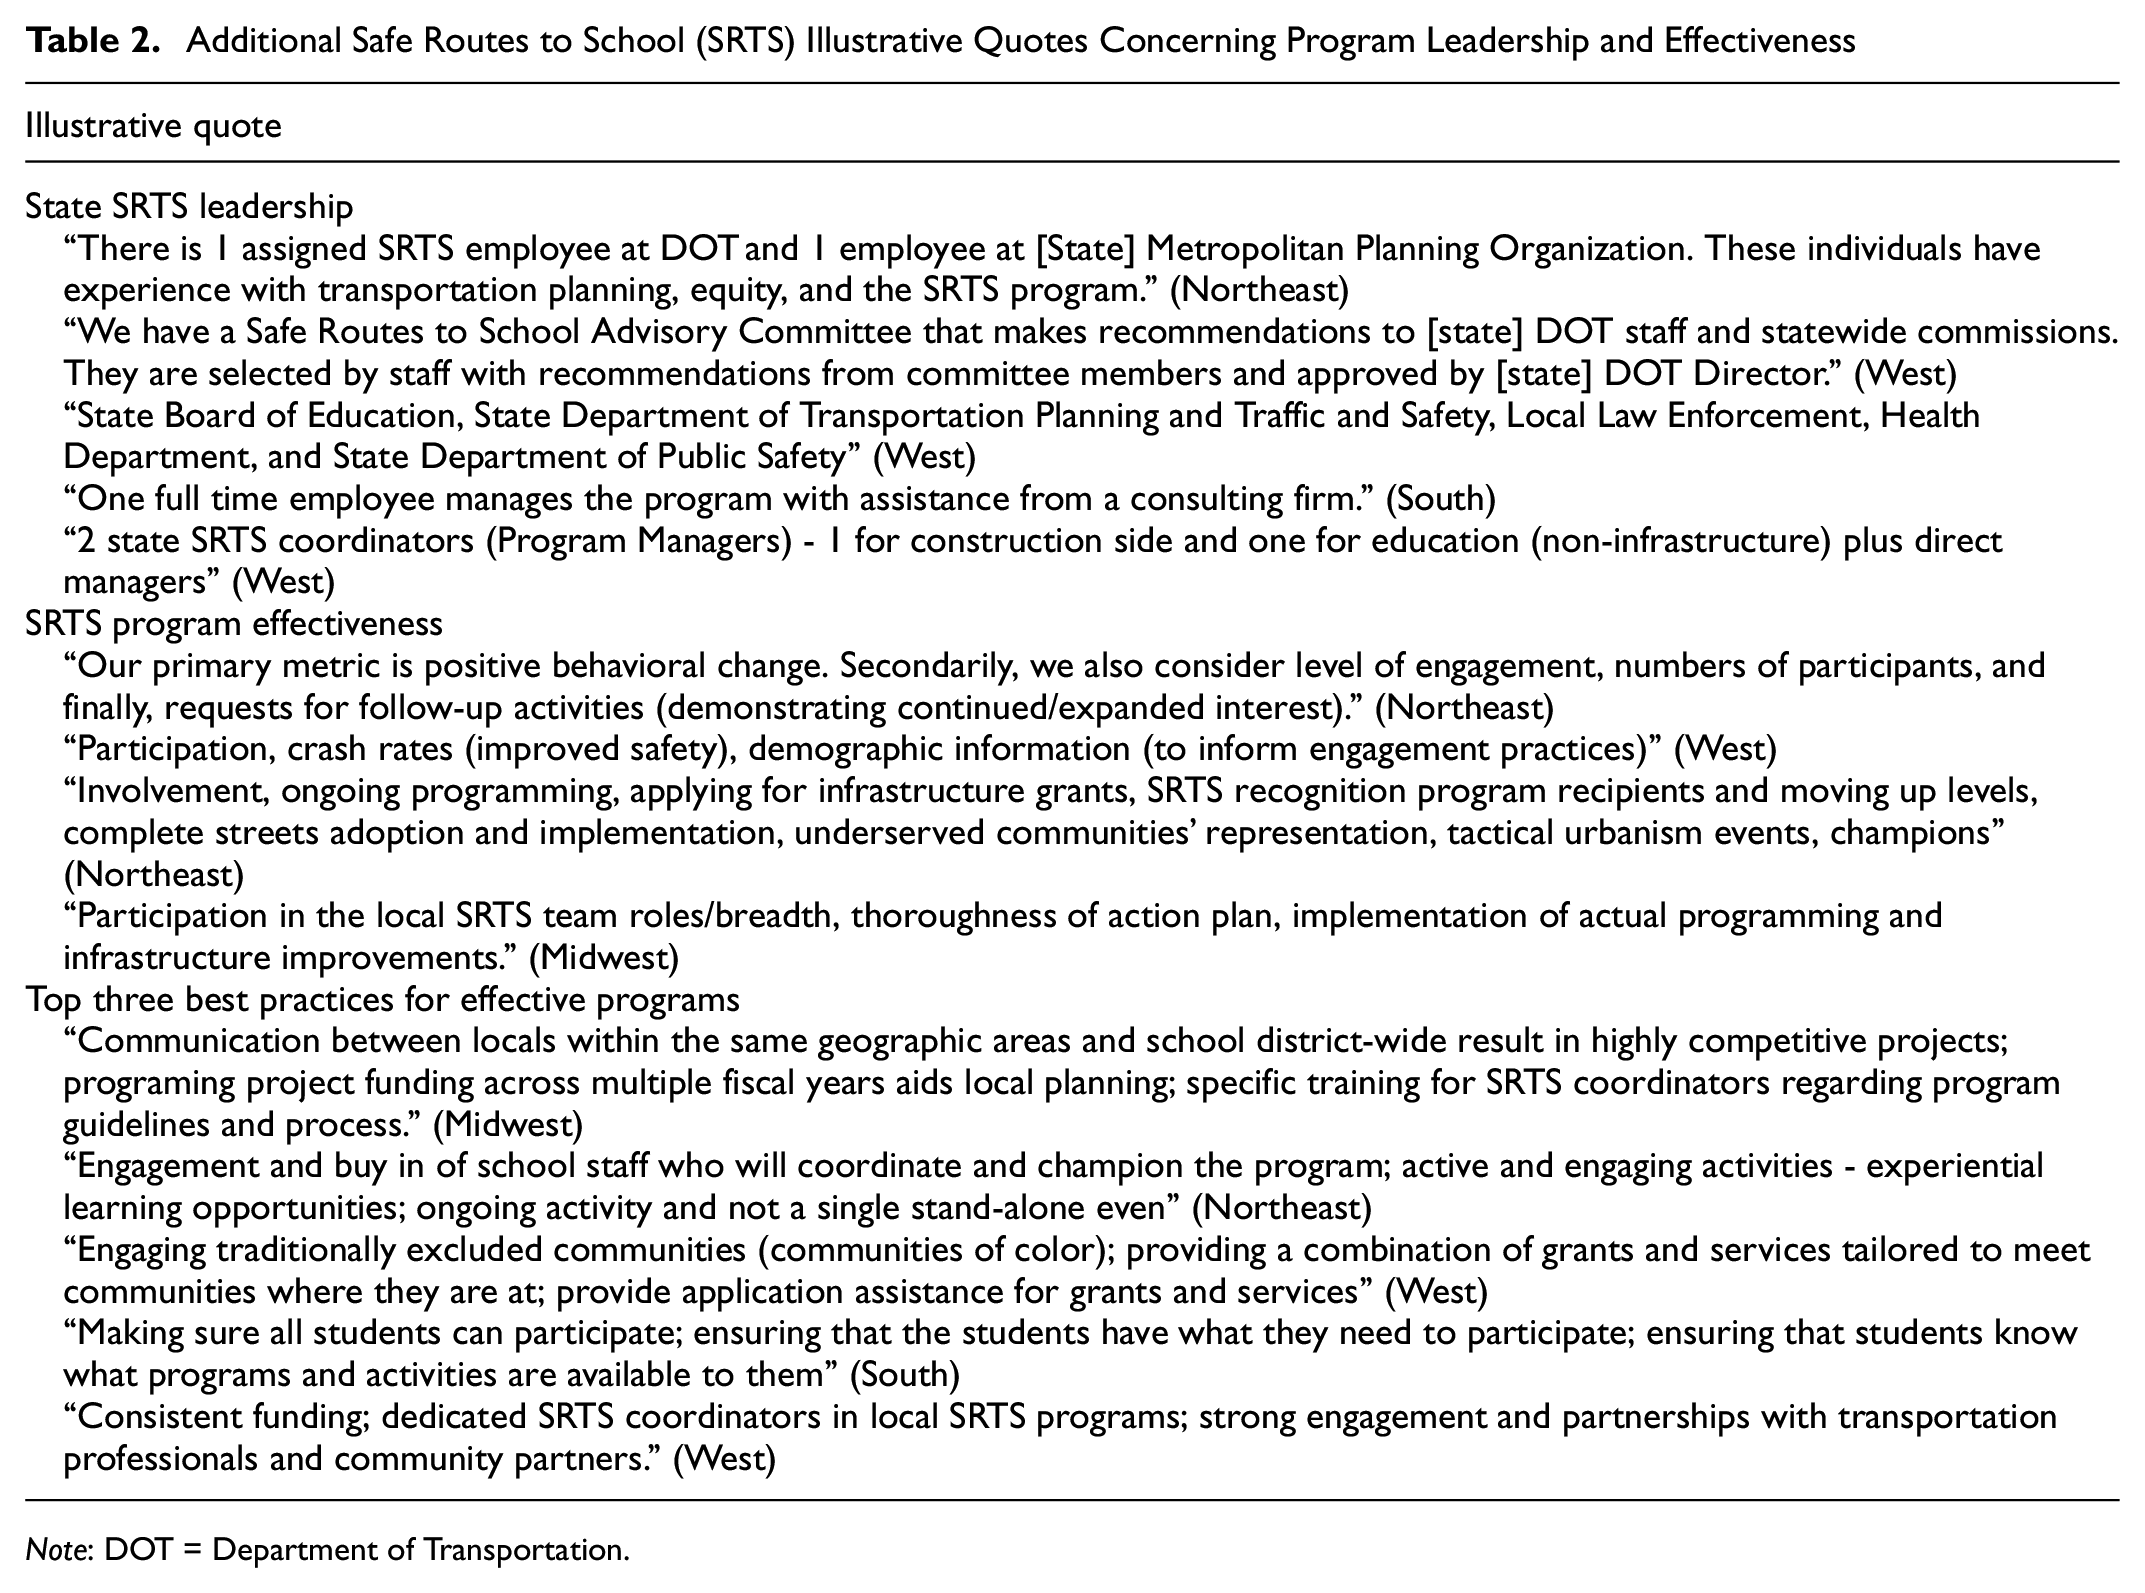
Note: DOT = Department of Transportation.
Program Effectiveness
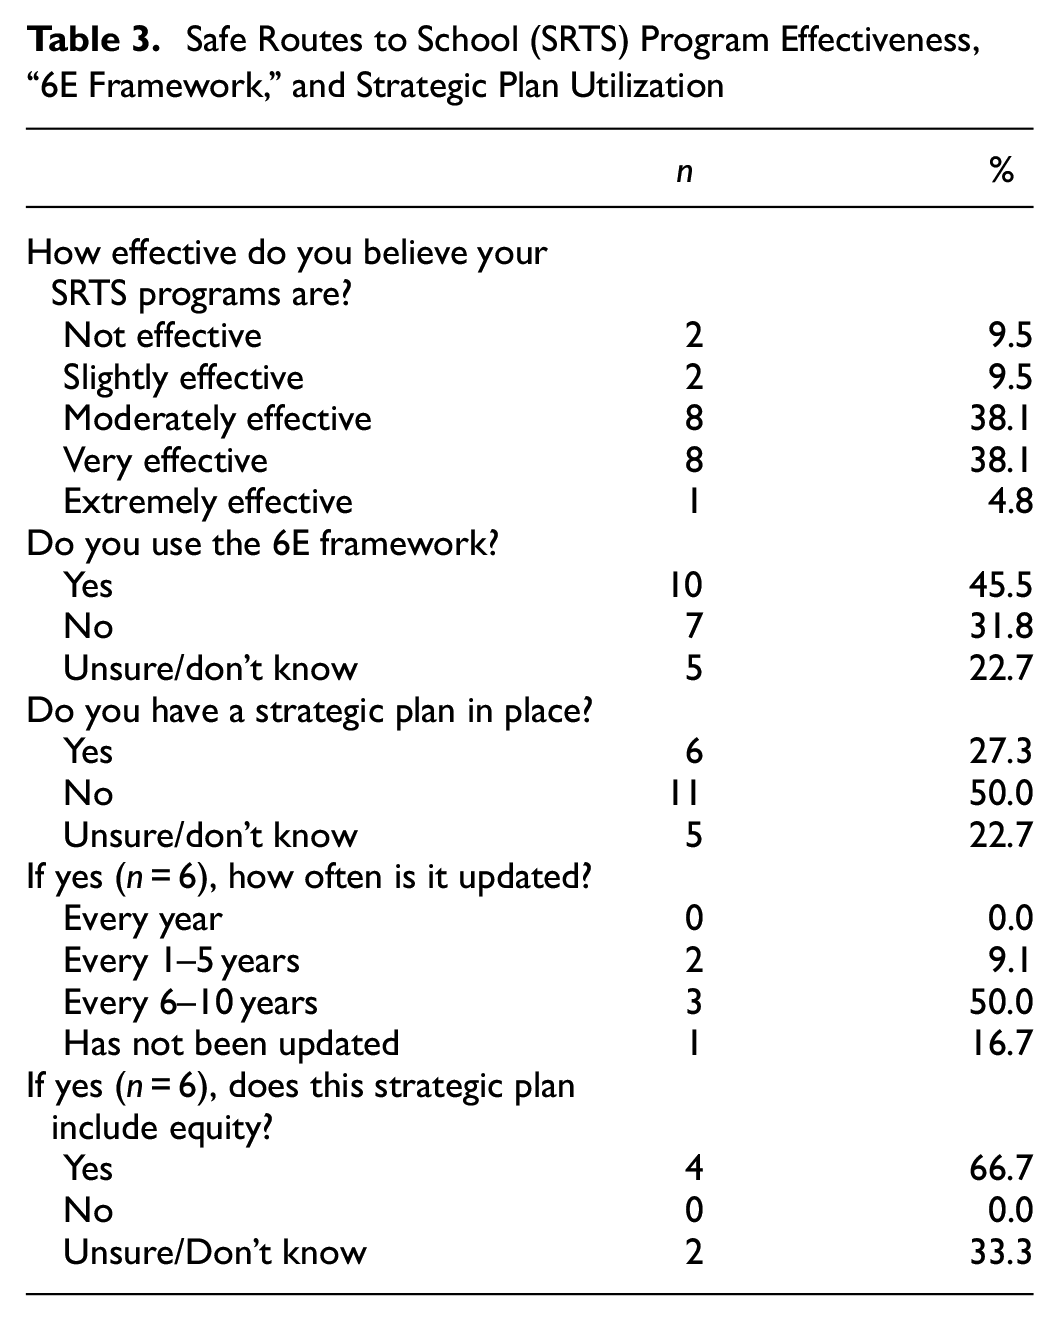
Participants estimated that during a year of programming, there were on average 128.83 (SD = 158.63, Min = 10, Max = 500) schools participating in SRTS programs throughout their respective states. The majority of coordinators stated that they believed their SRTS programs were moderately effective (38.1%; n = 8) or very effective (38.1%; n = 8) (Table 3).
Safe Routes to School (SRTS) Program Effectiveness, “6E Framework,” and Strategic Plan Utilization
Definitions and measurements of program effectiveness varied tremendously from state to state; however, many states indicated that increased participation/involvement in programs was a criterion used to measure effectiveness. One state vaguely defined effectiveness in their state as “increased safety, increased behavior, participation” (Midwest), whereas other states defined the criterion of program effectiveness in more detail; stating that they look at overall “project planning/local support, connectivity, utility and overall benefit; including safety improvements, environmental justice, historic impacts, and economic development” (West) and “relative participation/funding that reaches priority populations, number of schools actively participating, number of available resources/trainings, number of people who have access to those resources/trainings, mode split of students walking and biking to school, percent of schools or school districts with a dedicated SRTS coordinator, or awareness and support” (Midwest). Besides participation measures, a Western state “looks at the qualitative data to help tell a story of the programs,” while another state “reviews crash data before, during and even after programs” (South).
Participants described a wide variety of best practices/strategies for successful and effective SRTS programs. A Northeast state described the top three best practices for effectiveness to be “partnerships; funding; and local/regional coordinators.” Another state described best practices as being “building capacity at each school and at the district level so that program is supported, managed, and promoted with a goal of institutionalizing SRTS; improving the environment through built environment enhancements; addressing behaviors and creating behavior change around active transporting to school” (West), while a Midwestern state described more collaborative and evaluative practices, stating their top three best practices as “community inclusion in decision making; engagement at all levels during project implementation; project status monitoring and compliance reviews.” Another state elaborated on why program “buy in” from schools and communities is important by saying “if the school administration is not on board, the program or project will not be successful” and “we need the support of the neighborhood where students will be biking and walking” (South). Additional illustrative quotes for SRTS program effectives can be found in Table 2.
Strategic Plans and Program Frameworks
Most participants stated that their SRTS leadership does not have/follow a strategic plan (50.0%; n = 11), while only 27.3% (n = 6) of states do incorporate a strategic plan for their SRTS programming. Of those six states, half of the strategic plans are updated every 6 to 10 years (50.0%; n = 3), and additionally the majority of plans incorporate equity (66.7%; n = 4). One state coordinator describing increased efforts to reach underserved populations throughout all of their SRTS, stating that the “plan includes strategies and actions to better understand and reduce SRTS disparities by focusing resources where the need is greatest, including prioritizing funding and support for communities that have experienced historic disinvestment” (Midwest). Another State’s strategic plan emphasizes equitable outcomes by providing “recommendations which focus on specific communities with higher needs” (South). Complete strategic plan frequencies can be found in Table 3.
Less than half of the participants stated that their SRTS programs follow the Safe Routes Partnerships’“6E Framework” (45.5%; n = 10), a framework which attempts to incorporate the key components of AT promotion through engagement, equity, engineering, encouragement, education, and evaluation. Within those states (n = 10) that do utilize the 6E framework, coordinators ranked “engagement” as the highest prioritized “E,” giving it an average rank of 2.2/6 (SD = 1.4), followed by education being the second highest prioritized with an average ranking of 2.7/6 (SD = 1.7). Equity came in at third, receiving an average ranking of 3.2/6 (SD = 1.1) and only 20% (n = 2) of states ranked equity in its top two most prioritized Es. Full frequencies of states utilizing the “6E Framework” can be found in Table 3, and descriptive statistics and frequencies of the “6E Framework” ranking can be found in Table 4.
Mean Rankings of State’s Prioritization of the 6E Framework
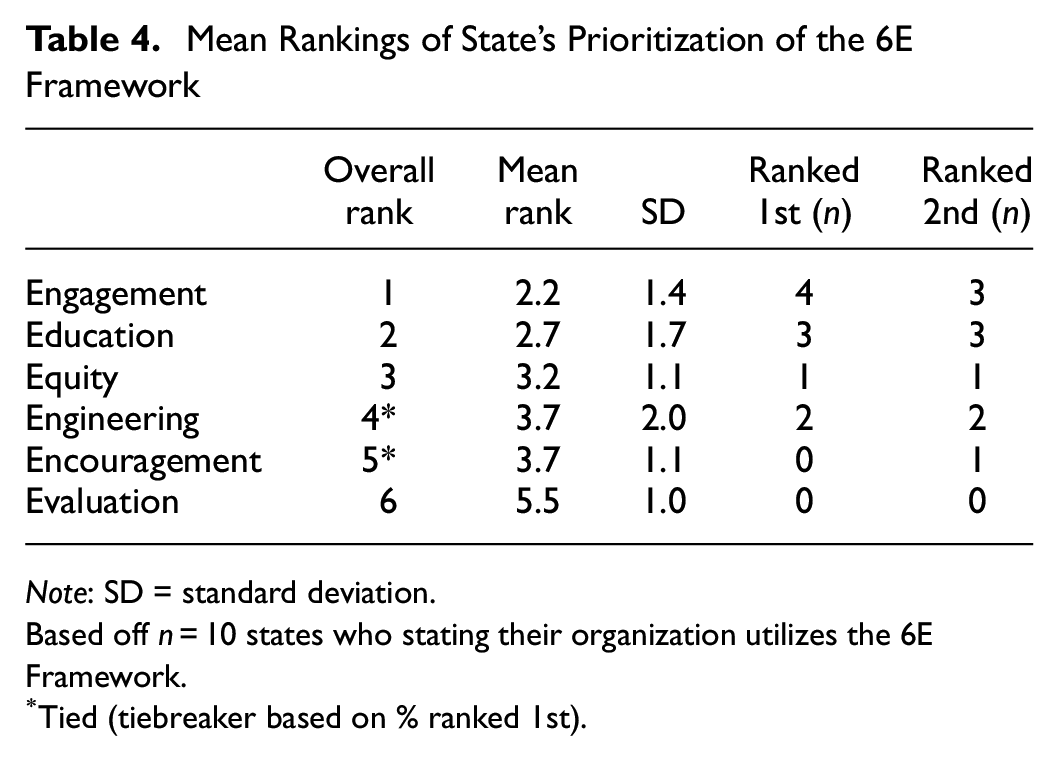
Note: SD = standard deviation.
Based off n = 10 states who stating their organization utilizes the 6E Framework.
Tied (tiebreaker based on % ranked 1st).
While analyzing the reasoning behind prioritization of states who utilize the “6 E Framework,” the sole state which ranked equity as the highest priority (1st) in their state described their reasoning to be “to ensure that those that are most vulnerable have access to safe and convenient walking/bicycling” (Midwest). One state described their prioritization of “engineering” as simply as “we are a State Department of Transportation” (Northeast). The most prioritized E, engagement, was described as the most important owing to the importance of community and school buy in. One state saying that engagement “is the backbone of our action planning process and programming, and to have an effective local SRTS team, communities need to practice effective community engagement” (Midwest), while another Midwest state saying that “SRTS projects require local buy in to be truly successful. Beyond the sponsor, the involvement of additional local stakeholders (parents, teachers, faculty, students, neighbors, law enforcement) are critical to the maintenance and improvement of local SRTS programs.”
Additionally, many states ranked evaluation as their least prioritized “E,” owing to the hardships of retrieving quality data. States describing this hardship as it is “difficult to pin point exact metrics especially increased safety and education which are subjective and not as accurate” (Northeast), there is “not enough staff to implement it [evaluation] unless it is required” (Northeast), and another state saying that the “problem is that we don’t always have good data as our starting point, so it is difficult to determine how much the needle has moved” (Northeast). Those participants ranking engineering as the state’s least prioritized “E” lack the resources to construct infrastructure, or similar infrastructure projects may be wrapped up into other state programs instead of SRTS. One participant saying that “while some projects have been classified as SRTS infrastructure projects (sidewalks construction, etc.) . . . [the state] traditionally has treated these types of projects as separate due to the nature of the work” (Midwest). Another state speaking to the lack of resources says that “we have never gone that big on a [engineering] project due to community buy in and funding, and seldom are engineers ever involved” (West).
Participants provided valued responses concerning potential national resources which would increase their ability to incorporate equity into their SRTS framework and strategic plans. Many participants are looking for resources, with one state emphasizing that there is a need for “tangible ways communities can implement Es with an equity lens, from planning to program implementation. Less about why equity and more about how equity” (Midwest). Other coordinators stated that they desire resources which provide “effective ways to measure and evaluate equity” (South), “a framework to define, measure, and promote equity across the nation, along with justification for resource allocation according to that framework” (Midwest), and one coordinator speaking to the amplification of the transportation justice narrative in SRTS, stating that national organizations should “[further] the conversation around the inequity of transportation and housing policy, or creating funding to mend the [inequitable] gaps that the interstate highway system created in communities (West). Additional illustrative quotes concerning desired resources for implementing equity into frameworks/strategic plans can be found in Table 5.
Additional Illustrative Quotes Concerning the 6E Framework and Strategic Plans
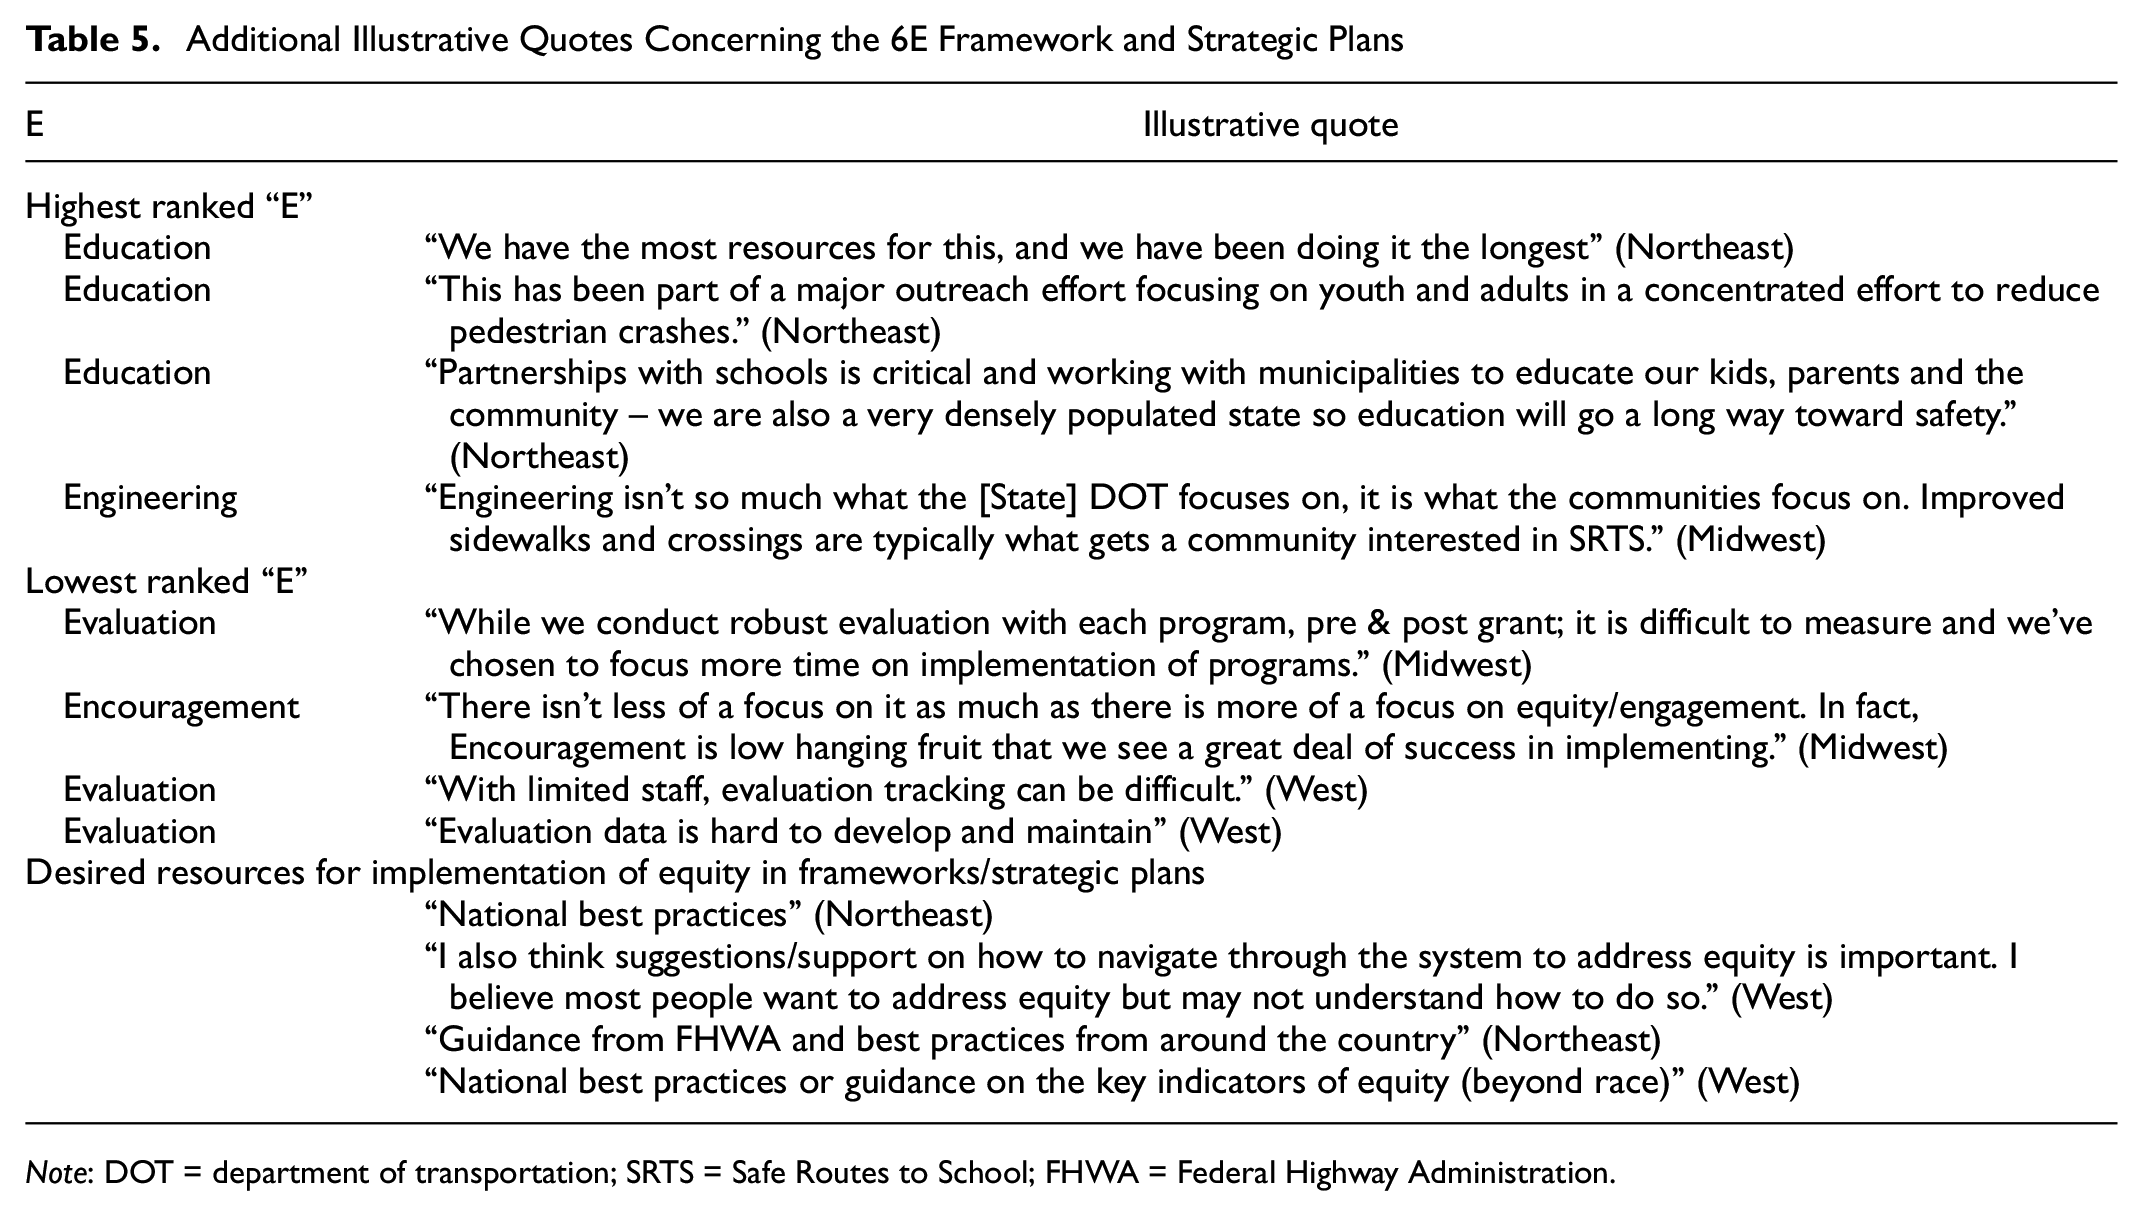
Note: DOT = department of transportation; SRTS = Safe Routes to School; FHWA = Federal Highway Administration.
Equitable Grant Application Process
On average, coordinators reported that 50.50% (SD = 25.33) of all grant applications come from disadvantaged or undeserved communities, and that roughly 61.56% (SD = 24.73) of those grants are actually funded. States noted many barriers to why disadvantaged communities were not applying for grant applications, with multiple speaking to the “match for federal funding requirement” (West), where communities are required to match roughly 20% of all funding to implement both infrastructure and non-infrastructure SRTS programs. Other participants spoke of the lack of resources and personnel in disadvantaged communities, stating that “many of these municipalities are understaffed and therefore struggle to develop viable application” (Northeast), “lack of resources and/or manpower” (South), and “lack of resources to apply like a grant writer and capacity to run a grant” (West). In addition, one coordinator stated that “they [disadvantaged communities] may not even know what is available or how to apply for it” (South).
Although there are continued barriers seen when disadvantaged communities are attempting to receive funding for SRTS programs, some states do provide resources in an attempt to make the application process more equitable. One state said that they “provide training every year” and that “district staff are available to help with projects/programs” (South). Other coordinators described more in-depth efforts to making the process more equitable, stating that they “provide grant consultations to all those interested, provide overview session of the grant, provide a comprehensive grant instruction manual with step by step help and examples, and aim to simplify the grant application every year” (West), while another state’s regional offices “offer assistance for application coordination planning… recorded workshops, and also try to travel to do these application workshops in underserved communities” (West). Other states say they are currently working on processes and resources to make this happen, however, noting that “we could be doing better” (Midwest).
Besides resources and consultations for applications, some states also provide special consideration for the disadvantaged communities which do apply. States that do provide special consideration made up 63.6% (n = 14) of all survey participants, 18.2% (n = 4) reported that they do not provide special consideration, and 18.2% (n = 4) were unsure or didn’t know. Of those states who did report providing special consideration, some described this process simply as “projects are ranked on need, underserved population receive a heavier weight than others” (Midwest) or “we give special consideration to rural and low-income areas that demonstrate a high need due to crumbling or non-existent infrastructure that compromises safety” (South). Other states were more in-depth with their scoring methodology, describing that disadvantaged community applications “currently account for 30 to 40 % of the application points” (Midwest), “the special need element figures out to be able 20% of the consideration” (Northeast), or that the “area’s equity scores for up to 3 points out of 33 for the total project score” (West). Throughout the responses, there is no evidence concerning a standardized measure for weighing applications based on need for disadvantaged or underserved populations.
Participants noted various national resources which would encourage high-need communities to applying and receiving grants for SRTS projects. Many of the states spoke for elimination of matching federal funds and the “availability of more money” (Northeast, South, West). Other coordinators advocated for more resources, stating that there should be “consultants externally paid for by the state that can work with the community so that the community doesn’t have to come up with resources on their own” (West), and similarly, “someone else [should be] writing the grants on behalf of the community, to help navigate the complex system” (West). Another stated that there should be an “automatic [funding] selection based on interest and % of priority population” (Midwest). Additional illustrative quotes concerning equitable grant application process can be found in Table 6.
Additional Illustrative Quotes Concerning Equitable Application and Implementation Processes
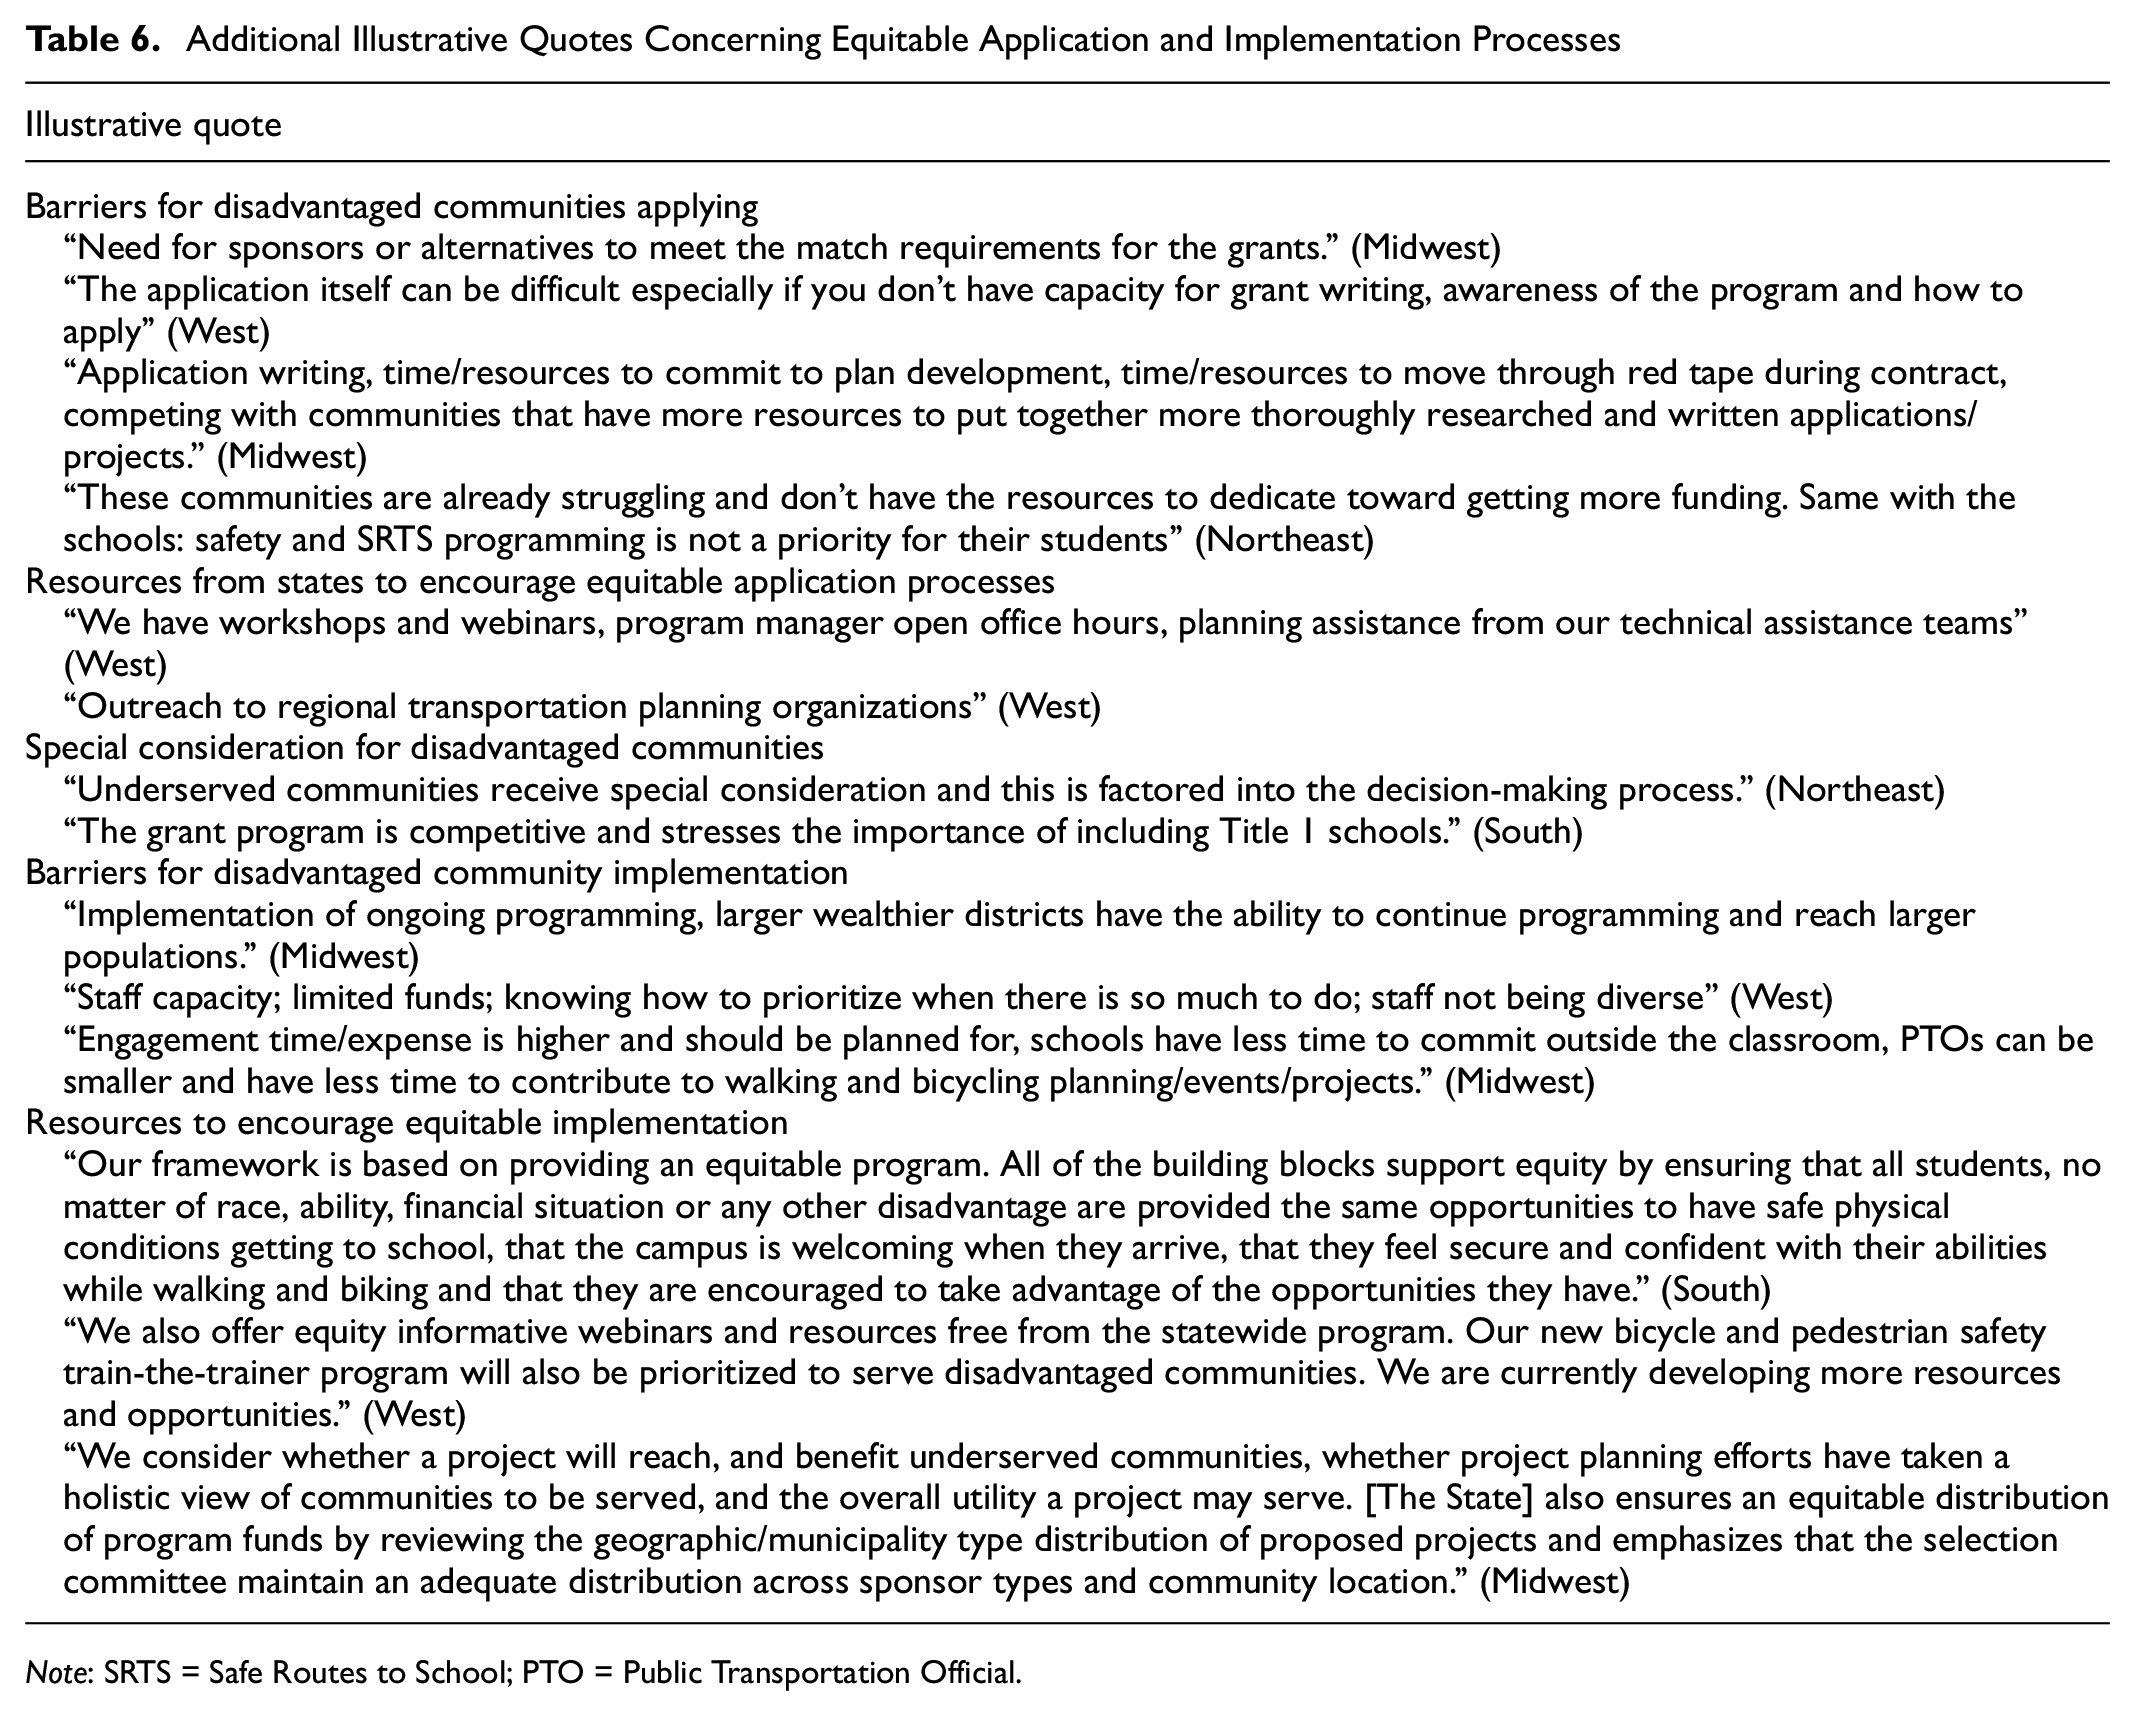
Note: SRTS = Safe Routes to School; PTO = Public Transportation Official.
Equitable SRTS Program Implementation
SRTS state coordinators additionally expressed various barriers to implementation after grants had been issues to disadvantaged communities. States spoke to the issues of staff and funds, saying that there are issues “having the people to implement the programs” (South). Other states emphasized that the prioritization of SRTS may be overlooked by other issues of the community, as well as cultural and social tensions that may play a role in unsuccessful implementation. One coordinator stated that “many other cultural/social issues take priority over SRTS programming” and that there are “language barriers and trust issues” (West), and another bringing up the political divide throughout their state, saying that “the political divisive nature of working with the underserved populations in a right-learning state,” emphasizing that “we are happy and proud to work with underserved populations but we do not openly admit that as a goal” (Midwest). Another coordinator brought up additional inequities for community engagement in disadvantaged communities, stating that “we also perceive a challenge with information delivery not always being in alignment with overcoming barriers, such as when a public meeting is scheduled for 6:30pm but the public transit ceases operations at 6:00pm” (Northeast).
Although there were many barriers seen to implementations of SRTS programs in disadvantaged communities, states expressed some resources they provide to encourage more equitable implementation of programs. A couple of states mentioned their emphasis on reaching non-native English speakers and children with disabilities, stating that “public facing [encouragement] materials are translated, and events include students with disabilities” (Midwest). Another coordinator stated that they have “created a host of white-papers on SRTS & Students with disabilities on their website and targeted mini-grant (program) funds to schools that specifically work with students with disabilities” (Midwest). Other coordinators expressed their equitable capacity building processes, by making sure that “1/3 of our advisory committee are people of color, and we are currently doing an equity power analysis to determine [the] best course of action for next steps in engaging communities” (West).
In addition to the resources that are already being provided to disadvantaged communities to encourage equitable implementation techniques, state coordinators expressed the desire for more resources to provide smoother, more equitable SRTS implementation. Many states described the need for additional consultation, and other coordinators expressed the desire for “on-going technical assistance to any community, webinar, resource development, compilation of resources on website, and newsletter in both English and Spanish” (West), while another noting the importance for additional “research and programming resources/suggestions to meet the needs of various populations” (Midwest). In addition to these resources, coordinators spoke to the push for partnerships among community organizations. One coordinator stating the importance for resources to encourage “community partnerships with local businesses, resources centers, guidance/manuals” (Midwest) and another speaking to the need for “grant writers, public health partners to help with evaluation, and partners that can help with engagement” (West). Additional illustrative quotes concerning the equitable implementation of SRTS programs can be found in Table 6.
Discussion
SRTS programs throughout the U.S. have the potential to create long-lasting health benefits and positive habitual AT behavior in children, regardless of race/ethnicity, income, or other demographics. Although existing literature has described best practices for implementing SRTS programs into schools, there is a lack of research on strategies by which SRTS programs can create equitable accessibility to funding and programming resources. One of the only equitable guides, created in 2010, described simple tips and tricks to engaging with low-income populations ( 33 ). The current study fills a major gap in the literature concerning the state SRTS leadership’s structure, common barriers seen in disadvantaged communities, and highly desired resources for states to increase equitable efforts in SRTS programs in the future.
One of the major reported barriers preventing disadvantaged communities from applying to receive SRTS program funding was the lack of grant writers or people qualified to run these programs. States should investigate ways of investing time and money into hiring grant-writing consultants for communities who require it. States also reported various levels of special consideration for high-need communities throughout the application process. To create a fair and just system, states and federal entities may find it beneficial to create an application process which is the same from state to state. Moreover, disadvantaged communities may also not even be aware of such funding. In this case, state departments should attempt to identify disadvantaged and high-need communities through public census data (e.g., income, health indicators, transportation behaviors, etc.), and even the utilization of GIS (geographic information systems, to identify those communities who see significant disparities.
Another major barrier seen in these populations is the match requirement, where communities are required to pay (typically around 20%) of the entire funding for the SRTS program. Depending on the project type (infrastructure or non-infrastructure), these match funds could be a substantial amount of money for a disadvantaged or low-income district. Federal and state legislators should attempt to initiate ways in which this match funding is lowered, reimbursed by state departments, or eliminated altogether. In addition, states may also decide to promote or implement more non-infrastructure-related SRTS projects, owing to them being substantially lower-cost to implement and having shown to be just as effective in increasing AT participation and safety ( 28 , 39 – 45 ).
SRTS coordinators also elaborated on barriers to program implementation in disadvantaged communities. Engagement, limited outside funds, and lack of staff/parent capacity were noted as common barriers. Additional social and cultural inequities were also noted as issues concerning implementation. After a community receives funding, it may be difficult for community members, parents, or both, to invest time and effort into after school activities owing to parents working multiple jobs and inequitable transportation options (transit closing earlier than meeting times). To perform equitable development of a community, states and SRTS leaders should promote resources on how to engage communities and conduct community needs assessments. Leaders can start by utilizing community engagement tools referenced by the Safe Routes Partnership. The guide “Let’s Get Together: A Guide for Engaging Communities and Creating Change” encourages the dedication of community engagement within community partners by providing strategies to “reflect, research, partner, plan, implement, and sustain” to create successful programs ( 46 ). Community assessments tools from similar AT-related projects, such as Complete Streets which attempt to build multimodal infrastructure, may also be utilized to understand the effects and benefits of AT-promotive programming. Their tool “Benefits of Complete Streets Tool” helps communities measure the benefits of impact from Complete Streets initiatives by utilizing safety, health, environmental, and economic measurements ( 47 ). These assessments may initiate conversation through community engagement, while additionally increasing the equitable capacity for engagement, by understanding the needs of the community before implementing parts of the process: meetings, walking days, events, and so forth.
Although these findings contribute to a substantial gap in the literature, this study does not come without limitations. First, the survey responses were voluntary and may reflect selection bias. Comparatively, responses come entirely for the representative’s perspective and knowledge, which may be biased toward their states effectiveness, which may skew results to more favorable outcomes. Additionally, as the responses came from one individual, their views may not reflect the entire state SRTS leaderships operations. Although the sample was geographically dispersed, it may not be generalizable to the entire U.S. SRTS leadership. As this is the first time this questionnaire has been used within a study, the reliability and validity of the questions is unknown and will require future studies to analyze these measures.
Future research should attempt to compare state SRTS leaderships, operations, and programs to understand the differences in effective implementation between advantaged and disadvantaged communities, while also identifying the percentage or schools where SRTS are implemented, based on demographics. Relatedly, future researchers and public health officials should attempt to involve various other parties necessary for affecting health equity, including, but not limited to state/regional/local stakeholders, political leaders, funders, and those individuals recognized as “disadvantaged” or “high need.” In doing so, researchers can better understand the needs and desires of these populations, along with the best way to implement and promote SRTS programming within these environments. Additionally, researchers should invest time into conducting qualitative interviews with state representatives to identify barriers and desired tools more in-depth, to have the opportunity to create actionable and sustainable strategies for equitable SRTS programs.
Overall, this study suggests significant variability of equitable efforts from state to state, and that equitable frameworks and standard application cycles may be lacking from federally funded SRTS programs. Many resources by SRTS leaders and the federal government should be invested in to increase equitable opportunities, including training/education materials concerning how to successfully reach disadvantaged populations, strategies to improve overall funding mechanisms toward these initiatives, and the implementation of individuals with public health backgrounds, to initiate sustainable programs fostered on the social determinants of health. Creating guides to community needs assessments, program evaluation, alternative funding mechanisms, and toolkits containing best practices for reaching disadvantaged communities could improve the capacity to reach disadvantaged populations through SRTS programs.
Footnotes
Acknowledgements
The authors would like to thank and acknowledge the participation of the SRTS coordinators who participated in this study.
Author Contributions
The authors confirm contribution to the paper as follows: study conception and design: LDE, ML, LSR, MBose, LMH & MBopp; data collection: LDE, ML, MBopp; analysis and interpretation of results: LDE & MBopp; draft manuscript preparation: LDE, ML, LSR, MBopp. All authors reviewed the results and approved the final version of the manuscript.
Declaration of Conflicting Interests
The authors declared no potential conflicts of interest with respect to the research, authorship, and/or publication of this article.
Funding
The authors received no financial support for the research, authorship, and/or publication of this article.