
Abstract
This paper develops a simple asphalt pavement field aging model using IDEAL-CT data from 24 field sections from seven field projects that were monitored for 1–4 years each. Field distress surveys were conducted, and field cores were procured and tested in the laboratory approximately every 12 months for each field section. The model predicts IDEAL-CT parameter l75/m75 (mm2/kN) from the post-peak load–displacement curve. An R2 of 0.91 was achieved when comparing predicted values to measured values indicating that this ratio behaves predictably with field aging. A good correlation is also seen between this ratio and measured field cracking data, making it an excellent candidate for evaluating pavement cracking performance with field aging. This simple model has promising potential use cases including as a tool for mix design, pavement monitoring, and pavement forensics.
Keywords
The indirect tension asphalt cracking test (IDEAL-CT) developed by Zhou et al. is a simple test procedure that measures the intermediate-temperature cracking resistance of asphalt mixtures ( 1 , 2 ). This test has gained popularity in the pavement community owing to its ease of use, low-cost testing equipment, and informative test results. The test is typically run on 150 mm diameter by 62 mm height specimens prepared to a target 7 ± 0.5% air void (AV) content and requires no cutting or notching. The test can also be run on thinner field core specimens and corrected for thickness; however, the test equation in ASTM D8225 does not correct for AV content ( 3 ).
The IDEAL-CT cracking tolerance index (CTindex) combines several parameters to calculate the index value, including the fracture energy ( Gf ), the post-peak displacement at 75% of the peak load (l75), the absolute value of the post-peak slope (m75), and the specimen dimensions. Yin et al. developed a CTindex interaction diagram to evaluate the effects of binder modification on mixture performance ( 4 , 5 ). The diagram puts Gf on the y-axis and the l75/m75 ratio on the x-axis. Gf is a toughness parameter and the l75/m75 ratio gives an indication of the flexibility of the asphalt mixture. The study noted that using this interaction diagram can give more information than relying solely on the index value.
This interaction diagram was further utilized by Leavitt et al. to evaluate the effects of laboratory aging on asphalt mixtures ( 6 ). In this study it was found that the Gf remains relatively constant with oven aging whereas the l75/m75 ratio decreases. Other studies have also shown that the Gf from asphalt cracking tests is less sensitive to aging ( 7 – 9 ). In all cases evaluated from this study and from relevant literature, the l75/m75 ratio decreased with increased laboratory aging ( 6 ). This causes the CTindex to be sensitive to aging; however, looking at the Gf−l75/m75 interaction diagram is more informative in understanding mixture performance. In fact, evaluating the l75/m75 ratio alone may be more informative when investigating mixture aging and associated embrittlement ( 6 ).
Aging of asphalt pavements in the field is commonly reported as time in service; however, the climate where the pavement is placed also influences aging ( 10 ). To account for climate, a cumulative degree-day (CDD) parameter was developed in NCHRP project 09-52 ( 11 ). This parameter sums the daily in-service ambient maximum temperatures above freezing for a given location based on information collected at nearby weather stations and reported online (Equation 1). This parameter is better than simply measuring time in-service as it helps account for performance differences when evaluating mixtures across different climates.

where Tdmax = daily maximum temperature, °F.
CDD was found to correlate with resilient modulus stiffness (MR), the Hamburg wheel tracking test rutting, and the binder parameter G* from the dynamic shear rheometer ( 11 – 14 ). The CDD MR correlation was further verified in NCHRP project 09-52A using field projects in Iowa, South Dakota, Wyoming, Indiana, New Mexico, and two projects in Texas ( 15 ). The strongest correlation was seen when mixtures were separated into two groups: warmer climates below the fortieth parallel (Indiana, New Mexico, and Texas) and colder climates above the fortieth parallel (Iowa, South Dakota, Wyoming).
The CDD was further utilized by Chen et al. to evaluate ties between laboratory and field aging ( 16 ). In this study over 80 field sections were evaluated to determine at what age top-down cracking initiates. It was found that top-down cracking typically initiated after 70,000 CDD.
In this study the relationship between CDD and the l75/m75 ratio was explored based on field and laboratory data. A model was developed to predict l75/m75 with field aging and tied to pavement performance.
Materials and Methods
Materials
All materials evaluated in this study were part of a balanced mix design (BMD) implementation effort for the Texas Department of Transportation (TxDOT). Data were analyzed from seven distinct field projects totaling 24 different mixtures in various climates across Texas. Figure 1 shows the general locations of the various projects. The asphalt mixtures placed as surface layers included dense graded and Superpave mixtures ( 17 , 18 ) with various warm mix additives, antistripping agents, and binder contents. Only the surface layer was evaluated in this study, while pavement structure and traffic levels varied between projects. Traffic loading was evaluated as a possible determining factor when developing the model; however, lower prediction accuracy was observed, and thus this factor was removed. For the purposes of this study, it was assumed that all pavement structures were designed to meet the corresponding level of traffic, thus allowing for comparison of surface layers between projects with differing pavement structures and traffic levels.
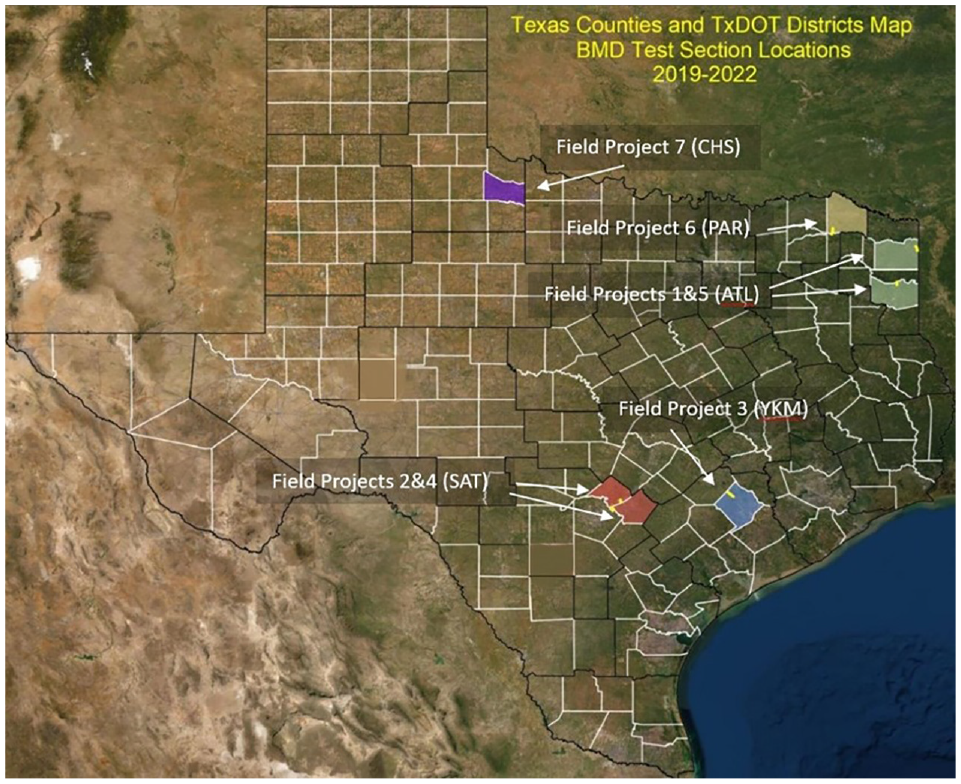
Field project locations.
Virgin mixtures, typical reclaimed asphalt pavement (RAP) mixtures, and moderate RAP mixtures with respect to RAP content were evaluated. The mixtures were defined as follows: virgin mixtures contained no recycled materials, typical mixtures contained 10%–19% RAP, and moderate RAP mixtures contained 20%–30% RAP. The RAP was fractionated for all projects, and the recovered RAP binder performance grade (PG) ranged between PG 81-18 and PG 96-4. Table 1 shows construction date, traffic level, and mixture type for each field project.
Field Project Parameters
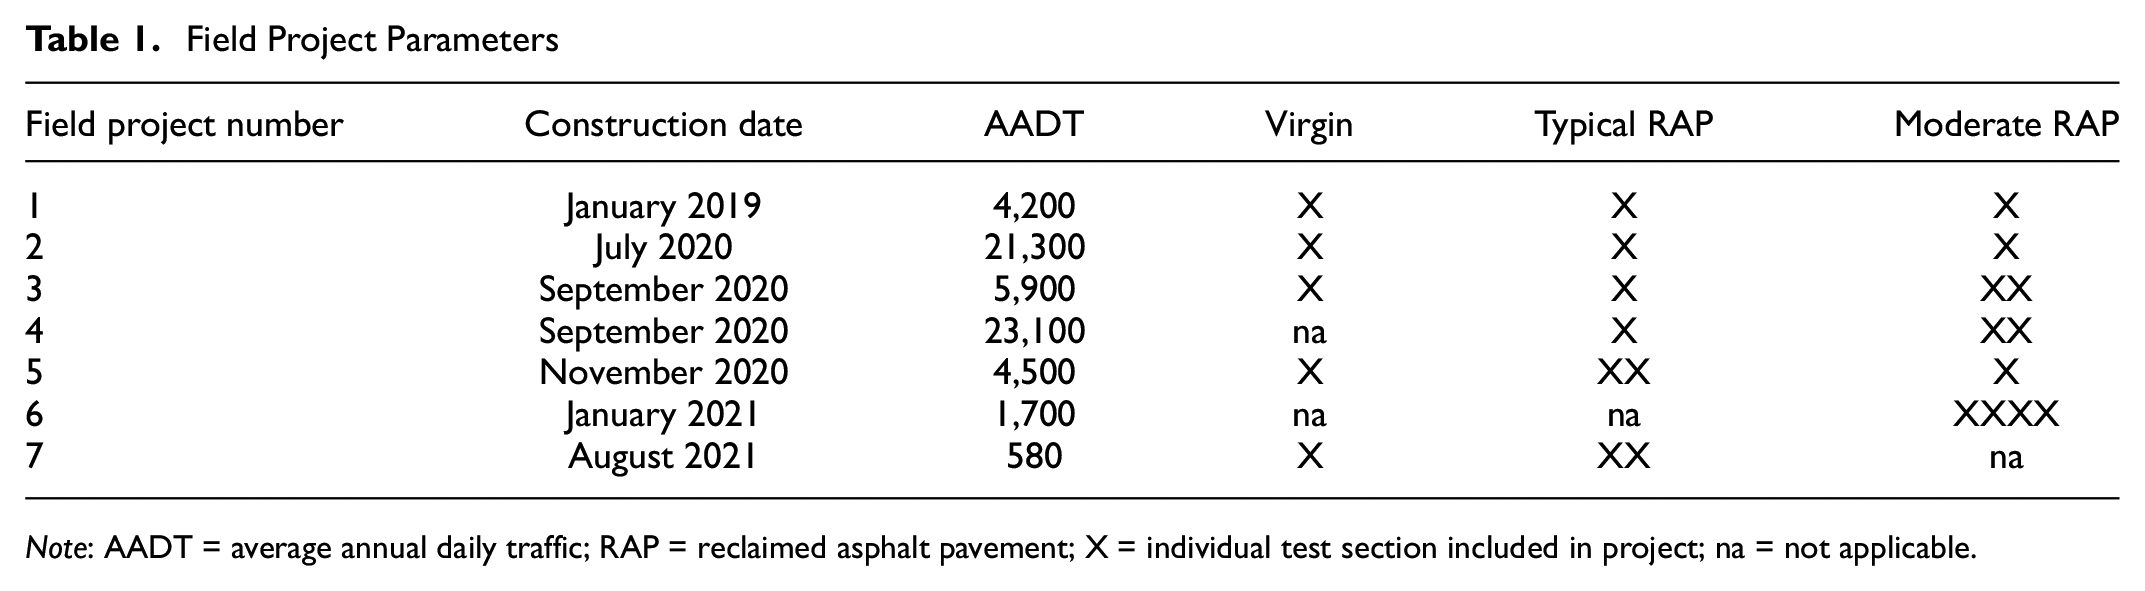
Note: AADT = average annual daily traffic; RAP = reclaimed asphalt pavement; X = individual test section included in project; na = not applicable.
Data Collection and Testing
Preconstruction and postconstruction field surveys were taken including crack mapping and other visual distress evaluations. Field inspections were conducted about every 12 months after construction, and field cores were procured at each inspection date and then evaluated in the laboratory. For overlay projects, preconstruction surveys were taken to account for distress that could be reflected to the surface layer from the underlying pavement. Four evaluation areas of 161 m each were evaluated per mixture.
Materials combinations for use in the field projects were evaluated in the laboratory preconstruction using laboratory mixed-laboratory compacted (LMLC) specimens for mix design and postconstruction using plant mixed-laboratory compacted (PMLC) specimens and field cores. Testing included the Texas overlay test, the Hamburg wheel tracking test, MR, the indirect tensile strength test, the indirect tension asphalt rutting test (IDEAL-RT) test, and the IDEAL-CT test. This study only considered IDEAL-CT parameters measured from testing the field cores.
Two field projects began to exhibit cracking during the analysis period. Cracking for both projects was longitudinal cracking adjacent to the wheel path. Top-down fatigue cracking was suspected and verified by coring over the cracked areas. Figure 2 shows a cracked field core that was extracted to verify the mode of cracking.
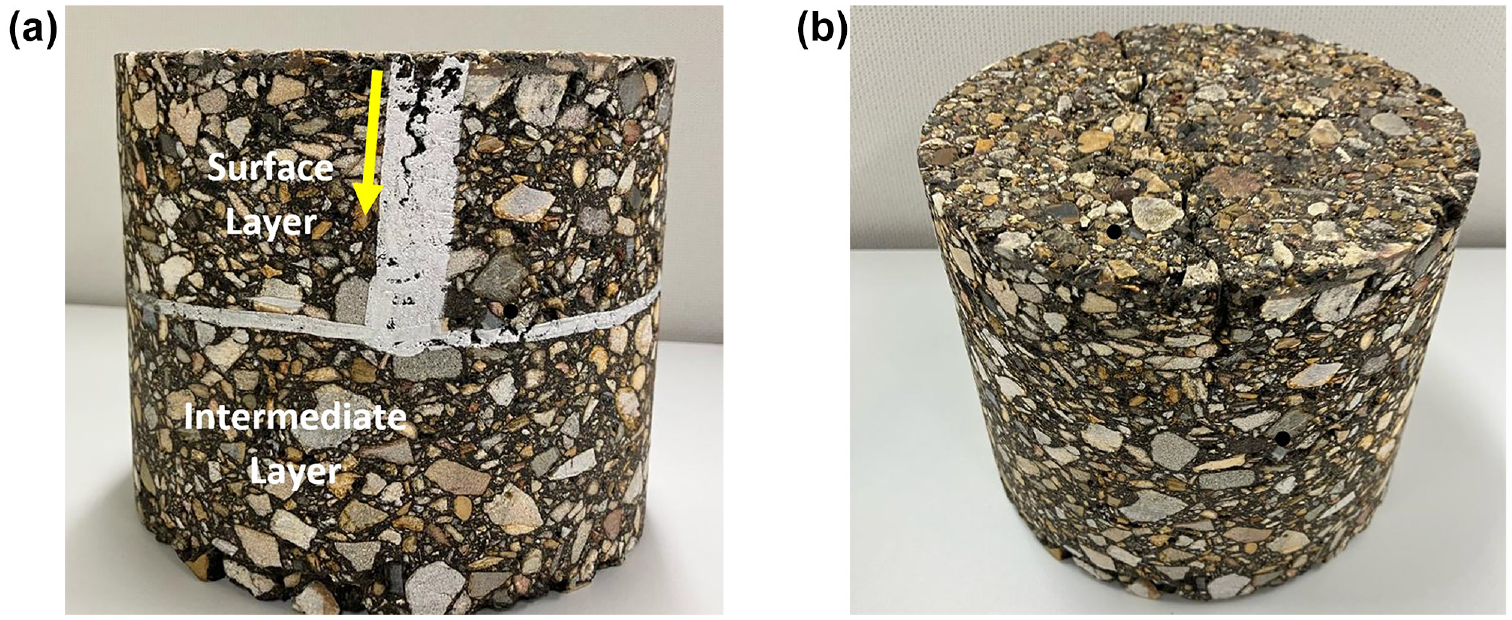
Field cracking mode: (a) side view with the crack and layer interface highlighted and (b) top-down view of core.
Field cores were taken annually from the middle of the lane from the same evaluation area for each project to facilitate a comparative analysis. The AV content of field cores varied between 2%–9% depending on the mixture and project with an overall average AV content of about 5%. Field core AV content was generally consistent within a mixture. Cores were carefully taken close together from year to year to limit variability, as illustrated in Figure 3. Coring was done with a 150 mm drilling bit, and cores were all 150 ± 2 mm in diameter. If cracks were present, coring was done at least one meter away from the nearest crack except for the cores that were taken to validate the mode of cracking.
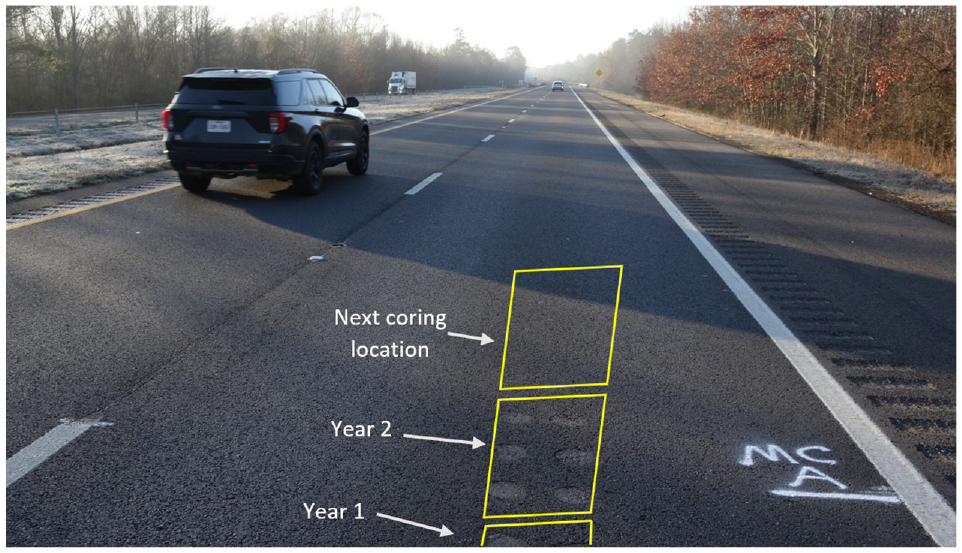
Standard coring layout.
The IDEAL-CT was measured on cores from all field projects after each inspection. Field cores were trimmed at the surface layer interface as close to 62 mm as possible; however, some layers were less than 62 mm thick. Thicknesses ranged from 22 mm to 63 mm (specimens < 38 mm thick were eliminated from the analysis as recommended by ASTM D8225 [ 1 ]). The thickness and diameter of each specimen was measured in three places and averaged for use in the IDEAL-CT analysis and thickness correction.
Data Analysis
The IDEAL-CT test was used to evaluate the cracking resistance of asphalt mixtures in this study. As indicated, the CTIndex calculation combines the Gf, l75, and m75 with specimen dimensions as shown in Equation 2. The l75/m75 ratio provides an indication of the flexibility of the asphalt mixture and correlates better with oven aging as compared with the CTIndex ( 6 ). The parameters in Equation 2 are illustrated in Figure 4.

where
CTIndex = cracking tolerance index,
Gf = failure energy (Joules/m2),
|m75| = absolute value of the post-peak slope at 75% of the peak load (N/m),
l 75 = post-peak displacement at 75% of the peak load (mm),
D = specimen diameter (mm), and
t = specimen thickness (mm).
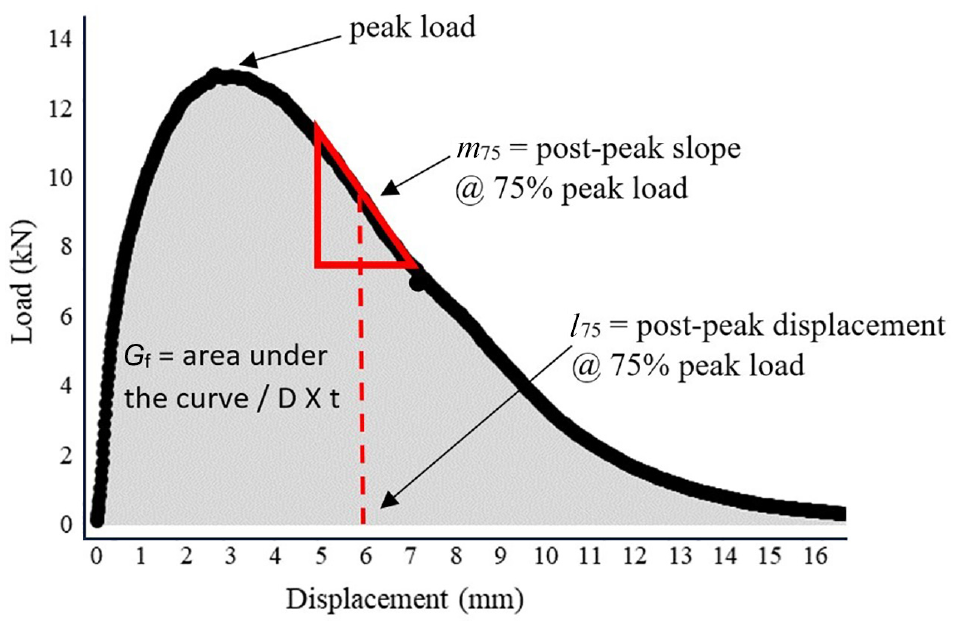
IDEAL-CT load displacement curve (adapted from ASTM D8225).
The l75/m75 ratio was a good candidate for this study as it was found to reduce at a predictable rate with oven aging. Gf was excluded because it was not found to be sensitive to oven aging ( 6 ). The l75/m75 ratio is referred to in this study as the asphalt flexibility ratio (AFR), shown in Equation 3, that also includes the thickness correction factor from the CTIndex equation in ASTM D8225 (Equation 2). Higher AFR values indicate greater flexibility and better resistance to cracking.

where
|m75| = absolute value of the post-peak slope m75 (N/m),
l 75 = post-peak displacement at 75% of the peak load (mm), and
t = specimen thickness (mm).
Between specimen variability can be a challenge when analyzing IDEAL-CT results. The average variability for these materials based on the larger effort is shown in Table 2. Field cores were found to have higher variability when compared with laboratory molded specimens; however, the AFR exhibited lower variability than CTIndex for both specimen types.
IDEAL-CT Test Variability
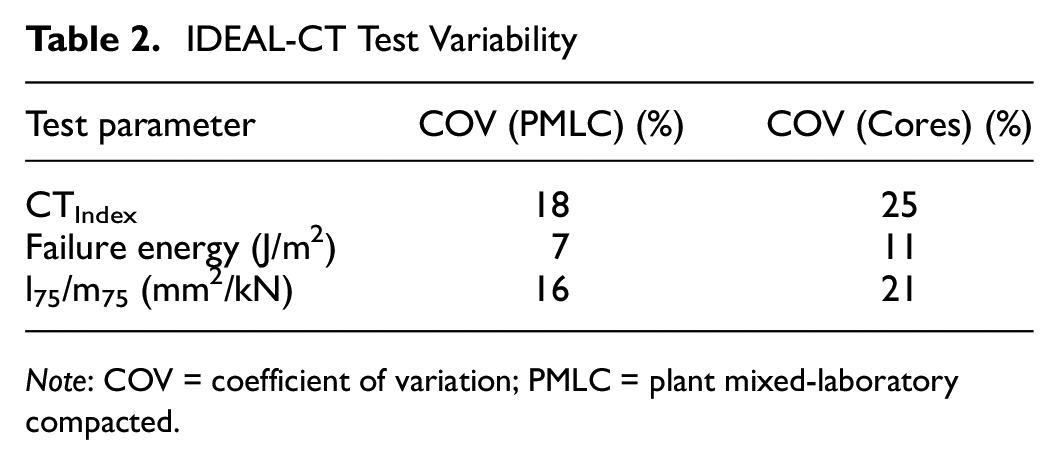
Note: COV = coefficient of variation; PMLC = plant mixed-laboratory compacted.
Field aging was calculated using the CDD for each field project over the period of interest as previously shown in Equation 1 ( 11 ). Daily weather information was collected from Weather Underground (www.wunderground.com) using data from the available weather station closest to the location of each field project. Figure 5 shows the CDD values for each field project in this study based on their construction date. The black diamonds in Figure 5 indicate dates where inspection and coring were performed. CDD is calculated in °F for comparability with previous research and owing to available weather data.
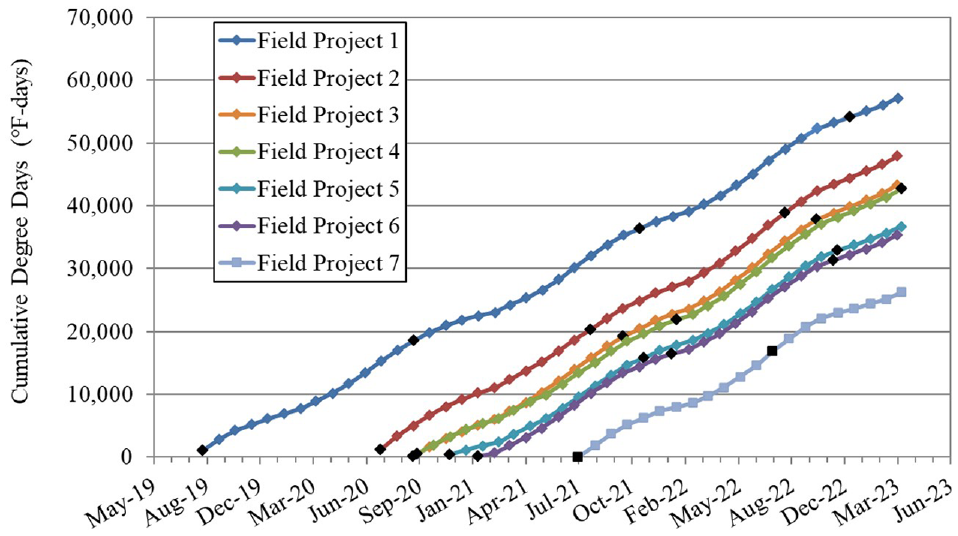
Field projects cumulative degree-day (CDD).
Cracking Model Development
Within the scope of this study, the following assumptions were necessary for development of the model to predict mixture AFR with field aging.
AV content of field cores does not affect the rate that AFR decreases with field aging.
The average IDEAL-CT results of four field cores is adequate to characterize an asphalt pavement.
The linear IDEAL-CT thickness correction factor is sufficient to normalize and compare field core test results.
The pavement structure of each field project was adequately designed for expected traffic, thus allowing for the analysis of climatic aging only, for the surface layer.
The authors recognize that these assumptions may affect the accuracy of the developed model.
Tie to Field Performance
Several studies have shown that CTIndex has a good correlation with other cracking tests such as the semi-circular bend (SCB) test and disk-shaped compact tension (DCT) test as well as with field cracking (6,7,19,20,21). No studies have explored the correlation between AFR to field cracking. Both the AFR and CTIndex were correlated to available top-down fatigue field cracking data, as shown in Figure 6. Asphalt pavement cracking performance is primarily a function of the flexibility of the pavement which may explain the AFR’s stronger correlation to field cracking performance when compared with CTIndex. This trend needs to be further developed with more data points as additional data become available.
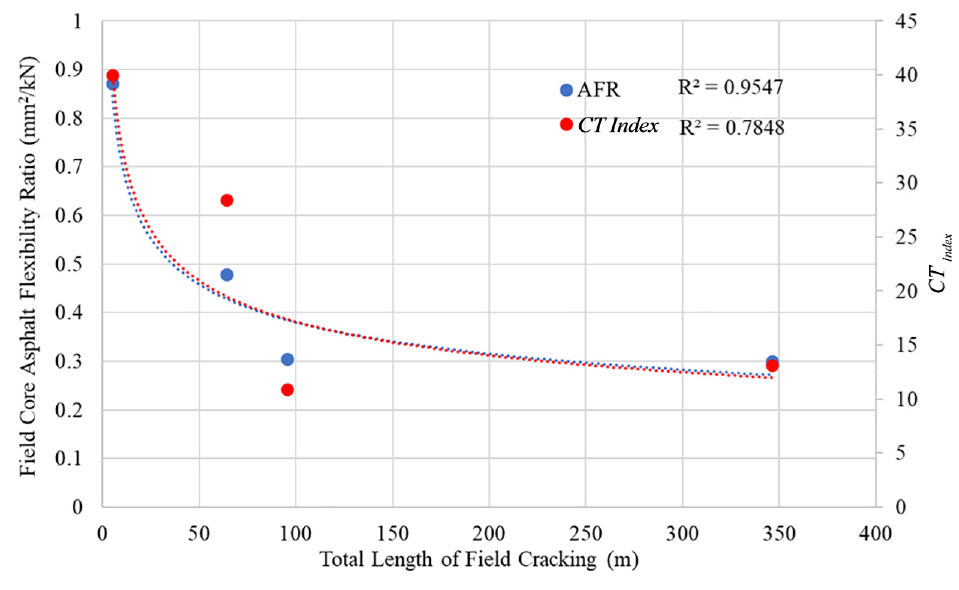
Comparison of asphalt flexibility ratio (AFR) and CTIndex versus field cracking.
Trendline Evaluation
A trend was observed when comparing the reduction in AFR with respect to the pavement CDD. Several potential relationships were explored to best describe this trend. The mean squared error (MSE) shown in Equation 4 was used to evaluate which of the following trendlines best predicted performance: quadratic, power, logarithmic, exponential, and linear. From the data set, all available mixtures with three or more data points (with cores procured and tested at construction and about every 12 months for 2–4 consecutive years) were used to evaluate the trendlines based on highest prediction accuracy.

where
n = number of data points,
Yi = observed values, and
Ŷi = predicted values.
A leave one out cross validation (LOOCV) method was used to determine the MSE. A lower MSE indicates that the trendline generates more accurate predictions. For each of the trendlines evaluated, a model was trained with a data point omitted from a set of mixture data. The omitted value was designated as Yi. The trendline was used to predict Yi, and the predicted value was designated as Ŷi. The MSE was then calculated using Equation 4. This process was utilized on a mixture-by-mixture basis for every data point of each data set with adequate data points. Figure 7, a and b, shows examples of a mixture dataset when a data point is removed from a data set, with all trendline predictions shown with an X marker. In Figure 7a the fourth data point is removed, and a “future” value is extrapolated and in Figure 7b the third data point is removed, and the removed point is approximated using the remaining data points. The average MSE values were then compared with determine the most accurate trendline. This analysis was run on all available mixtures while only two examples are shown in Figure 7. The power trendline was found to predict significantly better than any other with an average MSE 14 times smaller than the next best trendline.
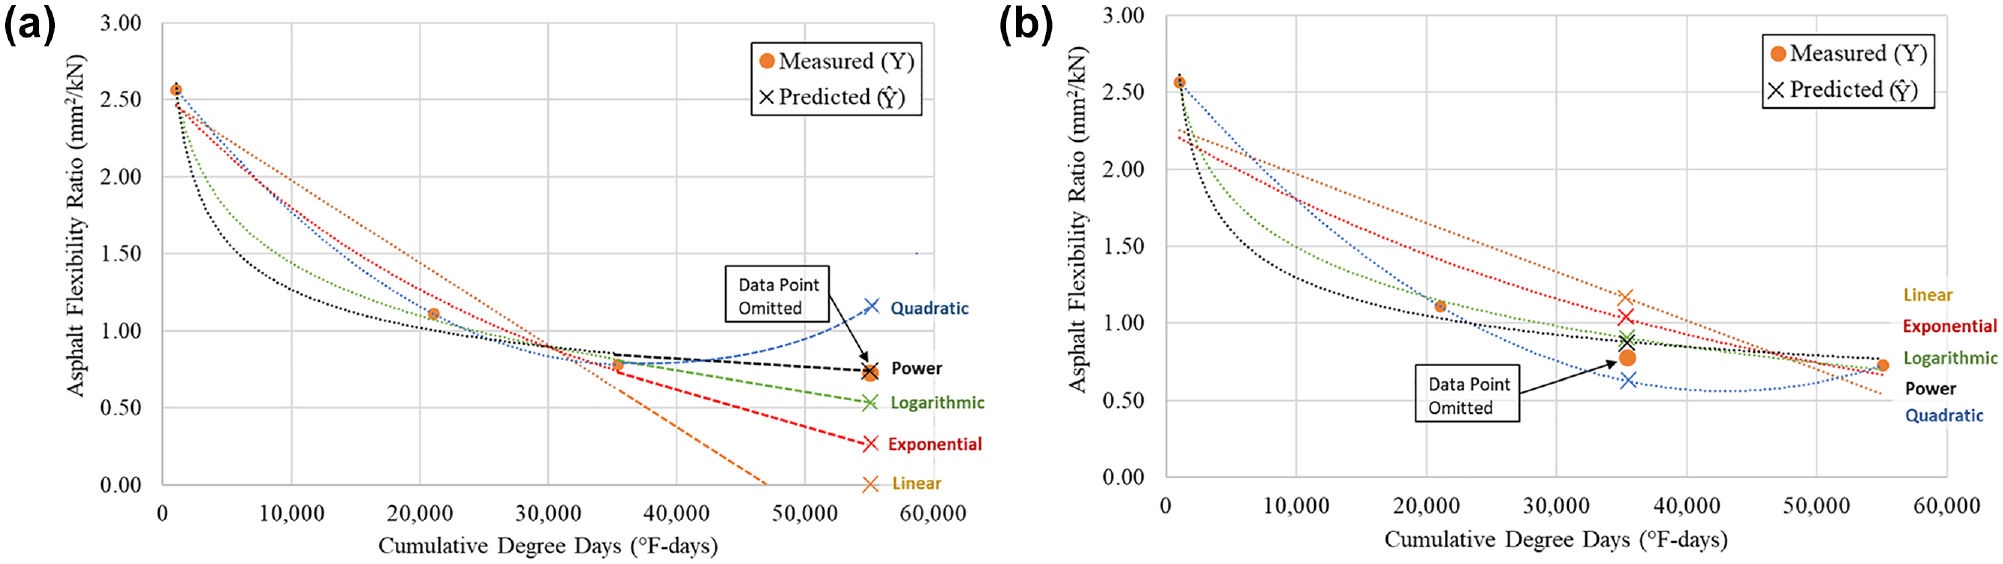
Trendlines evaluation example: (a) endpoint removed and (b) middle point removed.
Among the five trendlines, a power equation was able to best predict AFR values after construction and was selected for further evaluation. This power model is shown in Equation 5. Figure 8 shows the corresponding power trendlines of all mixtures with at least three data points (i.e., field measurements at construction, about 12 months after construction, and about 24 months after construction). All trendlines exhibit a similar form with the exception of one mixture with a mostly flat trendline perhaps attributable to testing error of the field cores acquired at construction. One mixture also shows a substantial drop in AFR with time, and this mixture was the only mixture to include a recycling agent and was later removed from the dataset since this additive renders it different than all other mixtures. Also note that while all trendlines are somewhat parallel, the rate of AFR decay varies based on the mixture, meaning each mixture would have a unique α and a slightly different β.

where
AFRt = l75/m75 from IDEAL-CT test after field aging (mm/kN),
t = field aging in CDD (°F-days),
CDD = cumulative degree days (°F-days), and
α and β = curve fit coefficients.
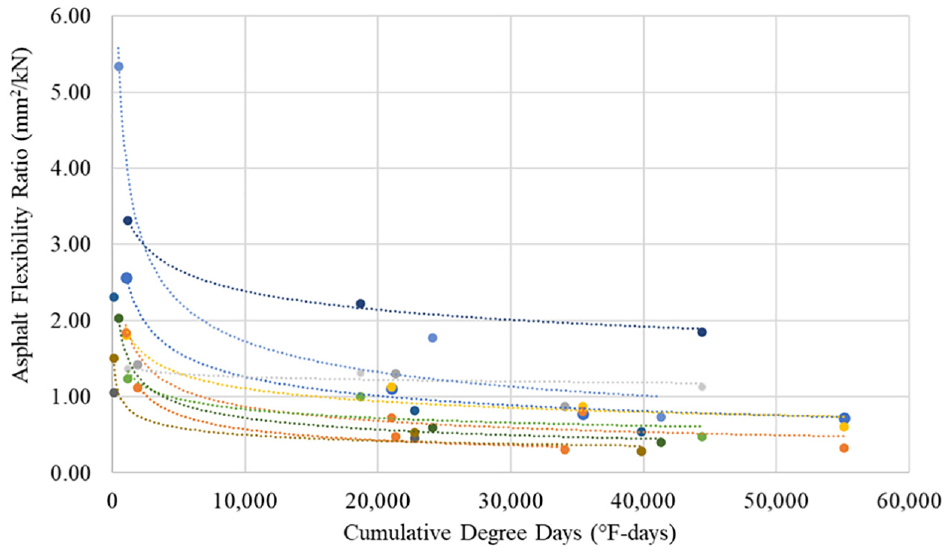
Power model evaluation.
Model Development and Validation
To explore the different α value for each mixture, a term was developed to normalize α based on the mixture initial condition (AFR test results of field cores taken at or near the time of construction). To develop this term, data from 24 mixtures were utilized. For all mixtures field investigations were completed at least two times (i.e., at construction and about 12 months after construction) and up to four times yielding data from 66 sets of cores (i.e., 66 total data points). Note that all but three mixtures had been tested and evaluated at least three times (i.e., at construction, at about 1 year after construction, and at about 2 years after construction). The final αc correction term multiplies a coefficient, C1, by the difference between the initial AFR and a second coefficient, C2, and adds this value to the average measured α (αavg) as illustrated in Equation 6. The β value in Equation 5 was found to be generally consistent across the mixtures evaluated. For practicality, a β value was initially selected by averaging the β values across mixture trendlines for mixtures with at least three data points.

where
AFRi = measured l75/m75 from IDEAL-CT test at construction (mm2/kN),
C 1 and C2 = normalization coefficients.
An iterative process was followed to best optimize the four model coefficients (i.e., α, β, C1, and C2) for data from all 24 mixtures. Initially the average α and β were held constant and C1 and C2 were adjusted to optimize for the lowest MSE. Then C1 and C2 were held constant and α and β were optimized. C1 and C2 were again adjusted, and the process was repeated until no further improvement was seen in the average MSE.
Two outlier mixtures were removed, noted with red circles in Figure 7, for a total of four data points obtained after construction removed from the model. One of the removed mixtures was a thin overly mixture (TOM) which had an average core thickness of < 30 mm, which is less than the minimum thickness recommended in ASTM D8225 ( 1 ). The other removed mixture used a recycling agent and appeared to age differently than the other mixtures. No other TOM mixtures or mixtures with recycling agents were a part of this dataset. One other outlier mixture was observed as shown in Figure 9. This mixture was not removed because no significant variables were found that could influence performance as compared with the rest of the dataset. It was also noted that all outliers were mixtures with comparatively high AFR test results.
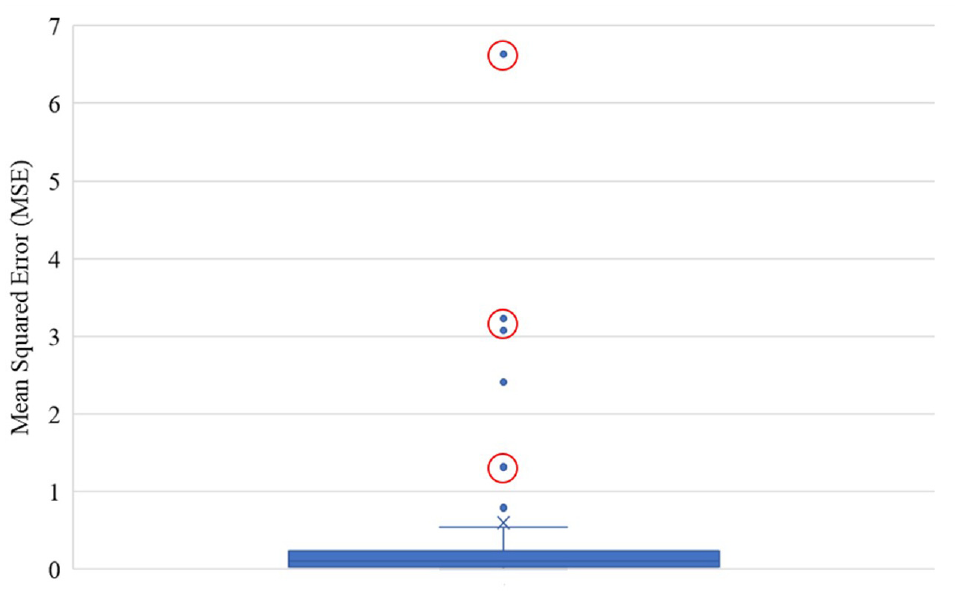
Model outliers.
The residuals shown in Figure 10 were also investigated to detect accuracy problems at high AFR values and to evaluate any other potential problems with the model. The lower the absolute value of the residuals, the higher the prediction accuracy as shown in Equation 7. The values appear well distributed around zero which indicates that the model is not systematically over- or under-estimating the predicted values and trend, on average, toward the true measured value. Owing to the small dataset size, however, it is difficult to make other conclusions based on residuals.

where
r = residual,
Yi = observed values, and
Ŷi = predicted values.
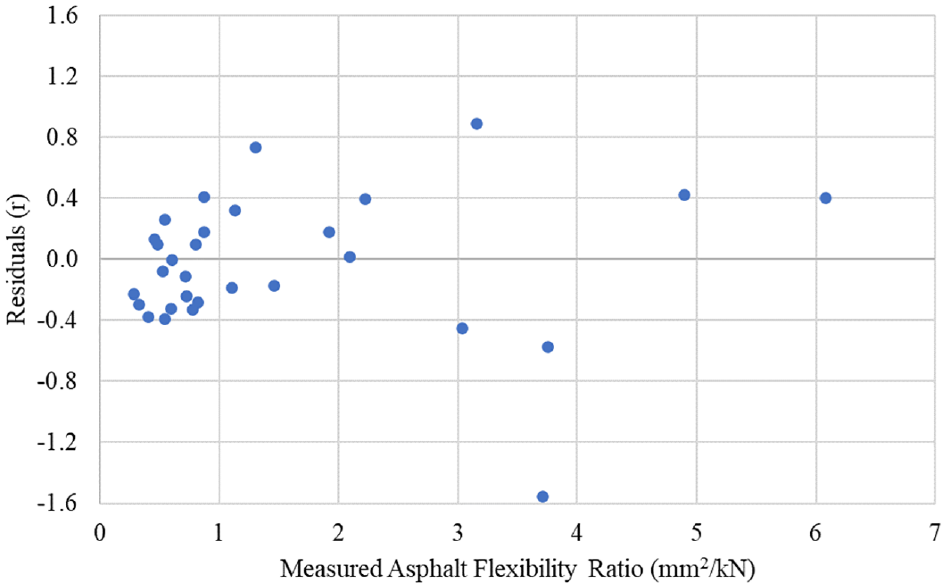
Model residuals.
To explore the accuracy of the model, a LOOCV verification procedure was conducted employing all the available data with exception of the removed outliers. The procedure involved the following: (1) removing one data point, (2) running an algorithm to adjust the model based on the remaining dataset, (3) predicting the value of the removed point, and (4) repeating the same procedure with each data point as illustrated in Figure 11. The predicted values from the LOOCV procedure were then compared with the predicted values. The resulting average LOOCV MSE was 0.267 and the average MSE trained on the entire dataset was 0.204. The difference between these MSE values is acceptable for a relatively small dataset like the one used in this study and indicate that the model should perform reasonably well on similar data that were not used for model training.
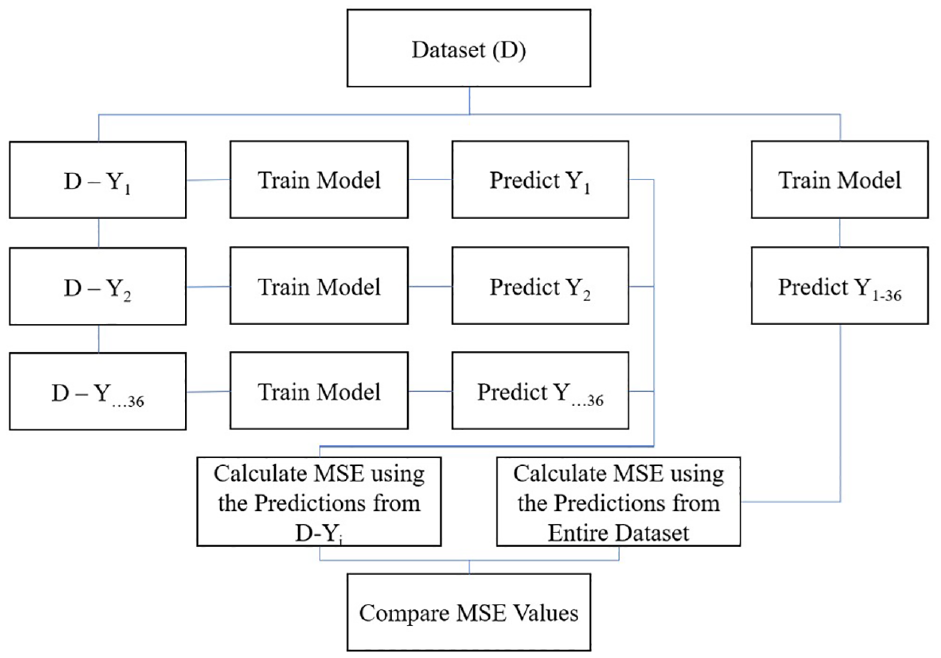
Leave one out cross validation process.
The measured versus predicted model values are plotted in Figure 12. The R2 correlation coefficient is 0.91, indicating a strong correlation between the measured and predicted values. No significant leverage points were observed in the dataset; however, most of the data are in the lower AFR region meaning there are fewer prediction points as AFR values get larger. Note that the model predicts AFR values based on an initial measured value, with the point on this graph providing predictions versus actual AFR values at the calculated CDD for 1–4 years of field monitoring. This means that of the 66 total data points there are only 42 possible predictions. Two outlying mixtures were eliminated with four total predicted data points, and two mixtures from field project 6 were not tested after about one-year postconstruction, bringing the total number of predictions to 36. This is a small dataset but represents a relatively substantial field performance monitoring effort.
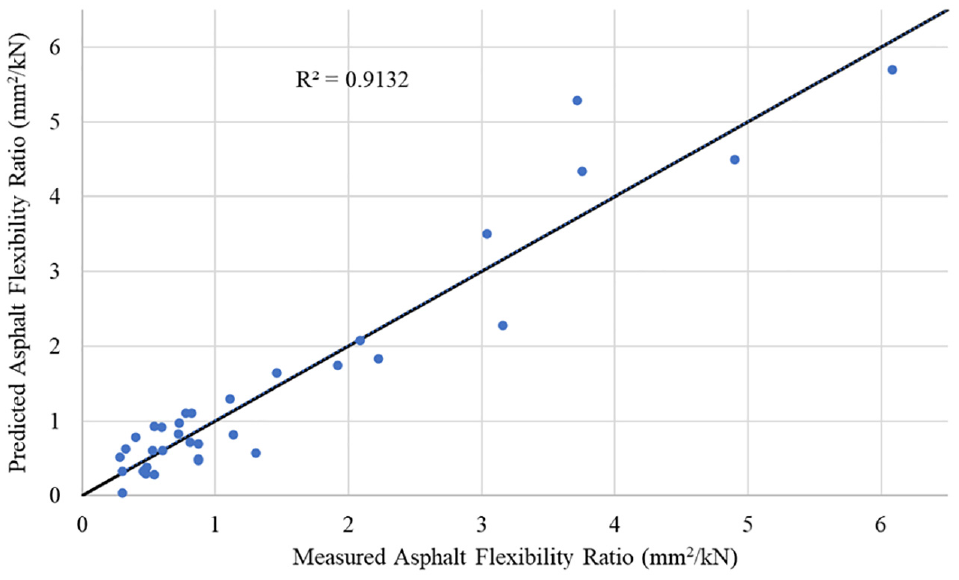
Model prediction accuracy.
To explore the applicability of the model to specific mixture types or mixture components, the data were divided into four categories including virgin, typical, moderate RAP, and Superpave mixtures. This decreased the sample size for each mixture type, but it gave a sense of how the model predicted values for a particular mixture type or set of materials. Table 3 shows for each mixture type the number of data points, resulting C1 and C2 coefficients, and model prediction accuracy R2 value and MSE.
Asphalt Flexibility Ratio (AFR) Model Coefficients and Model Prediction Accuracy for Different Mixture Types
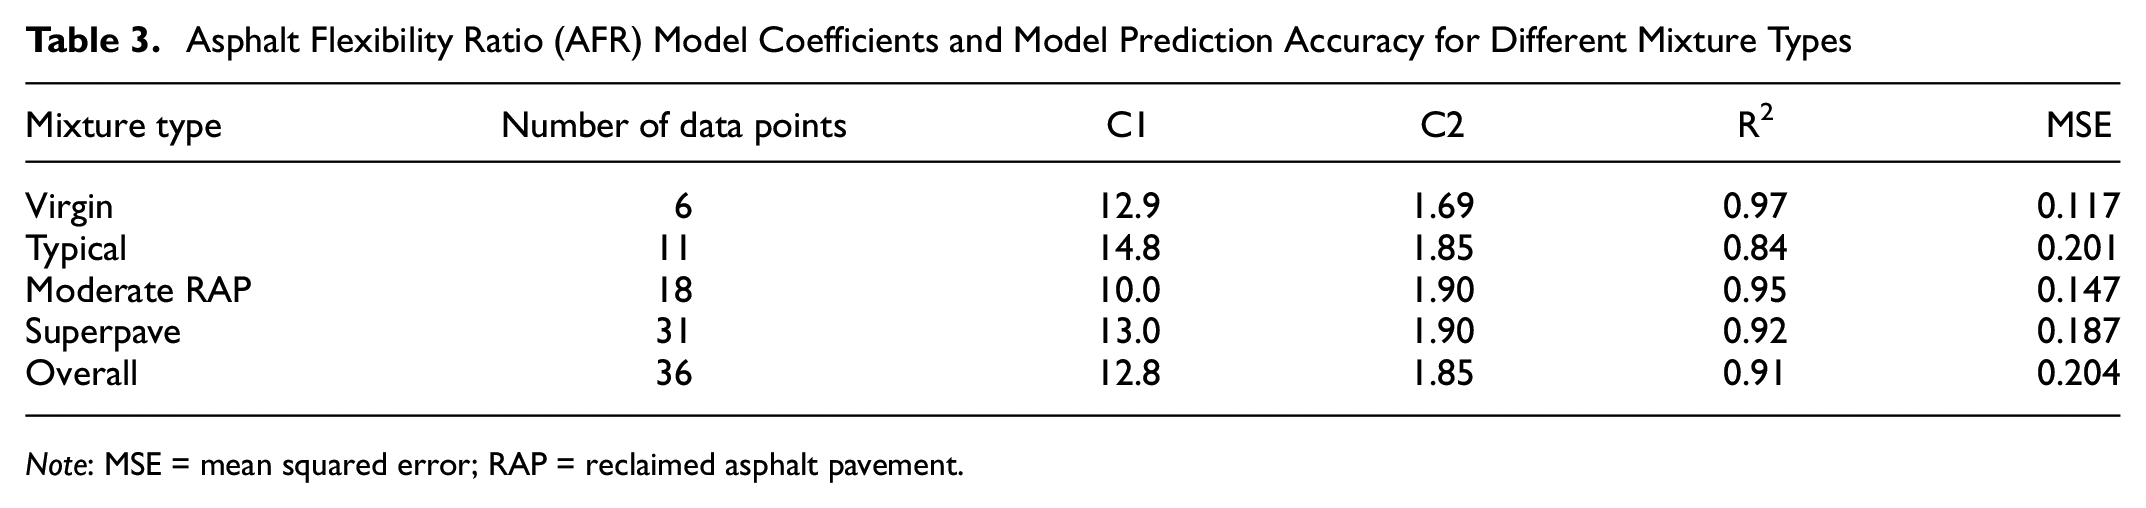
Note: MSE = mean squared error; RAP = reclaimed asphalt pavement.
The virgin mixture category showed the highest prediction accuracy but had a low number of data points. Despite the low number of data points, the data were well distributed, which increases the validity of the model prediction. The typical mixture category showed lower prediction accuracy when compared with the overall model. The moderate RAP category showed better prediction accuracy than the overall model and had the second largest number of categorical data points. Most of the mixtures were Superpave, making this category similar to the overall category. All categorical models showed good accuracy even with the limited number of data points.
AFR Threshold Analysis
To establish an appropriate AFR threshold for adequate/inadequate cracking performance, the field survey data were explored. During the analysis period, five mixtures from two field projects exhibited top-down cracking, which served as the basis for establishing a preliminary AFR threshold. The amount of cracking observed correlated well with the measured AFR, as illustrated in Figure 13. Percent cracking is defined as length of cracking over total lane length of the evaluation area. Observed cracking was primarily longitudinal for all mixtures. Four mixtures from field project 6 in Paris District (PAR) and one mixture from field project 1 in Atlanta District (ATL) started exhibiting cracking during the investigation period of this study. The coefficient of determination between AFR and field cracking was 0.95 when only analyzing field project 6, and it reduced to 0.76 when analyzing all five mixtures. More field cracking information was not available at the time of this study but is needed to validate this analysis.
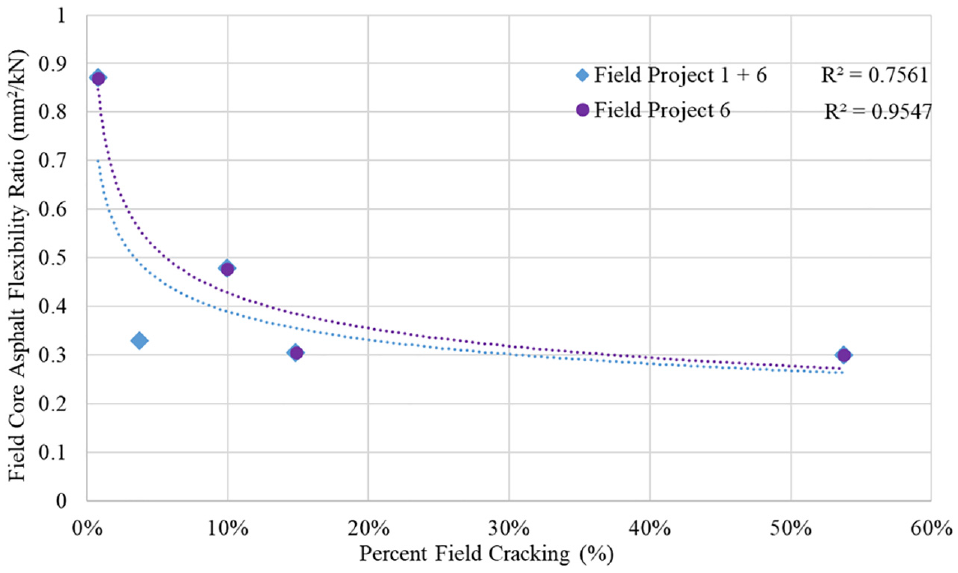
Asphalt flexibility ratio (AFR) at time of initial field cracking versus % field cracking.
At the time of crack initiation, the average AFR for these mixtures was approximately 0.35, with a standard deviation of 0.08. Note that the top left point in Figure 13 was not included in this average because the entire project had < 1% of measured cracking. For mixtures with >1% cracking, the AFR ranged from 0.30 to 0.48. Cracking appears to initiate around an AFR of 0.48 and significant propagation is seen around an AFR of 0.3. These values can be used to calculate the AFR range necessary at construction to achieve a desired pavement life measured in CDD before initial cracking or crack propagation.
The critical field aging condition of 70,000 CDD proposed by the National Center for Asphalt Technology (NCAT) is used as the minimum desired performance life ( 16 ). To ensure that the pavement reaches this desired minimum pavement life before crack initiation or propagation, an initial AFR of 1.20-1.62 is required, as illustrated in Figure 14. It is important to note that, despite exhibiting low severity cracking, the field project mixtures evaluated in this study are still in good serviceable condition. No evaluation has been performed at this time on a “terminal” or significant AFR where the pavement would be considered failing with inadequate cracking performance.
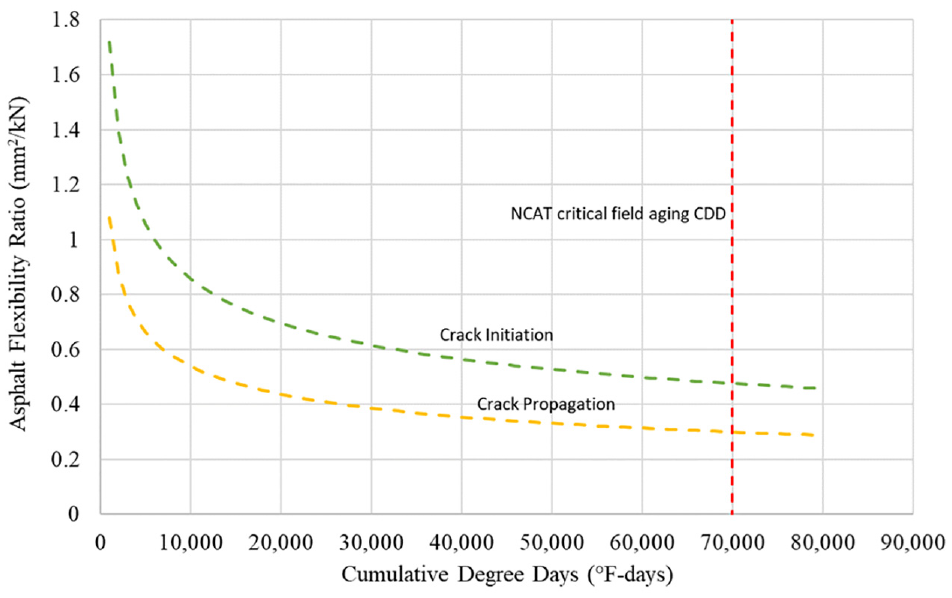
Asphalt flexibility ratio (AFR) reduction over time as a function of cumulative degree-day (CDD).
Final Model and Discussion
The final recommended model is shown in Equation 8. The values of C1 and C2 to be employed in the calculation of αc can be obtained from Table 3. This model represents analyzed data from seven field projects, 24 mixtures, and 22 field inspections/coring inspections in Texas. The field projects were distributed across several Texas climates with virgin, typical, and moderate RAP mixtures. Further development and validation of this model is necessary for use in climates and with materials not evaluated in this study.

where
AFRt = predicted l75/m75 from IDEAL-CT test after field aging (mm2/kN),
t = field aging in CDD (°F-days),
CDD = cumulative degree days (°F-days), and
β = 0.302
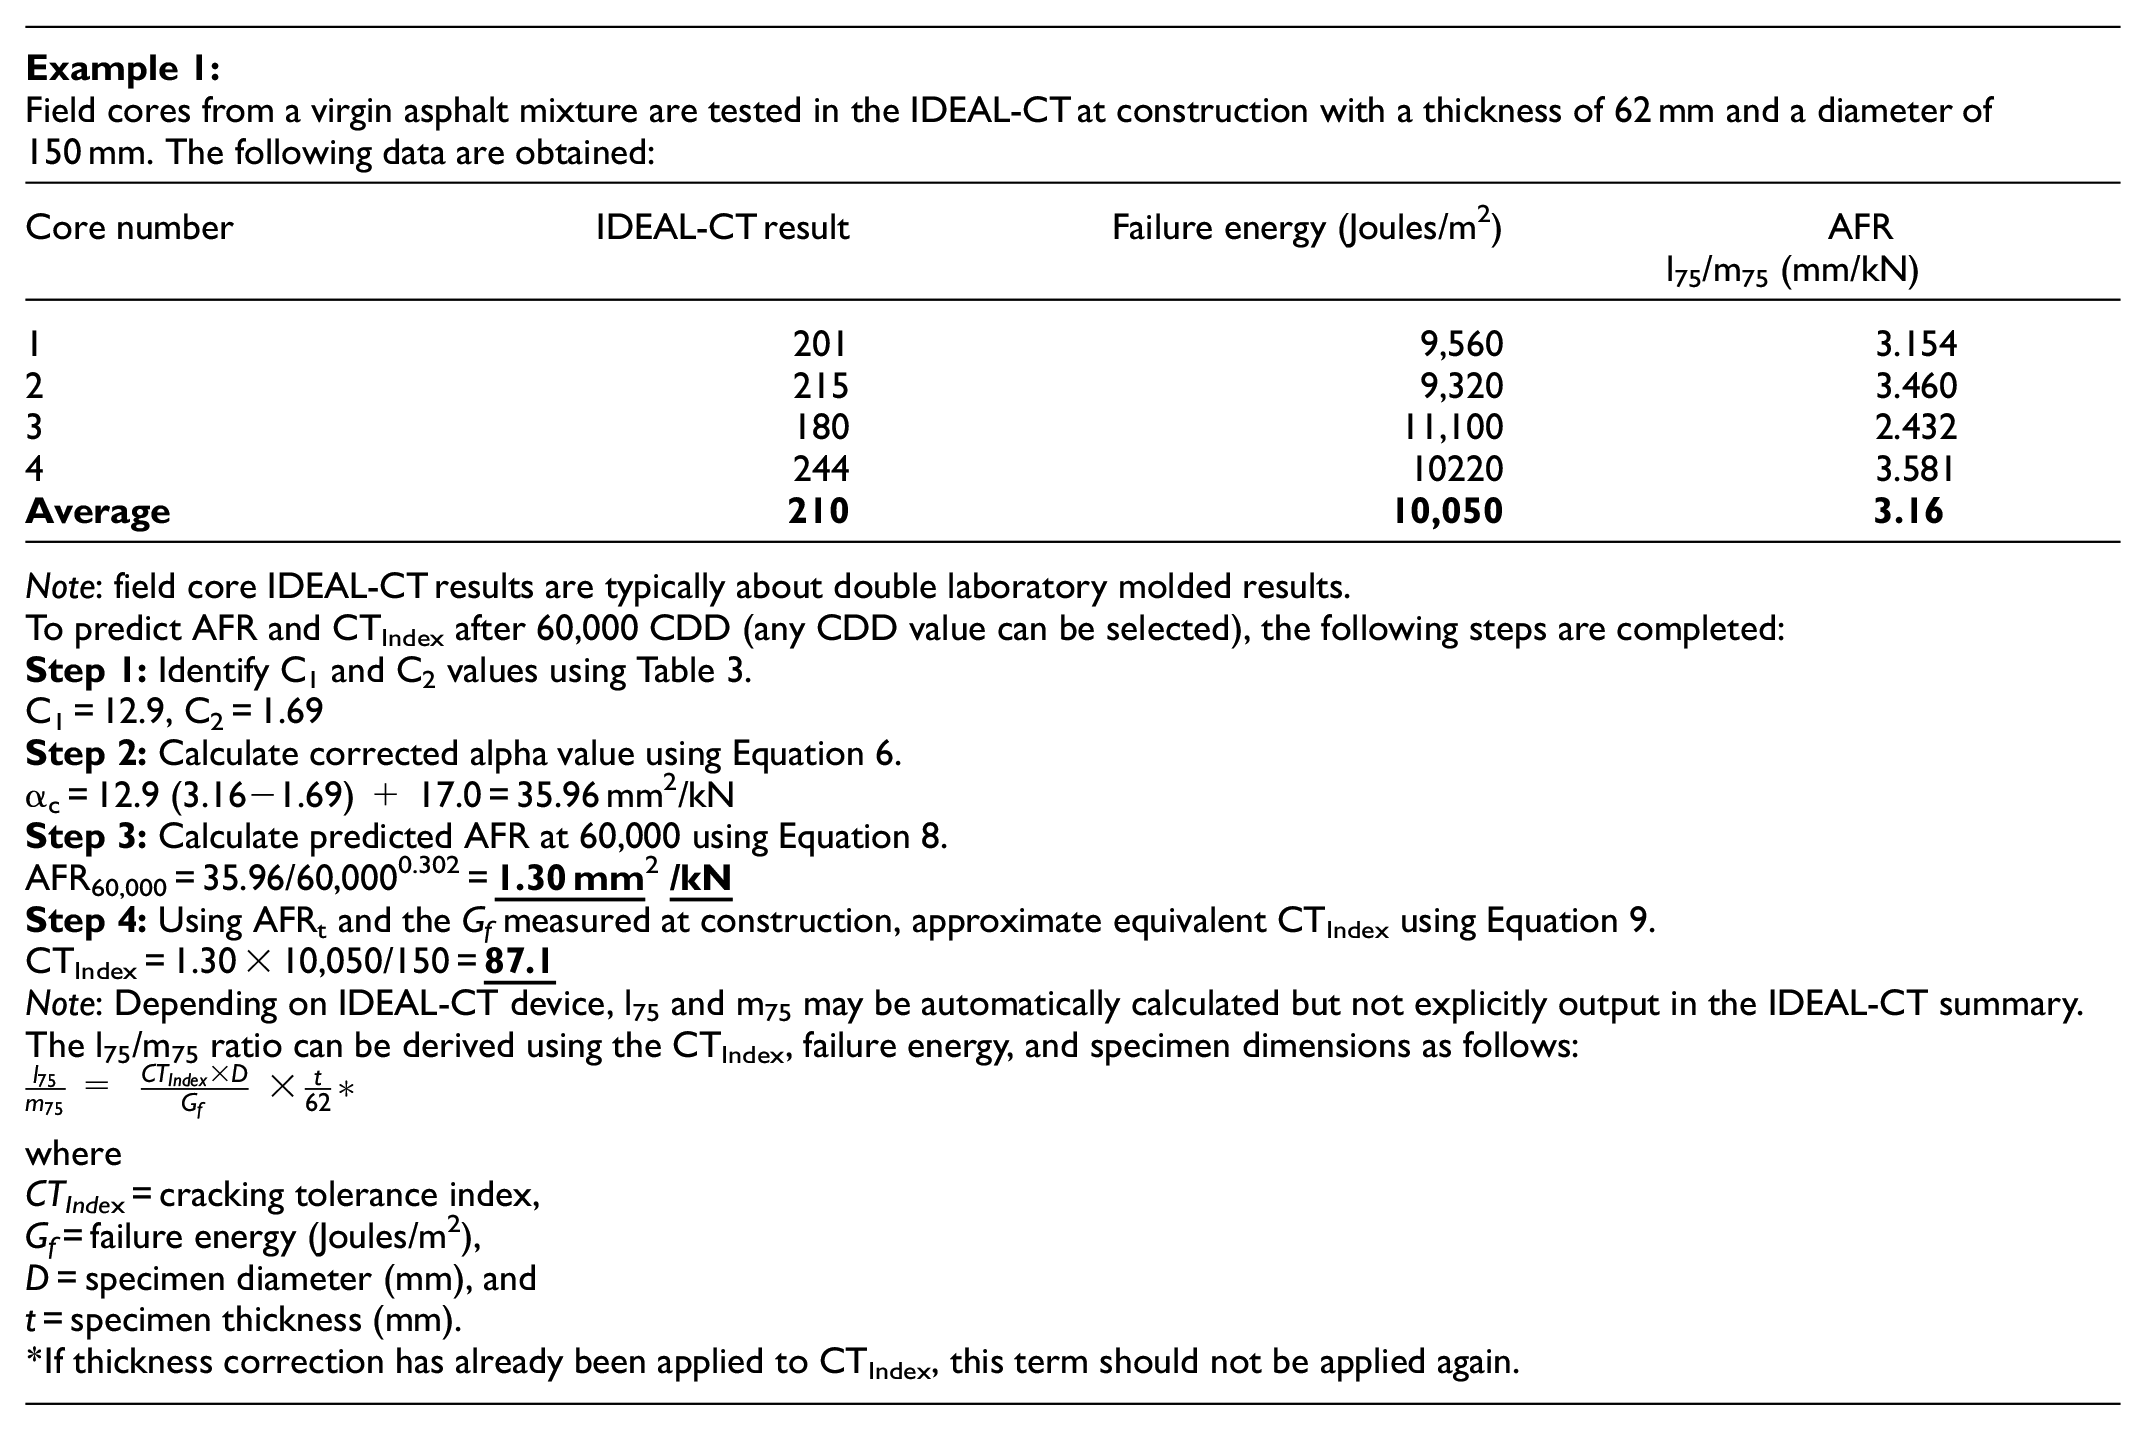
An estimate of CTIndex was also attempted using these data but, owing to high variability, AFR was selected as the output variable for this model. Since the CTIndex is a more commonly used/ understood parameter, a conversion was explored for informational purposes. The projected CTIndex of a mixture can be approximated using Equation 9. Based on the mixtures evaluated in this study, IDEAL-CT Gf did not change significantly with field aging and the average Gf was ≈ 9,000 Joules/m2. Therefore, CTIndex limits can be estimated using a Gf of 9,000 Joules/m2 and a specimen diameter of 150 mm. The established critical AFR values of 0.30–0.48 to crack initiation and 1.20–1.62 at construction are approximately equivalent to CTIndex values of 18–29 and 72–97, respectively. This indicates that for the materials combinations evaluated, a field core CTIndex threshold of about 72–97 would result in pavements lasting 70,000 CDD (about 4 years in Texas) before crack initiation and once the CTIndex drops below 18–29, crack propagation and significant cracking is expected.

where
AFR = l75/m75 from IDEAL-CT test (mm/kN),
Gf = failure energy (Joules/m2), and
D = specimen diameter (mm).
This model exhibits potential across various applications, as outlined below:
mix design: setting an AFR threshold to ensure pavement durability;
pavement monitoring: estimating if maintenance is required or predicting when a treatment should be scheduled—note that this model is predicting future AFR which is tied to cracking resistance, it is not predicting cracking amount, type, severity, and so forth;
pavement forensics: evaluating if observed pavement cracking failure is primarily attributable to an asphalt mixture deficiency or owing to other factors such as faulty base materials, construction practices, or inadequate pavement structure.
There are also several limitations with this model that were noted during this study, including the following listed along with possible actions to mitigate their impact.
Only field cores were evaluated in this study, additional testing is necessary to tie this to laboratory prepared specimens.
Predicted AFR values can drop below zero after 70,000 CDD if the initial AFR is very low. Therefore, construction AFR values should be >0.5 to use this model.
The model was trained on mixtures throughout Texas with materials common to those locations. ○ The model α correction coefficients may differ with other materials/climates. These values should be calibrated based on field data for other regions. ○ The model may not be applicable in regions with multiple freeze-thaw cycles.
The oldest evaluated mixture accumulated 60,000 CDD with good prediction accuracy from 40,000–60,000 CDD. Therefore, the model may hold true up to around 80,000 CDD but will likely loose accuracy after more significant field aging.
Overall, despite limitations in the model, it can be used as a valuable tool for optimizing asphalt pavement mix design, facilitating pavement monitoring, and supporting forensic analyses of pavement failures. When employed properly, asphalt pavement authorities can leverage this model to help make informed decisions and improve pavement quality in their respective regions.
An example of how this model can be used is shown in Example 1.
Conclusions and Future Work
Conclusions
This study analyzed field cracking data and laboratory cracking results from testing field cores to develop an asphalt pavement cracking model. Using this model, pavement cracking performance assessments can be made. Conclusions drawn from this study are listed below.
The AFR (l75/m75 from IDEAL-CT test) is sensitive to field aging and related to field cracking. Mixture aging rates vary, but with knowledge of the materials being used, reasonably accurate assessments of adequate/inadequate performance to crack initiation can be made.
The AFR is a good indication of mixture ductility and correlates well with field cracking. Once a mixture AFR value drops below 0.48, crack initiation is expected, and below 0.30 more prevalent crack propagation is expected based on field observations in this study.
CDD is a good metric to measure field aging, as it considers the climate and seasonal fluctuations in a specific region or at a specific location.
Future Work
During this study, certain areas were identified for further development.
Continued monitoring of field project mixtures evaluated in this study is recommended. Particular attention should be given to the mixtures that have already started exhibiting cracking to identify modes of cracking and cracking rates. As distress accumulates, multiple types of distress and their severity should be included in modeling.
Verification of this model is needed across more mixture types, materials, and climatic regions. A broader field-testing scope would help validate the proposed cracking model and would allow for the development of better climate/mixture-based implementation guidance. More data are needed to determine if this model is applicable to larger datasets.
Additional testing in freezing climatic regions to determine if the model can be improved for cold weather considerations is suggested.
Benchmarking AFR values of failing/failed pavements is proposed. More data should be gathered on how lower AFR values influence the type and severity of cracking and a “terminal” pavement AFR to significant cracking should be developed. With a terminal value, better pavement life assessments could be performed using this model.
A secondary model could be developed to predict time to pavement failure from the time cracking initiates. It is expected that the cracking rate of a pavement will significantly increase once cracking has commenced if the pavement is left without maintenance.
Tie to laboratory aging protocols and to laboratory prepared specimens should be explored. If reasonable ties can be made, laboratory aging protocols could be better correlated to field aging.
Footnotes
Acknowledgements
The authors would like to thank TxDOT districts for invaluable field support; Clayton Treybig, Michael Hoagland, Meng Ling, and Haydar Al-Khayat for laboratory and field support at Texas A&M Transportation Institute; and the many contractors and materials suppliers that made this effort possible.
Author Contributions
The authors confirm contribution to the paper as follows: study conception and design: Aaron Leavitt, Amy Epps Martin, Edith Arámbula-Mercado; data collection: Aaron Leavitt, Amy Epps Martin, Edith Arámbula-Mercado; analysis and interpretation of results: Aaron Leavitt, Amy Epps Martin, Edith Arámbula-Mercado; draft manuscript preparation: Aaron Leavitt, Amy Epps Martin, Edith Arámbula-Mercado. All authors reviewed the results and approved the final version of the manuscript.
Declaration of Conflicting Interests
The authors declared no potential conflicts of interest with respect to the research, authorship, and/or publication of this article.
Funding
The author(s) disclosed receipt of the following financial support for the research, authorship, and/or publication of this article: TxDOT funded the project that made this research possible.