
Abstract
Track integrity is critical for railroad safety. Traditional track inspections are either labor-intensive or require centralized data processing, making them susceptible to human error and lapses between data collection and situation awareness. The advent of deep learning and computer vision provides promising potential for automated track inspections. However, few existing systems are edge-computing oriented or provide inspection results in real time. In this study, a novel ultra-portable system for real-time detection of track components, such as spikes, bolts, and clips, is developed by integrating the cutting-edge YOLOv8 object detection model with a tailored template matching algorithm. In this system, YOLOv8 serves to recognize track components, while the template matching algorithm discerns missing components based on predefined patterns. Field blind testing results verified the exceptional performance of the model in detecting track components and a remarkable speed of 98.12 frames per second. Leveraging these detection results, the proposed template matching technique displayed an impressive recall rate of 90% and an accuracy rate of 90.77% in identifying missing components. The proposed system provides an affordable and versatile solution for track inspection, aiming to improve railway safety.
The current freight and passenger railway networks in the United States span 136,729 mi and 20,787 mi respectively, carrying millions of tons of goods and countless passengers each day ( 1 ). Given the networks’ critical role in the transportation system, ensuring track safety and integrity is of paramount importance. According to Federal Railroad Administration (FRA) mandates, regular inspections of track components are vital to ensure safety and minimize accident risks ( 2 ). Components such as spikes, bolts, and clips can often be damaged or missing as a result of continual stress and environmental factors. Failure to identify these defects can result in track performance degradation and may even lead to accidents ( 3 ). Traditional inspections of these track components typically rely on manual checks which are labor-intensive and susceptible to human error, or inspection vehicles which are expensive and often require considerable amounts of experience and time to process the data ( 4 ).
Recent technological innovations, particularly in the domains of deep learning and computer vision, offer promising avenues to improve the efficiency and accuracy of track inspection. Deep learning, a subfield of machine learning, has demonstrated its utility across industries. In infrastructure engineering, it provides analytical tools for evaluating structural damage across roads, bridges, and railways, thereby enhancing their lifespan and safety ( 5 – 10 ). While some rail operators have begun to adopt these technologies for specific tasks, the unique characteristics of U.S. track components and existing infrastructure pose challenges in integrating these technologies into highly automated operations, and substantial manual labor is still required for post-processing. Thus, the development of an efficient and cost-effective automatic track inspection system has become a pressing necessity to enhance the safety and reliability of the rail transportation network.
Over the past decade, substantial efforts have been made to develop systems for the detection and inspection of track components. For instance, Li et al. ( 3 ) devised a mathematical method to detect ties, tie plates, and anchors with high accuracy. Guo et al. ( 4 ) introduced an enhanced YOLOv4 network for track component detection and tested various activation functions. Qi et al. ( 11 ) designed a MYOLOv3-Tiny network for clip detection, incorporating depthwise separable convolution and linear bottlenecks with inverted residuals to efficiently minimize model size while maintaining detection accuracy. While these studies focus on improving the detection accuracy of track components, they largely overlook the crucial need for automatic defect recognition, resulting in continued dependence on manual inspections.
There has also been considerable research focusing on defective component recognition, including worn and missing fasteners. Feng et al. ( 12 ) introduced a system for defect clip detection using a Line Segment Detector (LSD) and the Structure Topic Model (STM). Guo et al. ( 13 ) and Wei et al. ( 14 ) used YOLACT to devise techniques for detecting and segmenting components such as spikes, bolts, and clips. While these techniques offer potential for analyzing defective components based on shape, they fail to identify missing ones. Wu et al. ( 15 ) introduced the AOYOLO network for rail component detection and surface defect segmentation, capable of detecting missing clips via annotations. Furthermore, models based on RCNN or YOLO have been employed to distinguish between normal, abnormal, and missing clips using annotations ( 16 – 18 ). Su et al. ( 19 , 20 ) worked directly on clip images, initially employing a classifier to differentiate between normal, damaged, and missing clips, and subsequently using a segmentation network to analyze clip shapes. These techniques primarily concentrate on abnormal clips, achieving notable success through classification, detection, and segmentation methods.
However, the railway infrastructure in the United States poses unique challenges given the diverse array of baseplates used to secure a significant number of wooden ties. Each baseplate, distinct in design and purpose, is anchored with various combinations of spikes, bolts, and clips. A system focusing solely on clip defect detection can easily overlook other potential vulnerabilities. Detecting missing spikes and bolts is equally critical and, therefore, reliance solely on clip defect detection methods does not meet the comprehensive demands of track component inspections. Thus, there is a clear need for an advanced automatic track inspection system capable of identifying and analyzing multiple track components, such as spikes, bolts, and clips, beyond the existing focus on clip inspection.
Therefore, to bridge this gap, we introduce a methodology for detecting missing components using the YOLOv8 model ( 21 ) combined with a template matching algorithm. Designed to detect not just missing clips, but also spikes and bolts, the proposed approach provides a comprehensive solution for identifying and addressing missing track components, showing significant potential for enhancing railway safety and maintenance.
This paper is structured as follows: The Methodology section details the architecture, loss function, and application of the YOLOv8 model for track component detection, and then gives an in-depth description of the template matching algorithm for detecting missing components. In the Experiments section, an overview of the preparation and training processes for the YOLOv8 model is provided, followed by a comparative analysis of its detection results against other state-of-the-art models. Then, the performance of the template matching algorithm for detecting missing components is evaluated. Finally, the Conclusions section summarizes our findings.
Methodology
YOLO-v8 Network Architecture
Ultralytics introduced YOLOv8 in January 2023, marking a significant enhancement from its predecessor, YOLOv5 ( 22 ). Based on the official documentation and source code, key upgrades in YOLOv8 include a new backbone network, an innovative anchor-free detection head, and corresponding new loss functions.
As shown in Figure 1, YOLOv8 alters the YOLOv5 backbone by replacing the C3 modules with C2f modules. The C2f integrates principles from the Efficient Layer Aggregation Network (ELAN) ( 23 ) into the C3 module. This modification not only enhances the gradient information flow but also significantly reduces the number of parameters. The outcome is a substantial performance boost coupled with diminished latency. The spatial pyramid pooling fusion (SPPF) module, present in both YOLOv5 and YOLOv8, aims to eliminate the need for a fixed input image size, thus considerably improving the generalization capability of the model. The SPPF can be considered an enhanced version of Spatial Pyramid Pooling (SPP) ( 24 ), with an emphasis on optimizing processing speed.
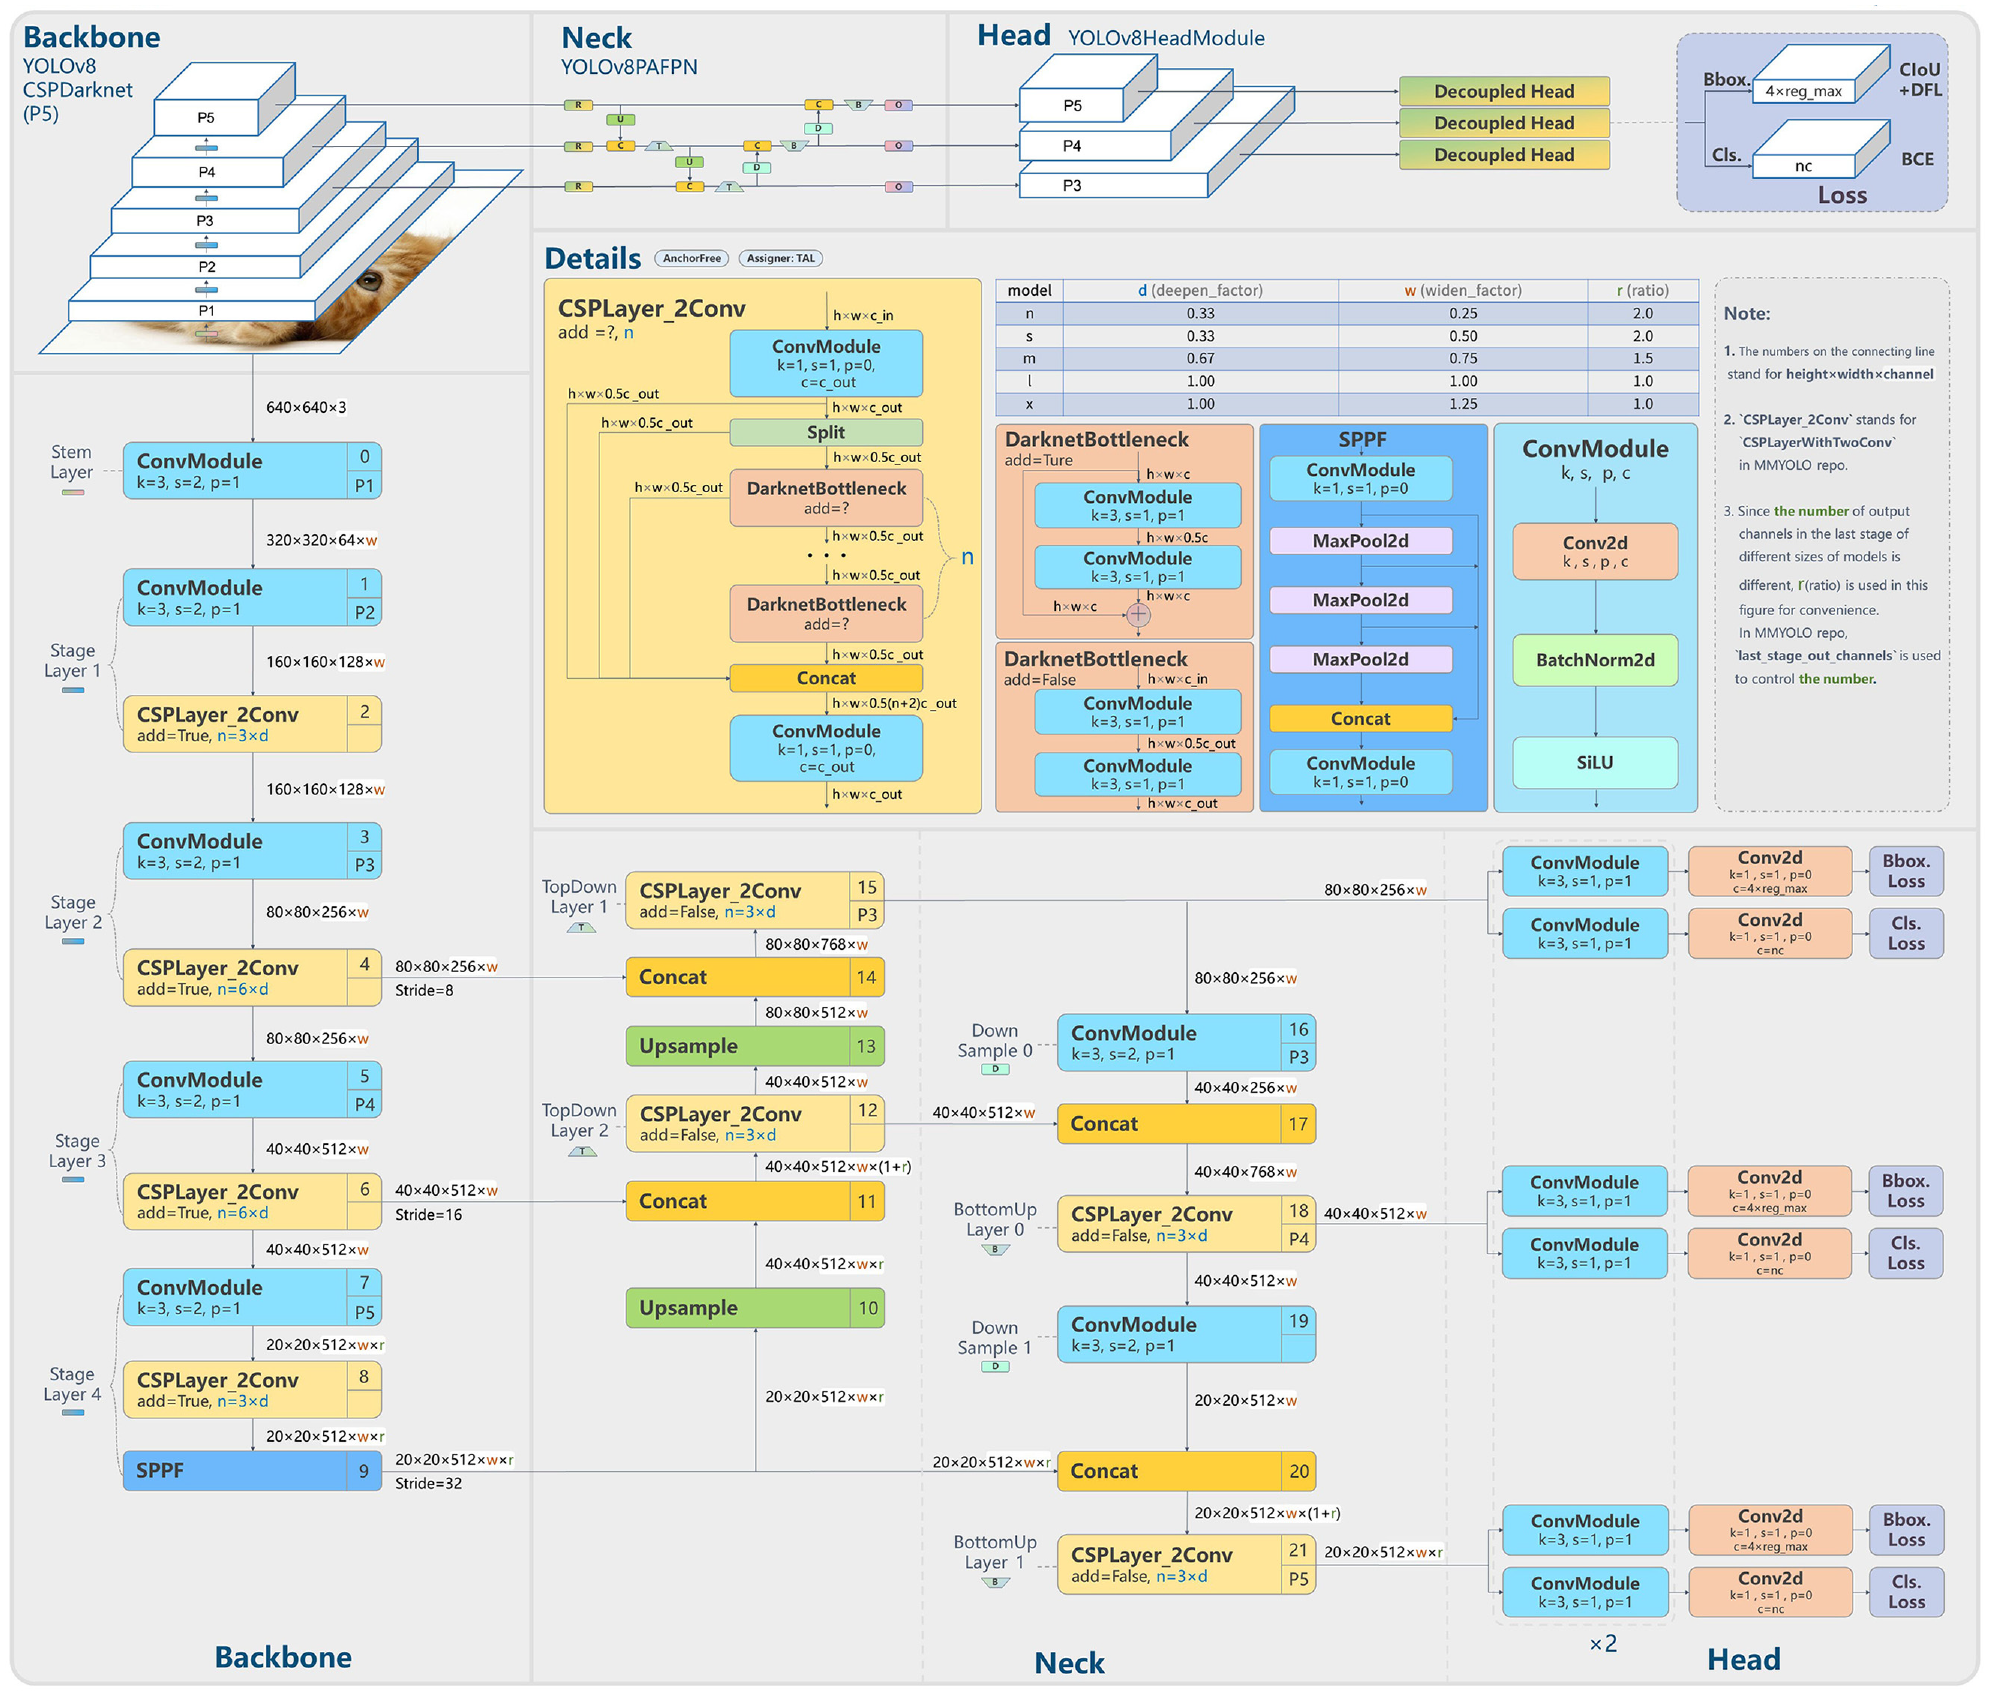
YOLOv8 network architecture ( 21 ).
The most distinctive innovation is evident in the head module of YOLOv8. Its design has transitioned from the anchor-based approach in YOLOv5 to an anchor-free methodology. In this novel anchor-free detection head, each pixel directly predicts the relative offset of the top-left and bottom-right coordinates, in contrast to the traditional method, which predicts the offset from a predefined anchor box. Additionally, YOLOv8 decouples box prediction and classification into two branches. This segregation significantly reduces the joint learning stress previously placed on the coupled head for both tasks, resulting in a substantial performance improvement.
YOLOv8 has two loss functions for box regression. They are the Intersection-over-Union (IoU) loss and Distribution Focal Loss (DFL). The IoU is a metric commonly employed in object detection to measure the overlap between two bounding boxes. Given the predicted box
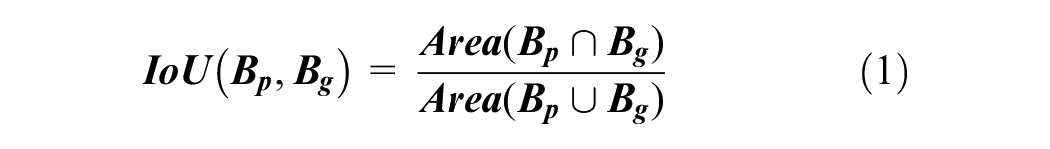
where

The DFL ( 25 ) has been introduced to enhance the accuracy of bounding box localization. Building on the traditional focal loss, the DFL introduces a methodology tailored for continuous labels represented in probability distributions.
For any given bounding box, the target
By leveraging the idea that a continuous number can be depicted through a discrete distribution, DFL becomes an efficient tool to fine-tune these probability distributions. The optimization formula for DFL is expressed as:


where
In a nutshell, given a target value, DFL fine-tunes the left and right bins by adjusting their respective weights.
YOLOv8 for Railroad Track Components Detection
In this study, the YOLOv8 model was employed for the detection of railroad track components. The primary modification we made to the original framework was in the number of output classes. The standard YOLOv8 is trained on the COCO data set, which includes 80 classes, while the track inspection application in this study, as illustrated in Figure 2, only requires the model to recognize four classes: baseplate, clip, spike and bolt, and the installation hole for spike and bolt.
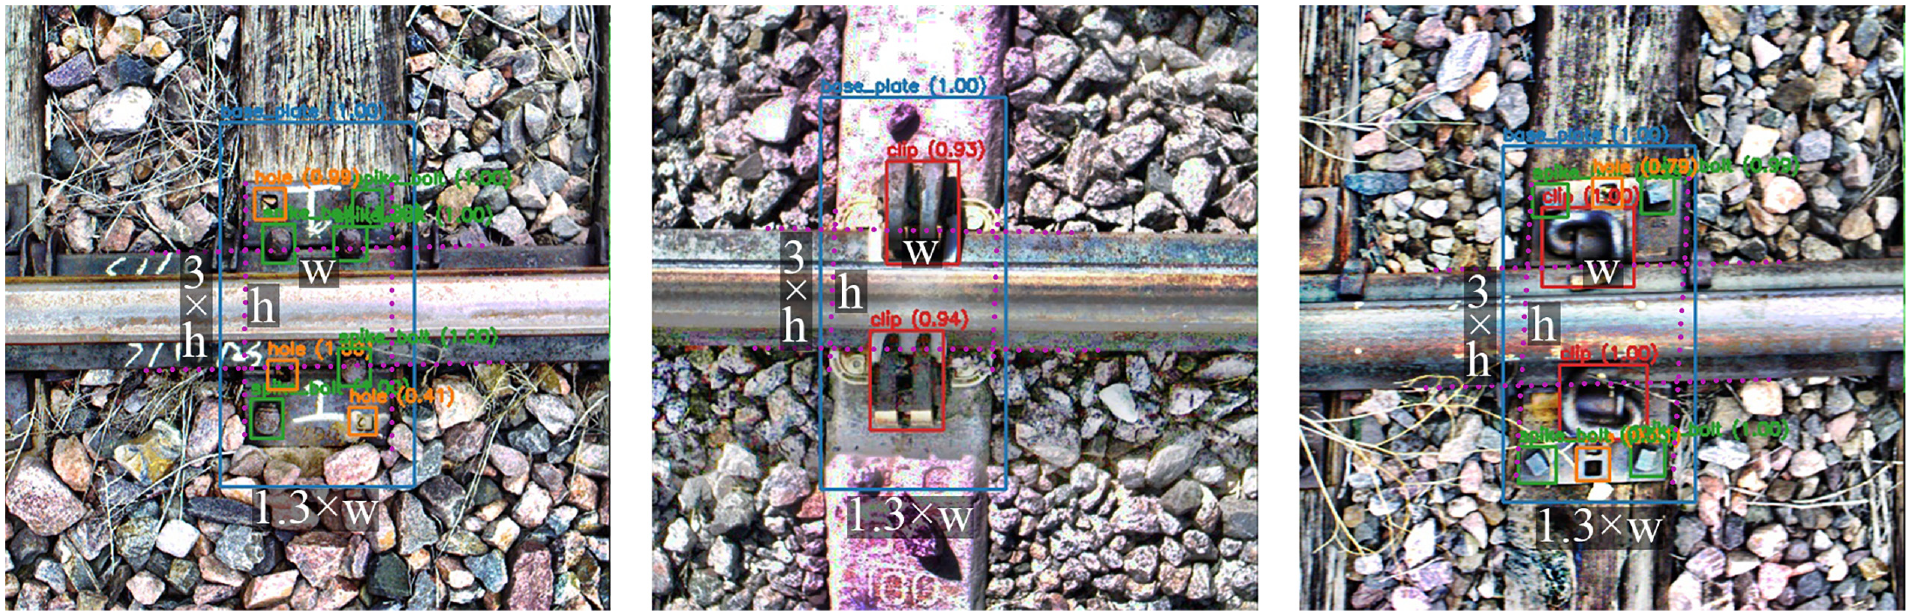
Model output classes and method to annotate baseplate.
Figure 2 illustrates the variety of clips. For the sake of simplicity, these variations are consolidated into a single category. Distinguishing them would significantly increase both the annotation workload and the algorithmic complexity. Likewise, given their similar appearance and shared role as baseplate anchors, spikes and bolts are categorized together.
Note detection objectives extend beyond merely identifying clips, spikes, and bolts. The model also aims to recognize baseplates and the installation holes for spikes and bolts. The primary goal of this research is to detect missing components within a baseplate. As such, baseplate detection is vital for collating component detections within each one. Additionally, baseplate boxes allow us to filter out incorrect detections unrelated to any baseplate.
The detection of the installation holes for spikes and bolts aids in differentiating between various baseplate types, an important step for identifying missing components which we will discuss further below.
As depicted in Figure 2, baseplates vary in size. Although their widths generally align, their heights can differ. In the following section on baseplate matching, the baseplate will serve as the local coordinate system for detected components. To ensure consistency in the detection boxes for all baseplates, we adopt an indirect approach to annotate the baseplate. Rather than directly marking the baseplate, two horizontal and two vertical virtual lines are generated to identify the four intersections of the rail and the baseplate. These intersections are then expanded to create the baseplate annotation. Because the small box formed by the four intersections maintains a uniform size across all baseplates, it is crucial to ensure this box remains consistent for each baseplate.
Template Matching for Missing Detection
Detecting missing track components based on object detection presents several challenges. First, the wide variety of baseplate types in use, each with its unique installation methodology, means that a simple count of the track components within a baseplate is insufficient to determine if a component is missing. Second, to save costs, not all installation holes for spikes and bolts are used. Accordingly, the presence of an installation hole does not unequivocally signify the absence of a spike or bolt. To tackle these complexities, we introduce a novel methodology in this study for accurately identifying missing components on railway tracks.
Predefined Baseplate Library
Before initiating the formal inference process, it is imperative to establish a comprehensive library of baseplate designs. This library should include as many predefined baseplate types as possible. However, given the wide variety of baseplate designs and their continuous evolution, it is virtually impossible to cover all field baseplate types. Fortunately, our approach is adaptable and allows for the seamless integration of new baseplate designs into our library as and when they emerge.
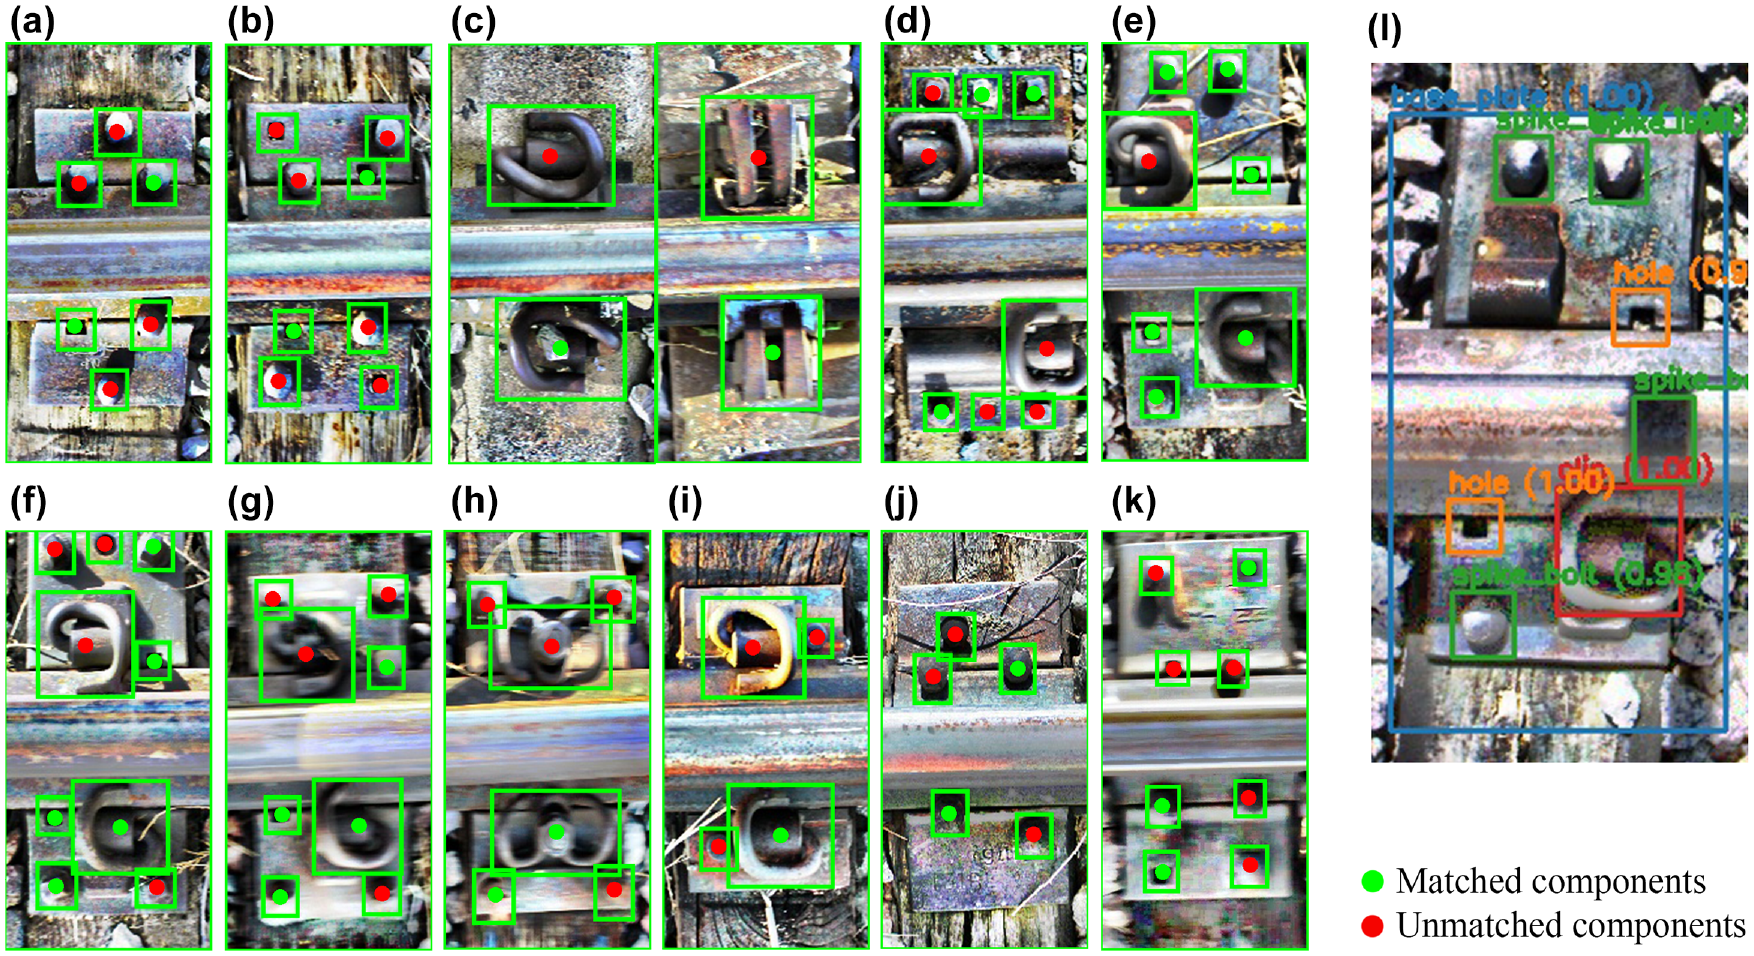
As depicted in Figure 3 and Table 1, 11 distinct baseplate types are predefined in this study. These baseplate images are chosen from the detection results of the YOLOv8 model. The definition of each baseplate is primarily reliant on two essential factors: key points and patterns.
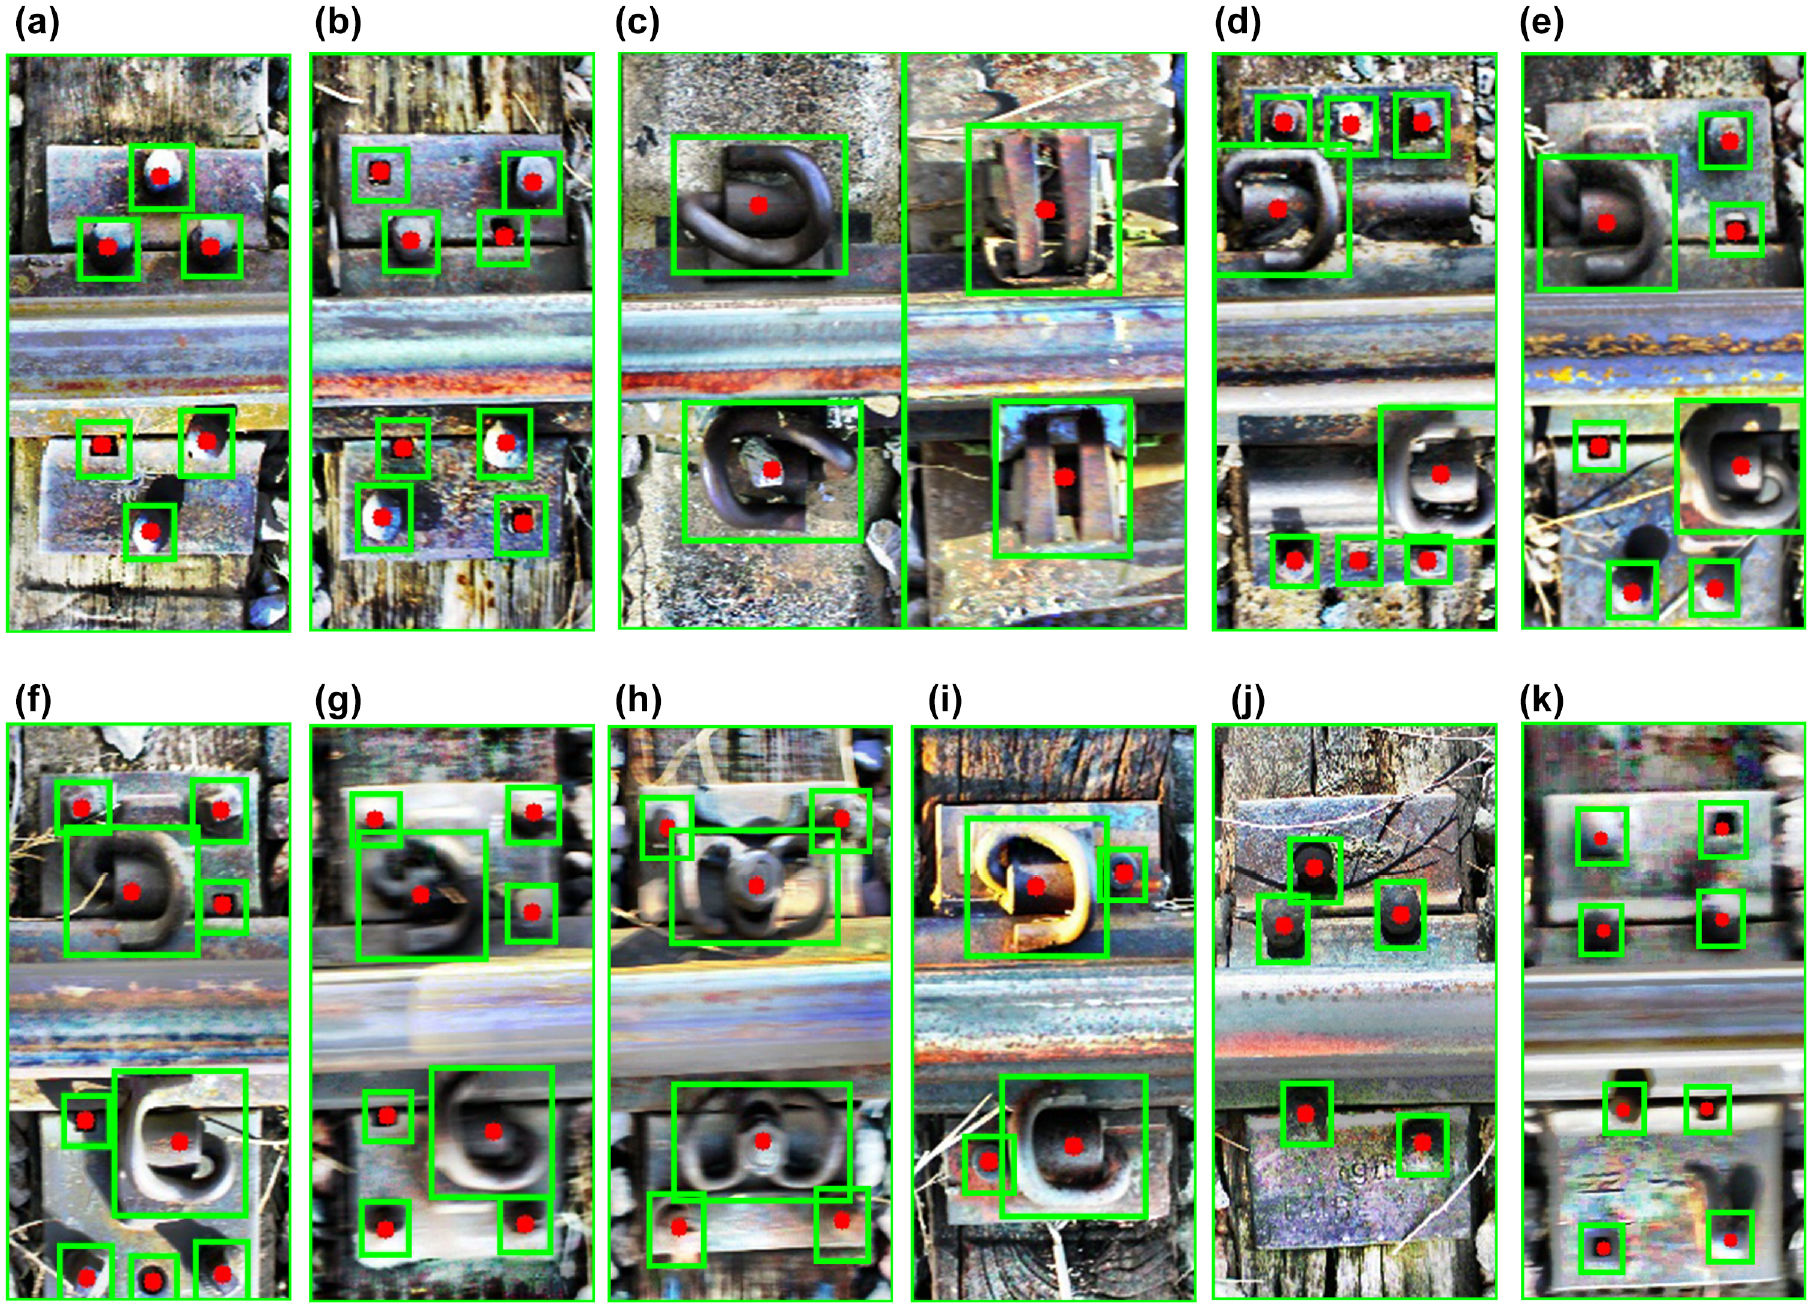
Key points of predefined baseplates: (a) Type 1; (b) Type 2; (c) Type 3; (d) Type 4; (e) Type 5; (f) Type 6; (g) Type 7; (h) Type 8; (i) Type 9; (j) Type 10; and (k) Type 11.
Predefined Patterns of Predefined Baseplates
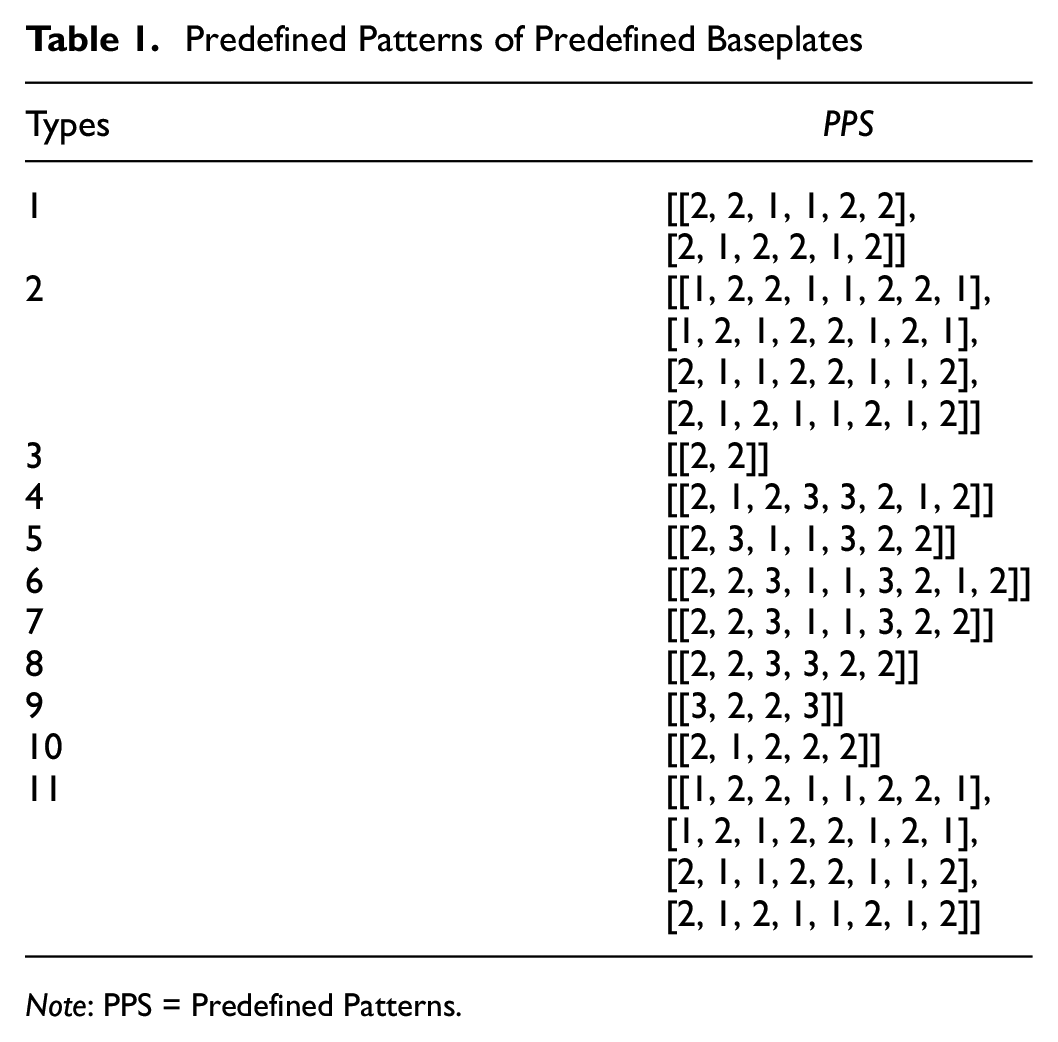
Note: PPS = Predefined Patterns.
The key points, marked by red dots in Figure 3, are the coordinates of the detected components within a baseplate box. They are the center point of the detected boxes of the YOLOv8 model. The key points are denoted as
The centroid of these key points is located at the center of the baseplate box. To enhance the generalizability of the model, the key points are normalized by the height and width of the baseplate box. They are subsequently arranged from left to right, followed by a top-to-bottom sequence.
Table 1 illustrates that the predefined pattern, denoted as
Figure 3 reveals that not all baseplates exhibit lateral symmetry. To simplify the process of defining these unique baseplates, each of them was defined only once. Therefore, during the inference, the key points undergo a 180° rotation to match a corresponding rotated baseplate.
Baseplate Matching and Missing Detection
During inference, the evaluation of each detected baseplate involves two primary steps. First, finding the best matched baseplate in the predefined baseplate library using key points. Second, locating any missed components based on predefined patterns.
Figure 4 provides an example of how a detected baseplate finds its best match within the predefined baseplate library. The model iterates through the key points (
Baseplate matching process: (a) Type 1; (b) Type 2; (c) Type 3; (d) Type 4; (e) Type 5; (f) Type 6; (g) Type 7; (h) Type 8; (i) Type 9; (j) Type 10; (k) Type 11; and (l) current detected baseplate.
It is critical to acknowledge that during the matching process, clip key points can only be paired with detected clips, while key points of spikes, bolts, and their installation holes are exclusively matched with detected spikes, bolts, and their corresponding installation holes. Furthermore, they employ different threshold values (
Following this method, another array is generated, denoted as
Figure 5 demonstrates that once the best match for the currently detected baseplate is found, the pattern
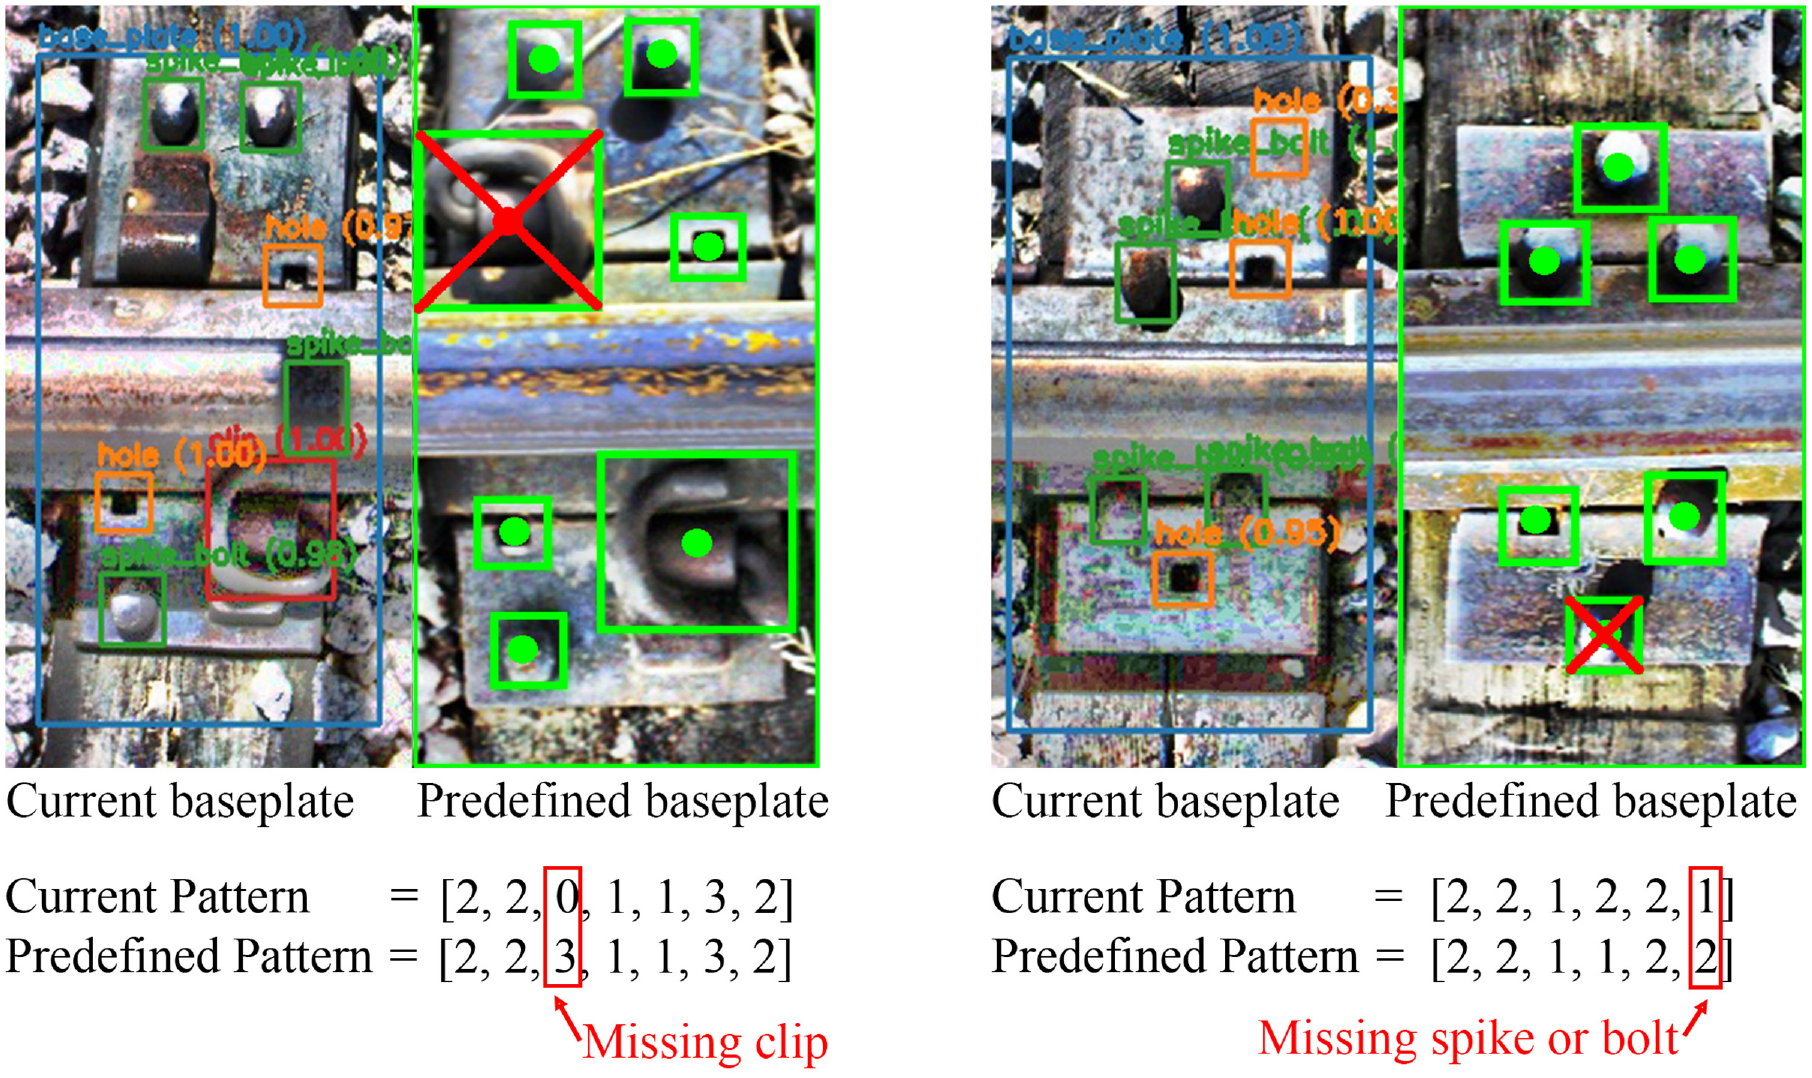
Missing components detecting process.
For each key point
As illustrated in Figure 5, the detected baseplate pattern
Experiments and Field Testing
Test Site and Set-Up
The satellite image from Google Maps, depicted in Figure 6, showcases the two testing sections located at the Transportation Technology Center, Pueblo, CO 81001. Section 1, covering 2 mi, is used for network training. While Section 2, spanning approximately 500 ft, is dedicated to performing a blind test to validate the missing component detection algorithm. To collect the data, industrial cameras, which are readily available on Amazon, are mounted perpendicular to the rails on an Ensco hi-rail truck. These cameras offer a 2K resolution and a maximum frame rate of 59 frames per second (fps). However, for network training and inference purposes, as depicted in Figure 2, the video frames are resized to a 512 × 512 resolution. Moreover, to adjust for variations in lighting, Contrast Limited Adaptive Histogram Equalization (CLAHE) is used as a method of data augmentation to minimize the effects of shadow and different lighting conditions. In the training phase, CLAHE is applied to 50% of the images, while all testing images undergo this enhancement.
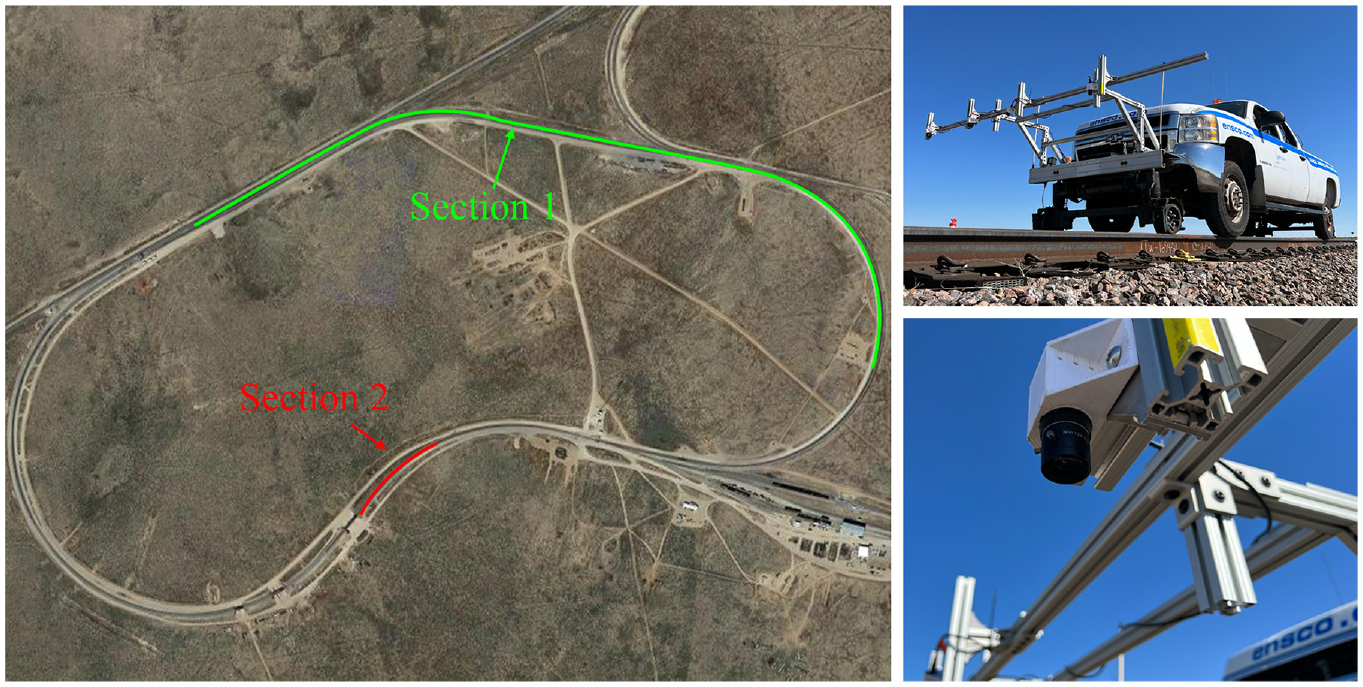
Field testing site and set-up.
Figure 3 shows 11 unique baseplates identified in Section 1. A total of 1,200 images, approximately 100 for each type, are annotated. Of these, 900 images were used for network training, while the remaining 300 were allocated for validation of the training performance. The training model is then deployed into an NVIDIA Jetson AGX Orin Developer Kit and powered by battery for the testing in Section 2. The deployment of the trained model to an edge-computing device is beyond the scope of this paper and details will be shared in a separate publication.
Section 2 serves to blind test the effectiveness of the developed missing component detection algorithm. The primary task of the algorithm is to identify if a detected baseplate has any missing components. With Ensco’s help, track components were altered and the specific location where changes happened were recorded and manually categorized into two groups: “normal” and “abnormal.” The “normal” group comprises 230 images featuring only baseplates in perfect condition, while the “abnormal” group contains 30 images with baseplates missing components or with missing baseplates. For statistical convenience, each test image contains only one baseplate at most. Note the specific changes made by Ensco before the test at Section 2 were not shared.
Evaluation Metrics
COCO Mean Average Precision (mAP) is adopted to evaluate the developed track components detection models. Note mAP is a standard metric for the performance of object detection models. It combines the precision and recall for different thresholds, providing a single score that balances the trade-off between missing true-positive detections and generating false positives.


where
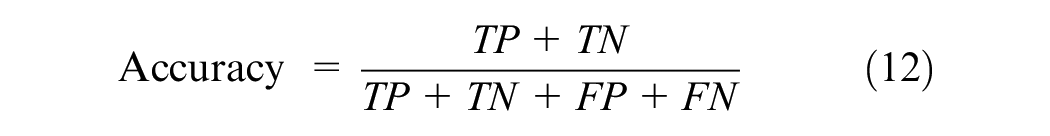
To gauge the effectiveness of the proposed method for detecting missing components, Recall, Precision, and Accuracy are employed as our evaluation metrics. In this study, “positive samples” pertain to baseplates exhibiting missing components, while “negative samples” refer to wholly intact baseplates. Recall assesses the proportion of true-positive samples that are correctly identified, thereby indicating the defect detection rate of our proposed method, as exemplified in Equation 10. Precision, demonstrated in Equation 11, signifies the ratio of identified positive samples that have been accurately classified, thereby underlining the method’s resilience against noise. Accuracy, depicted in Equation 12, reflects the overall success rate of correct classification across all samples.


where
Network Training and Evaluation
The network training was conducted on a computer system equipped with an Intel i9-10920X CPU and a single NVIDIA RTX A6000 GPU. The YOLOv8 network comes in five sizes, ranked from smallest to largest: YOLOv8n, YOLOv8s, YOLOv8m, YOLOv8l, and YOLOv8x. For comparative evaluation, Faster-RCNN and RetinaNet are also trained. Both Faster-RCNN and RetinaNet deploy the Detectron2 framework ( 28 ) with a Resnet-50-FPN ( 29 , 30 ) backbone. The image resolution was maintained at 512 × 512 for both training and evaluation phases.
During the training process, all models were fine-tuned using the AdamW optimizer with a base learning rate of 0.001 and a batch size of 8, for a total of 15,000 iterations. An evaluation was carried out every 1,000 iterations. It is worth noting that Detectron2 determines training duration by the number of iterations, while YOLOv8 models depend on the number of epochs. Given that our training set comprises 900 images and uses a batch size of 8, YOLOv8 models demand 113 iterations per epoch. To facilitate an equitable comparison between YOLOv8 and Detectron2 models, nine epochs are approximated to 1,000 iterations. During the inference stage, the score and IoU thresholds for all models are set at 0.25 and 0.2, respectively.
Figure 7 illustrates the learning curves of various networks, offering a clear visual representation of their training trajectories. Meanwhile, Table 2 provides details on their validation performance metrics, along with their inference speeds. Across all YOLOv8 models, the performance remains relatively consistent, with mAP values consistently around 69%. However, YOLOv8s achieved the highest mAP of 69.509% in the validation set and even outperforms its larger versions, namely YOLOv8m, YOLOv8l, and YOLOv8x. This surprising result could be attributed to the characteristics of larger models. Despite their enhanced learning capabilities, they may be more prone to overfitting, especially when trained on relatively smaller data sets. In contrast, RetinaNet and Faster-RCNN yield mAP values around 64%, which is approximately 5% below that of the YOLOv8 models.
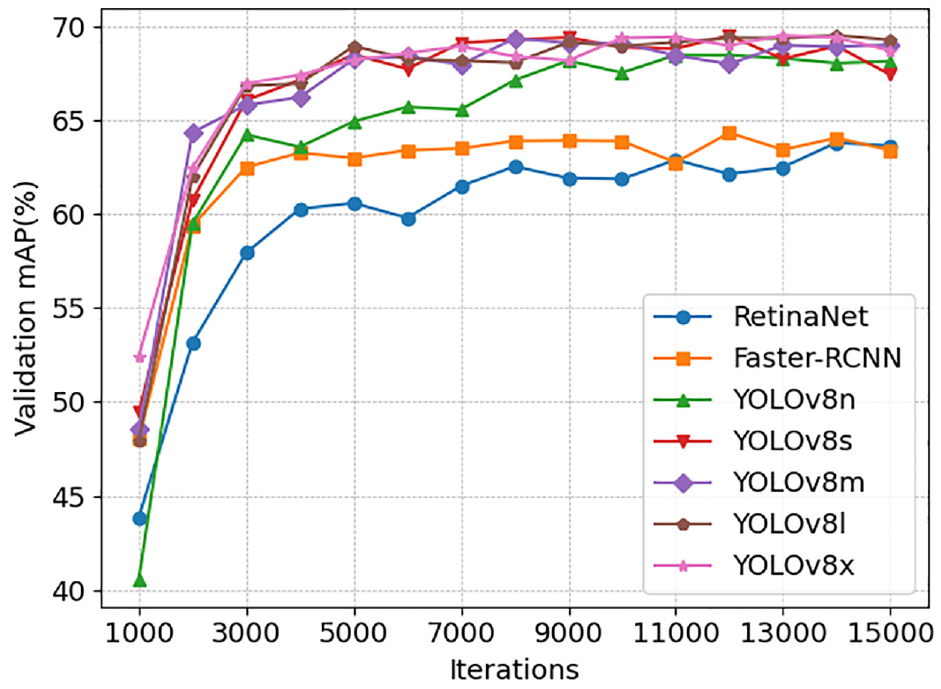
Learning curves of YOLOv8 models, RetinaNet, and Faster-RCNN.
Best Validation mAP and Inference Speed of YOLOv8 Models, RetinaNet, and Faster-RCNN
Note: mAP = mean average precision; RCNN = region-based convolutional neural network; fps = frames per second.
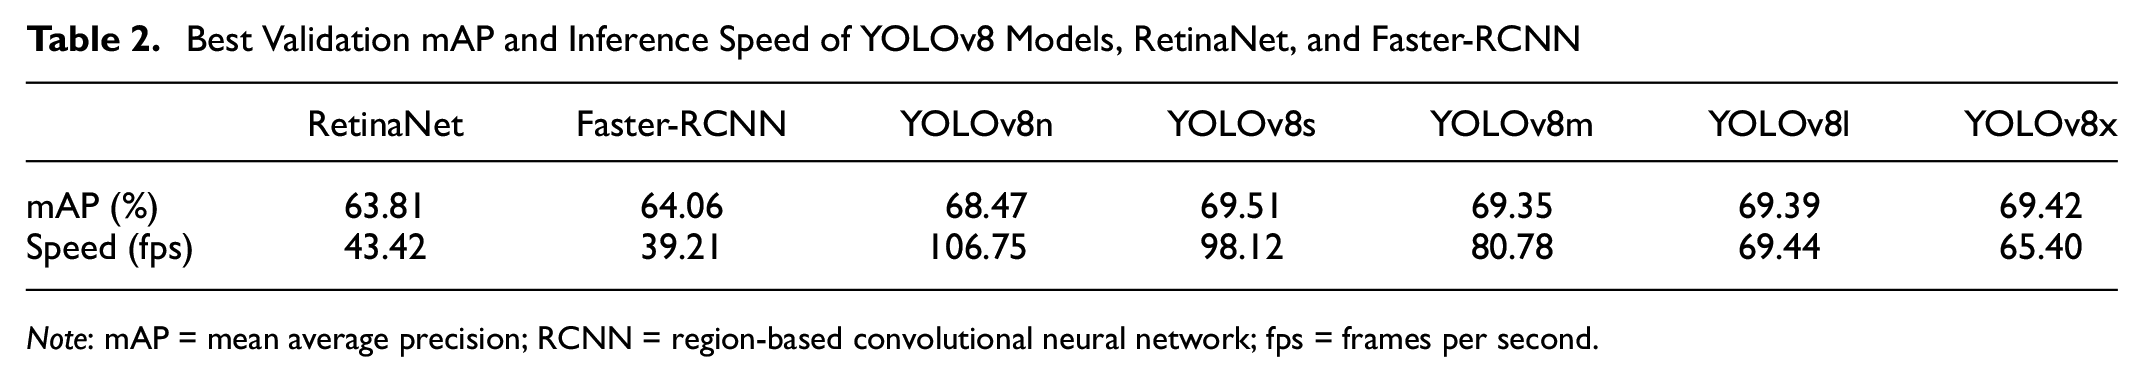
Figure 8 provides sample detections from RetinaNet, Faster-RCNN, YOLOv8s, and YOLOv8x. These models demonstrate good and closely comparable performance across all 300 validation images. They exhibit only minor differences in certain cases, even under challenging conditions. As such, all these models satisfactorily fulfill the requirements for track component detection. On the inference speed, all the YOLOv8 models significantly outperform Mask-RCNN and RetinaNet, while maintaining robust detection accuracy. The largest YOLOv8 model, YOLOv8x, achieves a speed of 65.40 fps, which is 21.98 fps and 26.19 fps faster than RetinaNet and Faster-RCNN, respectively. Considering their superior performance and efficiency, we have selected YOLOv8s, which boasts a 69.51% mAP and an inference speed of 98.12 fps, for further testing in the subsequent section.
Example components detection results (from left to right: RetinaNet, Faster-RCNN, YOLOv8s, and YOLOv8x).
Template Matching for Missing Detection Results
This study proceeds with using YOLOv8s to detect missing components using the proposed template matching algorithm. The test data set consists of 230 normal images featuring intact baseplates, and 30 abnormal images exhibiting baseplates with missing components. Such a skewed distribution is likely to be more noticeable in real-world scenarios, as missing components would be rare under proper maintenance. Given this detection challenge, Recall is deemed the most crucial metric for evaluating performance.
Table 3 reveals that the template matching approach successfully detected 27 out of 30 defective baseplates, yielding a Recall of 90%. This demonstrates a strong rate of detection for missing components. Despite the skewed distribution of the data set in Section 2, the proposed method displayed remarkable resistance to noise, accurately classifying the majority of positive and negative samples and attaining an impressive accuracy of 90.77%.
Template Matching Performance in Components Missing Detection
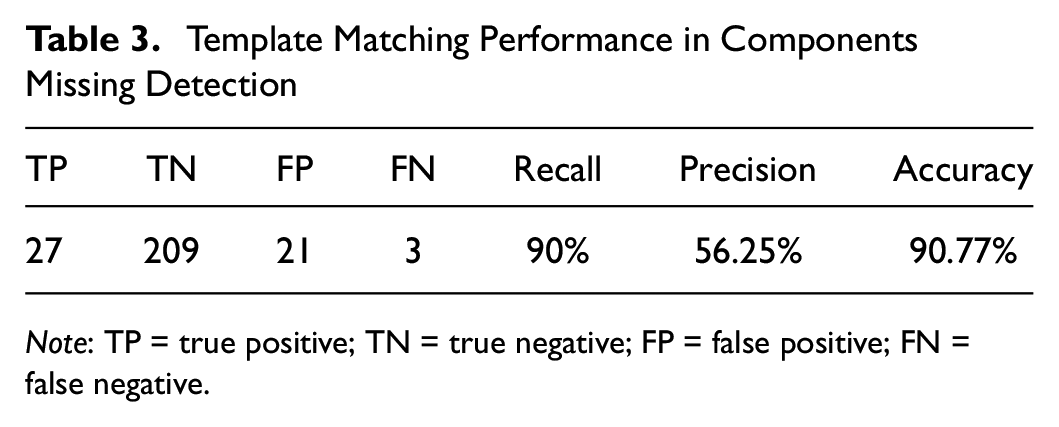
Note: TP = true positive; TN = true negative; FP = false positive; FN = false negative.
The implementation of the template matching method substantially reduces the labor required for component inspection. Before this method, staff had to painstakingly analyze all 260 images, a process that was time-consuming and prone to human error. Conversely, the proposed method flagged 27 true positives and 21 false positives, resulting in a precision of 56.25%. This indicates that over half of the flagged detections are genuinely defective baseplates. Subsequently, staff members only need to inspect these 49 flagged images, resulting in a significant reduction in labor costs.
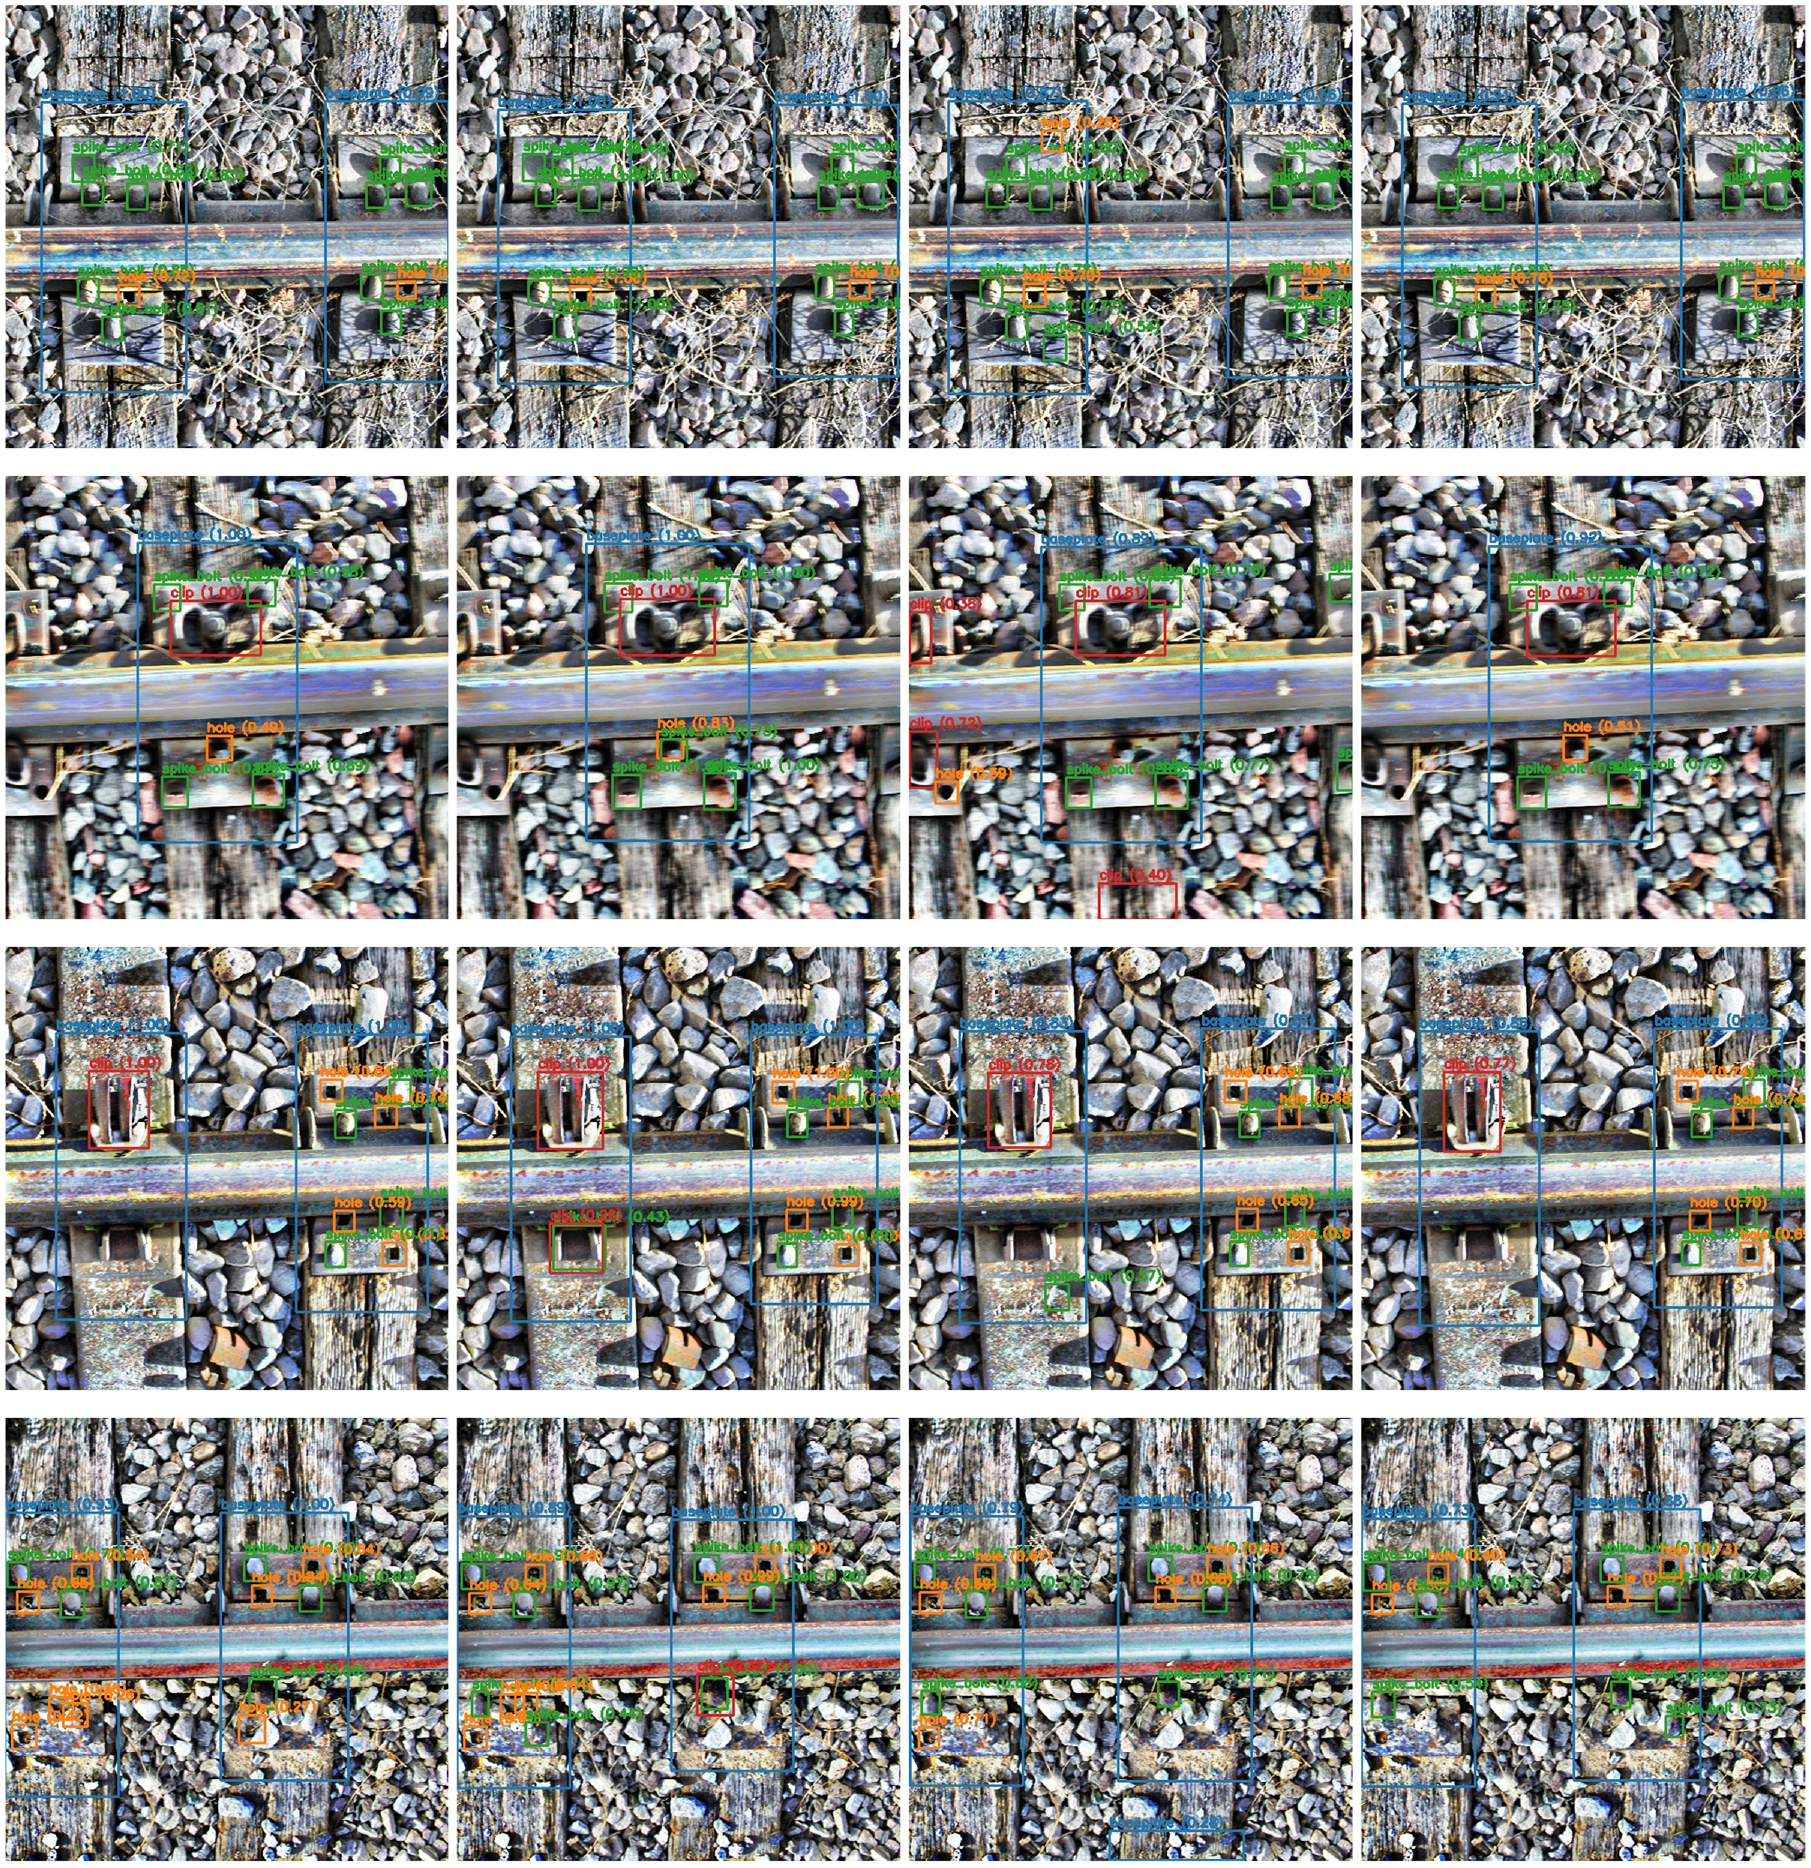
Figure 9 presents a variety of detection results using the template matching method. Given the superb detection capabilities of the YOLOv8 model, the proposed method shows substantial competency in detecting missing components across the majority of test images. It can even determine the exact number and location of missing components and reliably identify a missing baseplate. However, in complex real-world scenarios, models such as YOLOv8, along with other object detection algorithms, may not consistently maintain this level of performance, causing the template matching method to produce errors. Note that only 900 annotated track images were used in training the model and the field inference test was performed with an edge-computing device. Future endeavors should focus on diversifying the data set and enhancing image variety to fortify the robustness of detection models.
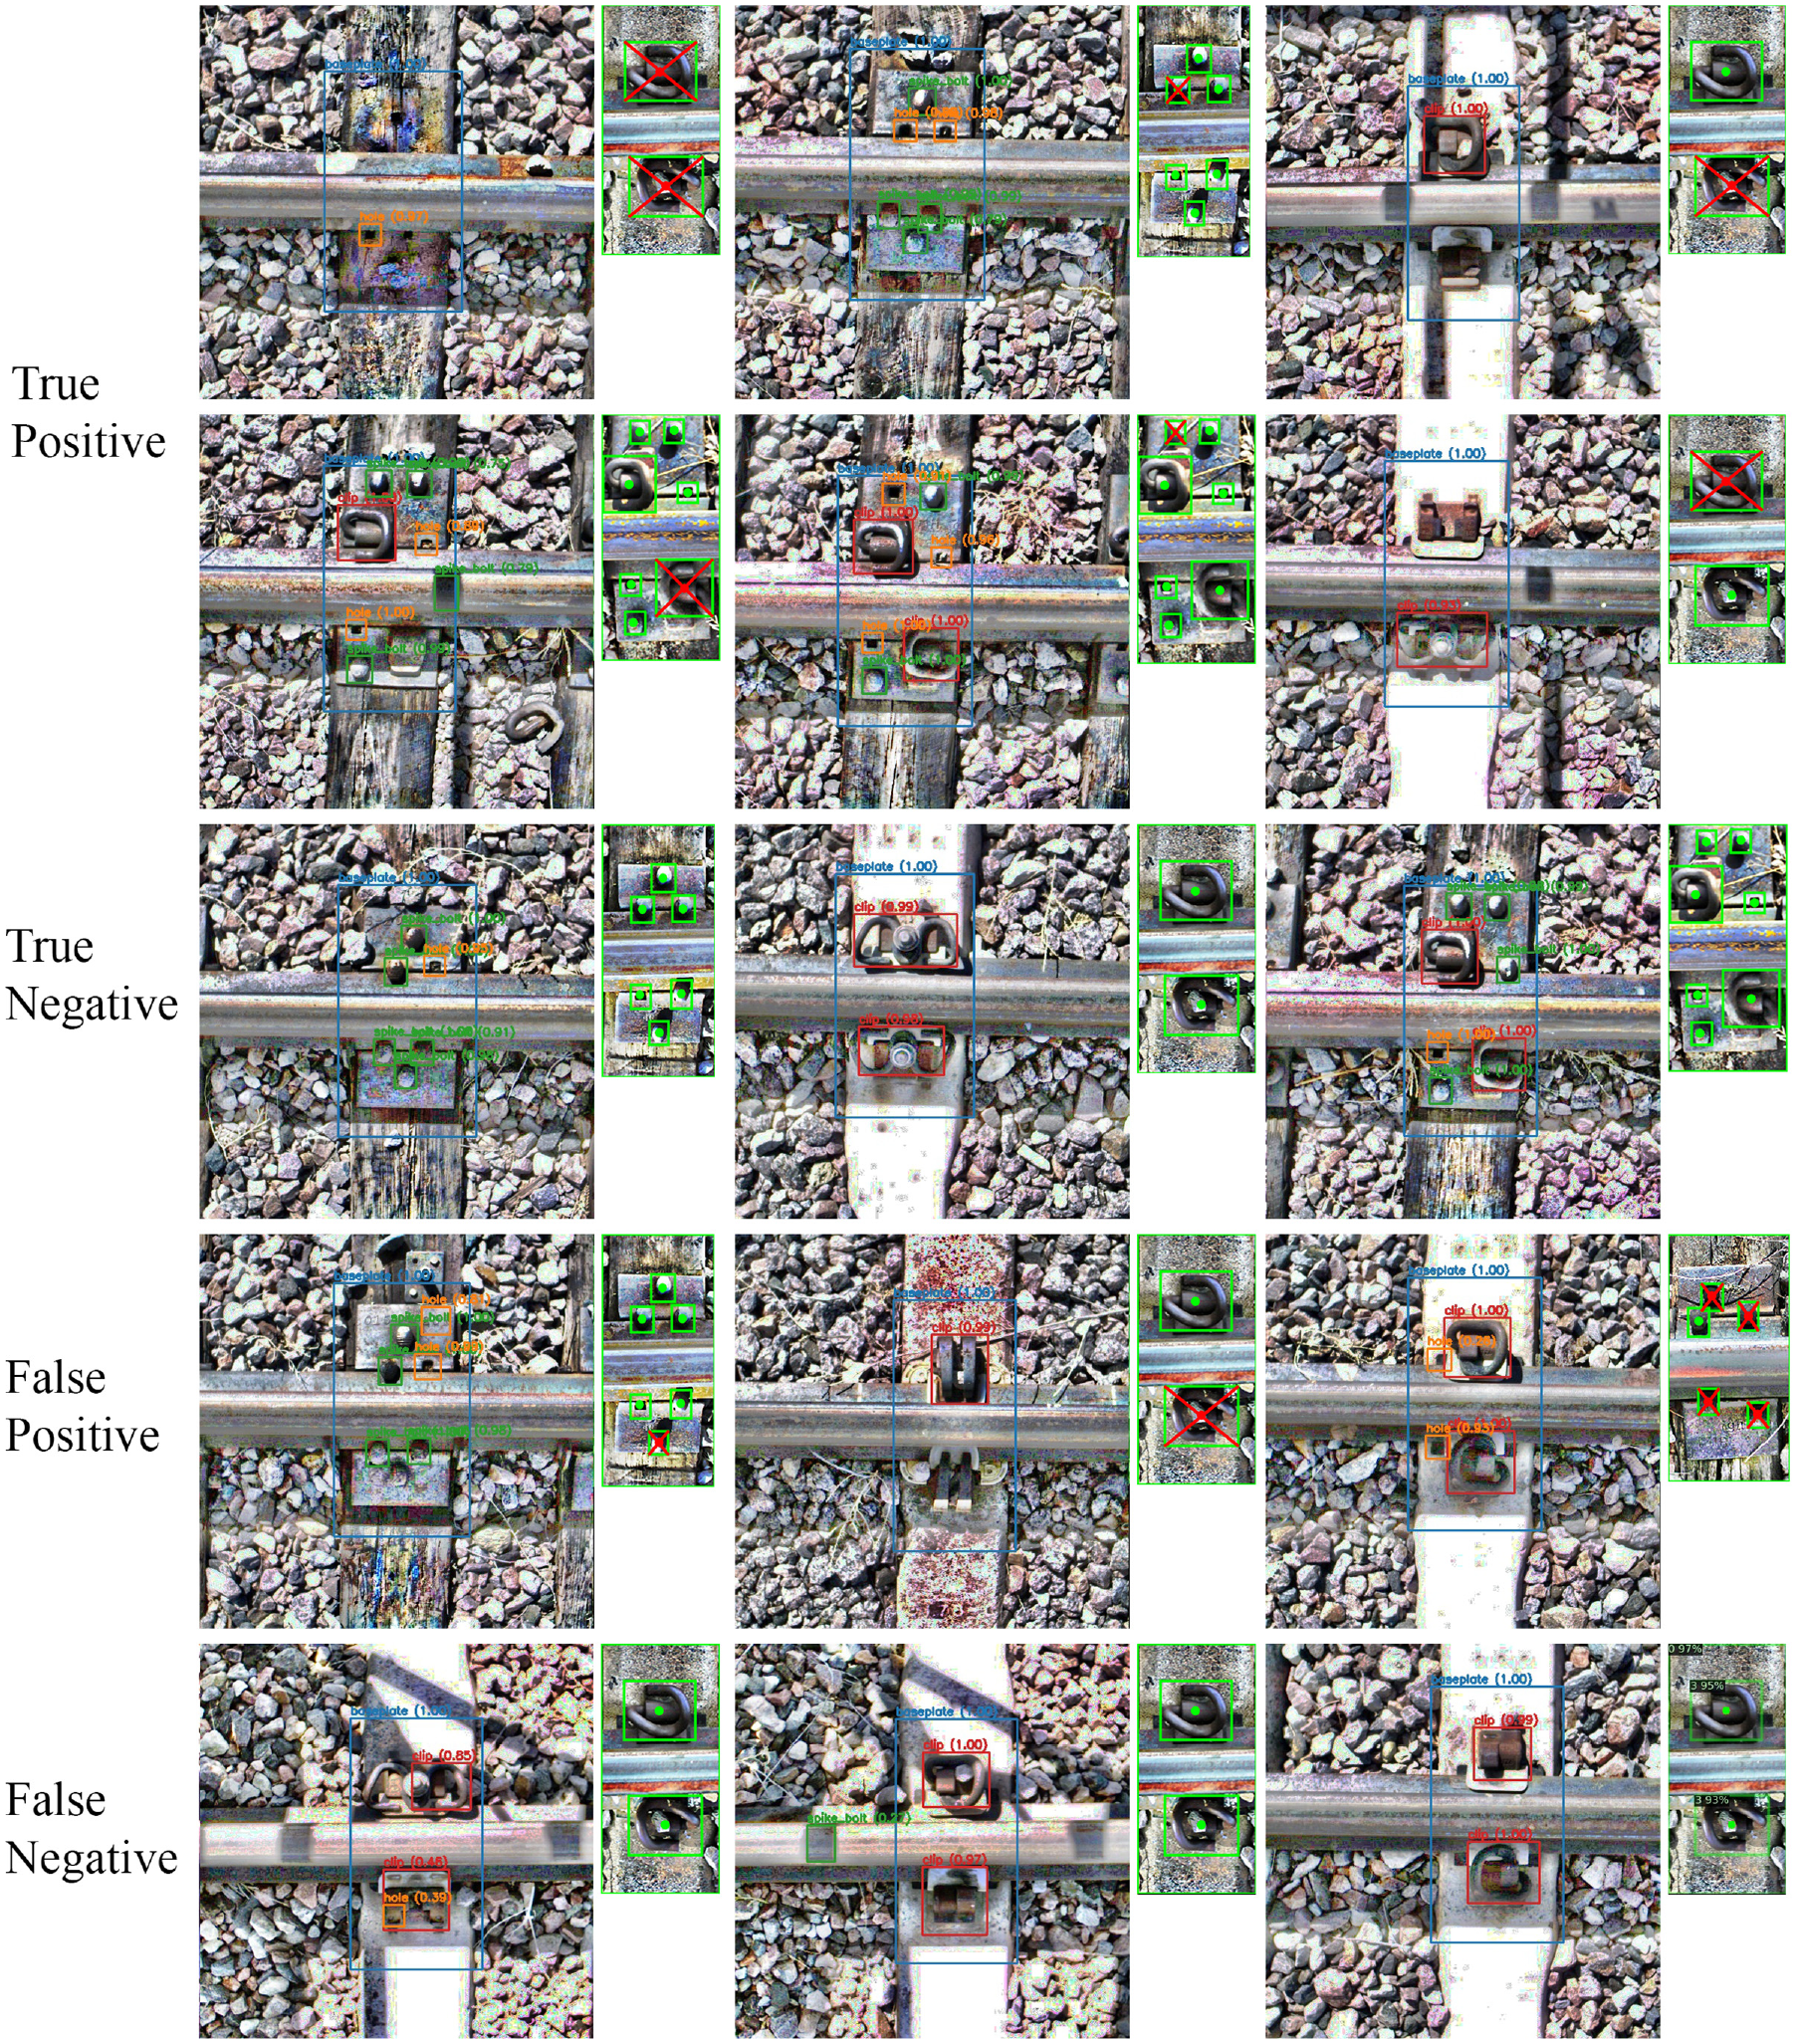
Example components missing detection results using template matching.
Concluding Remarks
This study presents a novel method for missing component detection, leveraging the state-of-the-art object detection model, YOLOv8, in conjunction with a tailored template matching algorithm. This system proves proficient in identifying not only absent clips but also missing spikes and bolts. The proposed method functions in two stages: identify the track component configuration based on baseplate and present components and identify any missing components.
The developed model was trained with a very limited number of track images (900 in training and 300 in training validation) and reached reasonable performance in field blind test for missing component detection. Specifically, the chosen YOLOv8s models, boasts a 69.51% mAP and an inference speed of 98.12 fps on the A6000 GPU. If each image covers the distance between two railroad ties, approximately 0.6 m, then the inference speed of 98.12 fps enables the camera to move at inspection speeds exceeding 200 km/h. This speed meets the requirements of most track inspection platforms. The rapid inference rate allows for immediate processing of images, eliminating the need to store them and thus facilitating real-time track inspection.
In the experiment of the missing components detection, the template matching method achieved a Recall of 90%, indicating a robust capability to identify missing components. Despite the uneven distribution of the data set, the proposed method demonstrated remarkable noise resilience and achieved an accuracy rate of 90.77%. From a practical perspective, the template matching technique significantly curtails labor costs associated with component inspection.
The accuracy of the template matching method heavily depends on the robustness of the YOLOv8 detection model. It observed a precision of 56.25%, with 27 true positives and 21 false positives. To enhance the precision of this method, future research should concentrate on improving the detection model, for instance, through architectural innovations and expanding the training data set.
This paper focuses primarily on the template matching method for detecting missing components. The development of an inference pipeline for edge devices is not included but will be addressed in our forthcoming publication. We plan to explore optimization techniques such as model quantization, acceleration using TensorRT, and multi-processor acceleration.
In conclusion, this innovative approach capitalizes on the capabilities of the YOLOv8 object detection model and a template matching algorithm. This combined strategy provides a potential ultra-portable and cost-effective solution to detect and address missing track components, offering significant potential for advancements in railway safety and maintenance.
Footnotes
Acknowledgements
The South Carolina Railroad Museum, ENSCO Rail, and MxV Rail have provided tremendous help during field data collection and field testing.
Author Contributions
The authors confirm contribution to the paper as follows: study conception and design: Youzhi Tang, Yi Wang, and Yu Qian; data collection: Youzhi Tang; analysis and interpretation of results: Youzhi Tang, Yi Wang, and Yu Qian; draft manuscript preparation: Youzhi Tang, Yi Wang, and Yu Qian. All authors reviewed the results and approved the final version of the manuscript.
Declaration of Conflicting Interests
The author(s) declared no potential conflicts of interest with respect to the research, authorship, and/or publication of this article.
Funding
The author(s) disclosed receipt of the following financial support for the research, authorship, and/or publication of this article: This research is funded by the Federal Railroad Administration (FRA) Grant number: 693JJ621C000011.
The opinions expressed in this article are solely those of the authors and do not represent the opinions of the funding agencies.