
Abstract
In this study, we introduce a method to optimally select the crossover locations of an independent rail line from a set of possible crossover locations considering a fixed number of crossovers that must be used in the design. This optimal selection aims to minimize the cost of passenger delay. Previous research showed that including passenger delay in the decision of rail design choices could be beneficial from economic and societal perspectives. However, those studies were only able to evaluate a few alternatives, because the degraded schedules had to be determined manually. In this research, we introduced an integer nonlinear model to find the best crossover design. We further developed an algorithm to evaluate a set of crossovers and determine the cost of delays for all segments on a rail line given a set of potential disruptions. The monetized cost of passenger delays was used to analyze the tradeoff between the unreliability costs emerging from the delay of passengers in the case of disruptions, and the total number of required crossovers. Our model was applied on a light rail line in Bergen (Norway) resulting in 10% reduction in relation to passenger delays without increasing the number of crossovers; thus, ensuring that there were no additional costs.
Keywords
Rail transport is becoming increasingly important in many countries. Owing to the increase in train travelers, increasing numbers of trains operate on the same infrastructure ( 1 ). This results in a smaller headway among successive trains and, thus, unexpected events, such as a switch failure, might have a significant impact on rail operations. An unexpected event, for example, may cause severe delays to a significant number of travelers. Because of this pressure, rail infrastructure managers strive to minimize the total impact of service disruptions. One possible action is to design the infrastructure in a reliable manner by installing a limited number of risky rail parts (e.g., level crossings and switches), and by placing those parts at optimal locations to ensure sufficient detour possibilities. To provide an indication of the failure probability of different elements, Moridpour and Hesami, using data from Melbourne, Australia, showed that more than 12% of crossings, 8% of crossovers (pairs of switches), and 3% of straight track segments exceeded their maintenance limit within a 4-year period ( 2 ). Because of operational pressures, it is of paramount importance to design railway infrastructure with an optimal number of crossovers, tracks, and level crossings and the ensure the placement of risky rail parts at optimal locations.
This study focuses on the optimization of crossovers on a independent, double-track rail line. These simple rail lines do not have the option to reroute vehicles via another part of the network. There is only one option when operating the line in the case of disruptions: splitting the line into two circuits. The best method to split the line depends on the locations of the crossovers and of the disrupted track part. An example of a degraded mode on an independent, double-track rail line split into two circuits is shown in Figure 1. In relation to terminology, a crossover is a pair of switches that connects two parallel rail tracks, allowing a train on one track to cross over to the other. A switch or turnout is a mechanical installation enabling railway trains to be guided from one track to another. The term crossing is also used to indicate the common point of two rails.

Example of an alternative operation schedule in the case of disruption.
In this paper, we introduce a method to determine the circuits that emerge in the case of a disruption. This research aimed to develop a decision support model to determine the optimal placement strategy for several crossovers.
The location and number of crossovers are optimized by minimizing passenger delay considering the possible disruptions that typically appear in the network. To this end, an algorithm was developed to determine the best degraded schedule for all disruption scenarios. In this work, the reliability cost of a rail line was the total monetized cost of delay, which was defined as the difference between the scheduled and actual travel time for all passengers. In an optimal design, the purchase and maintenance costs of an extra crossover should be justified by the benefits of improved reliability in the case of disruptions. Multiple performance indicators from previous research are used to evaluate the suggested designs and to compare them to the actual design.
The remainder of this study is structured as follows: we first review the past literature and detail the contributions that our work affords. Second, the methodology of our study is presented. Third, the results of our case study concerning a light rail line in Bergen (Norway) are described. Finally, the conclusions and recommendations of this study are provided.
Literature Review
In this literature review, we first present the state of the art for indicators that assess disturbance impact on rail networks. After that, we review infrastructure design methods and highlight the tradeoff between infrastructure cost and flexibility. This clarifies the benefit of including passenger delay in the design choices of rail projects. The literature review ends by detailing the contribution of our work.
Disturbance Impact on Public Transport Networks and the Role of Crossovers
The impact of disturbances on public transport (PT) operators can be analyzed by treating the service timetable as a variable and incorporating the delays in the performance measures ( 3 , 4 ). In a more holistic approach, Quaglietta and Punzo applied the Sobol variance-based method to identify a configuration of the infrastructure components (e.g., number of rail tracks) and the operational schedule to improve different key performance indicators, such as the level of capacity, the punctuality of the service, and energy savings ( 5 ). These planning approaches strive to consider the impact of disturbances on the long-term performance of the transportation system. Corman and D’Ariano evaluated several adaptation strategies to respond to travel time and delay propagation because of disturbances (e.g., cancellation of services, rerouting, and shuttles) ( 6 ). In particular, the concept of bus bridging as an effective measure during rail disturbances has been investigated in several past studies ( 7 – 11 ). Of particular interest is the work of Pender et al. that investigated the importance of rail crossover placements to the supporting bus services that can be used for bridging ( 8 ).
Disturbances in PT networks can be caused by recurrent or nonrecurrent events. Recurrent events occur because of normal PT demand variations, different driver behaviors, traffic signals, and so on. It is not possible to use crossovers to reduce the delay impacts of these variations. Nonrecurrent events occur from failures of an infrastructure component, failures in operator service, irregular demand fluctuations, bad weather, incidents, roadworks, and public events ( 12 – 16 ). Nonrecurrent disturbances reduce infrastructure availability and lead to adjustments in the supplied PT services. Crossovers might help to reduce the disturbance impact of nonrecurrent disruptions because they can facilitate the deployment of flexible schedules on the rail network.
To determine the disruption probability of a rail segment for nonrecurrent disruptions, it is important to know the frequency of breakdown of rail infrastructure components and the duration of these disruption events. These two combined are called exposure ( 17 ). The frequency and duration of disruptions are factors that determine risk in a railway line. In rail networks, signal, switch, and power supply failures are the most critical infrastructure disruption components ( 18 ). However, a lot of disruptions are caused by noninfrastructure-related disturbances such as suicide attempts, vehicle breakdowns, and blockages. Existing research has used historical data from a set of disruption events to predict disruption probability and duration distributions ( 18 , 19 ). When a link on a rail network is blocked, an alternative schedule can be used to circumvent the disrupted link. However, the possibility of implementing an alternative schedule depends on the availability of links in the network (e.g., if we have more switches, there are more possibilities for implementing alternative schedules). Thus, to increase alternative schedule options, operators can use additional crossovers.
When a disruption occurs, there is a transition phase before a disruption-tailored timetable can be operational (e.g., vehicles and drivers have to be moved to particular locations) ( 20 ). This process of disruption schedules and transition phases is called the “bathtub” model. While the bathtub model is widely known and used to conceptualize traffic states during disruptions, only limited research efforts have been devoted to analyzing and modeling railway disruption management. Ghaemi et al. provide a review of rescheduling models for disruptions, and conclude that only a few studies consider all three phases (namely, the first phase is the transition plan from the original timetable to the disruption timetable, the second phase is the disruption timetable, and the third phase is the transition plan from the disruption timetable to the original timetable) ( 21 ). The transition phases are often neglected when the network is small and service frequencies are high.
Generally, PT operators prefer extra travelers to bolster their revenues. Van Loon et al. showed that small reliability improvements on some lines in the Netherlands were able to increase ridership by 10% ( 22 ). Because of the importance of reliability, one might wonder why railway designs do not have as many crossovers as possible to increase network flexibility in the case of disruptions. The main reason is that crossovers are also vulnerable: they break down often, and their purchase and maintenance costs are high.
Modeling the Tradeoff of Infrastructure Cost and Flexibility
To tackle the aforementioned tradeoff of crossover flexibility versus cost, research has investigated the usefulness of crossovers in rail networks. During a network’s design, one could consider removing a crossover or placing it at a different location. Asset management studies are often used to determine the crossover cost factor of the aforementioned tradeoff. However, there is a lot of variation in these costs. Crossover-related costs depend on several factors, such as network design, maintenance frequency, operation schedules, and rolling stock properties. Therefore, complex models are needed to calculate these costs.
The costs and benefits in relation to network flexibility when we add crossovers are also difficult to calculate. Costs could be addressed from a passenger point of view (demand side) or a railway manager point of view (supply side). Concerning the supply side point of view, there are several network connectivity indicators linked to the design of crossovers ( 23 ). Nieminen proposed a connectivity indicator that simply counts the number of direct connections to the node ( 24 ). Another supply-based approach to evaluate the benefits of a crossover is to count the number of times that the crossover is used per year in disruption schedules ( 25 ).
Previous research can also determine the impact of disruptions on infrastructure networks by addressing the reliability of a rail network. Zhang et al. investigated the contribution of a node to network connectivity to calculate the cost of disruptions by using the repair cost, other disruption costs, and lost ticket sales ( 26 ). More advanced studies calculated the impact on all vehicles in the network ( 27 – 31 ). Another way to express the impact of disruptions is to calculate the percentage of vehicle schedule deviations within a certain bandwidth. Using this method, only trains delayed more than a predetermined number of minutes are considered to be delayed. This could be monetized by giving a penalty to those trains. When assuming that the examined period is homogeneous (for instance, peak hour on working days in a month), the passenger demand pattern on the line is fixed and all passengers can board the first arriving vehicle, passenger waiting times can be defined as half the headway ( 32 – 36 ). Assuming this, delays can be calculated for networks with multiple lines, as in research undertaken by Landex and Nielsen ( 37 ). More specifically, Landex and Nielsen modeled train delays with simulations for a network with four rail lines by excluding the rerouting choices of the passengers (e.g., passengers wait until the train moves again) ( 37 ). However, the disruption impact depends on the rescheduling options for passengers. In addition, the number of affected passengers is important. Therefore, standalone supply-based research is not the most unbiased option to assess the performance of rail line designs.
Research has also included passenger-based indicators to investigate the tradeoff of crossover placement (e.g., a possible way of addressing the tradeoff is by summing the impact of disruptions to all passengers [26, 35, 38–41]). Considering the impact of a disruption to all passengers requires more data, but it is a fairer way of assessing the reliability impact. Under this consideration, higher priority is placed on increasing the design flexibility for areas with more travelers, which means that the total societal and economic benefits are higher.
In a railway network reliability study, Yap et al. addressed the tradeoff of crossover flexibility versus -cost, by calculating the total delay cost for all passengers ( 19 ). To consider the tradeoff between purchase/scheduled maintenance costs and the unreliability impact, Yap et al. compared the unreliability costs to the life cycle costs of a railway project via a cost–benefit analysis ( 19 ). The vulnerability of the links was modeled using a Monte Carlo simulation. The objective function included investment costs, reduced comfort costs, costs for unserved demand, and cancellation costs. Tahmasseby et al. used more advanced factors by using an objective function with the following cost factors: travel costs including regular travel time variations, service operation costs, infrastructure investment and maintenance costs, extra travel costs in nonrecurrent conditions, trip cancellation costs in nonrecurrent conditions, extra operation costs in nonrecurrent conditions, and extra investment costs for building infrastructure shortcut possibilities for detours ( 40 ). Because of the model’s complexity owing to the high number of cost components, Tahmasseby et al. only evaluated a couple of bypass measures; they calculated the robustness of adding a bypass railway in The Hague ( 40 ). The complexity of this work would make it hard to use as an optimization model for a set of crossovers and the disruption scenarios were defined manually.
Contribution
Although extensive research has been carried out on the performance of rail networks considering crossover flexibility and crossover-related costs, to the best of the authors’ knowledge, no studies include passenger delays in an optimization problem for the choice of crossover locations. Previous research showed that including passenger delay in design choices can be beneficial for passengers, operators, and railway project clients, and introduced methods to calculate passenger delay.
To fill this research gap, our research introduces a crossover location choice optimization model that considers passenger delays. The explicit contributions of this study include
a novel optimization model for the choice of crossover locations from a passenger point of view by considering passenger delays;
analysis of the tradeoff between the unreliability costs emerging from passenger delays in the case of disruptions and the total number of required crossovers; and
an algorithm to automatically determine the degraded schedules after any disruption.
Methodology
Assumptions
The following assumptions were made in the modeling of this work:
(A1) Multiple disruptions do not occur at the same time;
(A2) Capacity constraints of all PT vehicles are neglected, as in Yap et al. ( 42 );
(A3) Transition phases from the regular schedule to the degraded schedule and back to the regular schedule are neglected, which is only possible for high-frequency rail lines (i.e., a vehicle every 5 to 10 min), because more drivers and vehicles are available on all segments of such lines ( 20 , 21 );
(A4) In the case of disruption, passengers do not cancel their trip and they do not use private vehicles;
(A5) Regular, alternative PT options exist for all station pairs.
One can identify four types of crossovers, as presented in Figure 2. Type 1 is placed in the facing position. At facing points, one line splits into two in the direction of travel. Type 2 is placed in the trailing direction. At trailing points, two tracks merge into one in the direction of travel ( 43 ). Types 3 and 4 are tail track crossovers, which can be used to turn rolling stock in the other direction or to park a vehicle.
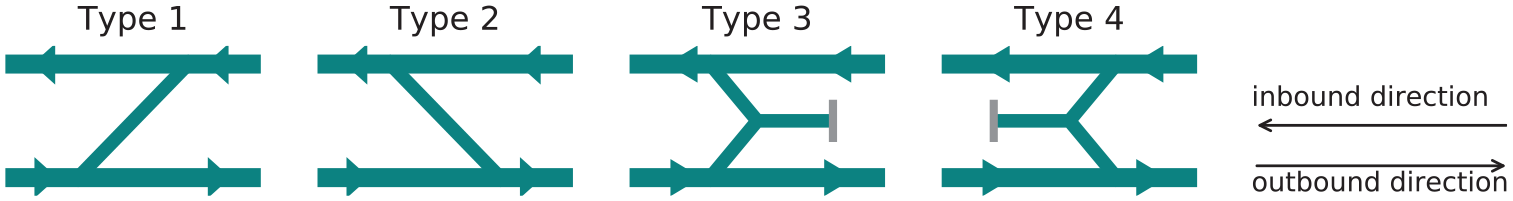
Crossover types: facing crossover, trailing crossover, tail track (outbound), tail track crossover (inbound).
Let us consider an independent rail line with two tracks. Figure 3 represents a schematic overview of a fictitious rail line with four crossovers and five stations. The two fixed crossovers near the end of line stations are necessary for the regular timetable and they cannot be removed. The two possible crossovers are design choices and could be added if they were deemed beneficial when running our model. That is, the goal of our model is to find the optimal crossovers from the set of available design choices (possible crossovers).
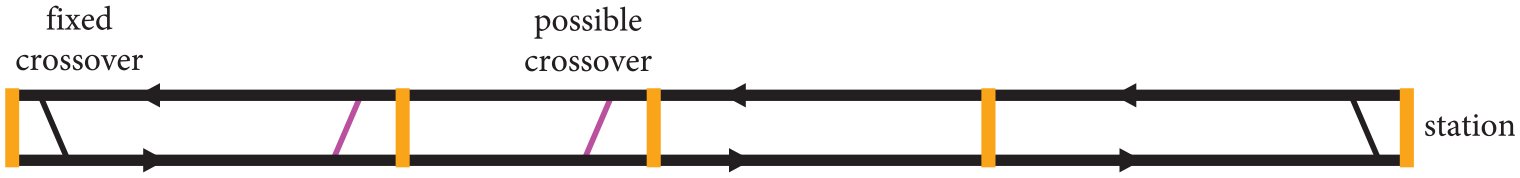
Representation of a rail line with two tracks: stations, fixed (necessary) crossovers (in black), and possible crossovers (in purple) that could be included in our design.
Modeling the Degraded Schedules in the Case of Disruptions
For each of the disruptions,
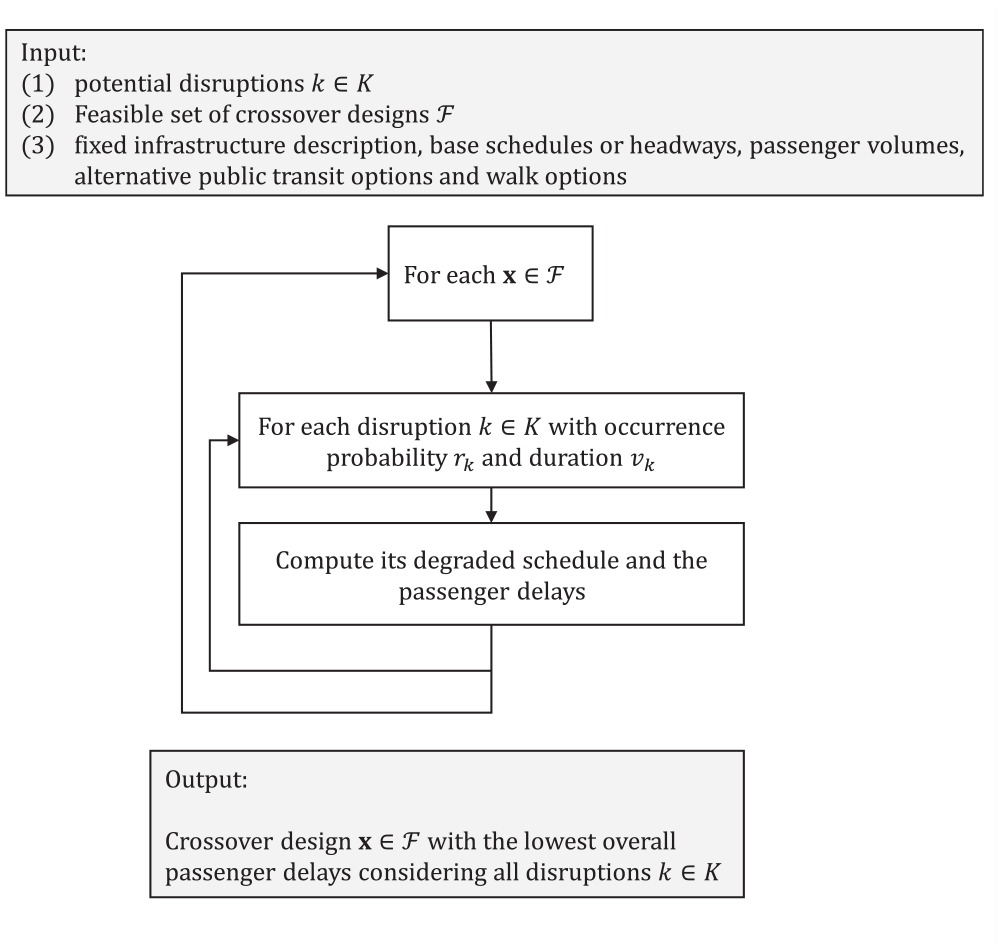
Flowchart of the methodology.
Our model is able to determine the degraded schedule for an independent, double-track line that operates under high frequency. The transition phases were not modeled as they have minor influence on lines with a small headway ( 20 ). The degraded schedule consists of two circuits (one serving the line segment before the disruption and another one serving the line segment after it). In case it is not possible to use two circuits for a specific disruption, we used only one.
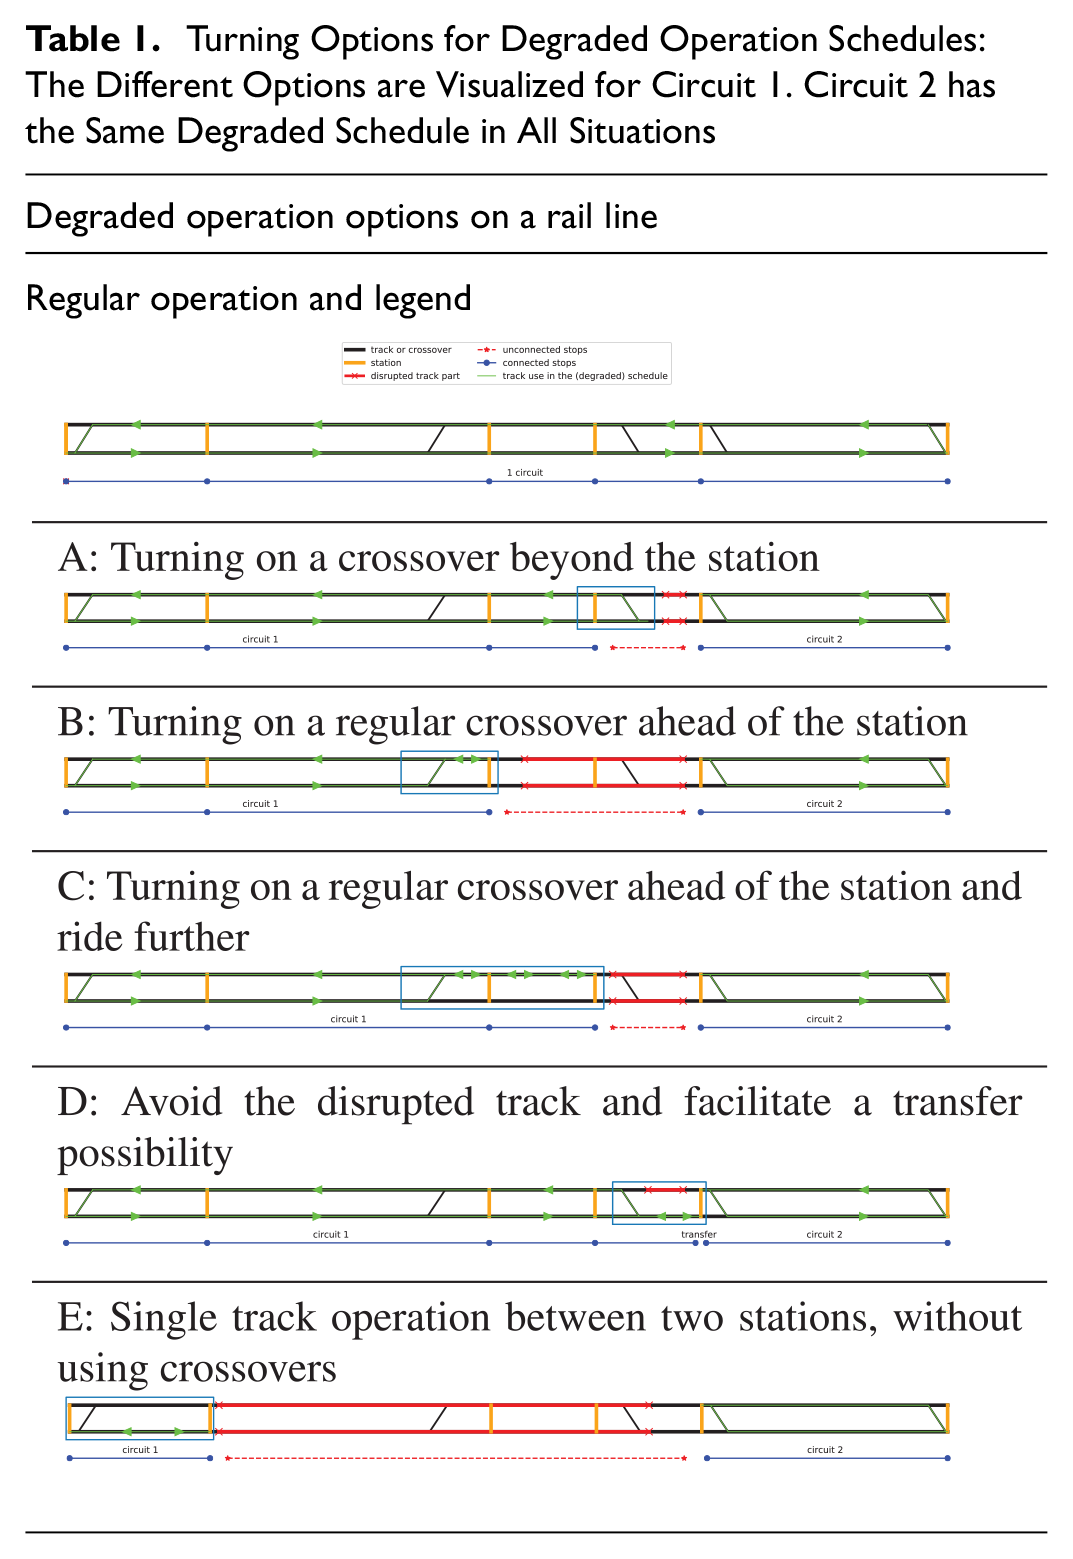
Table 1 presents the possible turning options for degraded operation schedules. If one of the two track directions is unavailable, the track direction could be alternated to make sure both directions could still be operated. However, because one track has to be used in two directions, the vehicle headway is limited by the ride times. The turning options in Table 1 are commonly used for light rail and trams ( 44 ).
Turning Options for Degraded Operation Schedules: The Different Options are Visualized for Circuit 1. Circuit 2 has the Same Degraded Schedule in All Situations
To find the degraded schedule for all disruptions,
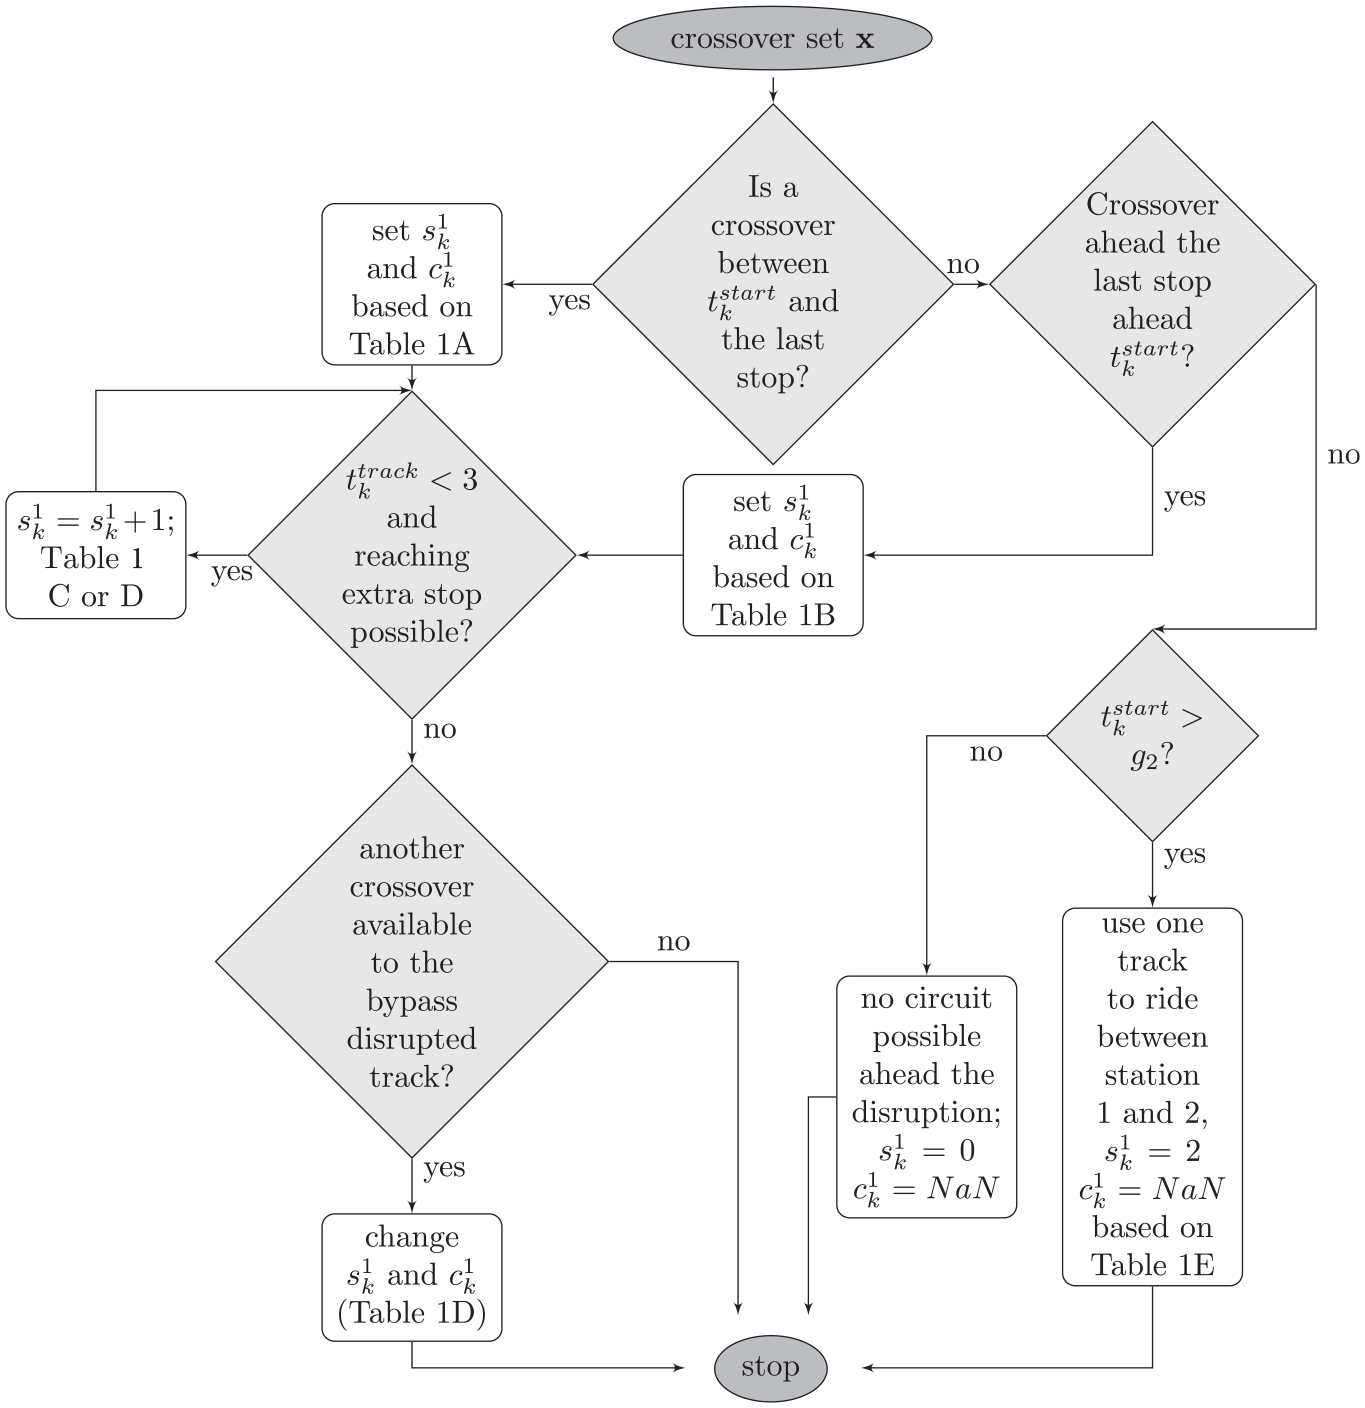
Flowchart that returns the disruption schedules for the circuit ahead of the disruption for disruption scenarios in
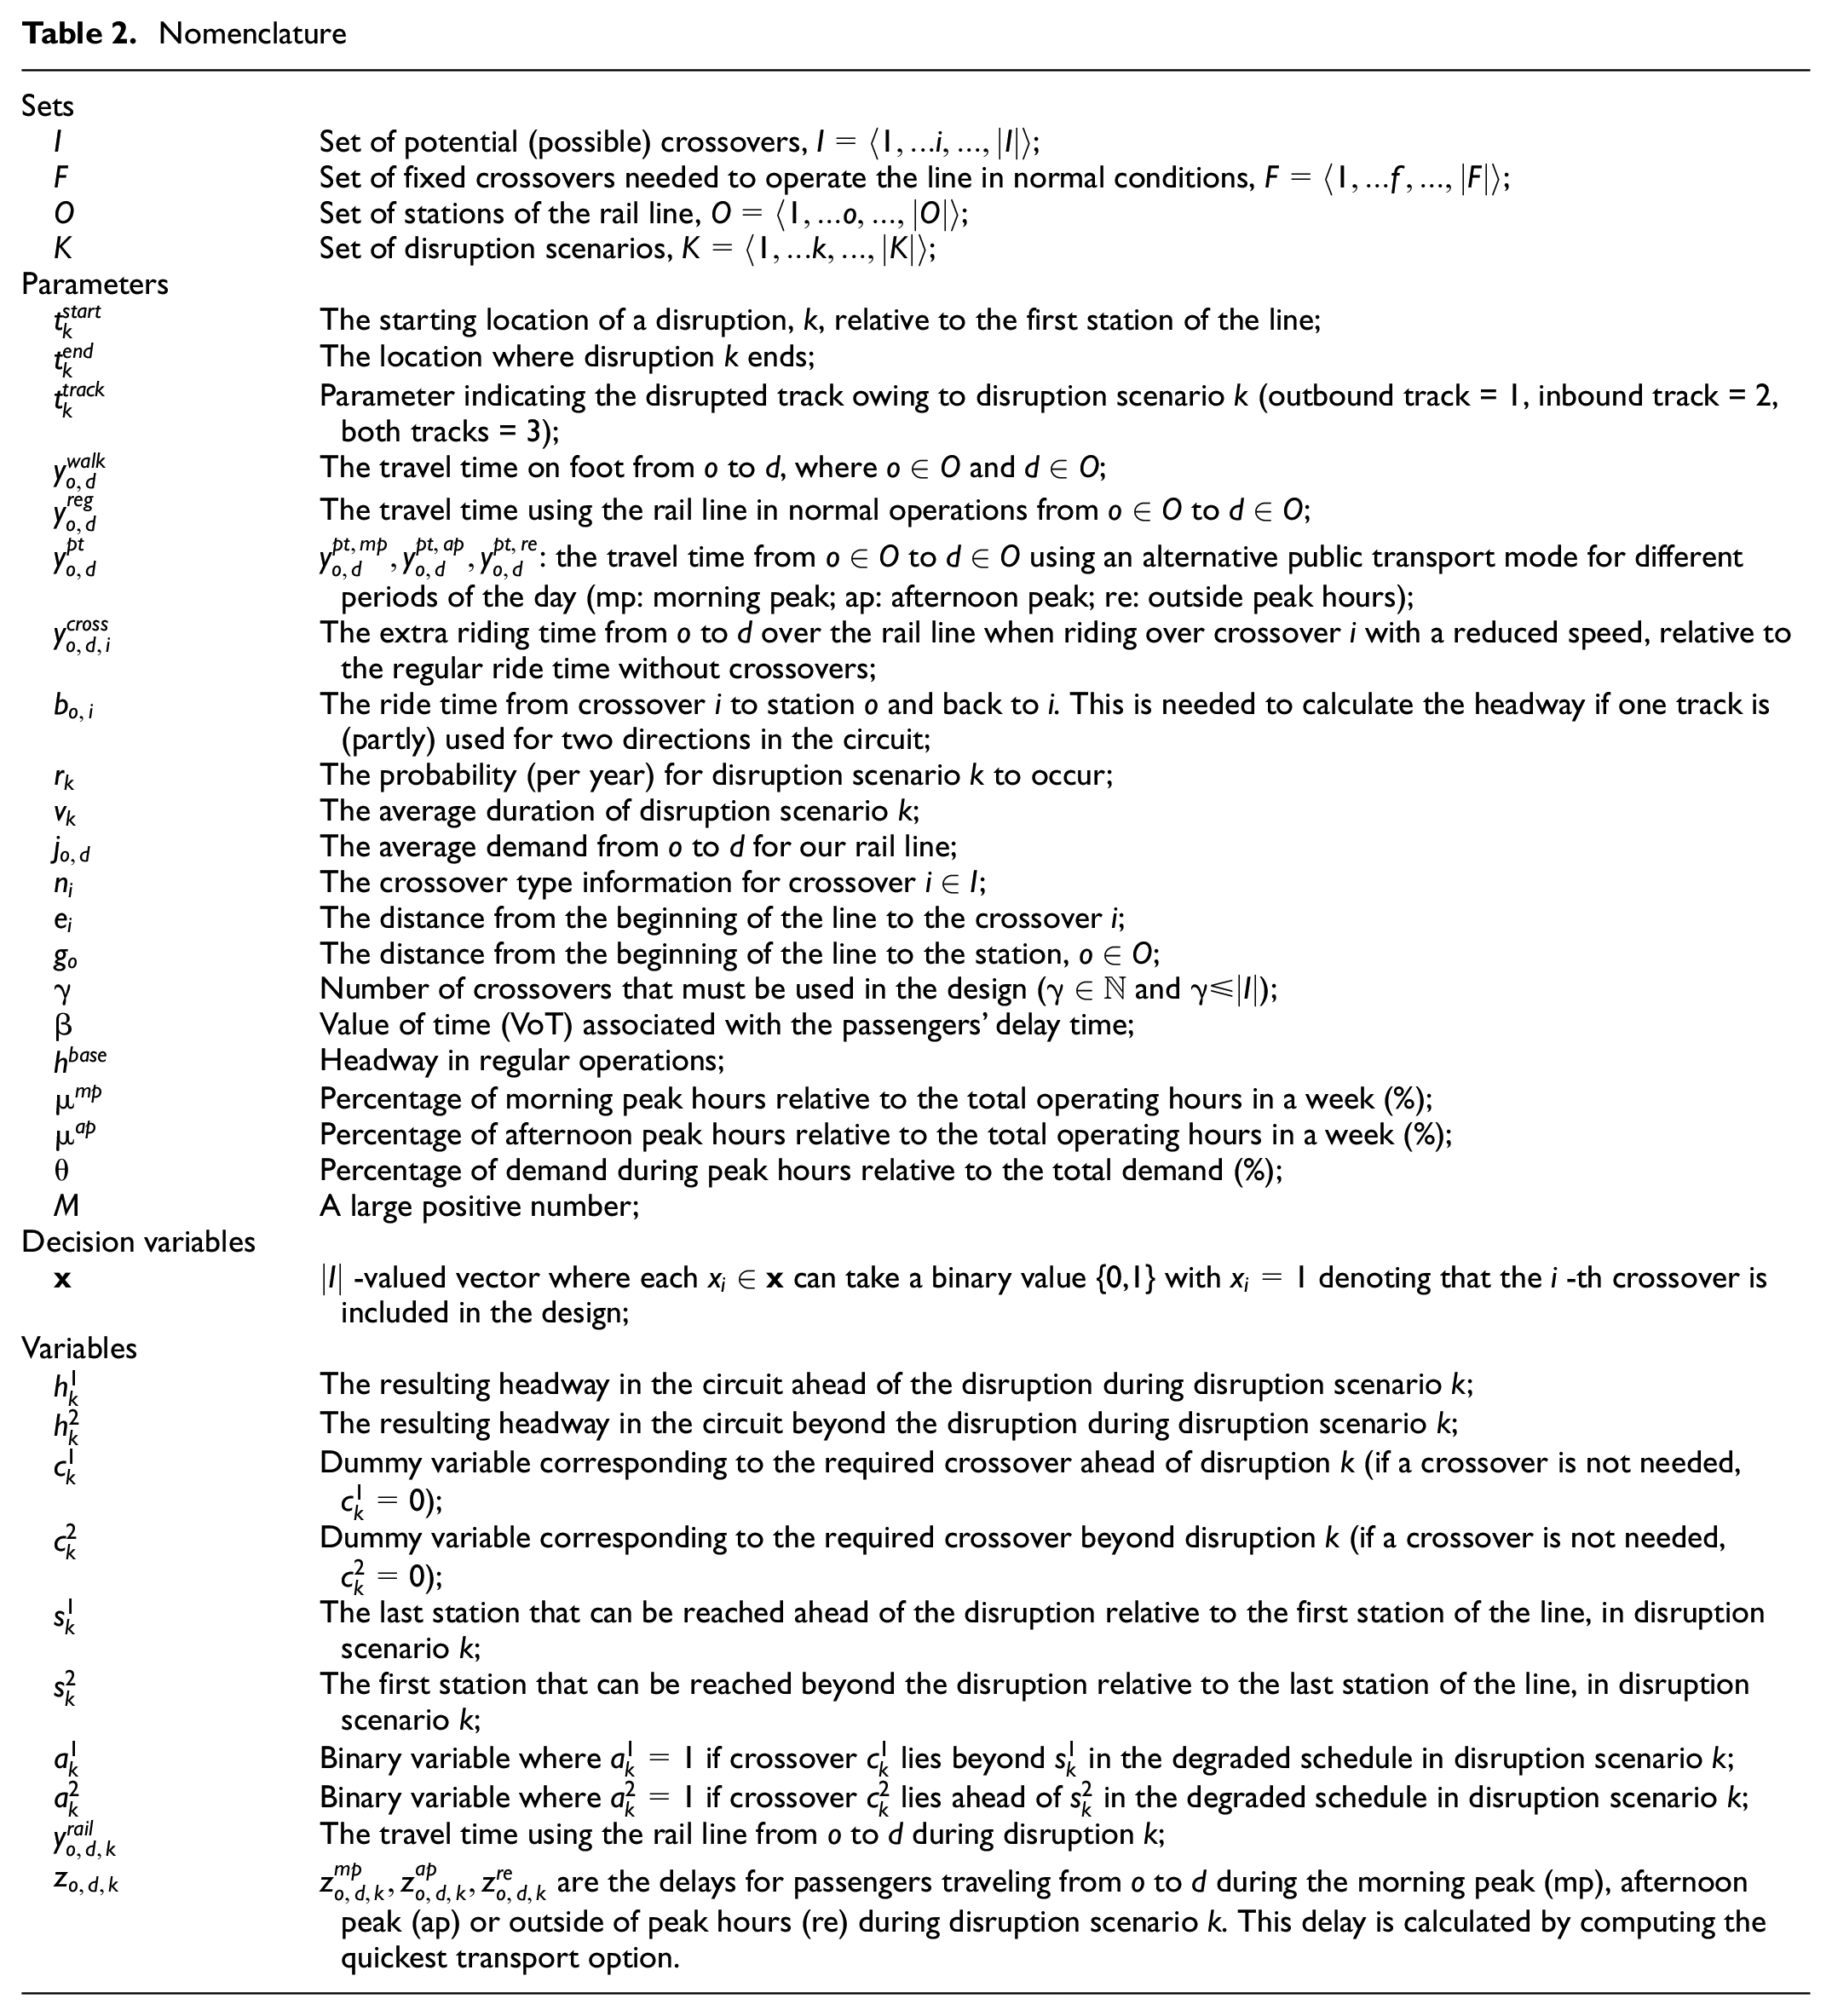
Before proceeding to the modeling, we introduce the nomenclature in Table 2.
Nomenclature
To calculate the waiting time of the passengers during disruption
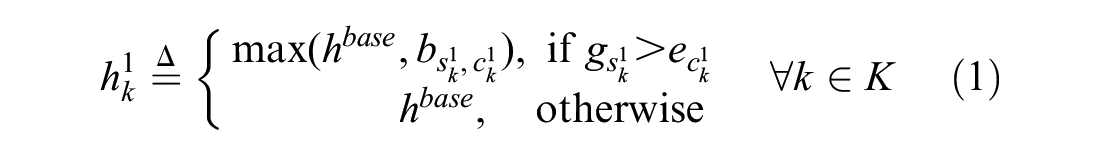
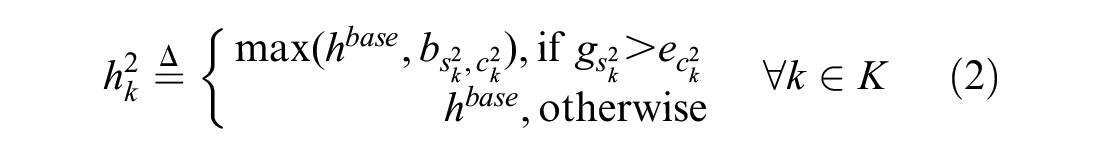
In Equations 1 and 2, the upper condition checks whether the degraded schedule uses a single track for both directions. If so, the headway is limited by the time it takes to ride the single track segment in two directions, and by the time for the driver to move to the other driver’s cabin of the train. If the headway is smaller than the regular headway, the value of
Concerning the values of the binary variables
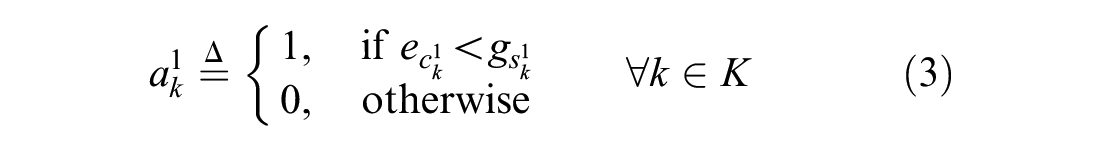
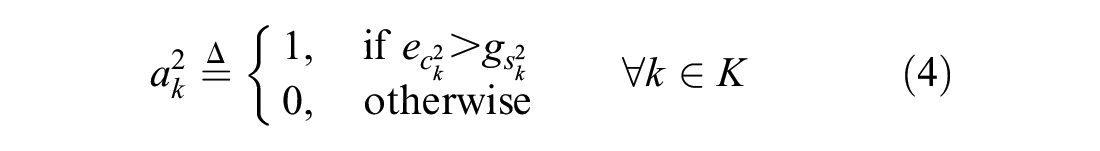
The used crossovers (
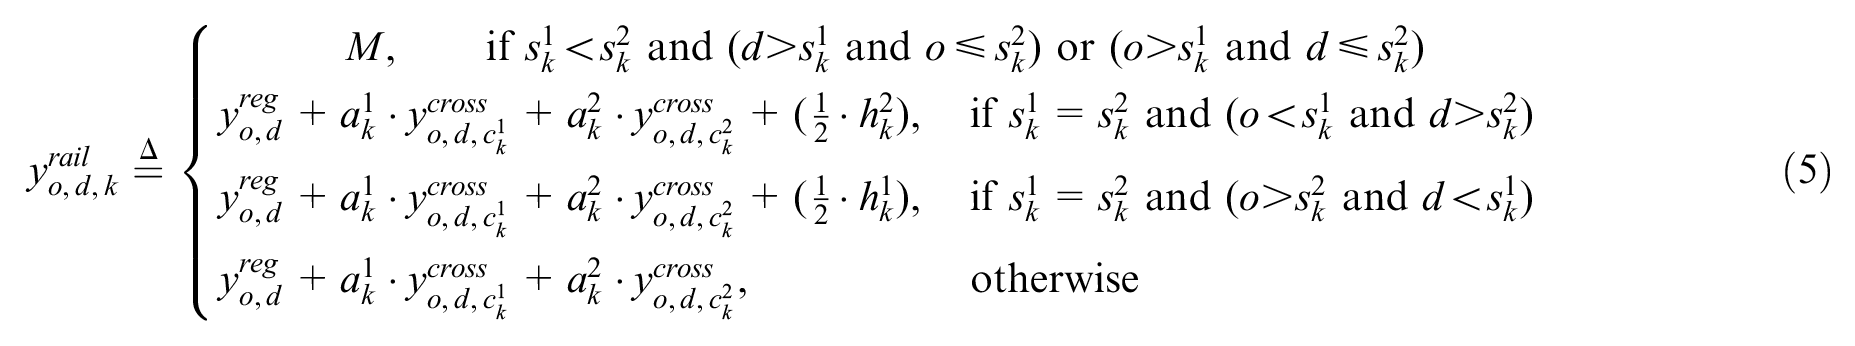
If two stations
Fastest Route With Bridging Options
As presented in Equation 5, the travel time from an origin,
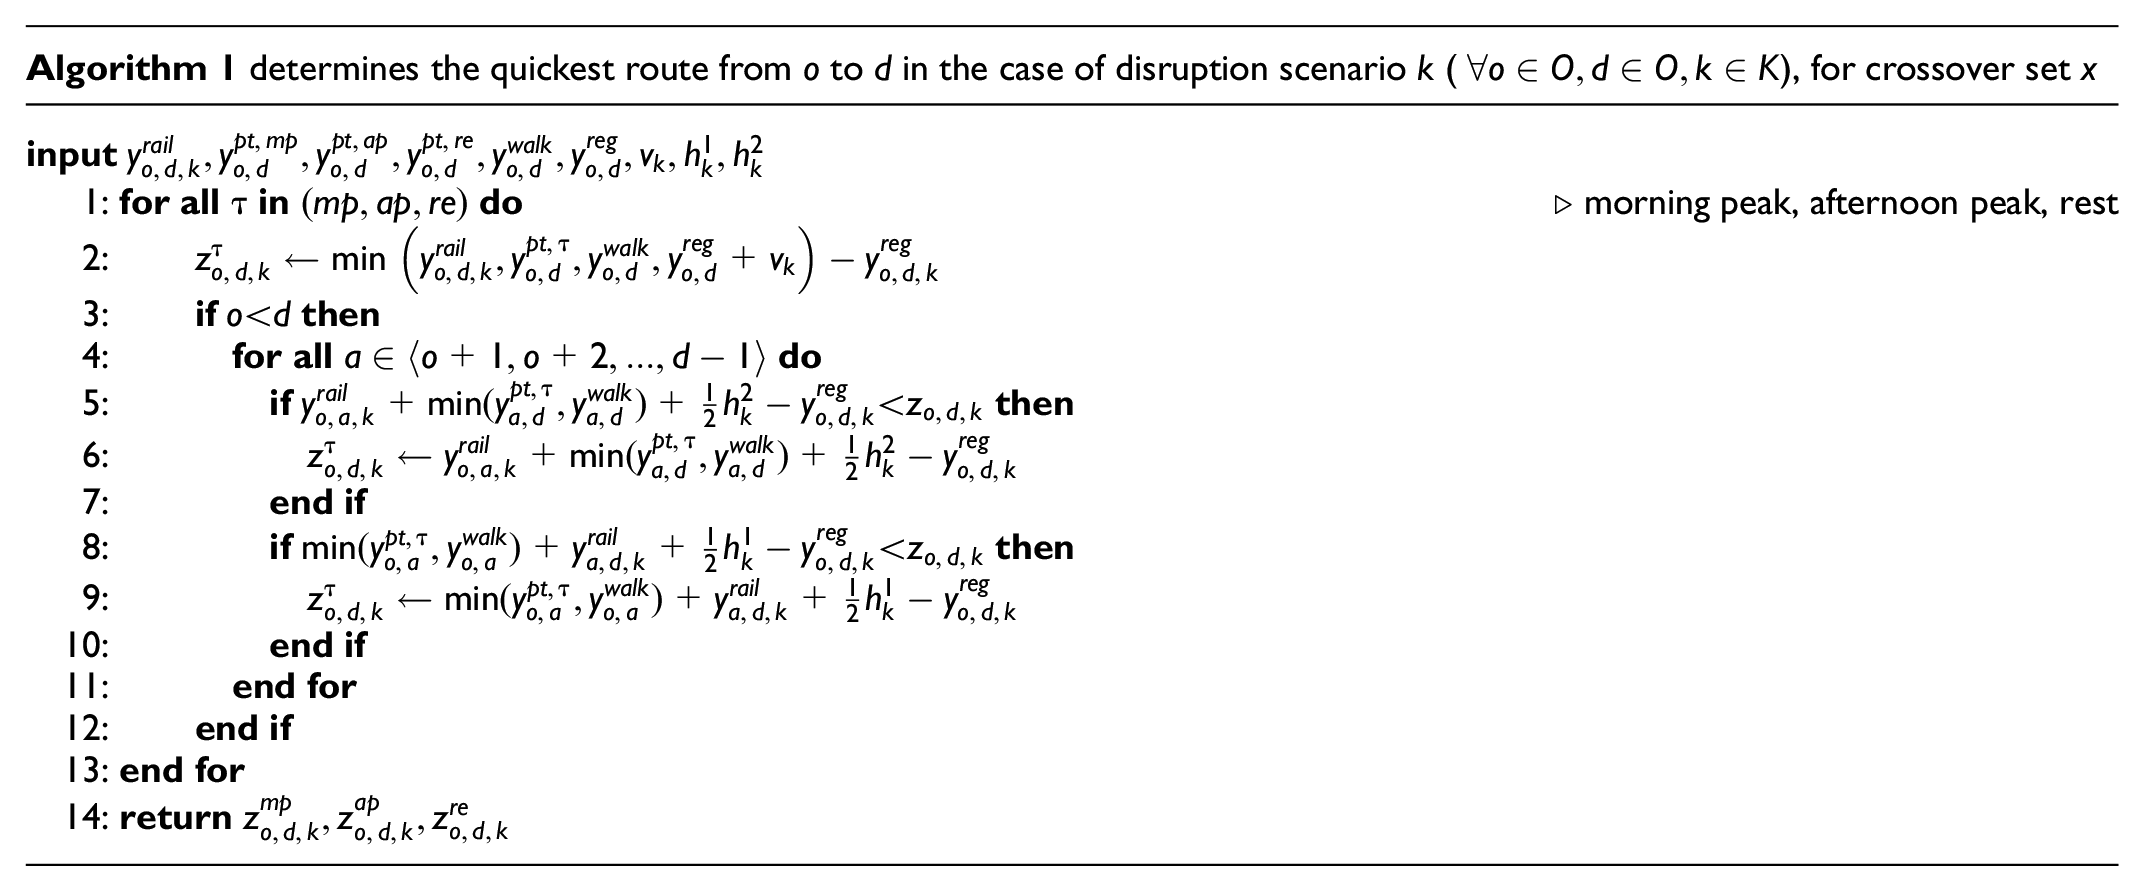
Algorithm 1 presents our method for calculating the delay of passengers traveling from station
might partly use the circuits of the disrupted rail line and combine them with walking or the fastest alternative PT line;
might entirely use the disrupted rail line; or
might entirely use the fastest alternative PT line or walking.
To this end, the travel time from the origin station,
Objective Function and Mathematical Program
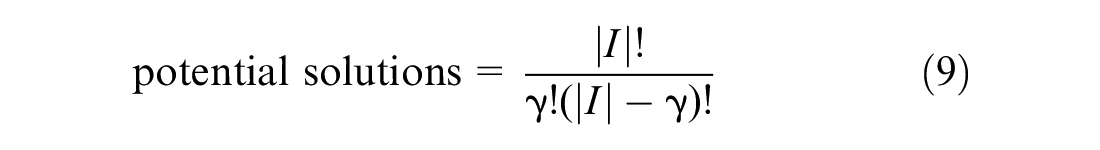
The goal of the objective function is to find a combination of crossovers that minimizes the total delay of all passengers for a given number of crossovers that can be used in the design. This yields an objective function (
6
) that minimizes the delay minutes of all passengers per year. Since Equation 6 minimizes passenger delay, in the remainder of this paper our model will be called the “unreliability cost (UC) model.” Note that our UC model will decide about the crossover design, considering the crossovers from the set of optional crossovers,
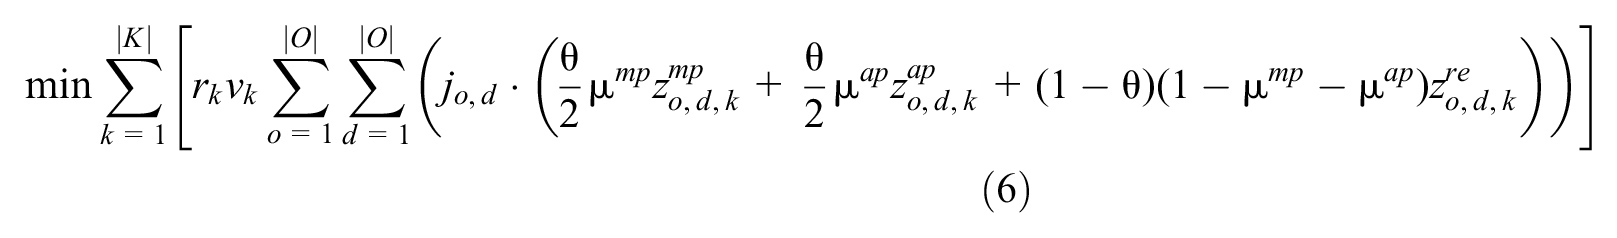


The objective function includes a summation of all disruption scenarios,
To demonstrate the computational complexity in practical problem instances, we implemented our model on a PC with an Intel Core i5-6300 CPU @ 2.40 GHz 8.00 GB RAM processor. The computation times for different problem sizes are presented in Figure 6. It is worth noting that, all things being equal, the computation costs increase with the increase of possible crossover options
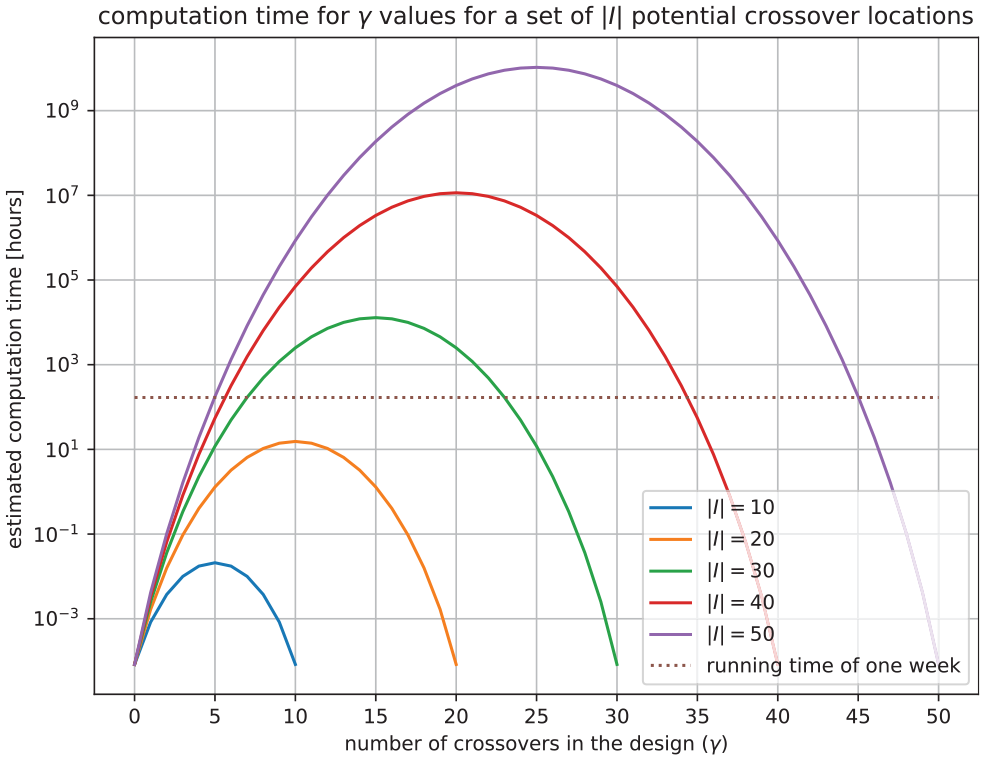
Estimated computational time for different values of
Case Study
Our UC model was tested on a light rail line in Bergen (Norway). This line was suitable as a case study for our model because
this line is independent and detours via other lines are not possible, and
its scheduled headway is 5 min. Therefore, the transition phases can be neglected because this is a high-frequency line.
Case Study Area and Input Data
The case study line is a light rail line in Bergen (Norway) consisting of nine stations and six fixed crossovers (see Figure 7). The construction of this line started recently and is therefore in the design phase. Slopes, station locations, and maximum speed information were obtained from the design reports of the line carried out by Sweco (
46
). The locations of crossings, switches, and crossovers were also obtained from these documents. The passenger demand matrix was provided by Mortensen (
47
). The expected percentage of demand during peak hours was
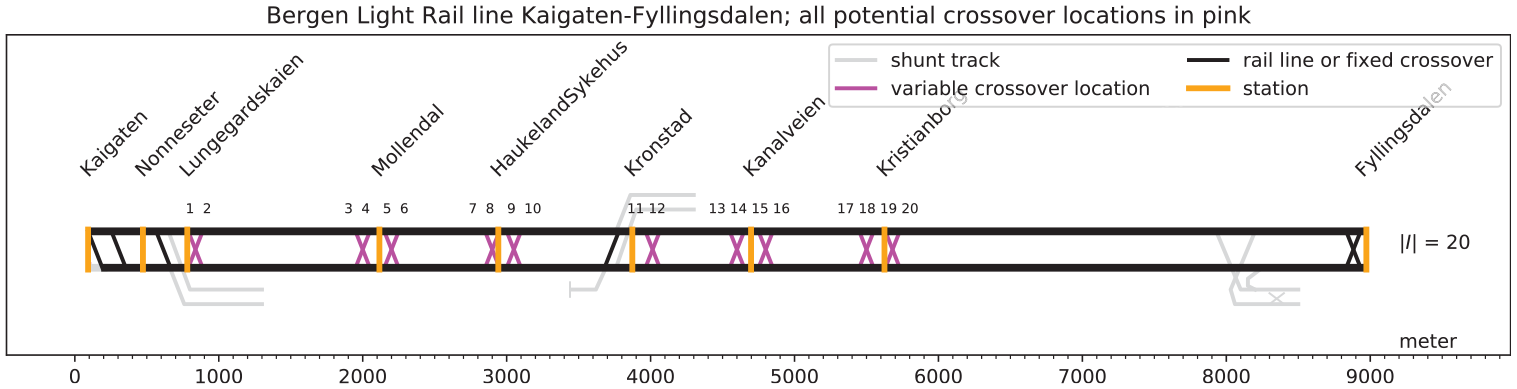
Potential locations of crossovers on the Bergen light rail line. The direction of the bottom track is from left to right and the top track from right to left.
The travel times for the alternative PT lines were calculated in Python 3.6 using the Google Maps plugin.
The frequency and duration of disruptions were obtained from the Reliability–Availability–Maintainability–Safety (RAMS) study of the project. From the RAMS study, we obtained switch, tunnel, power, and road crossing failure probabilities. For vehicle breakdowns, the values from Yap ( 19 ) were used. One type of rolling stock has been ordered for this line: a 38 Variobahn seven-car (42-m) vehicle from Stadler. The length, acceleration, and deceleration properties of this rolling stock type were used.
One track has been designed for both directions. For the first and last station, a crossover is needed to turn rolling stock in the opposite direction (Locations 70, 300, and 8800). Moreover, a crossover is needed at Kronstad (at Location 3700 m) to make it possible to move the rolling stock to the maintenance building.
VoT,
Optimal Crossover Location Strategy of the UC Model
The actual design included the six fixed crossovers from Figure 7 and three additional crossovers. These three additionally planned crossovers are presented in Figure 8. Our UC model can produce designs with different numbers of crossovers by changing the value of
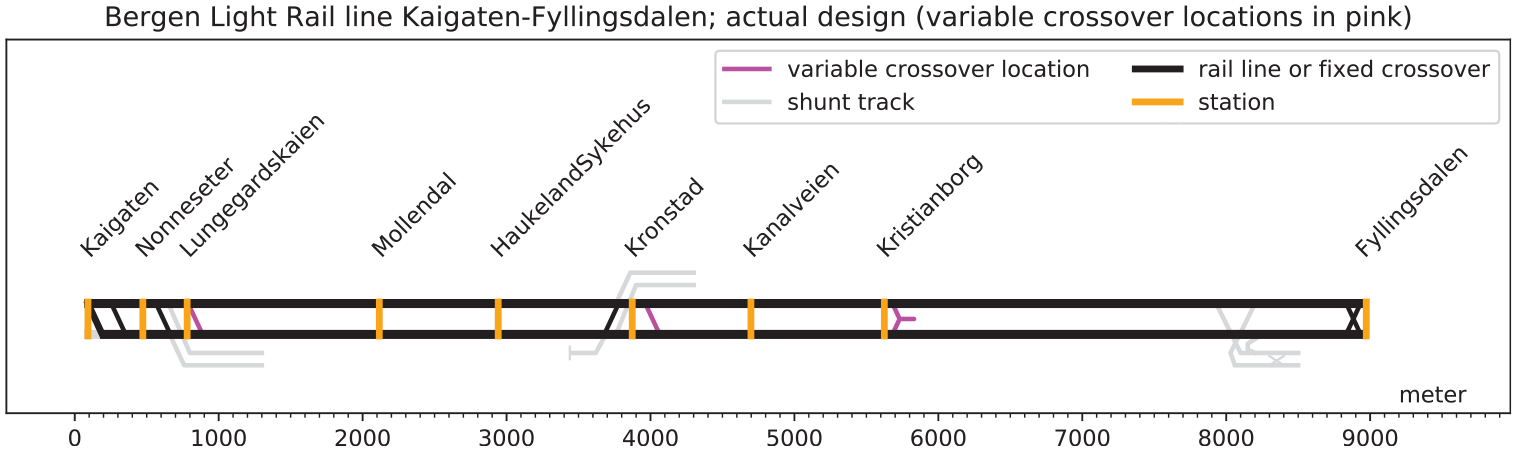
The actual design plan of the Bergen light rail. The direction of the bottom track is from left to right and the top track from right to left.
Figure 9 presents the UCs of our globally optimal crossover solution for scenarios with different numbers of possible crossovers allowed in the final design (
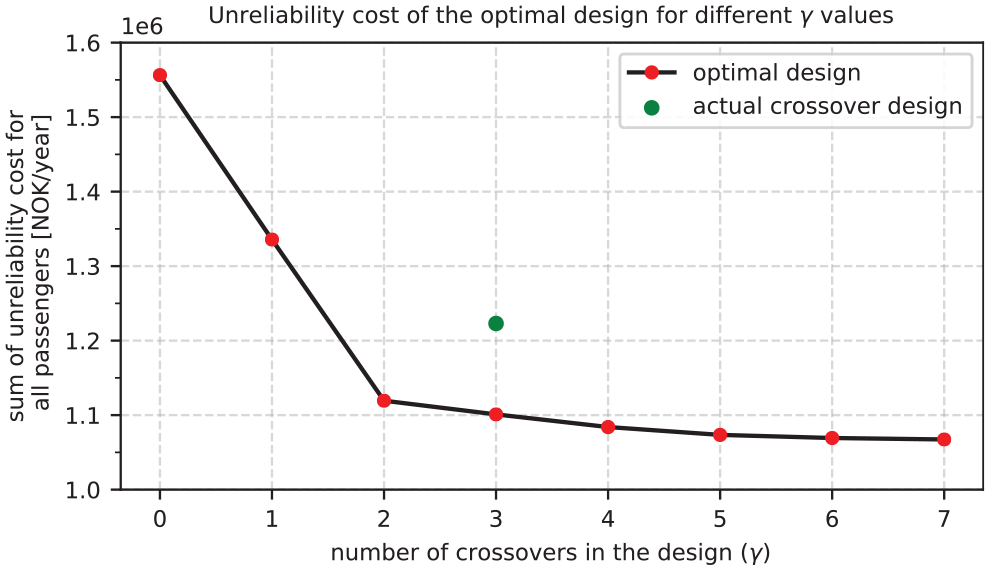
Passenger delay cost of the actual design and passenger delay cost of the optimal crossover combination according to the unreliability cost (UC) model for different values of
From Figure 9, one can note that when the number of allowed crossovers increases from zero to two we had a significant improvement in unreliability costs (14% and 16%, respectively). Adding a third, fourth, or fifth crossover led to a lower benefit (approximately 2%). The optimal locations of the crossovers for
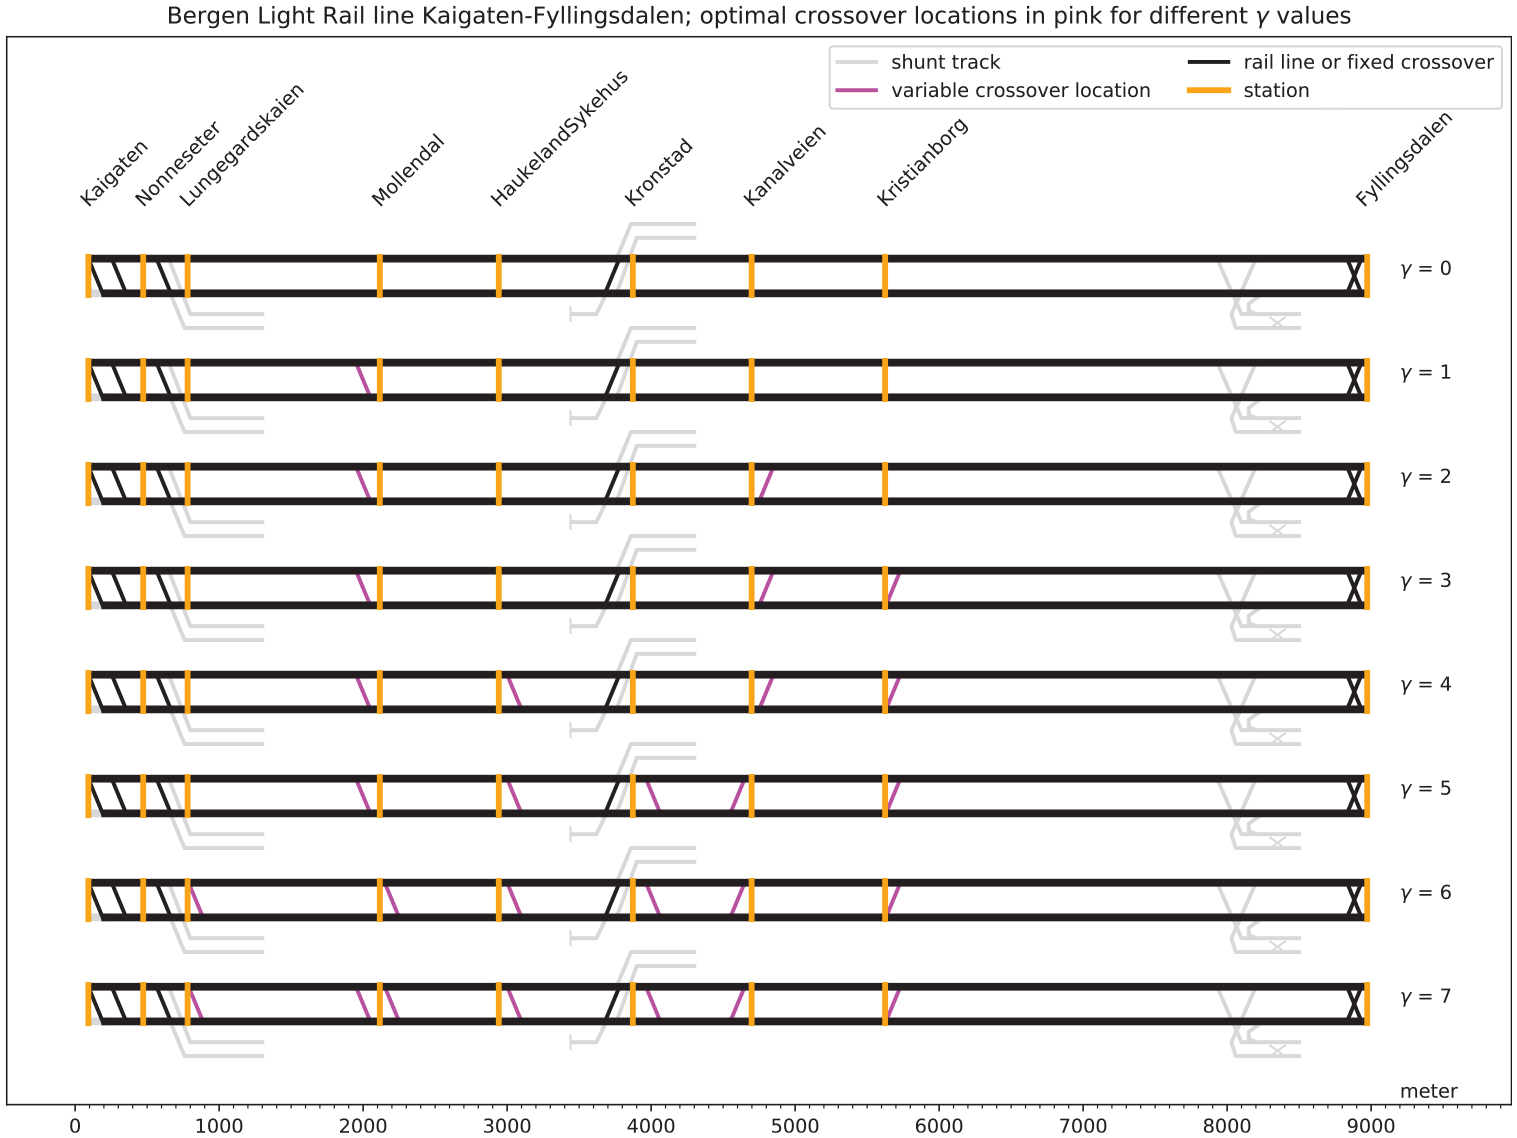
Optimal crossover location design strategy for different values of
Performance Evaluation of the Crossover Designs in Randomized Scenarios
Here we compare the performance of three crossover design strategies,
(1) the optimal crossover location strategy according to our UC model;
(2) the optimal crossover location strategy according to the crossover performance (CP) model that aims to maximize the number of times a crossover is used in the disruption schedules (see Hoeffelman [25]); and
(3) the actual crossover location strategy in the design that is currently being constructed in Bergen.
Note that our UC model sums the total delay of all passengers, whereas the CP model sums the crossover usages. Therefore, the main difference between the two models is that the UC model is passenger-based, whereas the CP model is network-based and does not consider the passenger demand, VoT, or travel times of other transport modes. Because the actual design contains three possible crossovers, we compared the optimal solutions of all strategies for
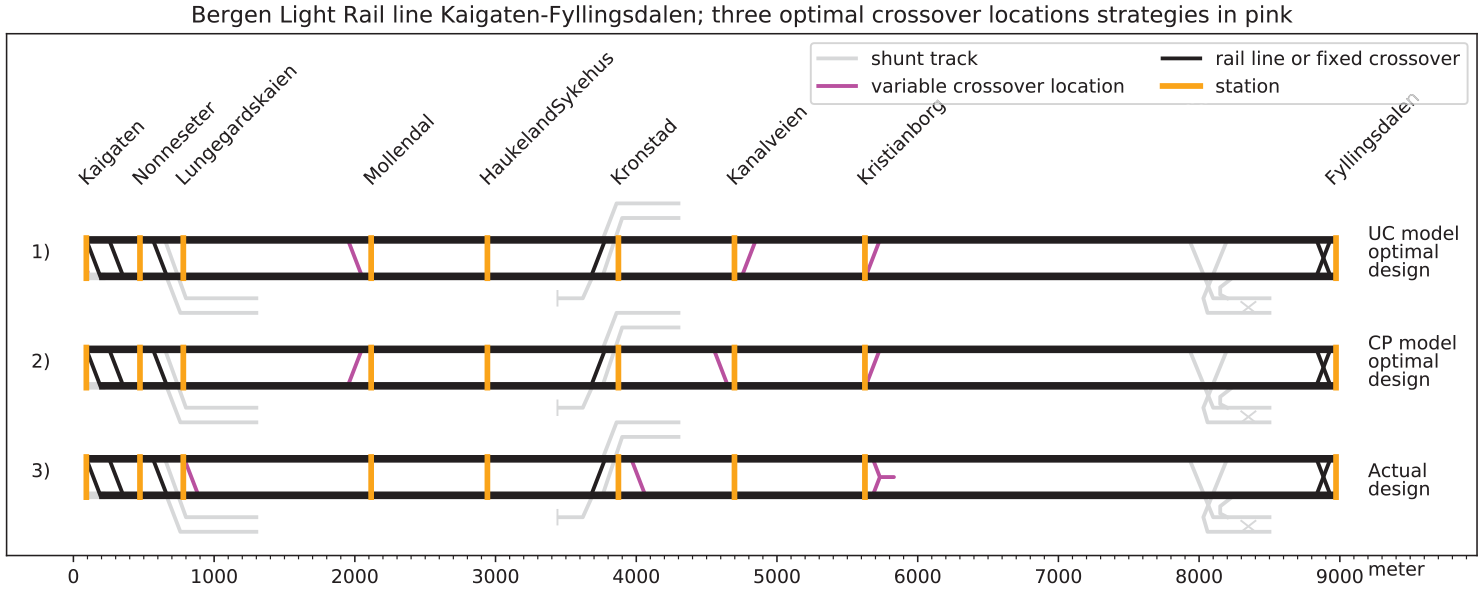
Optimal crossover location strategy according to the unreliability cost (UC) model, the crossover performance (CP) model, and the actual design. The direction of the bottom track is from left to right and the top track from right to left.
To test the performance of the three designs (Figure 11) in the case of uncertainty, we investigated the performance sensitivity of the designs to disruption scenarios with random failure probabilities. In more detail, for any predetermined disruption type at any location, we randomly selected its duration from a uniform distribution. The passenger demand between o-d pairs was also allowed to vary between −20% and +20% of its mean. We then generated 30 random scenarios with randomly sampled disruption duration and passenger demand from the corresponding probability distributions and compared the performances of the three crossover designs. In this comparison, four key performance indicators were used:
(I1) Delay minutes
The sum of the delay of all passengers per year.
(I2) Crossover annual usage
The expected usage per year of all crossovers.
(I3) Network connectivity
The connectivity indicator from Nieminen ( 24 ) indicating how many stations a station is connected to during a disruption.
(I4) Number of passengers delayed by more than 5 min
The number of passengers with a delay of more than the scheduled headway of 5 min.
Note that the actual design includes a tail track crossover that can be used to turn the trams around in the case of disruptions. During this process, there are no passengers inside the tram. Passengers who wish to continue their trip beyond the location of the tail track crossover have to either walk or use another PT mode. Their delay is calculated according to the assumption that they select the quickest route based on the available modes, since the tram will turn around and does not serve the area beyond the tail track (see Figure 12).

Example of degraded operation options on an independent rail line with a tail track.
The performances of the three crossover designs in each one of the 30 random scenarios are presented in Figure 13. From the results, one can conclude that for all scenarios the UC design had the lowest delay, the best connectivity value, and the lowest number of passengers with a delay of more than 5 min. The CP design had a better crossover performance in most scenarios. The difference between the UC- and the CP design was very small in most scenarios, however, there was a significant difference between the UC- and the actual design in all scenarios. Obviously, the CP design is optimized for crossover performance and thus performed better in this metric (I2). Because the CP design contains crossovers that are used as many times as possible in the case of disruptions, in some disruptions a crossover might be used but this does not necessarily mean that more stations are connected during the disruption.
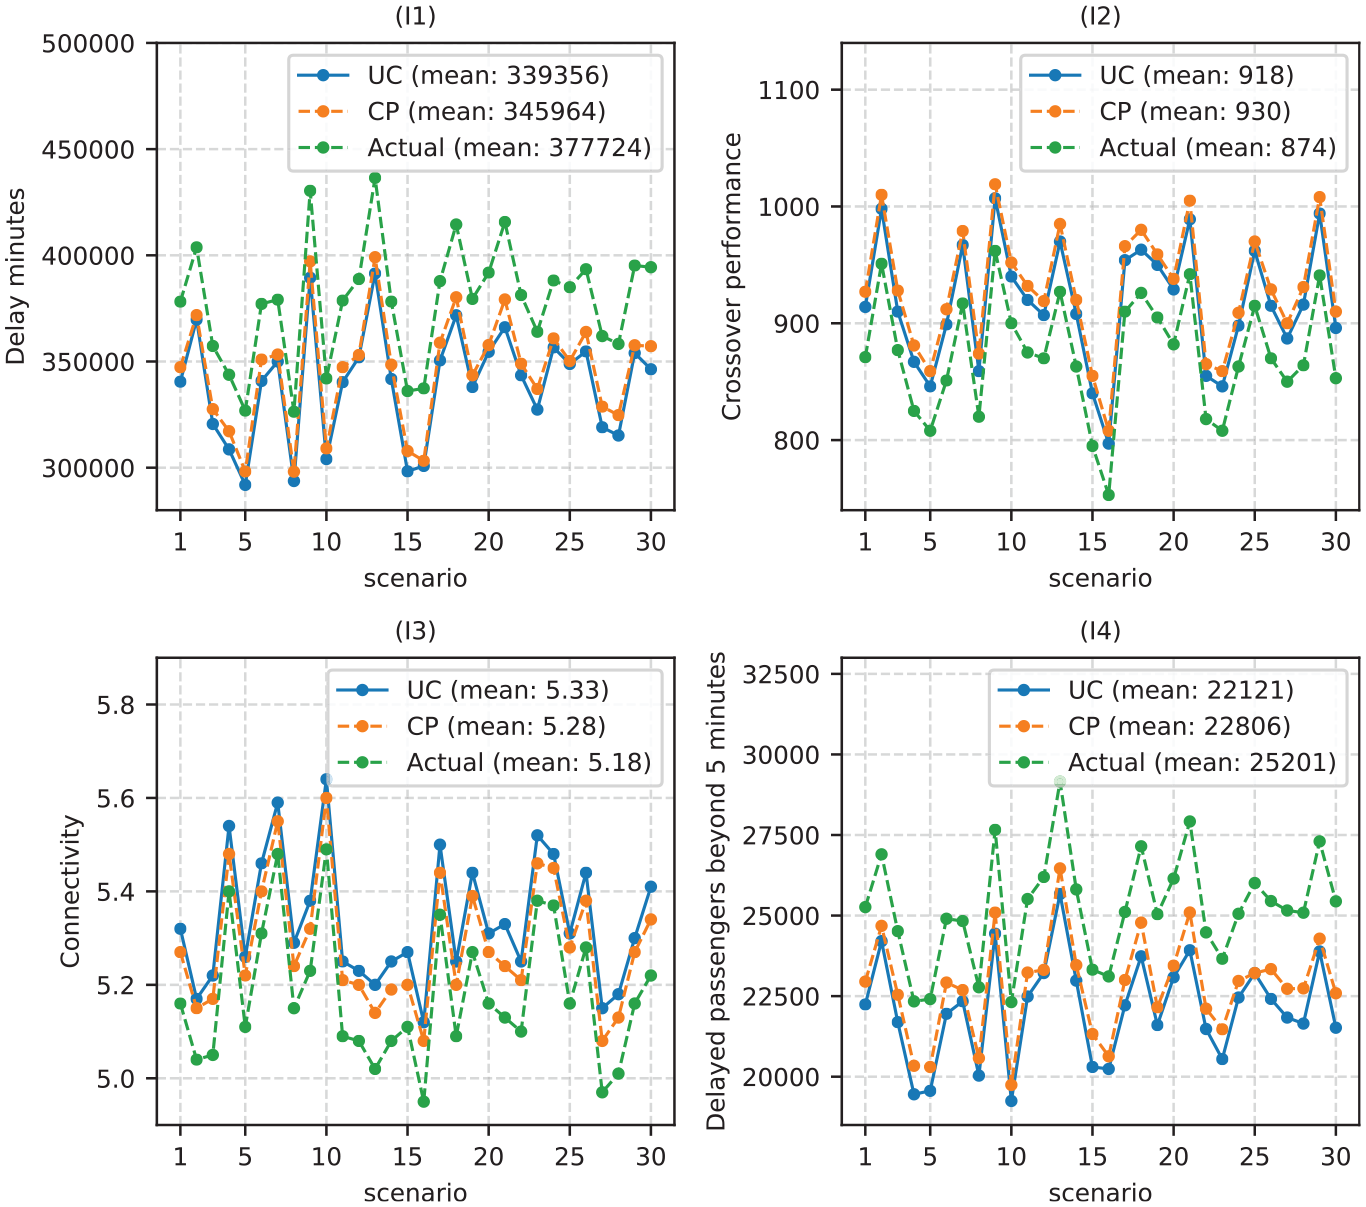
Performance of the unreliability cost (UC), crossover performance (CP), and actual designs at each one of the 30 random scenarios. For indicators (I1) and (I4) lower values are better. For (I2) and (I3) higher values are better.
Our experiments showed that the UC model yielded a more robust design compared with the CP model and the actual design. Three of the four key performance indicators (passenger delay, connectivity, passengers delayed more than 5 min) were improved when applying the UC design. Crossover performance was higher for the CP design in most scenarios, but the difference was very small and a higher crossover performance is not necessarily beneficial for passengers, operators, or local authorities.
Concerning the results of our performance evaluation, it should be noted that these were based on the assumptions that passengers will not use their private vehicles in the case of disruptions and that the planned capacity of the PT lines is sufficient to accommodate passenger demand. These assumptions were used when comparing the performances of all design strategies: our UC model, the CP model, and the actual crossover design.
Our light rail line was of high frequency, therefore it was safe to assume that vehicles were evenly distributed across the line to perform a regular service and that the transition phases from the regular schedule to the degraded schedule and back to the regular schedule were very short.
Conclusion and Recommendations
This study proposed an algorithm to automatically calculate disruption schedules for any double-track railway line that does not share lanes with road traffic. In addition, we developed a UC model to produce optimal crossover designs by taking into consideration passenger delays resulting from disruptions that can occur on a yearly basis. Experiments in our case study in Bergen (Norway) showed that our passenger-based UC design performed better than the actual design or the design produced by the network-based CP model. The UC design performed better for different key performance indicators: the crossover performance, average line connectivity, and the number of passengers having a delay of more than 5 min. Specifically, the UC design resulted in a reduction in unreliability costs of 9.8% while using the same number of crossovers as the actual design.
Our UC model has computation limitations in relation to the set sizes of potential crossover locations because the number of combinations rises significantly when an extra potential crossover location is added to the set. The maximum set sizes are large enough to evaluate a larger network than the one selected in this study. However, it would not be possible to optimize the crossover locations of the rail network of an entire country. In future research, logical constraints could be added to prune the solution space and reduce computation times. In addition, further constraints could be added to our UC model to increase the crossover functions (i.e., add constraints to ensure that a facing crossover is needed between two stations). Finally, a sensitivity analysis could be performed to investigate the potential performance changes in the case of variations in the model parameters, such as passenger demand, travel times of alternative PT lines, the frequency and duration of disruptions, timetable frequencies, and the value of passengers’ time.
Footnotes
Acknowledgements
We would like to acknowledge the assistance of Sweco in our case study of the light rail line in Bergen (Norway).
Author Contributions
The authors confirm contribution to the paper as follows: study conception and design: W. Trommelen, K. Gkiotsalitis, E.C. van Berkum; data collection: W. Trommelen; analysis and interpretation of results: W. Trommelen, K. Gkiotsalitis, E.C. van Berkum; draft manuscript preparation: W. Trommelen, K. Gkiotsalitis. All authors reviewed the results and approved the final version of the manuscript
Declaration of Conflicting Interests
The authors declared no potential conflicts of interest with respect to the research, authorship, and/or publication of this article.
Funding
The authors received no financial support for the research, authorship, and/or publication of this article.