
Abstract
This study seeks to find a strategy to capture the most observed trajectories with a minimum number of algorithms. GPS information on 4,538 real trips from 131 travelers in 2008 was collected and analyzed in Minneapolis-St. Paul (the Twin Cities) as part of the I-35W Bridge Collapse study. The high-resolution road network of the Twin Cities includes 108,561 nodes and 277,747 links. Labeling and link penalty approaches are combined to generate alternatives based on either observed or free-flow speed. Overall, with the best 10 labels, on average, 40 unique routes are generated for each origin-destination pair, and around 80% of all observed trips could be captured with an 80% overlap threshold. About 88% of all observed trips have an average deviation within 50 m compared with the best matching result when combining all labels introduced in this study. Freeway-preferred routes cover more observed trips than freeway-avoided routes, and the peak coverage occurs when freeway travel is weighted between 0.8 to 1 of travel on non-freeway links. A random effects panel model is used for predicting the overlap between alternative route and observed trajectory. Multinomial and mixed logit models with a path-size term are applied to model the route selection. These models indicate that alternative routes which are shorter in distance, have faster average free-flow speed, contain a higher freeway percentage, and incur fewer traffic lights, are more likely to have higher overlap with observed trajectories and are more likely to be selected.
Generating the choice set for route choice is a complex problem. For a large urban network, potential routes, which are difficult to itemize, could number in the thousands ( 1 ), and thus a clear choice set of available routes for a trip should be explicit from the network before route choice modeling. Many studies pointed out that the size and composition of choice sets deeply influence the quality of route choice estimation and choice probability ( 2 – 6 ).
Previous studies show that for networks with thousands or tens of thousands of nodes and links, the common choice set generation methods provide a choice set that captures a high share of observed trips with fewer than 50 potential routes. However, generating the same number of alternative routes by using these methods gains less share of observed trips. Therefore, more potential routes are needed in the choice set to obtain the same share of observed trips on a network with hundreds of thousands of nodes and links. One option to overcome this difficulty is reducing the network size by removing low traffic local streets in neighborhoods. However, eliminating links in the network loses traffic on those links and worsens the accuracy of map matching for GPS points.
Therefore, this research aims to provide a method for combining two popular choice set generation procedures, namely link penalty and labeling approaches, to capture a significant proportion of observed trips on a graph that represents all streets within a real road network. The generated choice sets are then used for modeling travelers’ route selection. Previous literature suggests that attributes including trip length, travel time, travel speed, percentage of the freeway, number of left turns, and number of right turns might influence route choice ( 7 – 9 ). These attributes are included in this study.
We first review different methods for route choice set generation in the literature. We then describe our methodology for data preparation, choice set generation, and choice set evaluation. Next, we present our results. Finally, we suggest directions for future research.
Literature Review
Choice set generation approaches can be categorized based on the way they produce potential routes ( 1 ). The measures all build on variations of the idea of the best path through the network, and are summarized in Table 1:
K-shortest path: Calculate the
Link elimination (
14
): The algorithm is based on K-shortest path algorithm. When searching the
Link penalty ( 15 ): Similar to link elimination, but instead of removing links from the original network, this method adds a fixed penalty factor to links which are included in the previous shortest path before re-estimating the shortest path.
Labeling ( 16 ): Labeling differs from the previous two methods. It defines a target label such as “Minimize traffic lights” before calculating a path, and then searches for routes that optimize the target. For example, maximize “Minimize traffic lights” means finding the path with the fewest traffic lights.
Constrained enumeration: Unlike the methods listed above which assume travelers making decision based on minimum generalized cost, constrained enumeration approach assumes people selecting routes based on behavioral rules. A branch-and-bound algorithm which is introduced by Prato and Bekhor ( 17 ), uses the branching rule reflects behavioral assumptions through the definition of thresholds. A directional threshold and a loop threshold remove routes with either high overlap with existing alternative routes or very long travel time.
Probabilistic methods: Probabilistic methods calculate the probability of links based on the distance of them to the shortest path ( 18 ). For an origin-destination (OD) pair, at each way point, a repeated random walk process adds the probable next link based on similarity to the shortest path. The route probability then equals the product of the probability of each link comprising the route.
Doubly stochastic generation function ( 19 ): This assumes that travelers have a perceived cost with error for paths, and the generation function includes a stochastic terms for cost and to account for the heterogeneity of travelers. These random terms are assumed to follow a probability distribution.
Summary of the Choice Set Generation Techniques Observed in the Literature
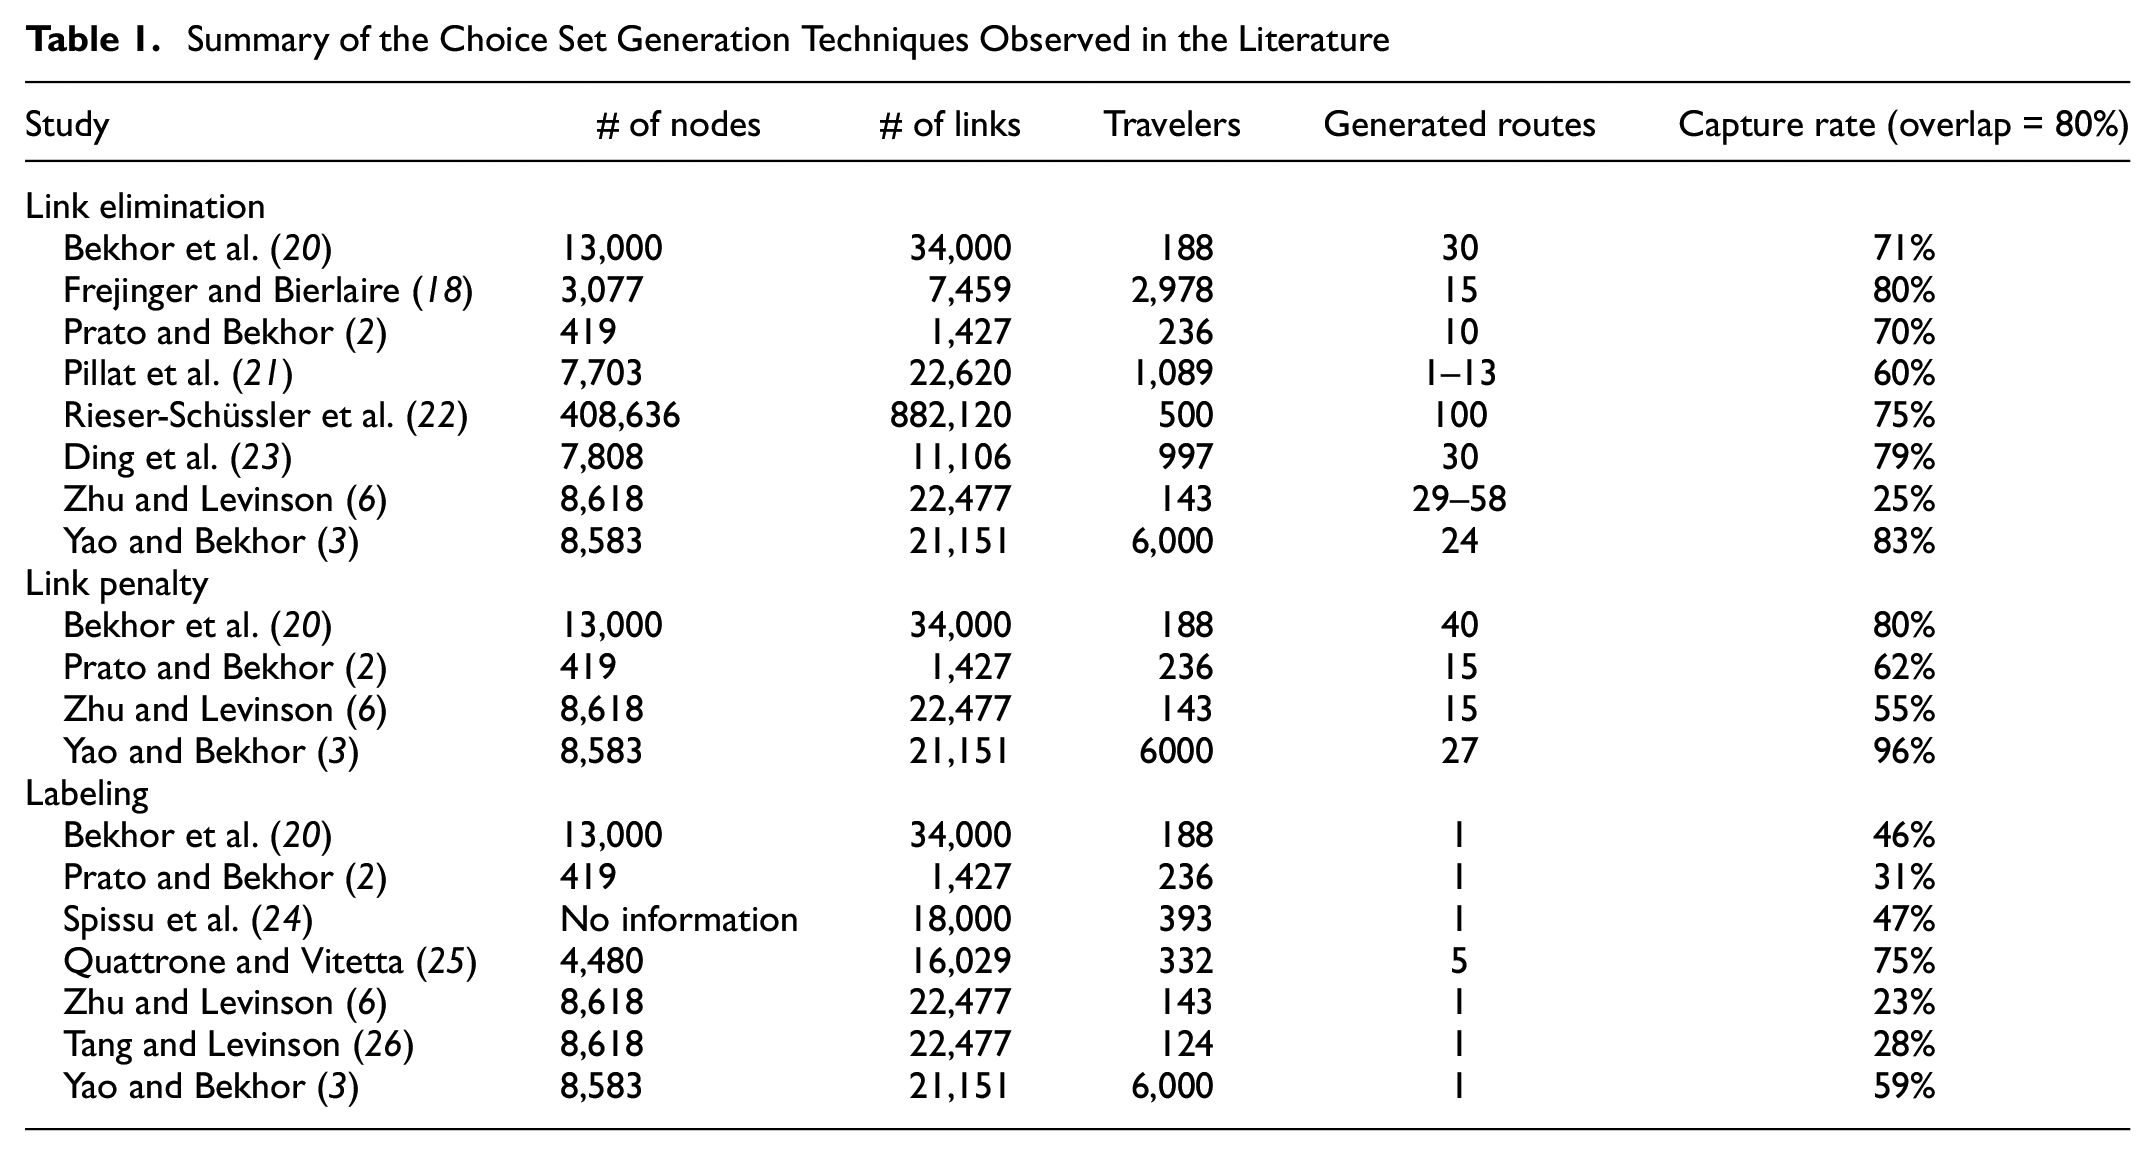
Directly using the K-shortest path approach for the route choice problem is uncommon in recent research. The high similarity (overlapping) of generated routes means the alternatives cannot be easily distinguished as a different routes by travelers. Instead, link elimination, link penalty, and labeling approach are commonly applied in the literature. As shown in Table 1, these methods generally provide acceptable results and are easy to implement.
Prato ( 1 ) noted that some links which are included in both actual trajectories and alternative routes might be removed before searching new shortest path in link elimination, and thus the real trajectories cannot be captured. Link penalty keeps those “used” links in the network, and the new shortest path still has the chance to use them. Therefore, link penalty approaches are more likely to generate real paths. For labeling, choosing good labels can make the generation process efficient, but the label selection process relies on the modelers’ experience, and not all real trips have clear labels. For constrained enumeration, the difficulty is setting the thresholds for behavioral constraints.
Bekhor and Prato ( 27 ) argued that the empirical results in a small network can be opposite to a large urban network. One shortcoming of probabilistic methods is the unrealistic loops created by repeating the random walk process. Prato ( 1 ) argued that doubly stochastic generation function method is computationally prohibitive for larger road networks.
All the methods above generate alternative routes based on predefined rules and are further categorized to be explicit methods by Yao and Bekhor ( 3 ). Compared with explicit methods, implicit methods do not need alternative routes to be defined before model estimation ( 28 ). However, implicit methods have high computational costs and are unsolvable when there are cycles in the paths.
Overall, generating alternative routes based on a K-shortest path algorithm is easy to implement but is unlikely to capture all observed trajectories. Similar shortcomings could be found in constrained enumeration methods. For stochastic-shortest path based methods, the high time cost and high reliance on the implementation of suitable probability distributions makes them unsuitable for all data sets. Based on previous studies, the majority of research focuses on improving link elimination, link penalty, and labeling approaches, and both the number of observed trips and the size of the network are small. In high-resolution networks, a previous study generated 100 alternative routes per OD pair, and covered approximately 75% observed trips with 80% overlap threshold. This should be improved.
Methodology
Data Preparation
GPS Data
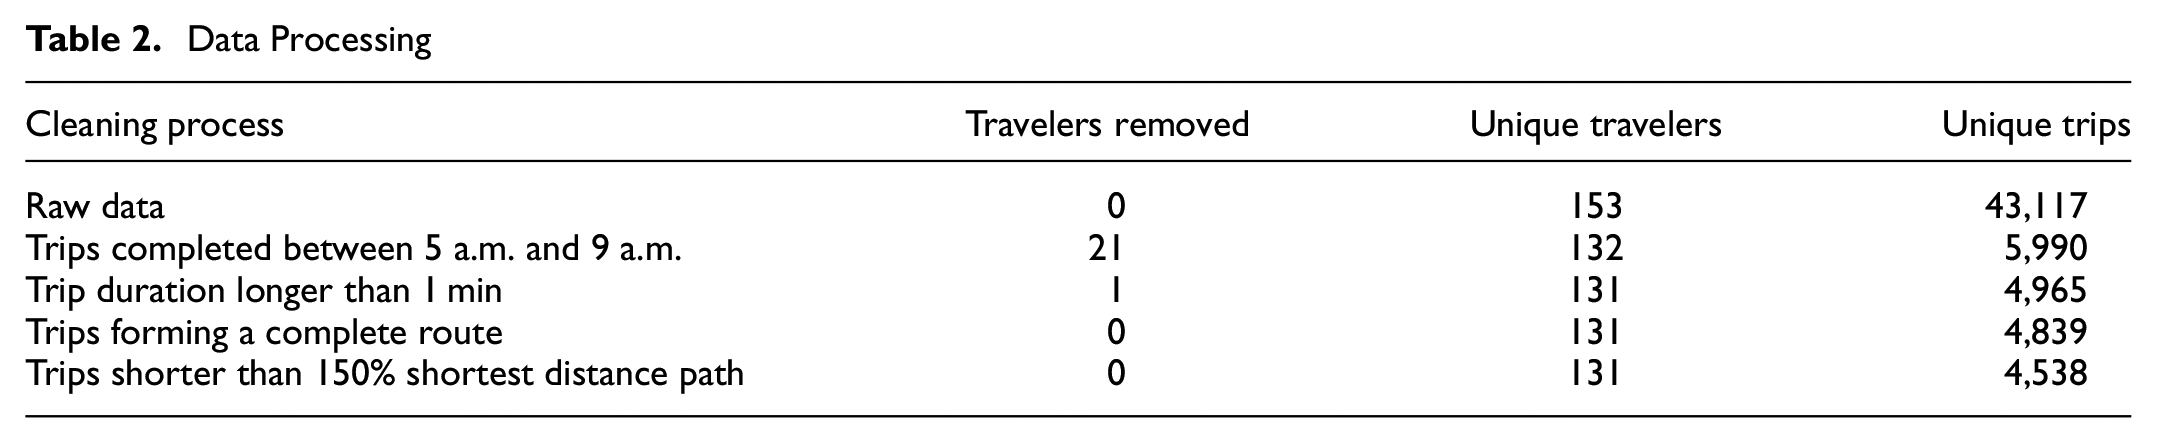
GPS information was collected in the Minneapolis-St. Paul region (the Twin Cities) as part of the I-35W Bridge Collapse study in 2008 ( 6 , 29 ). Within a 13-week period, 43,117 trips were recorded from 153 participants using either a logging GPS device (QSTARZ BT-Q1000p GPS Travel Recorder powered by DC output from in-vehicle cigarette lighter) or a real-time communicating GPS device (adapted from the system deployed in the Commute Atlanta study [ 30 ]) installed in the travelers’ vehicles. In this study, an observed trip is defined as an observed journey from a single origin to a single destination for one traveler at a specific time. For example, for the same origin and destination, even if a traveler uses the same route on two different days, these two journeys are defined as two separate observed trips. In this study, only morning trips are considered. Trips finished within 1 min are assumed to be short journeys for parking and are removed. In a few cases where travelers detour 1.5 to three times the shortest distance to their workplace, these trips are assumed to be to pick someone up or have other purposes and are excluded. The filtering process and results are presented in Table 2.
Data Processing
As shown in Figure 1, the Lawrence Group (TLG) road network for the Twin Cities is used in this study, and it includes 108,561 nodes and 277,747 links. Cleaned trajectories are then matched to the TLG network by K-nearest neighbor (KNN) approach ( 31 ). As shown in Figure 2, an algorithm was developed and applied to ensure all matched links form a complete route.
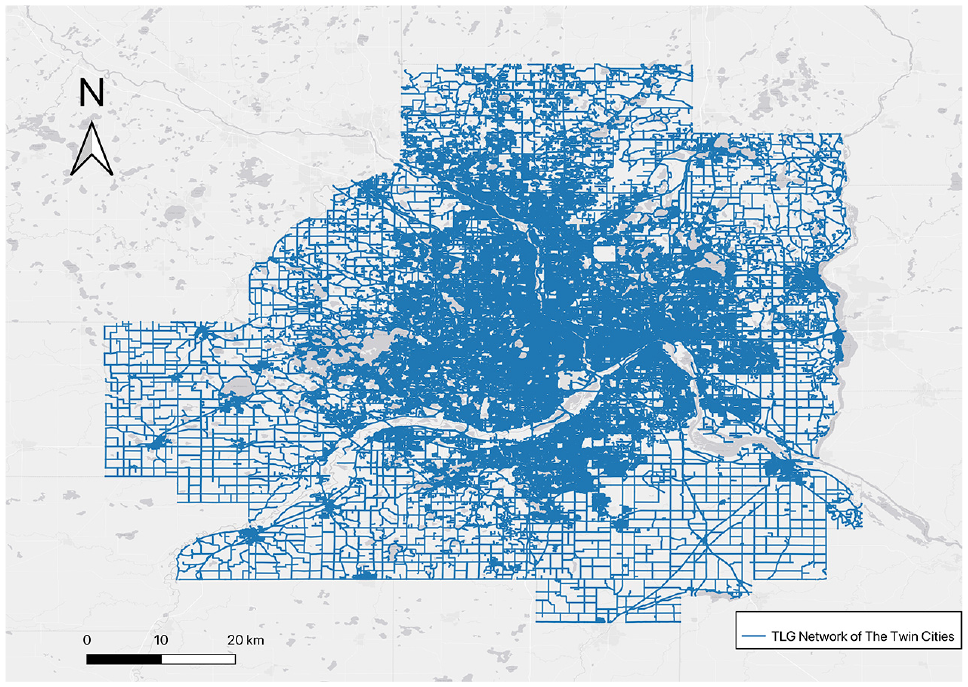
The Twin Cities road network from the Lawrence Group (TLG).
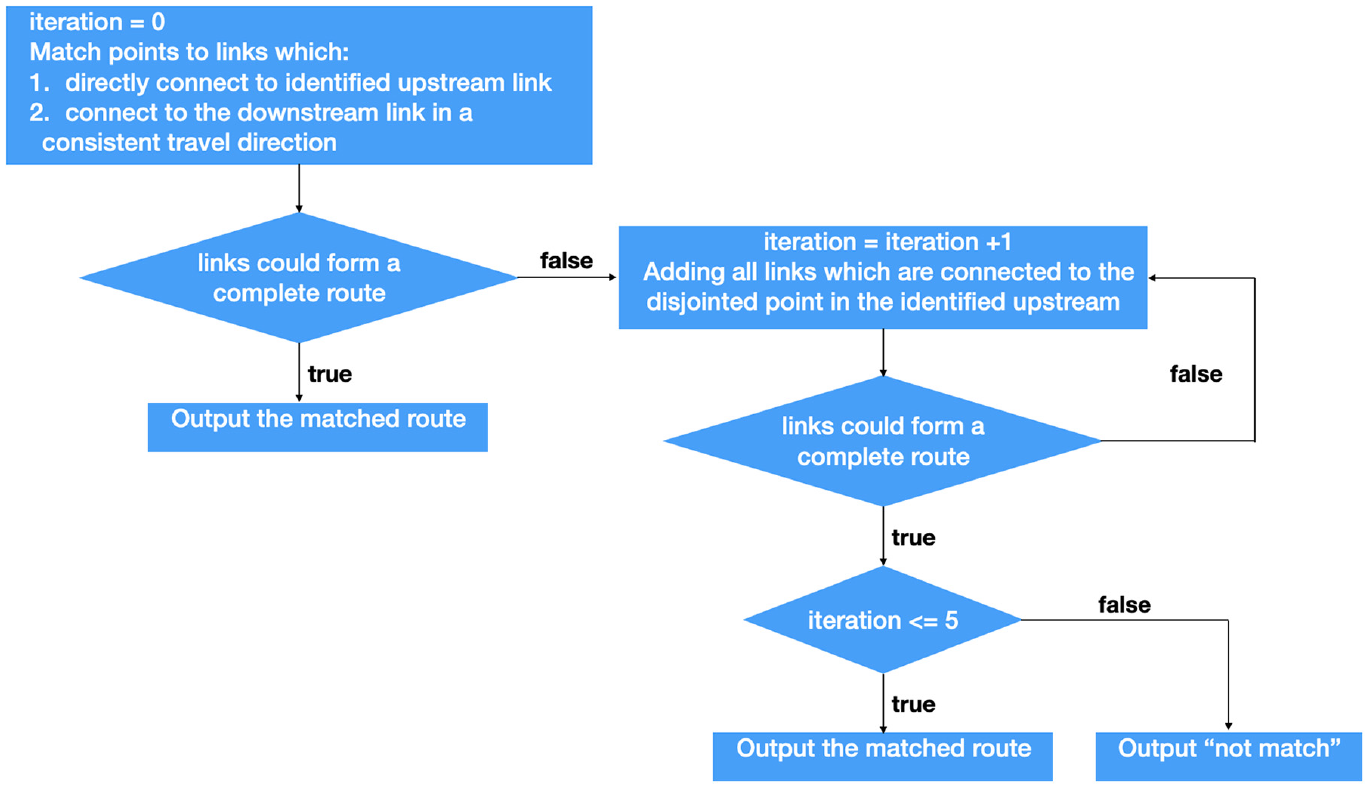
Map matching algorithm.
In rare cases, multiple complete routes are formed by adding potential links connecting disjointed points upstream. In this case, the shortest one is selected, assuming people will avoid a local detour. For the privacy safety consideration, the records for the points at which people start and end are not their real origin and destination. In this case, a 100 m tolerance zone is set at their reported origin and destination. Finally, all 4,538 trips were successfully matched, and 1,940 OD pairs were included.
Link Attributes
Road attributes such as length, speed limit, road type, number of traffic lights, number of bus stops, and travel direction are gained from TLG network. Three sources of real-time speed data are applied in this study.
The first is TomTom speed data which was gained by aggregating millions of GPS logging and navigation devices from the Twin Cities metro region ( 32 – 34 ). The travelers in the I-35W study did not use TomTom as their guidance, and the TomTom speed data were collected in a different year (2011). Additionally, this study focuses on morning trips, so morning peak hour (7:00–9:00 a.m.) in TomTom speed data is combined with TLG network. For a few roads in the TLG network, TomTom speed network splits those roads into several links and records speeds for those links separately. In this case, speeds of the longest link are used to present the travel speeds for the road. To simulate real travel time on each route, the real travel time for a traveler on each link is needed, but the TomTom data only has the travel speed distribution on each link. For example, the fifth percentile travel speed represents the lowest 5% recorded speed on each link, and for every 5% from the fifth percentile to 95th percentile, TomTom data provide an aggregated travel speed. Therefore two extreme scenarios are used in this study:
Perfectly correlated scenario
Perfectly independent scenario
Additionally, travel speeds from loop detectors and the GPS speeds from all 153 participants in the I-35W Bridge Collapse study are also included in this study. Both have smaller sample sizes compared with the TomTom speed data. Of course, we could have used the GPS data itself to generate a speed map and used the average speed of all links to represent the travel speed for non-used links ( 29 ), but as the 2011 year TomTom data has recorded travel speed on most of the links and is available to us, we used it to represent the link travel speed in this study.
For all three sources of real-time travel speed data, not all links in the TLG network have speed records. The 2008 to 2009 street images in Google Maps are used to check those links, and we find that most of the links are local streets. Based on that, we assume these are low traffic roads, and therefore, speeds are assumed to be 15 mph (25 km/h).
Choice Set Generation
Choice set generation is an important step before modeling individual route choices, and quality and size significantly affect the modeling results. The high-resolution TLG road network provides an advantage in accuracy of the paths, but it also results in higher computational complexity in the route search process. As TomTom speed data records 19 travel speed percentage bins (every 5% from 5% to 95%), a simulation method is used to find alternative routes.
Overall, 19 draws based on 19 travel speed percentage bins defined in TomTom speed data are performed for the perfectly correlated scenario
For the perfectly independent scenario
The labeling and link penalty approaches are combined to generate alternative routes with TomTom and free-flow speed data. The general steps are:
First step: Define a label.
Second step: Determine a penalty or bonus factor and apply the factor to all related links in the road network.
Third step: Search the path which satisfies the predefined label in the first step for all OD pairs, such as “Minimize travel distance.”
Fourth step: For some labels, we want multiple paths rather than a single path. Before finding the K+1th path for these labels, we add a penalty factor to all links in the kth path and update those links in the road network.
Fifth step: Once all labels are completed, form a choice set with the generated alternative routes.
Labels used in this study are categorized into time-based paths and distance-based paths.
Time-Based Labels
Time-based paths find alternative routes with the least travel time under different conditions. The measurable link attributes for these kind of labels are travel time. Freeways, which normally have faster travel speed, good road surface condition, and no traffic lights, are attractive for many travelers. However, as they have fewer intersections, traveling on freeways often results in a somewhat longer travel distance. To investigate the trade-off for the benefits of freeway, a link penalty method is applied. A set of penalty weightings (0.33, 0.6, 0.7, 0.8, 0.9, 0.95, 1.0, 1.05, 1.11, 1.25, 1.43, 1.67, 3.33) are multiplied by the link travel time on freeway links to identify the weighted fastest path. The same process is implemented for free-flow travel time, travel time under the perfectly correlated scenario
As the TLG network includes many more links and nodes, the computational costs for generating K-paths are high. Therefore, 20 shortest time paths are found for each three factors (0.3, 0.8, and 1.0) with free-flow travel time. For scenario
Distance-Based Labels
Distance-based paths find alternative routes with the least travel distance under different conditions. The measurable link attributes for these kind of labels are link length, and based on the shortest distance path(s), some further searching processes are made to optimize target labels.
“Shortest distance”: One shortest distance path is found for each OD pair.
“Minimum left turns”: Since turns are actions of vehicles rather than properties of links, it is hard to find the minimum left-turn path for a given OD pair directly by using the NetworkX package in Python ( 35 ). Instead of finding the minimum left turns path in the network, this study identifies the minimum left turns path of the 20 shortest distance paths.
The link penalty approach is used to generate the 20 shortest paths in this study. For example, before finding the K+1th shortest path, a penalty factor is multiplied to each link in the kth shortest path, and the the K+1th is found based on the updated network with those penalty links. Penalty factors of 1.05, 1.2, and 99 are used in this study.The reason for using 99 is that we find that even if we use the 1.2 penalty factor to exclude the link in the last shortest path, we still get the same path or a path with just small differences to the last shortest path. However, if we eliminate the link in the last shortest path, we might lose the links in the observed trips. Therefore, we used a very high penalty factor for the links in the last shortest path to obtain a much different path. Overall, as shown in Table 3, 47 time-based labels and five distance-based labels are included.
Summary of Labels
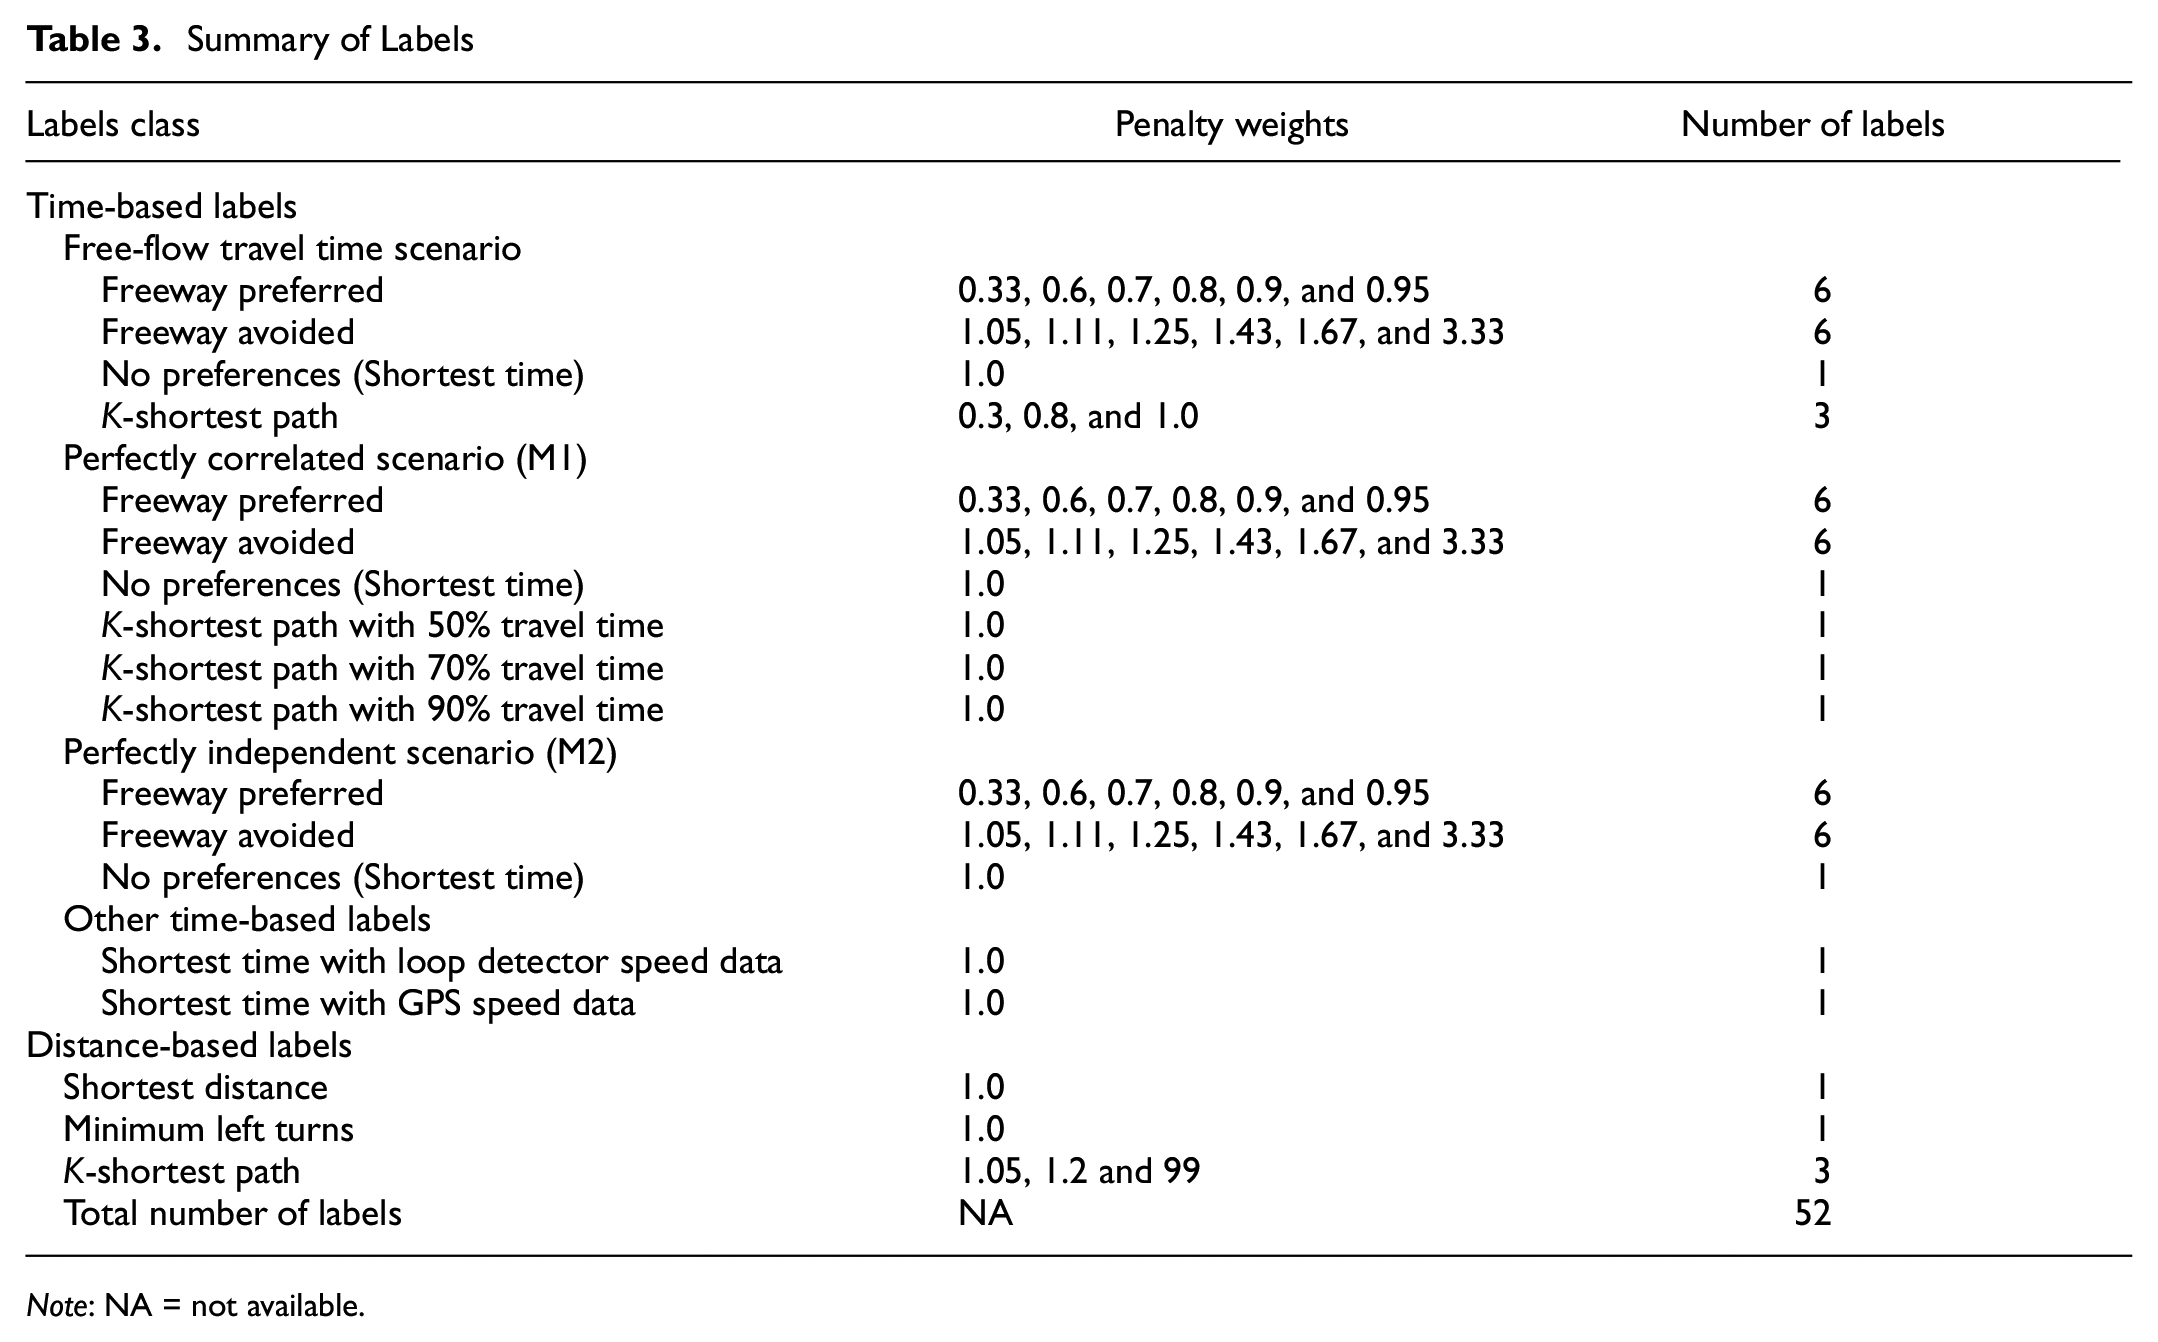
Note: NA = not available.
Choice Set Evaluation
Overlap
The common choice set performance indicators are overlap rate and capture rate. Overlap rate measures the percentage by which generated routes overlap the observed trajectory, as shown in Equation 1.
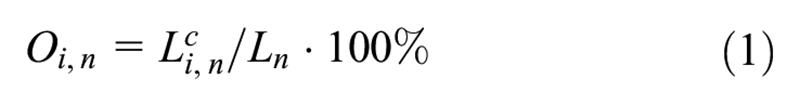
where
For an observed trip, the overlap rate between each generated alternative route and the actual route is calculated. The same process is repeated for all observed trips
Capture rate describes the percentage of the set of observed trajectories that are captured by the generated routes under a specific overlap threshold. For an observed trip, if any alternative route in the choice set has an overlap rate greater than the threshold, then this observed trip is defined as “captured.” For example, capture rate of 43% for 80% overlap threshold means that for 43% of all observed trajectories in the sample set, more than 80% of those trajectories spatially coincide with the selected algorithm. Both overlap rate and capture rate are used to show the performance of the choice set generation algorithms. Overlap thresholds of 50%, 60%, 70%, 80%, 90%, and 100% are used to measure capture rates.
Deviation
In a high-resolution road network, there exist many objective routes (alternative routes) which slightly deviate from target routes (observed trip) ( 22 ). Some generated routes which have no overlap with observed trips might be one block or several meters away from the used route. The cause of those small deviation varies with factors such as traffic light phase, influence of temporary road conditions, a gap in the traffic, and some potential personal preference which could not be identified based on collected information. Compared with routes which are far from observed routes, these “closer alternative routes” are also important ( 36 ), so only using overlap rate to evaluate choice sets might be insufficient. Therefore, a term called “average deviation” is calculated based on Equation 2, and applied in this study.
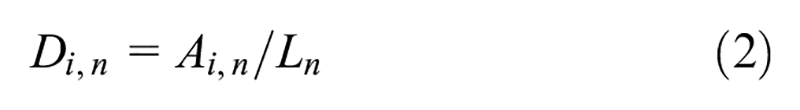
where
A list of deviation thresholds: 5 m, 50 m, 100 m, 200 m, 300 m, 400 m, and 500 m, are tested.
Explanatory Variables
After obtaining a choice set with good performance, to understand and predict route choices, this study evaluates which variables explain route choice. Both linear models and logit models are used in this study. We model the overlap and route choices as being determined by a set of independent variables described as follows:
Length (m): Trip length
Traffic lights coverage: Length of link with traffic lights divided by trip length
Bus stops coverage: Length of link with bus stops divided by trip length
Free-flow travel Time: Travel time-based on speed limit
Free-flow speed: Trip length divide by free-flow time
Freeway percentage: Freeway length divided by trip length
Left turns: The number of left turns along the trip
Right turns: The number of right turns along the trip
Traffic lights: The number of traffic lights passed along the trip
Bus stops: The number of bus stops passed along the trip
Path size: Between 0 and 1, 1 for unique route
If the angle between the two connected road segments is between 30 and 150 degrees, the movement through these two segments is defined as a turn.
Linear Overlap and Deviation Models
In this study, a linear model which predicts the performance (overlap or deviation) of the alternative route is introduced. As GPS trajectories are collected from the same group of participants for a period of time, panel regression models are applied. All attributes shown in the “Explanatory Variables” section are taken as independent variables, and dependent variables including overlap rate
For both
For overlap: alternative routes with shorter trip lengths, less travel time, fast travel speeds, higher percentage with freeway, and less turns are more likely to have higher overlap with the observed trip.
For deviation: alternative routes with long trip lengths, longer travel time, lower travel speeds, lower percentage with freeway, and more turns are more likely to have higher deviation with the observed trip.
Route Choice Models
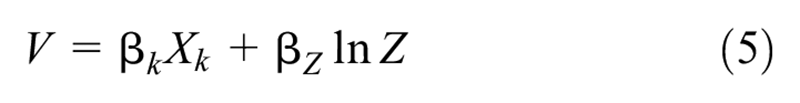
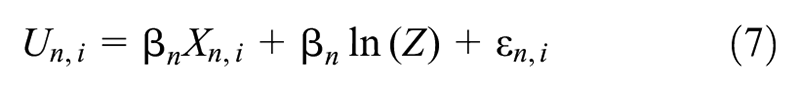
To model travelers’ route choices, a mixed logit model is applied. The utility
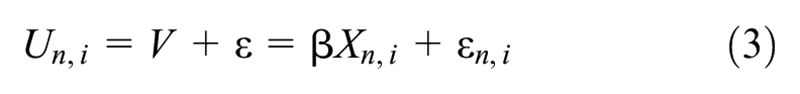
where
Generated alternative routes in the choice set might overlap partially or completely with each other. The path-size logit model adds a path-size
where
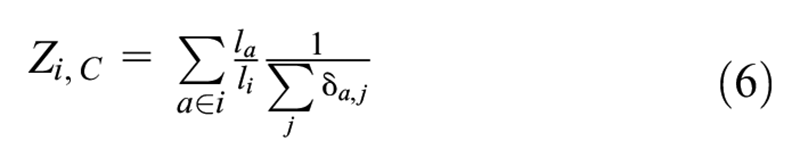
where
Since observed trips are recorded for multiple participants, heterogeneity might exist across people. However, multinomial logit models and path-size logit models do not consider variation among travelers. Therefore, mixed logit, which allows the coefficient
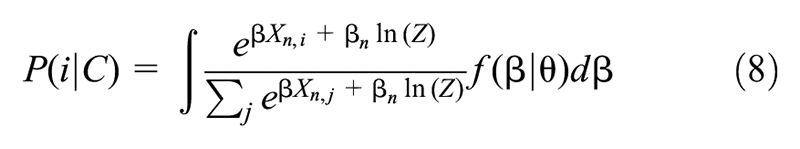
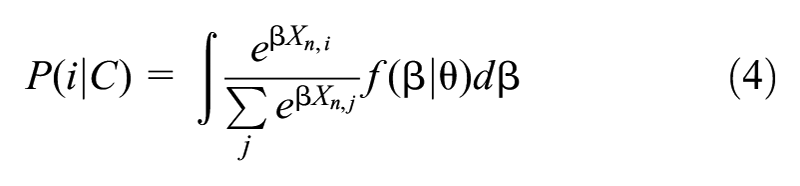
All the logit models presented above aim to predict the probability of selecting one route from the choice set
Results
Overlap
For all route generation algorithms described in the “Methodology” section, the alternative routes are compared with the observed trip, and the overlap rate is measured. The results are presented in Table 4. If the two generated routes are not exactly the same, they will be identified as two unique routes. As the overlap rate threshold increases, more observed trips are shared in the routes generated from the algorithms. Thus, the capture rate decreases with the increase of the overlap rate threshold for all labels.
Capture Rate for Various Labels Under Different Overlap Thresholds
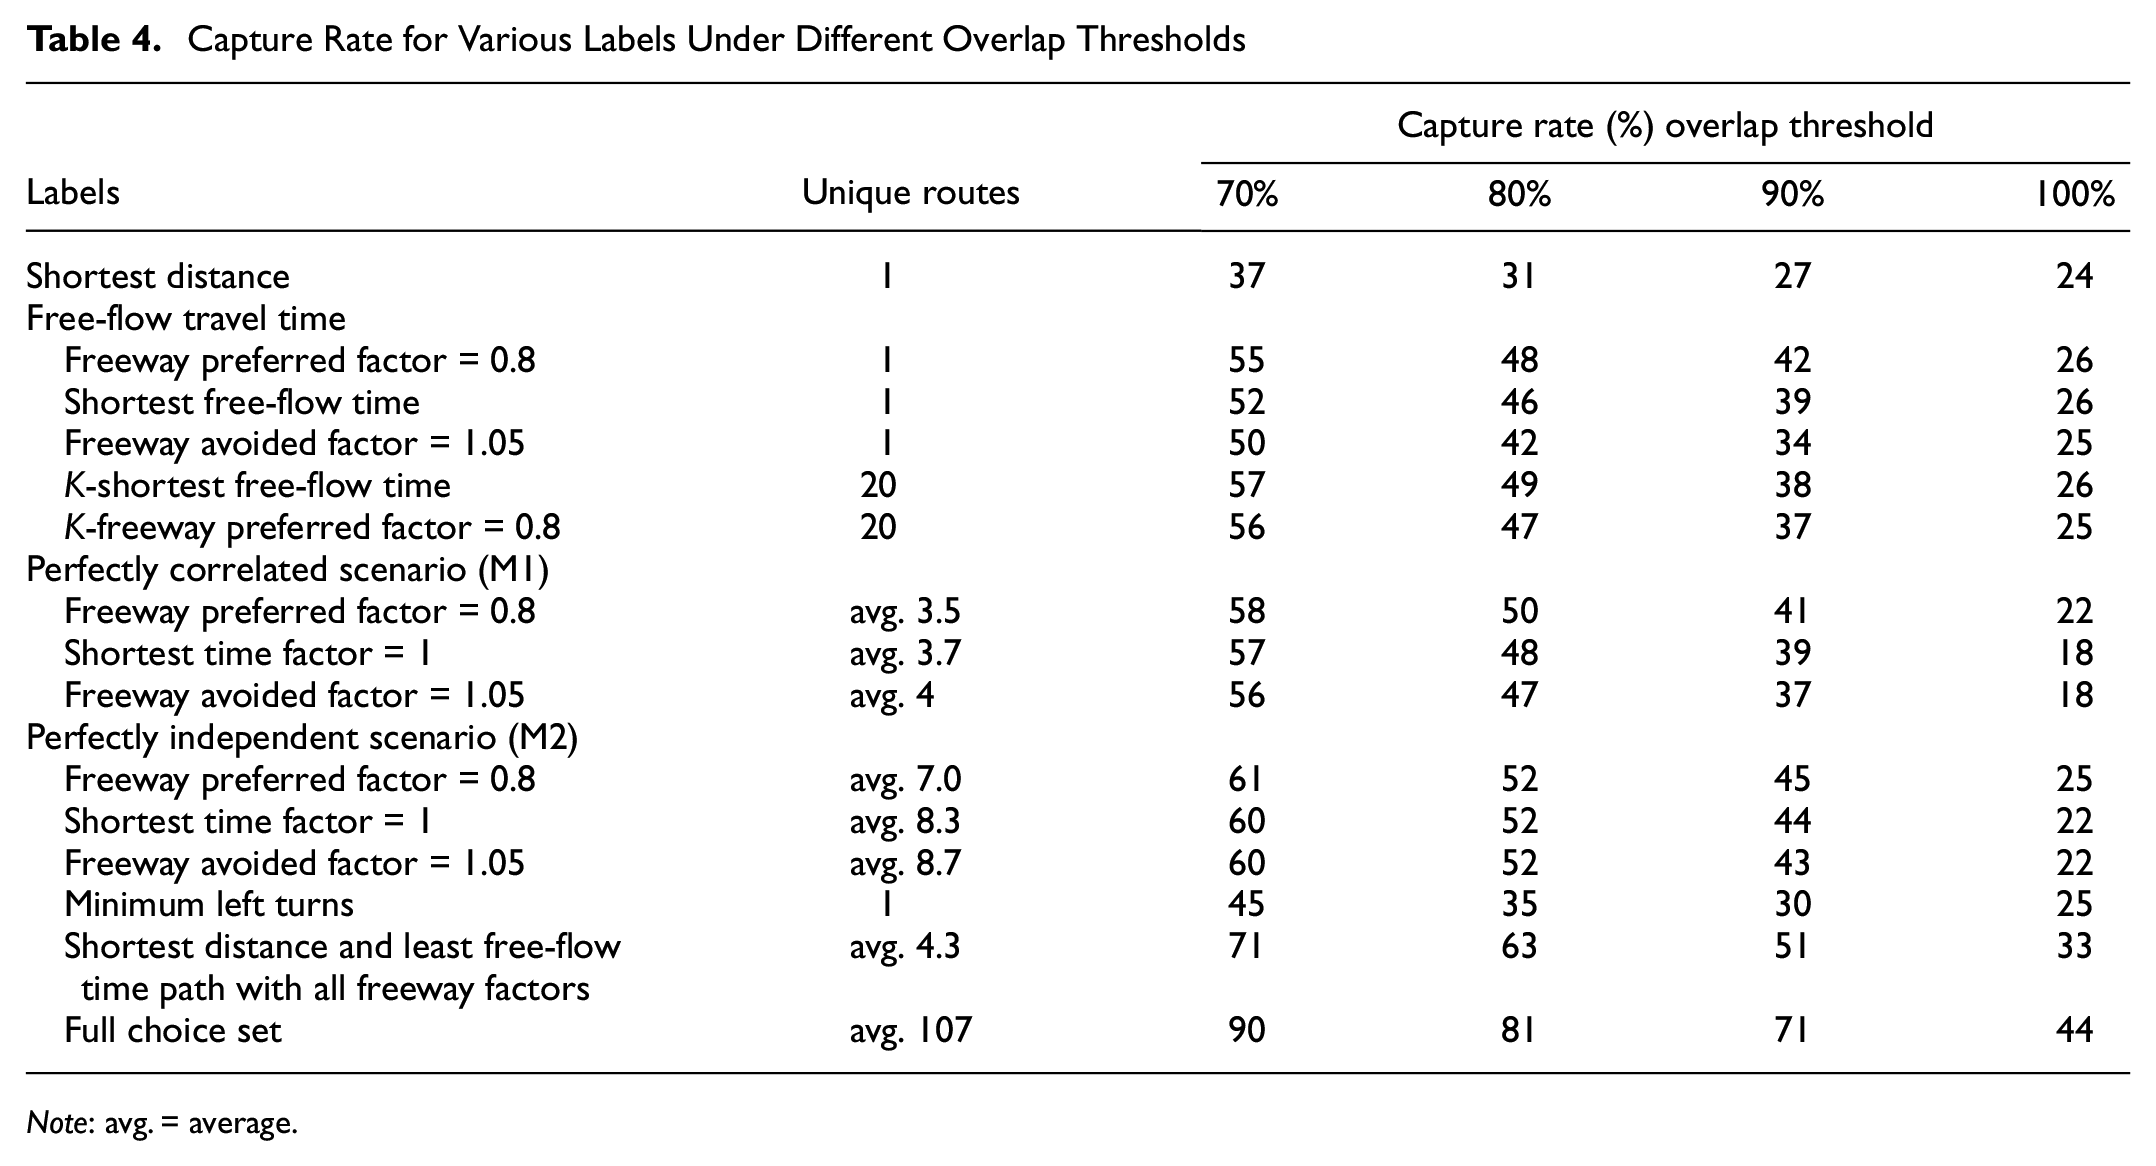
Note: avg. = average.
Shortest distance path and shortest free-flow time are common labels used in previous studies. The capture rates under various overlap thresholds for these labels are presented in Table 5 and compared with past studies.
Percentage of Observed Trips Captured by Shortest Distance Path and Shortest Free-Flow Time Path Under Various Thresholds
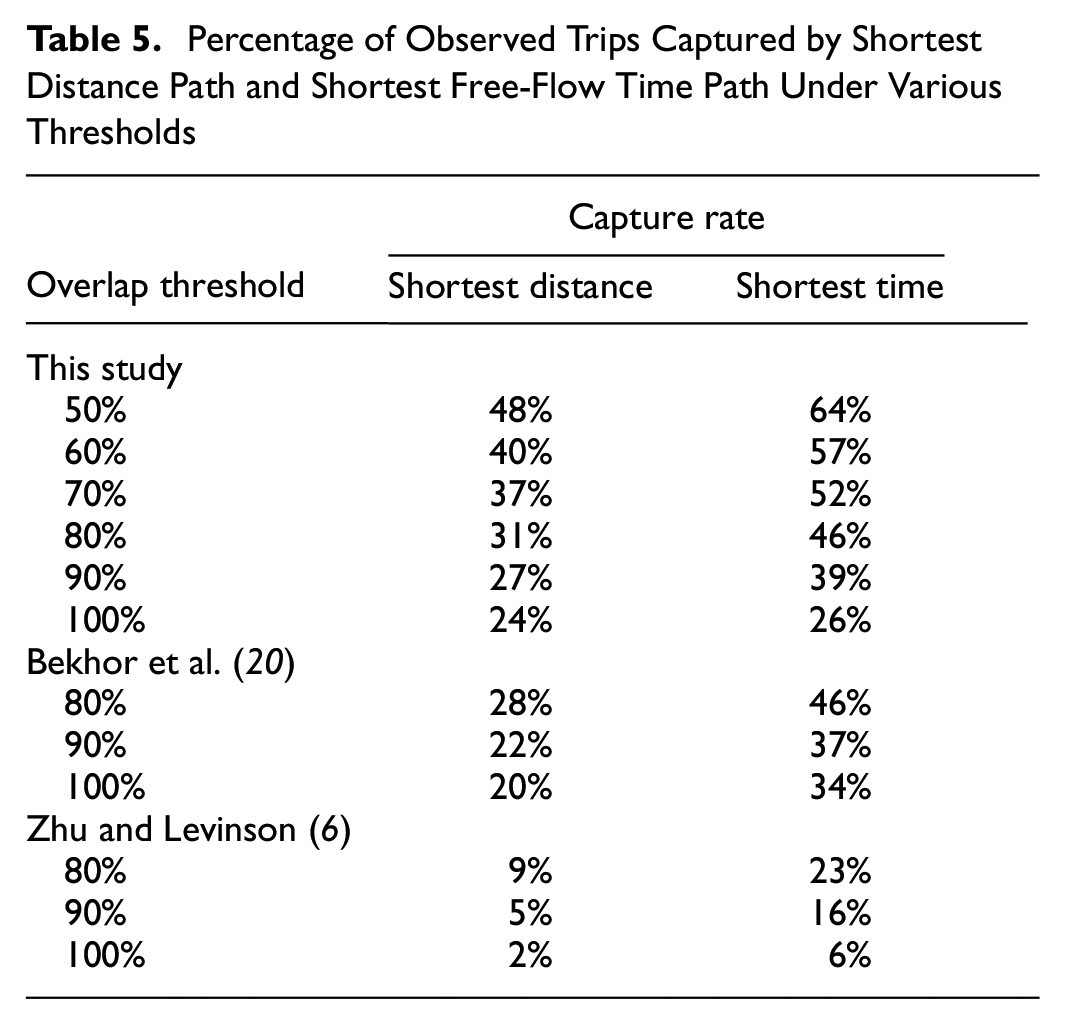
Comparing results with those from Bekhor et al. ( 20 ) and Zhu and Levinson ( 6 ), the shortest free-flow path captures more observed routes in all three studies.
As shown in Figure 3, the capture rate shows a rising trend at the beginning stage and reaches a peak value when the freeway factor ranges from 0.7 to 1.11; a continuous decline is found after achieving the peak value for all three scenarios. For a perfect match (overlap = 100%), even the number of unique routes found based on free-flow travel time is smaller than the other two scenarios, it captures most observed trips with a factor not less than 0.7. According to Figure 3, in general, the freeway-preferred path captured a greater percentage of observed trips than the freeway-avoided path in all three scenarios.
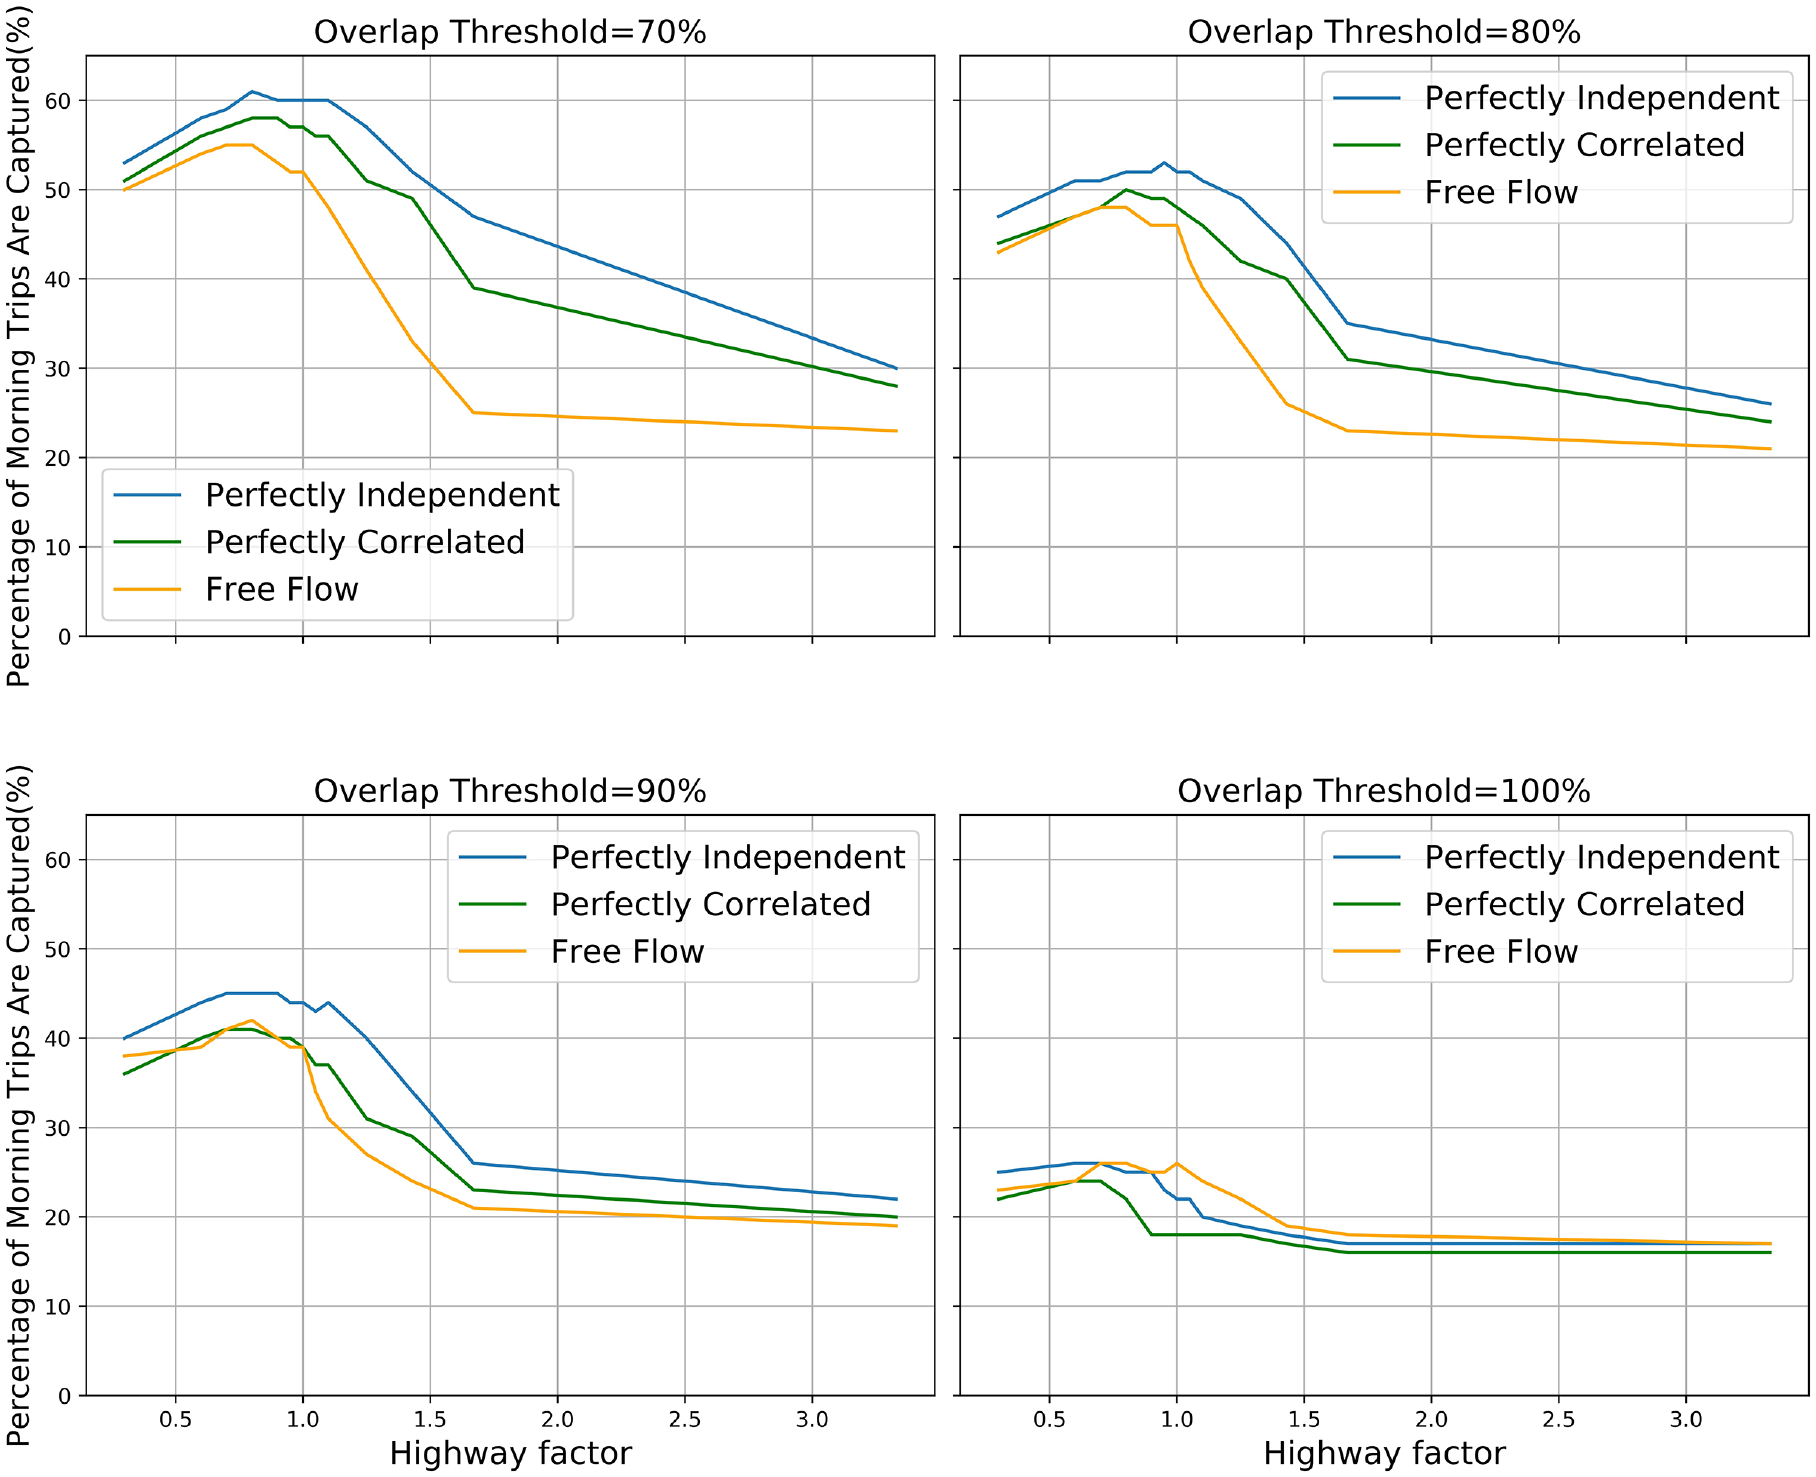
Comparison of capture rate under different thresholds for each freeway factor in three scenarios: free-flow, perfectly independent (M2), and perfectly correlated (M1).
As described in the “Methodology” section, there are 52 labels applied, and on average 107 unique routes are defined for each observed trip. Considering the marginal effect of adding more alternatives to the choice set, for each iteration, only the label which makes the choice set have the highest capture rate is added to choice sets to measure the capture rate of the choice set. The best label here means, by using this label, the most uncovered trips are captured in the choice set. Figure 4 shows the cumulative capture rate of adding results of the best label for a total of 10 best labels under a threshold equal to 80%. The increase in rate of capture rate rise tends to be small (roughly 1%) after using six labels.
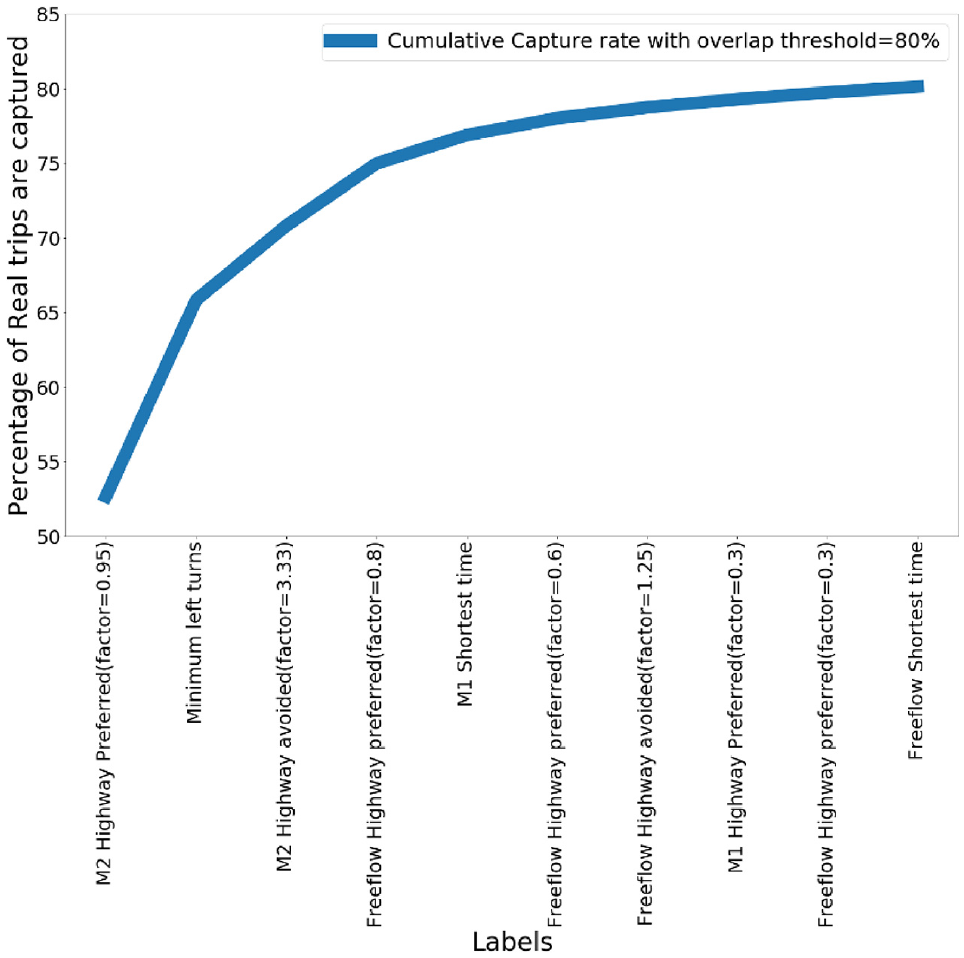
Cumulative capture rate of adding 10 best labels in choice set.
Deviation
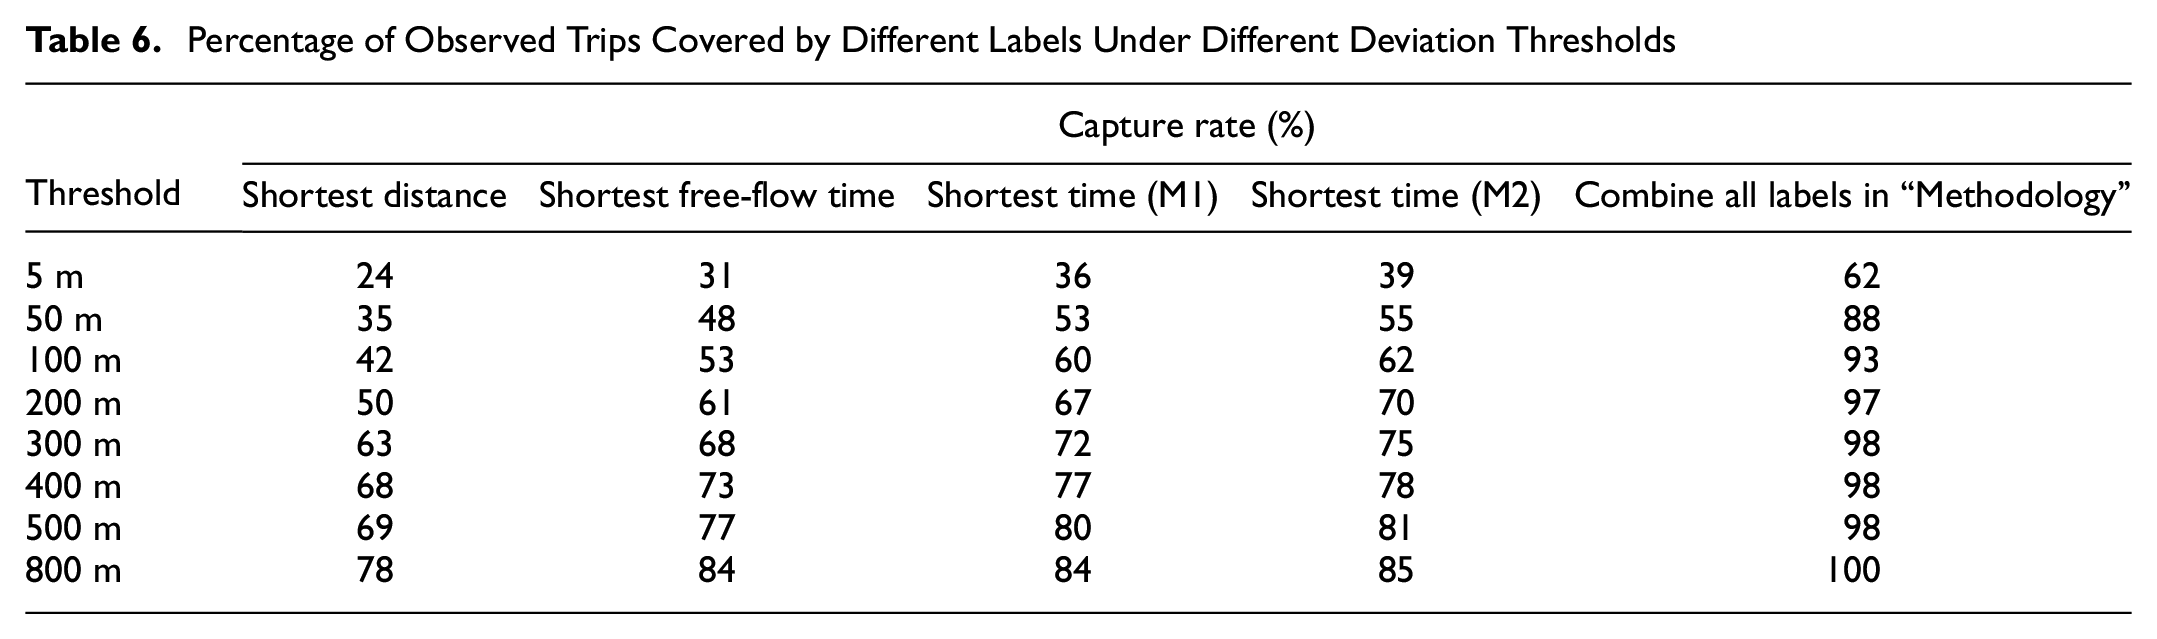
The results of capture rate for eight different deviation thresholds are presented in Table 6. Of the observed trips, 88% have at least one generated alternative route with an average deviation less than 50 m.
Percentage of Observed Trips Covered by Different Labels Under Different Deviation Thresholds
Overlap Versus Deviation
Both overlap and deviation can be used to assess the performance of choice sets. A comparison is made between predicting deviation and predicting overlap to determine the most suitable independent variable for the analysis. To simplify the process, a choice set which includes the “shortest distance path” and 13 “least free-flow time paths with different freeway factors” is used. With 70% overlap threshold, 70% of observed trips could be captured by this choice set.
According to the Breusch-Pagan test (
For deviation: longer distances and less freeway percentage are associated with larger average deviation from the observed trip.
For overlap: higher freeway percentage and shorter distances, right turns, traffic lights, and bus stop coverage, are associated with high overlap with the observed trip.
Overlap Versus Deviation
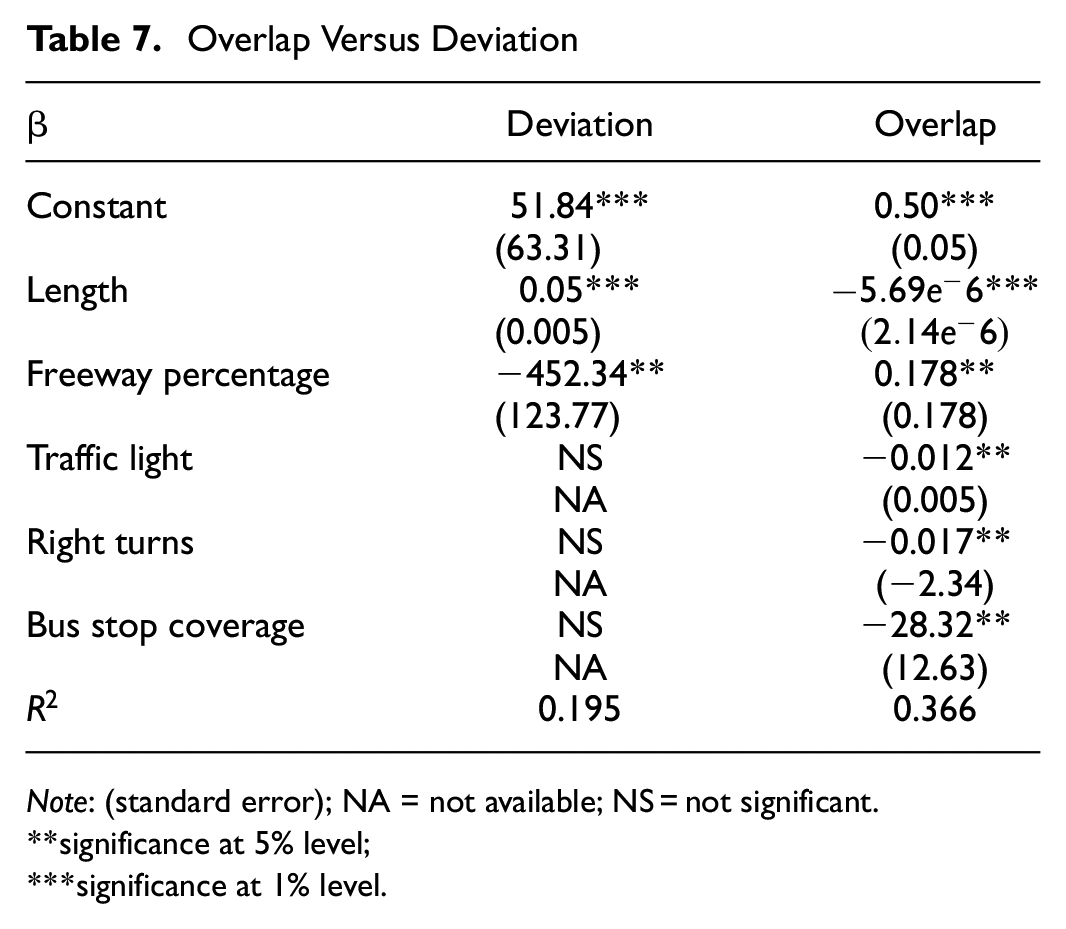
Note: (standard error); NA = not available; NS = not significant.
significance at 5% level;
significance at 1% level.
For the remaining models, overlap is selected as the independent variable for the linear model, and the selected alternative is defined based on the maximum overlap. Future research should test deviation in more depth.
Linear Model
As presented in Figure 4, with 80% overlap threshold, a choice set which is generated based on the first 10 labels captures 80% of observed trips. This best-10-label choice set averages 40 unique routes for each OD pair and is applied for the route choice modeling process. Similar to above, the random effects model is suggested for modeling the overlap for the best-10-label choice set, and
Random Effects Model With and Without Path-Size Term
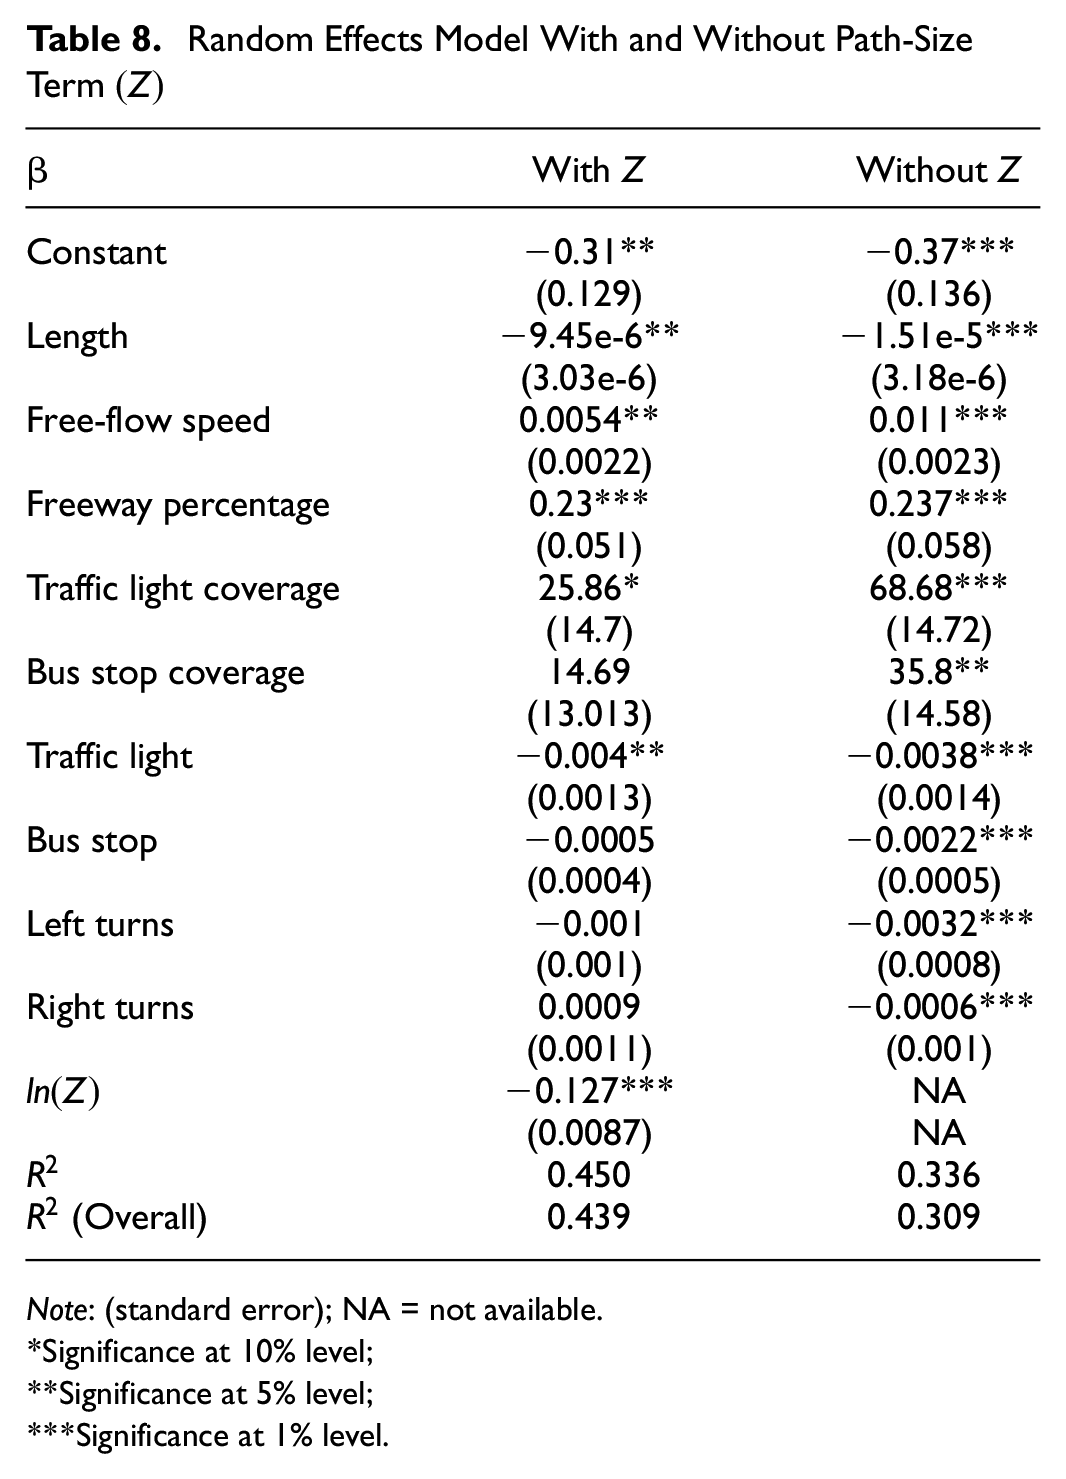
Note: (standard error); NA = not available.
Significance at 10% level;
Significance at 5% level;
Significance at 1% level.
Logit Model
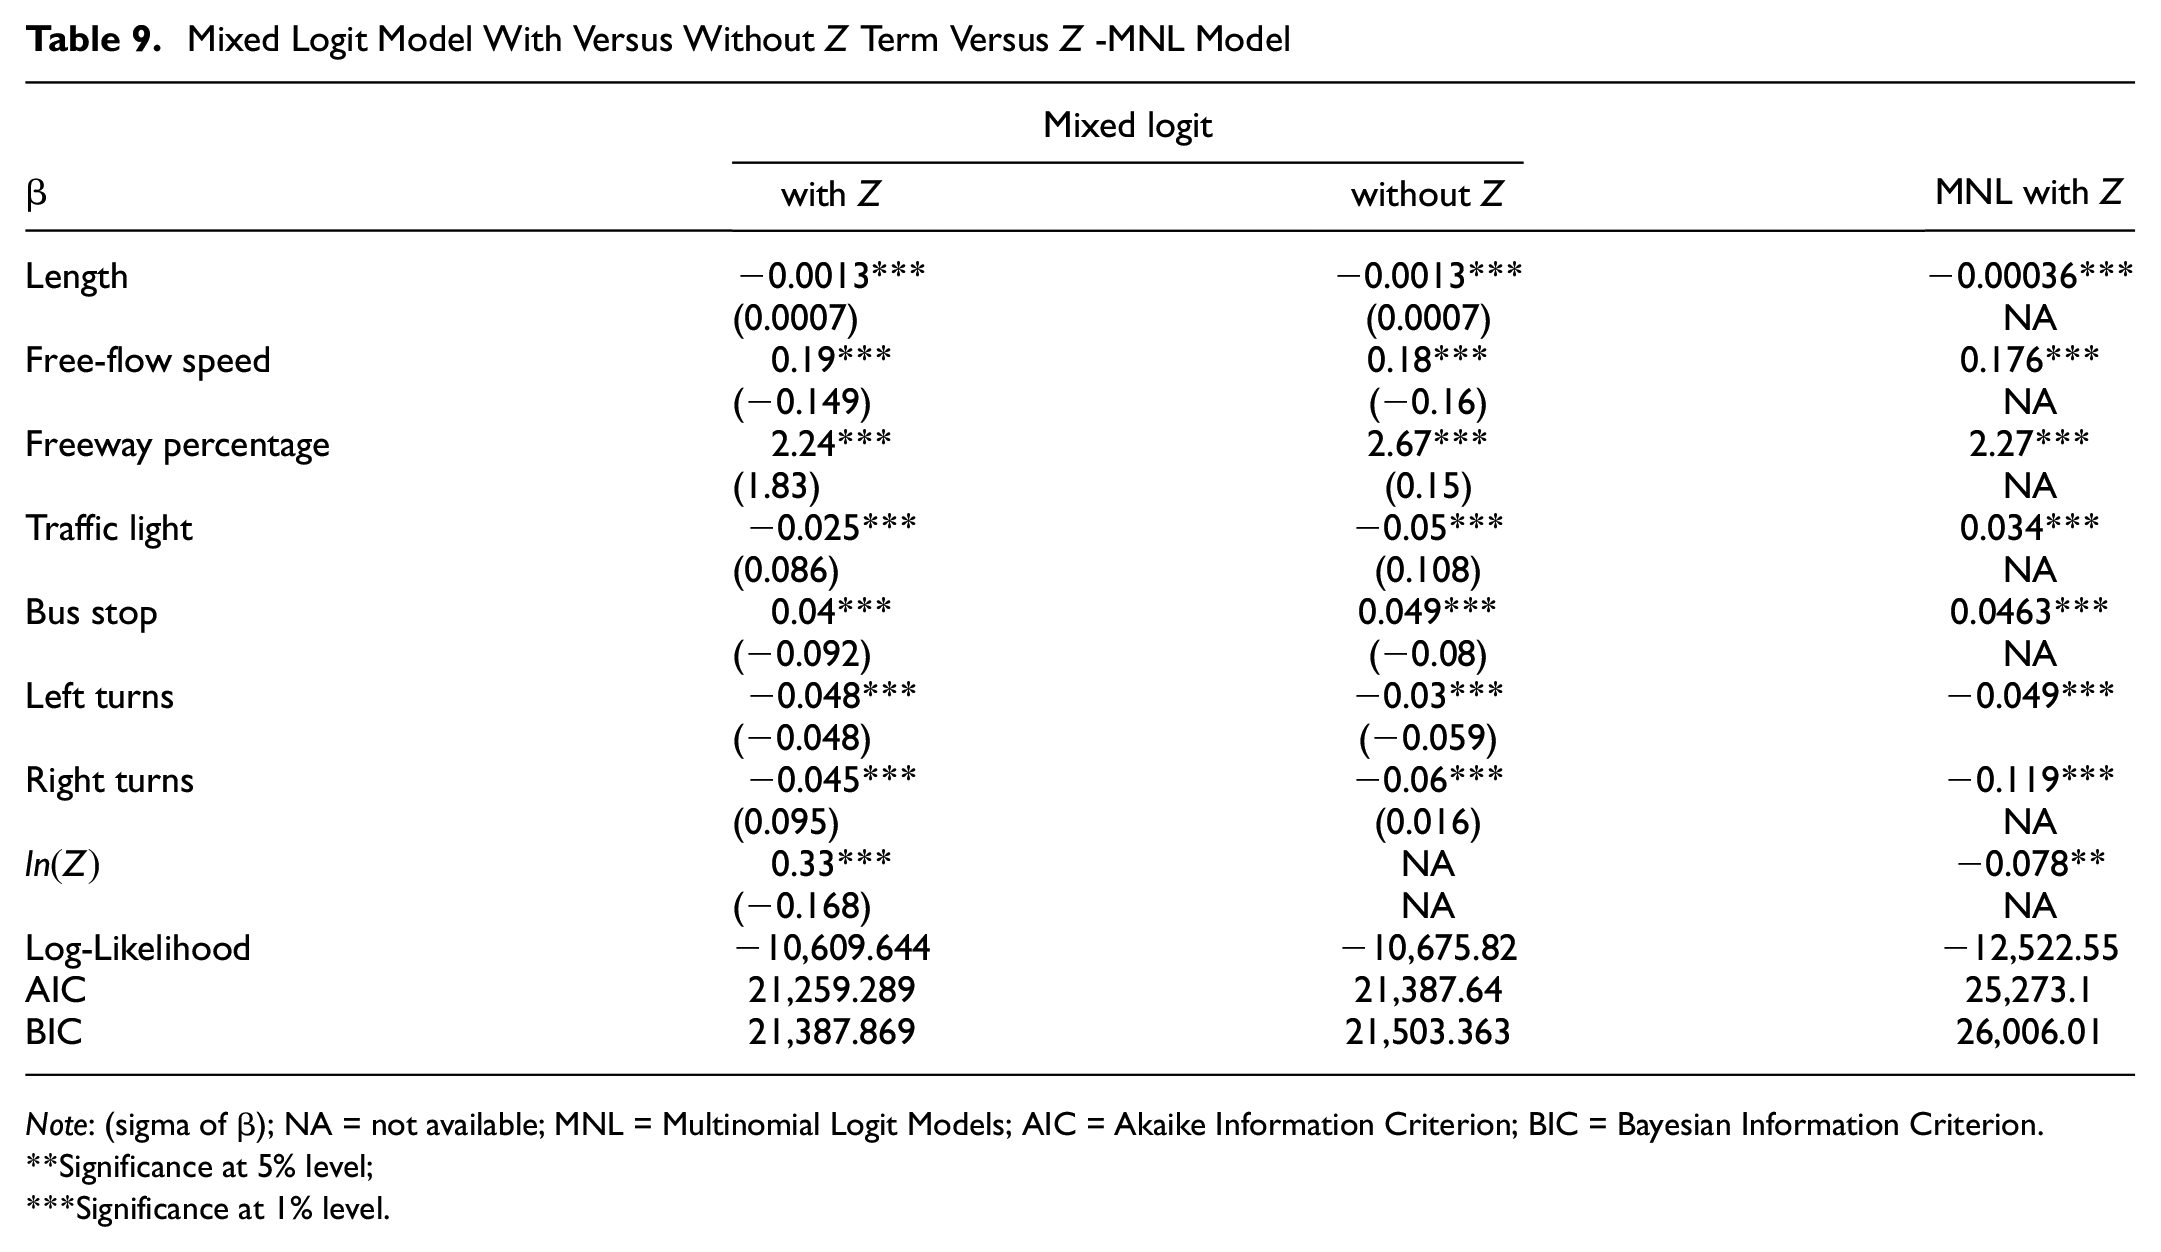
As described above, overlap is used to determine the selection of routes in the choice set. The coefficients
Mixed Logit Model With Versus Without
Note: (sigma of
Significance at 5% level;
Significance at 1% level.
Discussion and Conclusion
When dealing with a high-resolution road network and GPS trajectories, it is difficult to generate a parsimonious choice set that can capture the most trajectories across an observed trips set. Relying on only one choice set generation method is not sufficient because, as more links and nodes are included in the network, the number of possible routes between an OD pair rises. Additionally, as the number of links around a point increases, map matching results on high-resolution graphs are more likely to be affected by inaccurate GPS points. However, the high similarity of the high-resolution graph with the real-life network suggests the analysis results are more useful.
This study combines labeling, link penalty, and k-shortest path algorithms and uses recorded travel speed and free-flow speed to generate choice sets for route choice modeling. The high-resolution road network of the Twin Cities, which includes 108,561 nodes and 277,747 links, is applied. Compared with the choice set in the other studies in Table 1, we achieve almost the same capture rate (80%) as Bekhor et al. ( 20 ) did, but our network is much larger than their network (108,561 nodes and 277,747 links versus 13,000 nodes and 34,000 links). For the same level of network size, compared with the study from Rieser-Schüssler et al. ( 22 ), we gain a higher capture rate (around 80% versus 75%) with fewer alternative routes for each OD pair in the choice set (40 versus 100). The choice set generation results are improved compared with previous studies and could be applied to other datasets to improve the choice modeling results.
A panel regression model is also applied to model the overlap between alternative route and observed route. With the same initial attributes, a random effects model is used for predicting the overlap between alternative route and observed route, and the
According to the results presented in Table 5, alternatives based on the least travel time match more observed trips than those based on the shortest distance. For most drivers, the travel time might be more important than distance when they plan morning trips. Moreover, for both free-flow travel time and TomTom travel time, multiplying freeway links by a factor (factor = 0.8) when applying the shortest path algorithm improves the capture rate (more than 50% and 40% for 80% and 90% overlap threshold), as most drivers prefer freeways over surface streets. We also observe that assuming the link travel time is perfectly independent (M2) captures more observed trips than assuming travel time is perfectly correlated (M1) or free-flow travel time. This is because the alternative routes which are found based on the M2 scenario are more realistic.
A list of penalty factors (weighting freeway times versus non-freeway times) is added to freeway links on both free-flow and observed conditions, and factors within 0.8 to 1.0 normally capture more observed trips under almost all overlap thresholds. With the same number of iterations and the same penalty, compared with the result when assuming link travel time is perfectly correlated, more unique routes could be generated if we assume travel time for each link is perfectly independent, and more observed trips could be captured by the alternative routes. By using the best 10 labels to generate, on average, 40 unique routes for each OD pair, around 80% of observed trips could be captured under 80% overlap threshold. Combining all labels in this study, the generated choice set could capture 81%, 71%, 44% of observed trips with overlap threshold set to 80%, 90%, and 100% respectively. There is a significant drop from 71% to 44%, but it follows the expectation. Many factors influence route choices, and some of them are unknown to the modeler or even to the traveler themselves. Therefore, generating routes that are the same as the observed trips is challenging. It is very hard for the modeler to know those reasons based on the GPS trajectories. Besides that, 88% of observed trips have at least one generated alternative route with an average deviation within 50 m.
Based on statistical evaluation of the models, a mixed logit model with path-size term shows better log-likelihood, AIC, and BIC than path-size MNL model and mixed logit model without that term. But from an application perspective, it might not be a “better” one. As described in the “Methodology” section, the coefficients
Footnotes
Acknowledgements
We are thankful to the development team of NetworkX, the development team of Biogeme, and the development team of “pylogit” for making their Python packages open source.
Author Contributions
The authors confirm contribution to the paper as follows: study conception and design: H. Wang, E. Moylan, D. Levinson; analysis and interpretation of results: H. Wang, E. Moylan, D. Levinson; draft manuscript preparation: H. Wang. All authors reviewed the results and approved the final version of the manuscript.
Declaration of Conflicting Interests
The author(s) declared no potential conflicts of interest with respect to the research, authorship, and/or publication of this article.
Funding
The author(s) received no financial support for the research, authorship, and/or publication of this article.