
Abstract
This research developed an agent-based model that evaluates the impact of neighborhood design on travel behavior while accounting for habit formation, social interactions, various levels of information provision, and awareness of transport and land use system changes. The developed model employs a framework that integrates random utility maximization theory with reinforcement learning concepts to account for the bounded rationality and knowledge learning process. Moreover, the model utilizes the diffusions of innovations theory to simulate how agents propagate information across family members and co-workers. It also adds a time dimension to the modal shift process, which could be used to indicate the relative duration to reap the full benefits of proposed scenarios. The model was applied to a neighborhood in Kelowna, British Columbia, Canada, to assess the impact on travel behavior of the SMARTer growth principles. The results showed that retrofitting non-motorized networks has more impact on modal shift than retrofitting road networks. This implies that infrastructure investments related to providing more accessibility for non-motorized users may be more socially and sustainably profitable than investments in policies targeting auto users. In addition, the results revealed that land use policies led to higher modal shift to non-motorized modes compared to retrofitting the transportation network, which highlights the importance of integrating land use and transportation planning. Similarly, the results demonstrated that transportation demand management policies can provide a positive stimulus to commuters to maintain familiarity with active transportation (AT) modes, which led in the presented case study to an increase in AT modal share.
Keywords
Auto-dependency has caused many public health challenges for North American citizens, including the increase in physical inactivity rates, road collisions, and greenhouse gas (GHG) emissions. Consequently, there has been a growing interest in addressing these challenges by implementing policies aimed at reducing automobile dependency and encouraging people to use more sustainable modes of transportation. However, adopting successful policies depends on the accuracy of transportation models in forecasting the outcome of such policies. Research on travel behavior has been continuously evolving over the past decades with a stream of research focusing primarily on the impact of the built environment, habit formation, and information provision.
A considerable amount of literature has been published on the relationship between the built environment and transportation mode choice, including automobile, transit, and active transportation (AT) ( 1 – 5 ). While most of these studies provided evidence that the built environment influences mode choice behavior, there is still a debate about the magnitude and statistical significance of different built environment factors ( 6 ). For instance, Frank et al. ( 1 ) studied the relationship between the built environment, measured by a walkability index, and physical activity. After controlling for sociodemographic variables, the results revealed a significant correlation between higher AT use and living in a “walkable” neighborhood, characterized by high density, mixed land use, more AT accessible retail, and a connected road network. Zhang ( 7 ) examined the impact of the built environment on mode choice behavior in Boston and Hong Kong. The results revealed that the influence of the built environment measures varied according to trip purpose (i.e., work or non-work) and the trip end at which the variable was measured (i.e., origin or destination). On the other hand, Ogilvie et al. ( 8 ) reviewed 22 studies to assess the effectiveness of various intervention measures on promoting more AT use and less car use, including six papers related to the built environment. Their conclusion suggested that engineering measures have not been very effective in promoting modal shift.
These conflicting findings, in part, have led researchers to explore incorporating habitual behavior into mode choice modeling to better understand why and to what extent people alter their behavior in response to changes in their environment ( 9 – 13 ). For example, Davidov ( 9 ) examined the influence of habit on travel behavior when the context changes. The study found that habit had a significant positive effect on public transit use before the change in context. However, the influence of habit diminished after the change in context. In addition, the study found that intervention measures (i.e., providing information about the transit system and a one-day free transit pass) had a significant positive effect on public transit use after the change in context. Similarly, Verplanken et al. ( 14 ) compared commuting travel behavior of environmentally concerned individuals who had recently moved residence (i.e., change in context) versus those who had not moved residence. They found that the change in context instigated habit reformation and resulted in modal shift toward public transit.
To incorporate this knowledge in mode choice forecasting models, Bowkett ( 15 ) developed an agent-based mode choice model based on utility maximization and the theory of interpersonal behavior to account for habitual behavior of commuters. The model assumed that agents only make intentional choices in the first simulated time step and in the case of a life-event (moving residence or changing job); otherwise, agents repeat their previous behavior. Mallig and Vortisch ( 16 ) developed an activity-based travel demand model that accounts for habitual behavior, which was measured using two indicators: mode usage and mobility style. However, neither previous model accounted for information provision or agents’ awareness and/or familiarity with the available travel options. In fact, much of the research on information provision has been focusing on the role of traffic and transit information (e.g., travel cost and time, delays, transit crowding, etc.) in decision-making of day-to-day travel modes and route choices ( 17 – 21 ). However, travel behavior in small-to-medium sized cities is usually more habitual, compared to larger cities, such that it is less affected by variations in the level-of-service attributes of various travel modes ( 22 ). Nevertheless, several lines of evidence from natural experiments of new transport facilities suggest that changes in the built environment can lead to a change in travel behavior even after controlling for key life-events ( 23 ). Therefore, there is a need for developing a modeling framework that simulates travelers’ adaptation of new behavior in response to changes in the built environment while accounting for habitual inertia and awareness limitations.
In an effort toward addressing this gap, this paper presents an agent-based modeling framework that provides a comprehensive evaluation of the influence of neighborhood design on travel behavior while accounting for social interactions, habit formation, information provision, and users’ awareness of transport and land use system changes. The framework was then demonstrated via an application to assess the benefits of retrofitting a neighborhood using sustainable design concepts.
Literature Review
Much of the previous research on modeling travel behavior decisions related to mode choice utilized discrete choice models based on the fundamental random utility maximization (RUM) framework. According to the RUM framework, travelers select an alternative that maximizes their utility among a set of discrete alternatives that are collectively exhaustive and mutually exclusive. The framework accounts for the modeler’s incomplete information on travelers’ characteristics, trip attributes, and decision-making circumstances by introducing a random error term to the utility function besides the systematic component ( 24 ). The systematic component denotes the deterministic portion of utility while the random error term accounts for the modeler’s uncertainty and captures the unmeasured portion of the utility ( 25 ). The assumption about the distribution of the random error term determines the mathematical representation of the model. One of the most common assumptions is that the error term is independently and identically distributed (IID) following the Gumbel (extreme value type I) distribution, which eventually leads to the multinomial logit (MNL) model formulation ( 25 ).
While the RUM framework accounts for the modeler’s uncertainty, it fails to capture the travelers’ lack of information about the attributes of the trip ( 25 , 26 ). Consequently, the modeler needs to make some assumptions about the rationality of the travelers. The underlying assumption of the RUM framework is that travelers are overly rational with unlimited knowledge of the available options and make decisions based on extremely complex computations ( 25 ). In addition, the rationality assumption implies that travelers are constantly tracking any changes that could occur to the available modes and they are aware of these changes once implemented ( 27 ).
However, it can be argued that the overly rational behavior assumption in the RUM framework does not appropriately describe the human decision-making process and fails to capture its limitations ( 28 ). In fact, the RUM framework describes how travelers should behave, not how they actually do behave ( 26 ). A significant discussion on decision-making was presented by Tversky and Kahneman ( 29 ), who argued that humans tend to reduce the complexity of decision-making and use simple judgmental operations based on heuristic techniques. These findings suggest that concepts such as bounded rationality, which do consider cognitive limitations, are more suitable to describe human behavior. According to the concept of bounded rationality, individuals have limited capacity to access and process information (i.e., limited resources) and rely on simplified thought processes. Therefore, they tend to seek a satisfactory decision rather than an optimal one ( 30 , 31 ).
In addition, physiological factors, such as habits, play a role in influencing the mode choice decision-making process. For example, the theory of repeated behavior proposes that habit is an important factor in determining repeated behavior ( 32 ). This view is also supported by the theory of interpersonal behavior, which suggests that the intention to do a behavior is mediated by both contextual situation (e.g., modal availability, cost, etc.) and habit formation ( 33 ).
All the factors discussed earlier suggest that human decision-making is a complex process that cannot be appropriately captured using conventional mode choice modeling. To overcome the aforementioned limitations, researchers have developed several extensions to traditional discrete choice models such as the nested logit model (relaxes the independence of irrelevant alternatives, IIA, property), mixed logit model (allows for random taste variation), and integrated choice and latent variable models (allows for the inclusion of users’ attitudes and perceptions). However, to the authors’ knowledge, all statistical mode choice models implicitly assume that all individuals are fully aware of the changes occurring in the transportation and land use systems once they occur.
Over the years, a considerable literature has been developed around utilizing computational techniques in mode choice modeling, of which agent-based modeling (ABM) has received a lot of attention. ABM is a simulation of the interaction of a collection of entities (agents) with each other and their environment, with these micro-level interactions yielding a macro-level pattern ( 34 ). Agents are defined as unique and autonomous entities (e.g., human, equipment, or organisms) that interact locally with each other and make adaptive decisions affected by their status and the status of other agents and their environment ( 35 ). ABM has been utilized to study a broad spectrum of transportation-related phenomena, such as hurricane evacuation ( 36 ), traffic congestion simulation ( 37 ), car-sharing ( 38 , 39 ), and driver decision-making processes ( 40 ).
In addition, several studies have begun to explore the integration of mode choice modeling with ABM ( 5 , 41 – 45 ). Mode choice models are incorporated into the decision rules component of agent-based models, which provides flexibility to modelers in specifying the form and tuning the complexity of these rules.
Overall, it would appear that most of the previous studies have focused primarily on using supervised learning techniques to model agents’ behavioral rules and overlooked incorporating simple traditional statistical techniques (i.e., MNL), which have been well established in mode choice modeling, in agents’ behavioral rules. In fact, it can be argued that incorporating both agent-based modeling and traditional statistical techniques can address most limitations of the latter and, thus, maintain the simplicity and interpretability of mode choice models for transportation planners and engineers. Further, most of the agent-based mode choice models lack consideration of psychological factors, such as habit formation, information provision, and awareness. Accordingly, it is necessary to develop a model that appropriately characterizes human behavior and bounded rationality, accounts for changes in the built environment, and allows for interactions between various transportation users as well as people-to-built-environment interactions.
Proposed Methodology
The ABM presented in this paper simulates agents’ daily travel activities for morning commuting trips, with mode choices that include driving, transit, and non-motorized modes. The model (see Figure 1) has been constructed using the Recursive Porous Agent Simulation Toolkit (Repast) ( 46 ). Following a typical structure of the agent-based framework, the presented model consists of three major components: environment, agents, and knowledge learning and interaction rules.
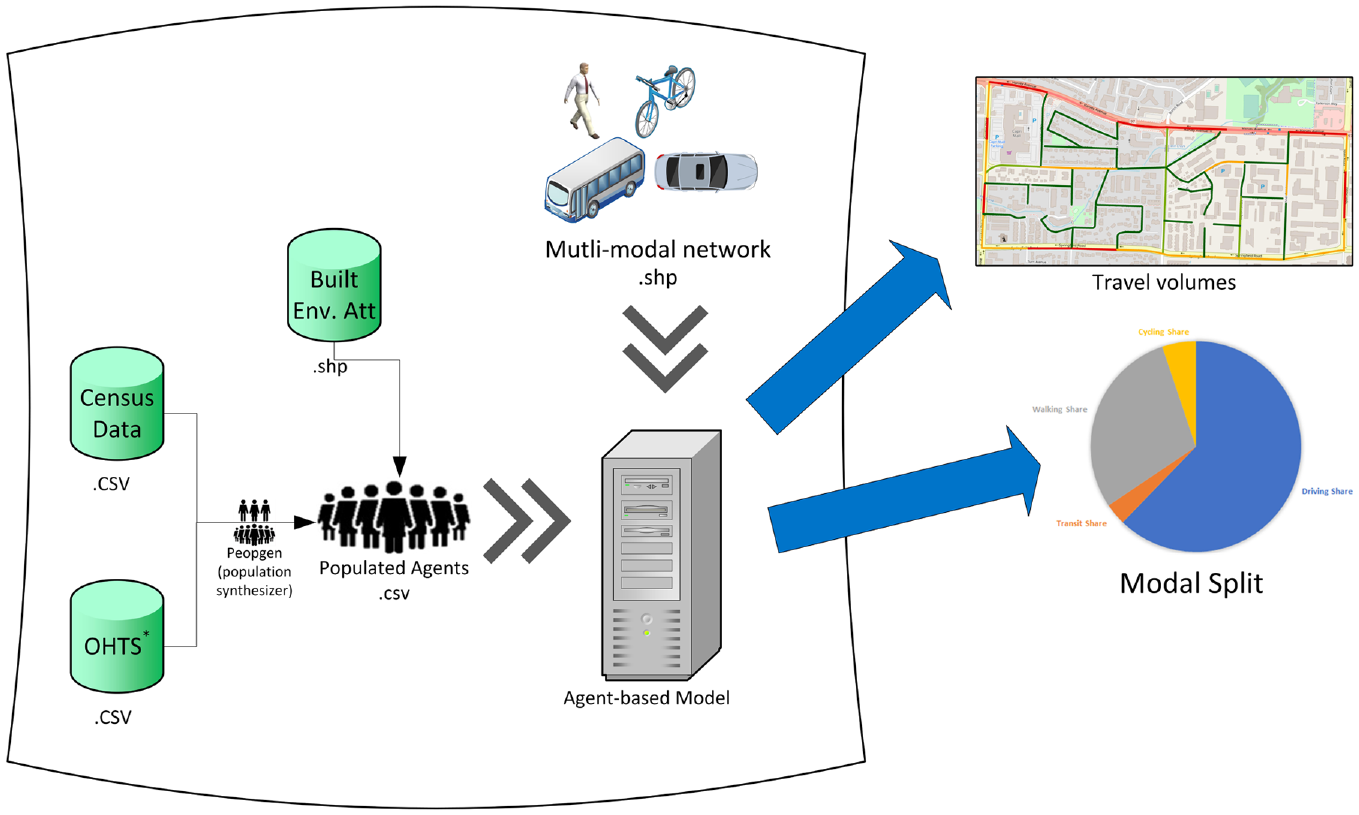
Agent-based modeling framework.
Environment
The environment represents the space where agents make activities and interact with each other. In the developed agent-based model, the environment is comprised of several geographic information system (GIS) datasets, including a transportation system (e.g., roads and sidewalks), activity locations (e.g., households and workplaces), and the built environment (e.g., parks). The transportation system was modeled as a multi-layer network where different transportation modes are represented by different layers. This makes it possible to simulate multi-modal trips where agents might need to use different transportation modes to reach their destinations.
Agents
Agents in this model represent autonomous and adaptive transportation system users that seek to optimize their utility by learning and adapting a new behavior based on experience. Each agent has its own characteristics (e.g., income, age, gender, occupation, and residential location) and a daily trip plan that includes trips origins, destinations, purposes, and cost. Agents are grouped into households where they share some characteristics, such as available number of vehicles.
The developed agent-based model simulates agents’ mode choice behavior using decision rules based on the RUM theory, as discussed in the following section. In addition, it utilizes Everett Rogers’ diffusion of innovations theory, which seeks to explain the process through which an idea, product, technology, or behavior—an innovation—spreads across a population via communication channels over time ( 47 ). According to Rogers, an innovation does not have to be new—it only has to be received as such by potential adopters. Moreover, a practice or behavior that potential adopters are aware of but have not yet formed an attitude toward is also considered an innovation. Consequently, the theory has been utilized in a broad range of applications, including technological innovations ( 48 , 49 ), social science ( 50 , 51 ), and public health ( 52 , 53 ). In transportation engineering, the theory has been utilized to study new mobility options ( 54 , 55 ), as well as conventional modes of transportation ( 56 , 57 ).
This research utilizes the diffusions of innovations theory to simulate how agents share their knowledge and propagate information about their preferred travel mode across family members and co-workers. According to the theory, people can be classified into five categories based on their level of social influence as follows: (1) innovators, (2) early adopters, (3) early majority, (4) late majority, and (5) laggards. Innovators are characterized by strong social influence and are very eager to seek information about new alternatives, while laggards lack social influence and are the last to adopt new alternatives. Similar to the work of Aziz et al. (
58
) and Doo (
59
), agents in the model are randomly assigned to one of the five categories, while keeping the number of agents in each category as per the following proportions 2.5%, 13.5%, 34%, 34%, and 16%, respectively, as proposed by Rogers (
47
). In addition, influence probabilities of 0.9, 0.45, 0.23, 0.1, and 0.05 are respectively assigned to each group to capture how agents in different categories vary in willingness to seek and propagate information (
59
). Finally, it is hypothesized that the choice probability of the predominant mode (
Knowledge Learning Process
To address the bounded rationality limitation of the RUM framework, this study utilized a conceptual framework presented by Idris et al. ( 60 ), which proposed an adaptive learning-based mode choice model that integrated the RUM theory with reinforcement learning concepts. The proposed model employed various reinforcement learning rules to model decision-making behavior considering the bounded rationality assumption.
Reinforcement learning is a computational approach to learning through interactions in which an agent aims to maximize its rewards by learning from experience, while having no prior information about the environment ( 61 ). At each stage, the agent observes the environment, takes an action, and then receives immediate evaluation of its action as negative or positive rewards. In addition to the agent and the environment, reinforcement learning consists of three main sub-elements: (1) policy, (2) reward signal, and (3) value function ( 61 ). Firstly, policy refers to the way an agent selects an action at a given state of the environment (i.e., mapping from states to actions). The second element is a reward signal, which implicitly defines the goal of the system. A reward signal is the negative or positive value that an agent receives after taking an action in a given state to indicate what is good or bad now (i.e., just for the current state). The third element is a value function that, in contrast to a reward signal, determines what is good or bad in the long-term based on an agent action in the current state; an agent’s objective is to optimize the value function (i.e., maximize cumulative rewards) ( 61 ). In other words, the value function could be looked at as the mechanism used by an agent to update its knowledge.
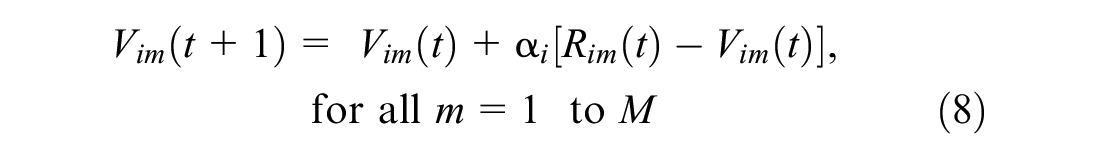
The agents’ decision-making policy in the proposed ABM is choosing the transportation mode that maximizes their rewards in the long run. Rewards were defined as an agent’s perceived utility for each of the available transportation modes. Agents in the model used adaptive behavior to form their beliefs about the available transportation modes through an iterative process. In each iteration, agents chose the transportation mode that had the greatest probability based on the RUM framework. During the iteration, agents acquired new information (e.g., traffic conditions) by interacting with other agents and the environment, which then were used to update agents’ perceived utility for the subsequent iteration based on the following reinforcement learning rule:

where
Equation 1 includes an adaptive step size parameter (α) to simulate habitual tendency and its influence on learning from previous experience. Idris et al. ( 60 ) hypothesized that the habitual tendency of a particular mode can be indicated by the choice probability of that mode, such that the greater the choice probability, the greater the habitual tendency. Since habitual tendency acts against learning from previous experience, Idris et al. ( 60 ) formulated the step size parameter to be inversely proportional to the previous dominating mode choice probability, as shown in Equation 2. This formulation implied that the greater the habitual tendency toward a certain mode, the lower the step size parameter, and thus the less agents learn from previous experience:

where
In addition, a soft-max selection policy based on the Boltzmann distribution was used to ensure an appropriate trade-off between exploitation and exploration, as shown in Equation 3:

where
In this research, agents choose whether to exploit or explore an action based on three components: (1) dominating mode choice probability; (2) agents’ utility value for each available mode; and (3) the weighted average effects of social influence. Firstly, a greater choice probability indicates a greater habitual tendency, which hinders an agent’s willingness to explore new alternatives. Thus, the temperature parameter is assumed to be inversely proportional to the choice probability of the recent dominating mode (

where
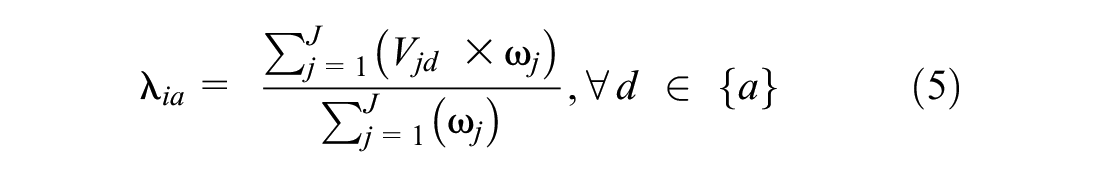
Idris et al. ( 60 ) proposed three categories to classify people based on their information acquisition and response behavior. The first category conceptualized the state of partial information provision, in which agents do not have global information (i.e., imperfect knowledge) and thus can only adapt new behavior based on their own experience. In other words, at the end of each iteration, agents only updated the utility of the selected mode while the utility of unselected modes remained unchanged, as shown in Equation 6:
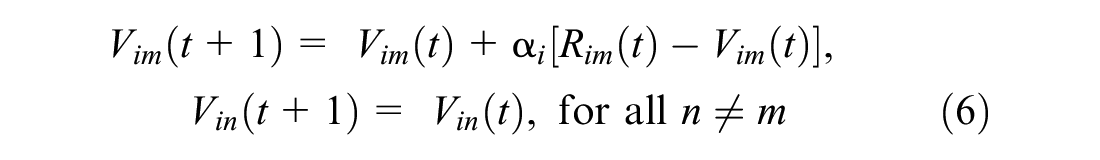
where
The model expressed in Equation 6 utilized a temporal-difference learning method to simulate an agent’s behavior, such as an agent updating its long-term utilities
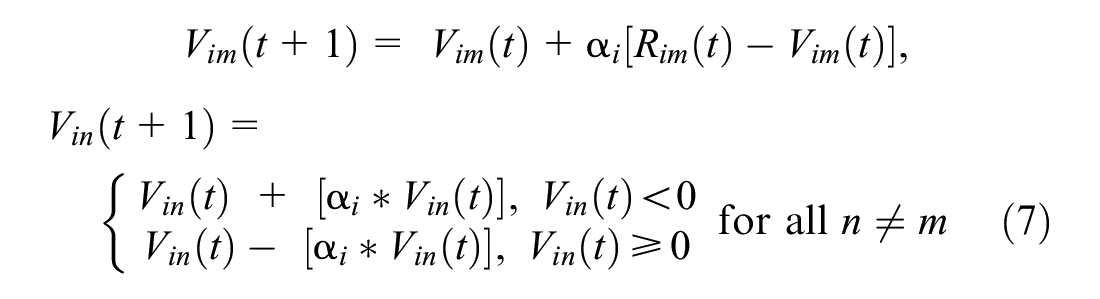
The second category also conceptualized the state of partial information provision; however, the updating rules were revised to incorporate how agents become unfamiliar with unselected modes. Thus, an agent’s mental and cognitive efforts to explore unselected modes declines over time, as shown in Equation 7:
On the other hand, the evolution of new advanced traveler information systems (ATISs) gives transportation users access to real-time information about different modes simultaneously. Thus, people are now capable of gaining knowledge and updating their preferences for each available travel mode before each trip (i.e., including unselected modes). Under this assumption, the updating rules could be re-written as follows:
In this research, agents were randomly assigned to one of the three information provision categories as per the proportions 60%, 10%, and 30%, respectively. The proportion value of each category is exogenous and is based on previous research that shows information provision has a relatively small impact on travel behavior, with an estimated impact that varies between 30% and 40% ( 62 – 65 ). In addition, two more cases were defined reflecting medium and high levels of information provision as follows: medium level (50%, 5%, and 45%, respectively) and high level (25%, 5%, and 70%, respectively).
Simulation Setup
In period 0, the initialization process, the model read the shapefiles that contain information about the transportation system, as well as the synthesized agents’ information and locations. The next step was to compute the base utility and the corresponding probability of choosing available modes for each agent. In the first iteration, agents choose the travel mode with the highest probability and travel on the map according to the calculated shortest path. During each iteration, agents acquired new information (e.g., traffic conditions, volume of pedestrians and automobiles encountered) by interacting with other agents and the environment, which then were used to update agents’ perceived utility for the subsequent iteration, as presented in Equation 6, 7, or 8, depending on the agents’ information provision category. In the following iterations, agents chose whether to explore or exploit, based on using a generated random number; if the number was less than the exploration rate, then agents chose to explore new alternatives using the soft-max selection process described in the previous section. On the other hand, if the generated random number was greater than the exploration rate, agents exploited the action with the highest Q-value, as shown in Figure 2.
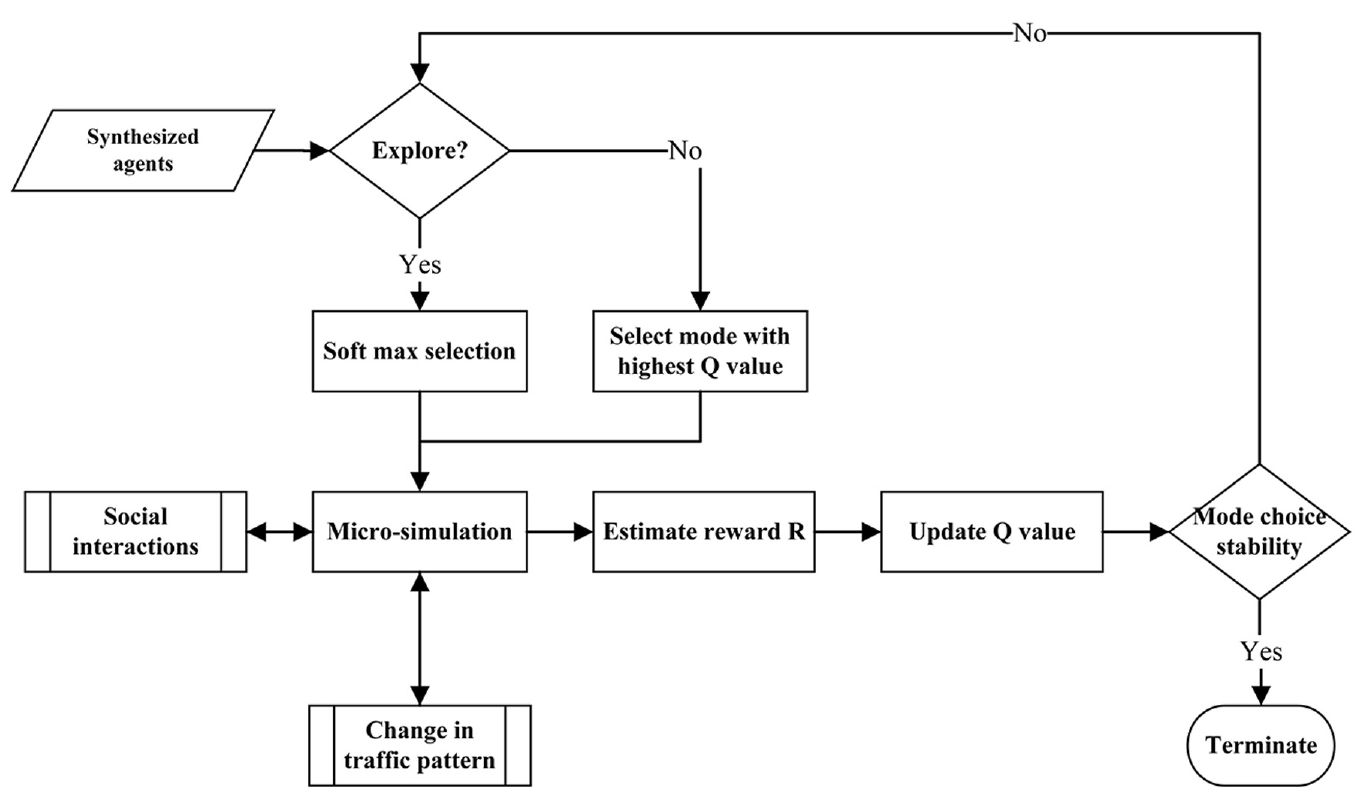
Proposed methodology.
Case Study
Study Area
The Capri-Landmark neighborhood is one of the five official urban centers in Kelowna, as shown in Figure 3. The neighborhood area is approximately 94 hectares with a total population of approximately 2400 residents and 5200 jobs. Of the five official urban centers, Capri-Landmark has been identified as top priority for a new comprehensive urban center plan because of its lack of previous comprehensive planning, increasing development pressure, and several built-environment challenges, including limited green spaces and a disconnected AT infrastructure ( 66 ). This could imply that active travel behavior in the neighborhood is less influenced by personal factors (e.g., psychosocial, self-efficacy), which could increase the effectiveness of built-environment improvements on travel behavior ( 67 ).
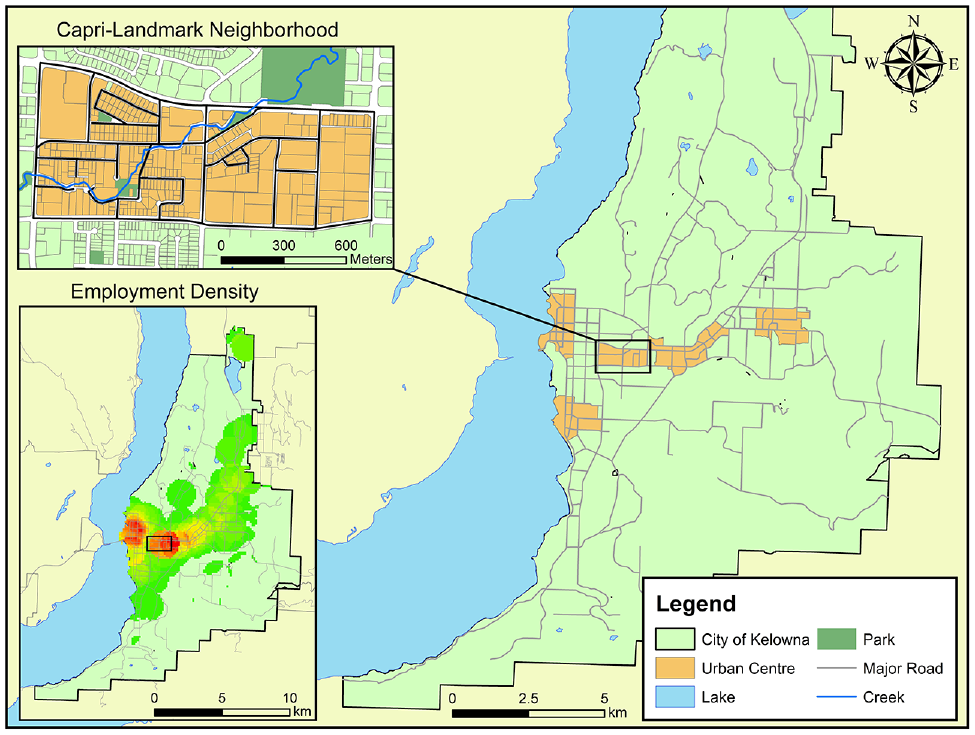
Study area.
The neighborhood was then hypothetically retrofitted, similar to Masoud et al. ( 68 ), using SMARTer Growth (SG) design principles ( 69 ). This hypothetical neighborhood retrofit included a series of local road closures to prevent shortcutting. The closed roads were transformed into green spaces and AT corridors to increase restorative and socialization opportunities, and to maintain high connectivity for pedestrian and cyclists, as shown in Figure 4.
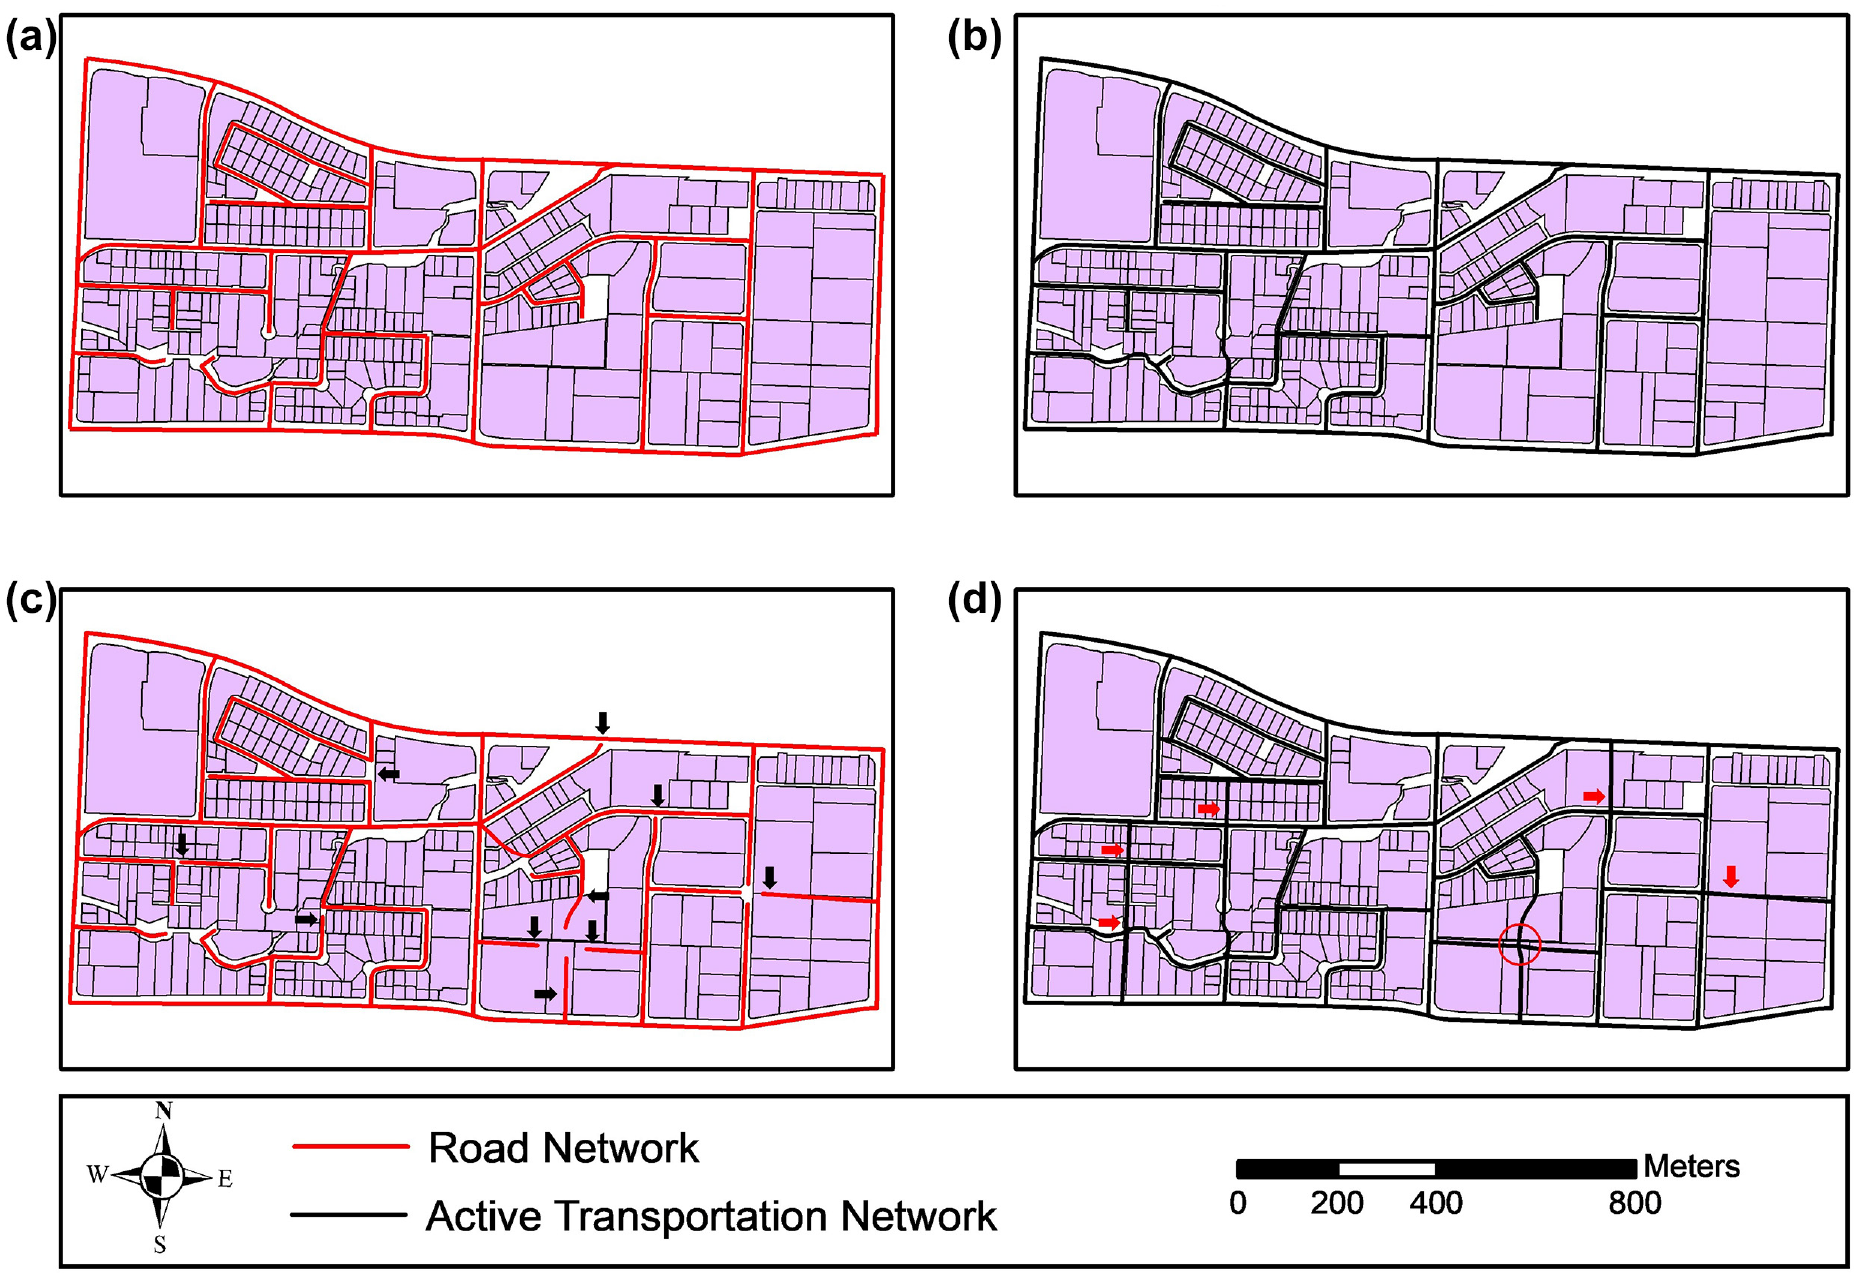
Road network design alternative: (a) existing road network; (b) existing active transportation network; (c) proposed road network; (d) proposed active transportation network.
Dataset
Three types of data were used for the development of the model: travel diaries, transportation networks, and land use data. The travel diaries were obtained from the Okanagan Household Travel (OTS) survey. The last survey was conducted during the weekday in the fall of 2013 with a response rate of 3.3%, a total response of 3050 households, and 22,500 trip records. The OTS data includes both socio-economic and demographic characteristics as well as information on mode choice. In addition, travel time and distance for all reported trips were generated for car, transit, walk, and cycle using the Google Directions application programming interface (API), given respondents’ residential and work postal codes ( 13 ). The data was filtered to only include work trips during the morning peak (6 a.m.–9 p.m.) for which both trips ends are in Kelowna (1342 trips). Table 1 shows descriptive statistics of the trip information.
Modal Share and Trip Information
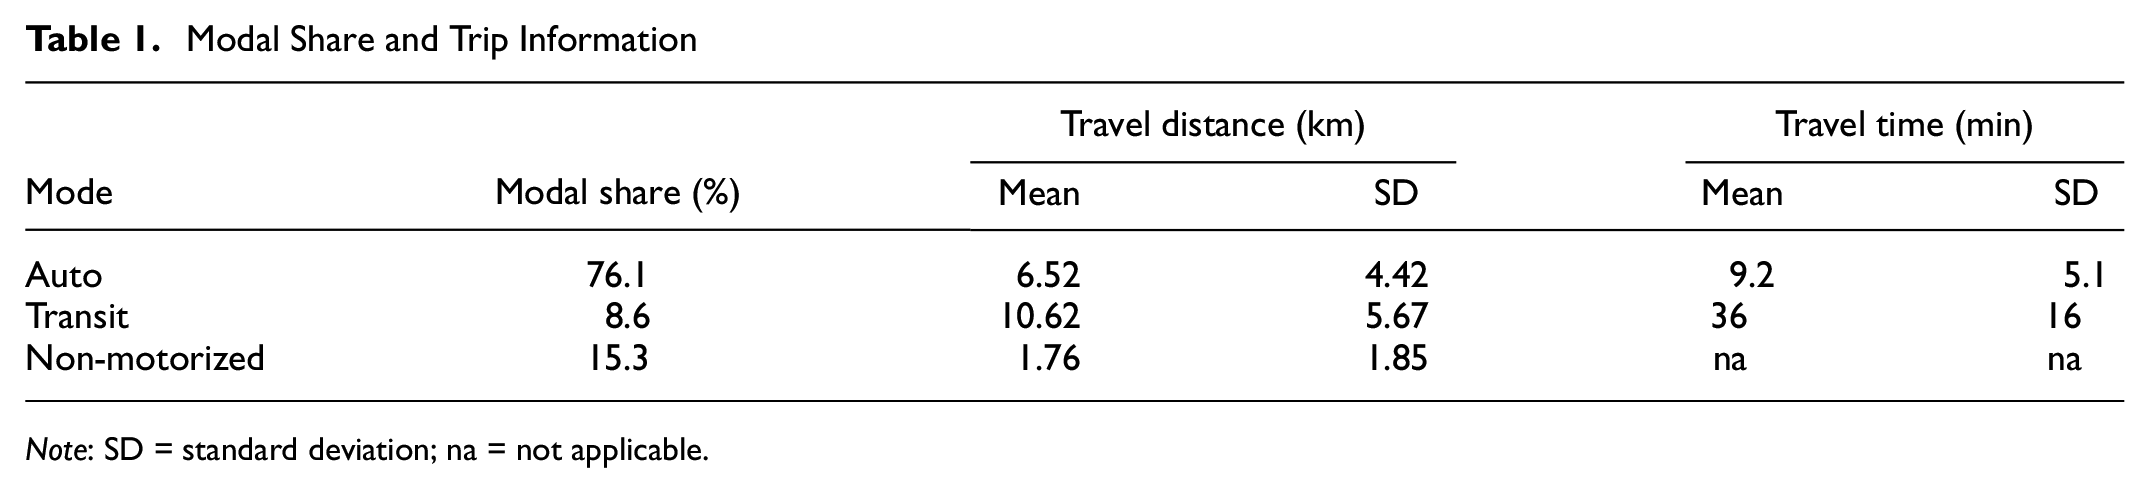
Note: SD = standard deviation; na = not applicable.
Transportation network GIS data was obtained from the City of Kelowna’s open data portal. The data includes road centerlines, road intersections, sidewalks, bike lanes, cycle tracks, multi-use paths, and walkways. In addition, transit routes and stop locations were created using the General Transit Feed Specification (GTFS) dataset for Kelowna.
Finally, land use data were obtained from the city of Kelowna and were compiled using various sources. Employment data were quantified at the traffic analysis zone (TAZ) level by combining information from the census, BC Assessment, Canada Business Points, enrollment counts from the Central Okanagan School District, and other sources.
Mode Choice Model
A MNL model for morning home-to-work mode choice decisions was developed for the city of Kelowna. The model accounts for socio-economic characteristics, level-of-service attributes, and built-environment measures. Numerous built-environment measures were quantified at various buffer distances (100, 200, up to 1000 m) for all trip origins and destinations, including population density, employment density, land use diversity, proximity to bus stops, and length of each AT infrastructure type; a summary of the variable descriptions is presented in Table 2.
Land Use Independent Variable
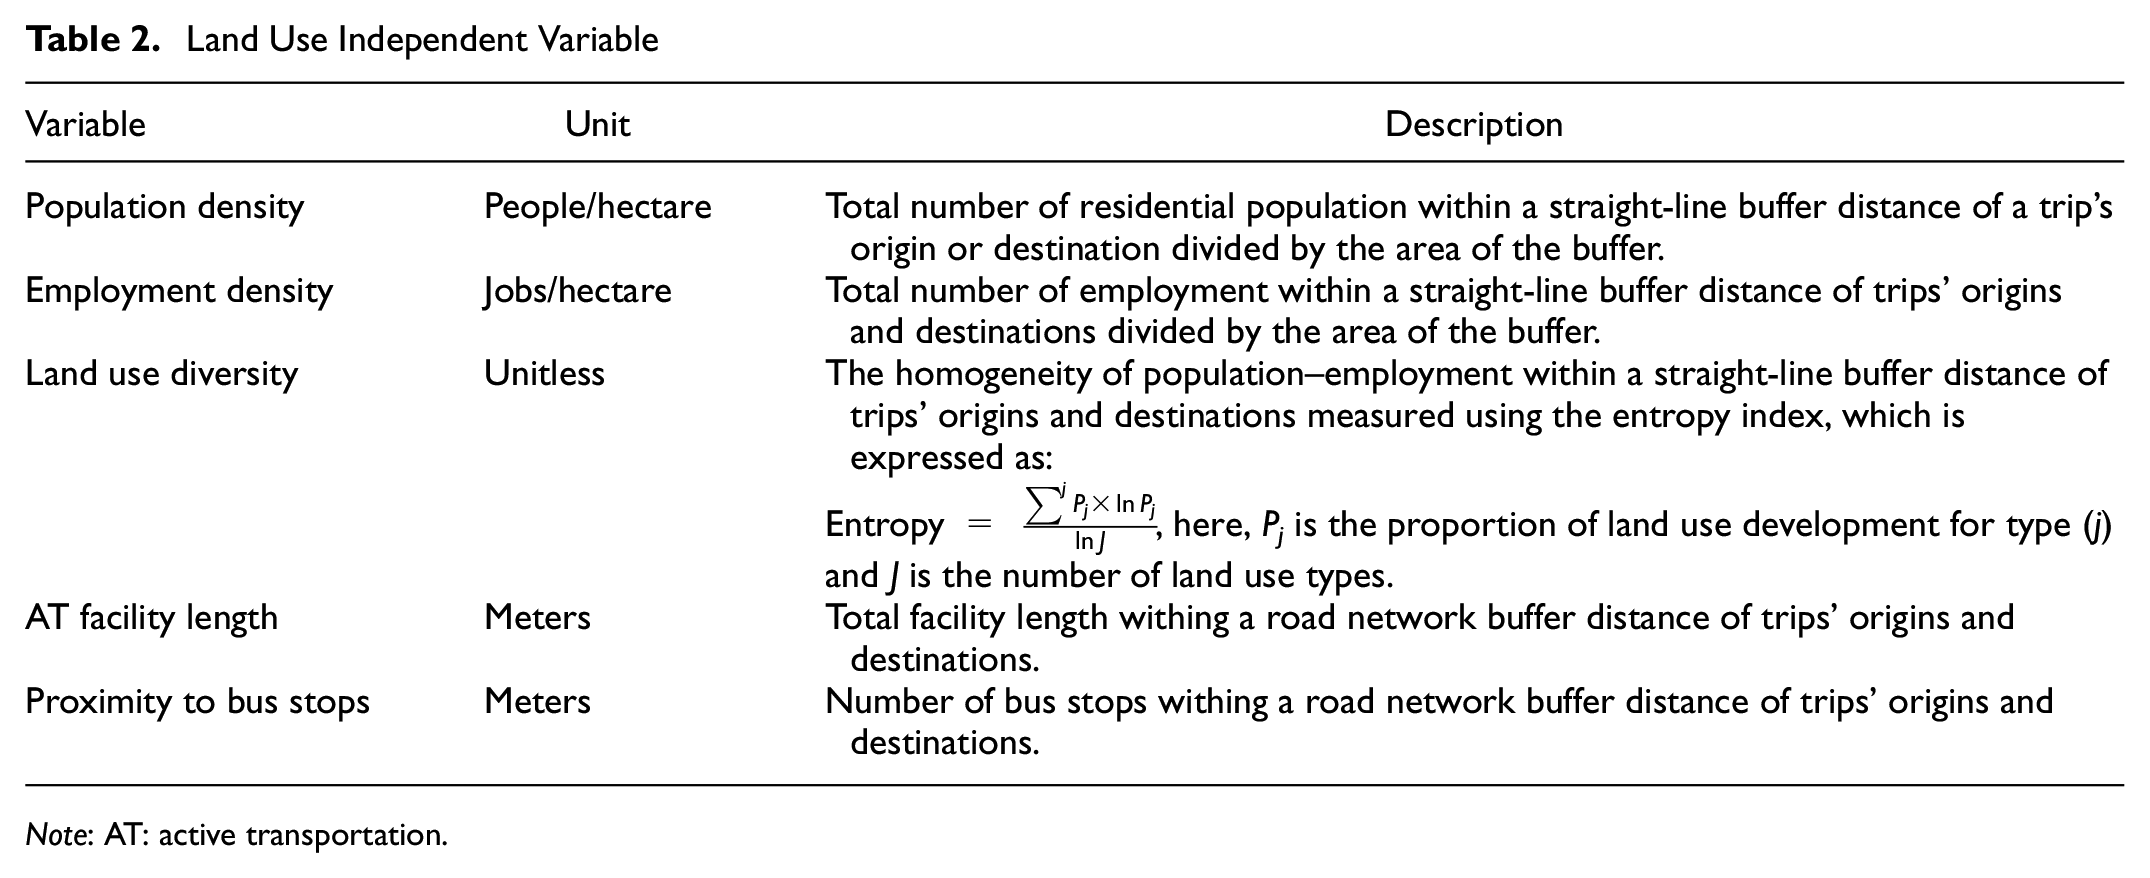
Note: AT: active transportation.
Three utility functions were estimated for each mode as follows: (1) automobile, (2) transit, and (3) non-motorized. The stepwise method was used for variable selection and model parameters were estimated using Biogeme ( 70 ), with the model specification shown in Table 3. The developed MNL models showed that those in the age range from 15 to 24 years are less likely to use the auto mode, which could be explained by youth having access to discounted monthly public transit passes (including a mandatory U-PASS program, which provides all University of British Columbia Okanagan students with affordable transit pass) and having limited regular access to a vehicle. The number of vehicles and bikes per person in the household were positively associated with auto use and bike use, respectively. In addition, the models showed that travel distance and time were negatively associated will all travel modes, as one would expect. Moreover, the results indicated that higher population density near trip origins increased the likelihood of using transit, while higher employment density near trip destinations decreased the likelihood of using the auto mode. In addition, land use diversity, measured by entropy, was found to be positively associated with using transit.
Mode Choice Model Parameters
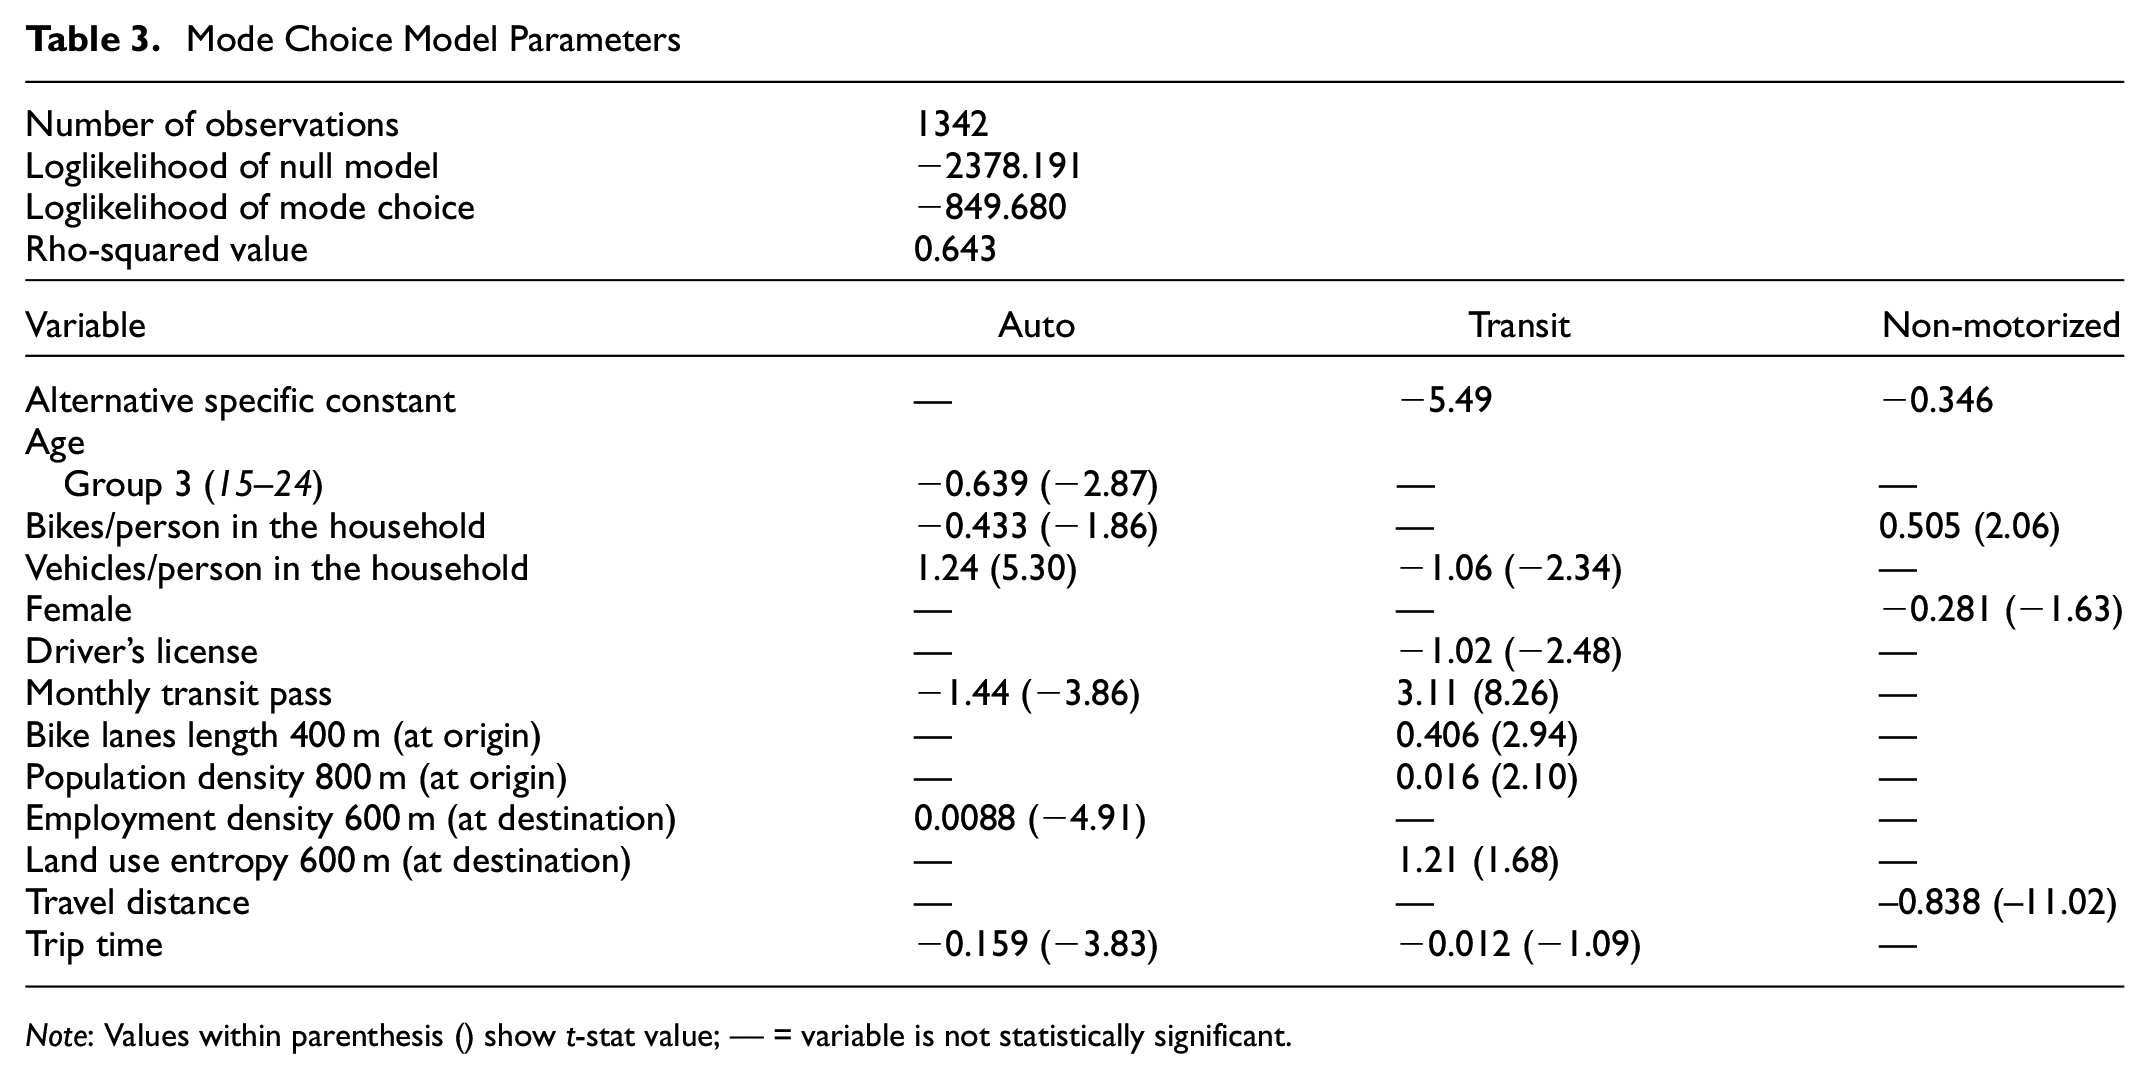
Note: Values within parenthesis () show t-stat value; — = variable is not statistically significant.
Results and Discussion
Our model was populated using data from Census Canada and the City of Kelowna (e.g., road network, population and employment densities, etc.) and different scenarios were analyzed to examine the influence of neighborhood design (built environment) on morning home-to-work mode choice behavior. In particular, this case study examined the influence of several policy scenarios on neighborhood travel patterns, including increased activity density and/or non-motorized to vehicle route directness ratio, and transportation demand management (TDM) strategies.
Firstly, three scenarios were tested to examine the influence of transportation network connectivity on travel behavior: retrofitting the road network only; retrofitting the non-motorized network only; and retrofitting both the road and non-motorized networks. The road network retrofit includes a series of local road closures to prevent shortcutting through local roads. For the non-motorized network, a continuous grid network of off-road paths, local parks, and local roads is provided to achieve high walk/bike connectivity. To comprehend the magnitude of change in both networks, the percentage changes in travel time and distance between the existing scenario and the proposed retrofit were estimated as follows: 19.3% increase in driving travel time and 9.2% decrease in non-motorized travel distance.
The second set of scenarios examined the influence of increasing population and employment densities on travel behavior. The three cases considered in this scenario correspond to 10%, 20%, and 30% increase in activity density (i.e., population and employment densities combined). The third scenario examined the combined effect of retrofitting the transportation network and a 30% increase in activity density on travel behavior.
The last set of scenarios explored the effect of transportation and land use changes (third scenario) coupled with TDM strategies. Contrary to traditional mode choice modeling techniques, this research assumes that people vary with regards to levels of information provision. One could argue that the most optimistic modal shift toward AT modes (transit and non-motorized) is achieved under the assumption that 100% of the agents have perfect information. While this assumption might not be practical, TDM strategies, such as improving ATIS and media awareness campaigns, can be used to increase information provision and awareness of the current state as well as any changes in transportation and land use systems. Three cases of increasing information provision are compared: practical-, medium-, and high-level scenarios. In addition, another scenario was designed to explore the effect of providing 25% and 50% of the population in the study area with a temporary free transit pass to gain familiarity with the transit service in the city. This scenario was coded in our framework by assuming that the transit pass dummy variable is 1 when calculating the soft-max selection policy. This assumption results in increasing the probability of exploring the transit mode for agents that are enrolled in the free transit pass program.
The first three sets of scenarios (transportation, land use, and combined) were run four times in this case study. They were run once for each of the three information provision categories (i.e., all agents are assigned to a category). For the fourth run, agents were randomly assigned to information provision and social interaction categories. On the other hand, the TDM strategy scenarios were run assuming the latter only. On the other hand, the TDM strategy scenarios were run assuming the latter only. Because of computational constraints, it was not possible to examine all of these scenarios using the entire city dataset. In addition, there were few actual internal trips reported in the City’s provided dataset (i.e., where both trip ends were located in the study area). Therefore, all the previous scenarios were analyzed using 5000 randomly generated trips within the study area. The trips were created by randomly generating origins and destinations within the study area and then randomly sampling trips from the OTS according to probability distribution extracted from the dataset. While the simulation results from such an exercise will not reflect the expected modal shift in the study area, they can provide valuable insights into the relative impact of each examined policy. To further address this limitation, additional simulations were run for three expected scenarios in the study area using the entire city dataset (i.e., both internal and external trips): (1) 2016 transportation and land use systems; (2) 2040 projected transportation and land use systems based on the city of Kelowna’s endorsed official community plan (OCP) ( 71 ); and (3) 2040 projected transportation and land use systems based on the SG design principles, given the city’s projected urban growth. However, these simulations were only run for the random information provision assignment case. Finally, it is worth noting that preliminary modeling experimentation showed that the perfect information category reflects traditional mode choice modeling. Thus, its modal share results can be used to compare traditional mode choice modeling with those of the proposed framework.
Figure 5 illustrates the percentage change in modal split for the proposed transportation and land use retrofits compared to the existing conditions. The figure shows that all proposed information provision scenarios produce almost similar modal shift trends, except for the partial information with knowledge decay category. For this category, the results show a significant increase in the auto modal share despite the proposed hypothetical changes in the transportation and land use systems that were in favor of transit and non-motorized modes. Another unanticipated finding is the slight increase in auto modal share when retrofitting the road only in the random information provision assignment scenario, as shown in Figure 5d. A possible explanation would be that the reduction in auto utility because of retrofitting the road network was relatively small compared to the decline of unselected mode utilities over time for agents with knowledge decay. This hypothesis can be validated by looking at the results of the perfect information run (see Figure 5c), which shows that the auto modal share decreases as expected. These results are consistent with the notion reported in previous studies that some people may not be encouraged to shift their choices in response to small or negligible changes in their travel utilities ( 72 – 74 ).
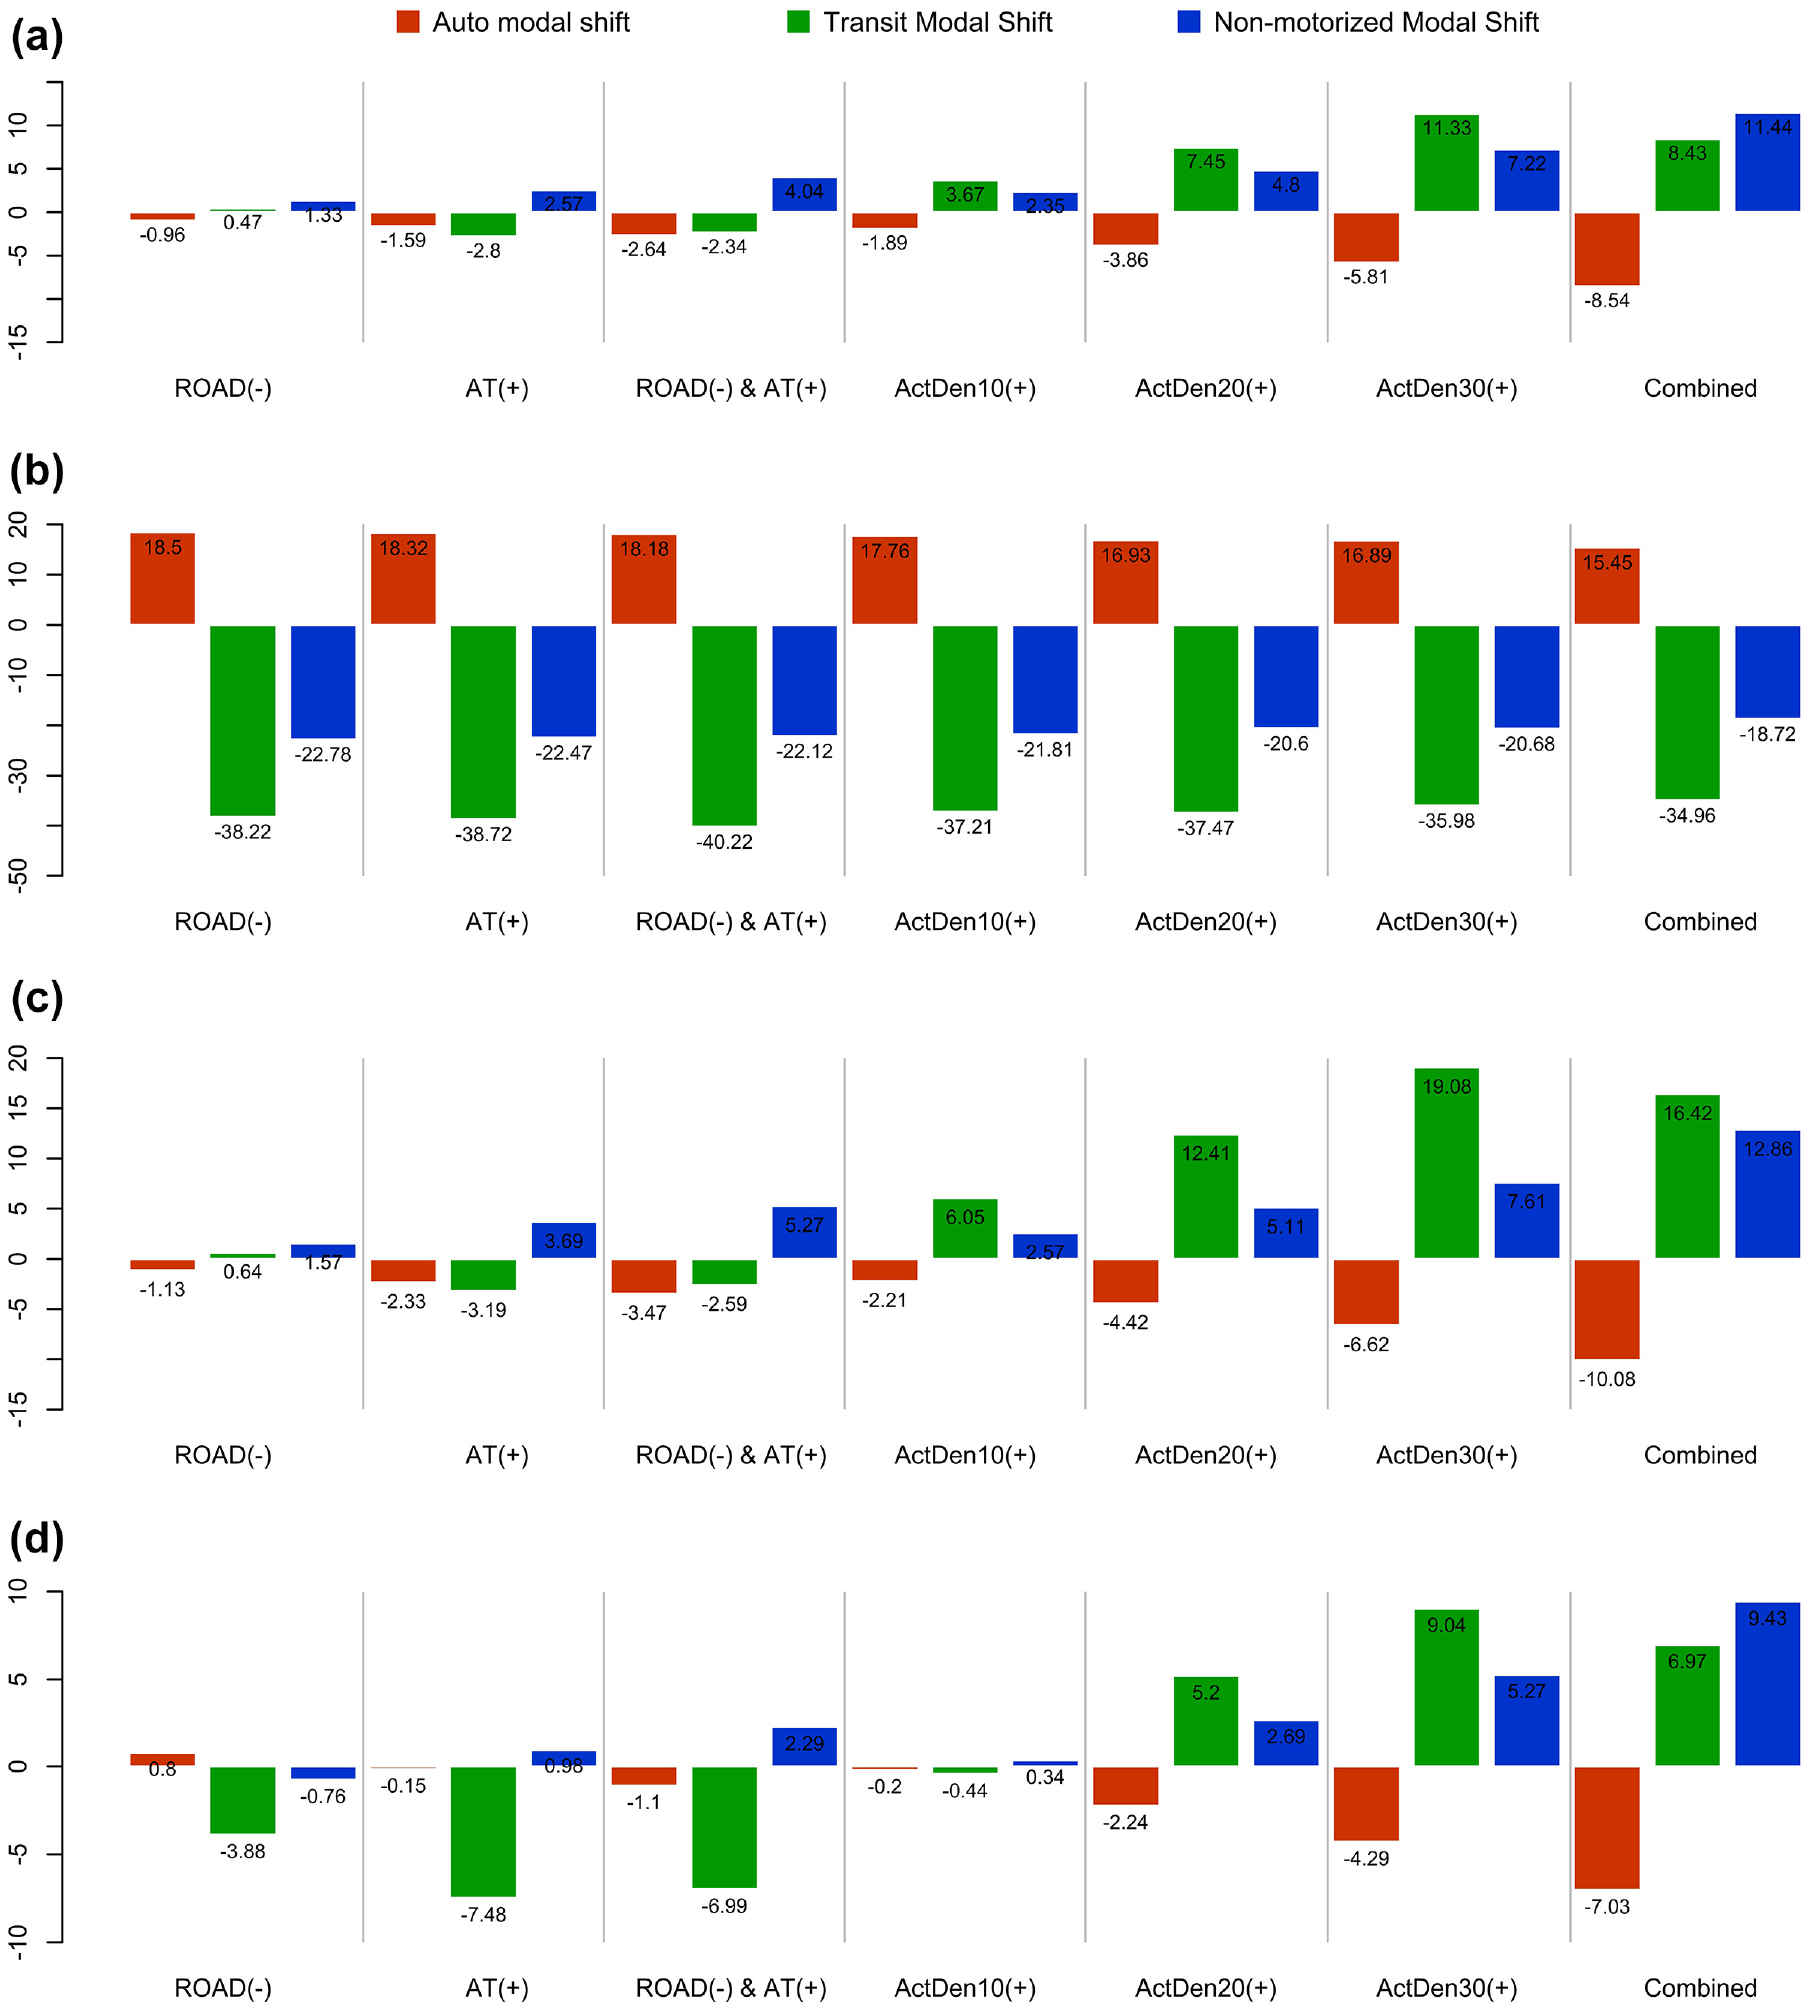
Modal shift for the transportation and land use scenarios: (a) partial information; (b) partial information with knowledge decay; (c) perfect information; (d) randomly assigned information provision and social interactions categories.
Another interesting finding is that the modal shift in the non-motorized scenario was greater than that in the road network scenario despite the change in travel time in the former scenario being less than in the latter scenario. Nevertheless, the multi-modal, multi-prong retrofit strategies had the greatest beneficial influence on mode choice. These trends were observed in both the perfect information scenario (Figure 5c) and the random information provision assignment scenario (Figure 5d). The former suggests that increased accessibility for non-motorized users has more impact on modal share than restricting car use, which is in line with those of previous studies. For instance, a study of university commuters in College Park, Maryland, found that commuters are more sensitive to change in travel time for non-motorized modes ( 75 ). In addition, previous studies found that reductions in travel time for non-motorized modes were valued higher than for the auto mode ( 76 , 77 ).
Moving to increasing the activity density scenarios, 10%, 20%, and 30% increase in activity density resulted in −0.44%, 5.2%, and 9.04% modal shifts toward transit, and they reduced auto modal share by 0.2%, 2.24%, and 4.29%, respectively. Finally, the combined transportation and land use scenario achieved the highest modal shift from auto toward transit and non-motorized modes. Note that the shift toward transit in this scenario is slightly less than the scenario of increasing activity density by 30%, which illustrates how transit competes with non-motorized modes. This finding should be interpreted with caution, as the case study simulated 5000 randomly generated trips within the neighborhood (i.e., short trips); public transit is known to compete with non-motorized for short trips ( 78 ).
In addition, it is recognized that travel behavior involves a habitual element that might lead to a delay in capturing modal shift because of changes in the built environment ( 79 , 80 ). The proposed framework adds a time dimension to the modal shift process. This dimension might not represent the actual time that it takes individuals to reform their beliefs about transportation modes. However, it could give a hint about the relative duration it would take to reap the full benefits of two proposed policies. This duration was calculated as the time steps it would take the simulation to terminate, which is when the average modal shift of all modes is less than 0.0001%. For this case study, our analysis shows that while land use policies are superior over retrofitting the transportation network, the former requires twice as much time as the latter to reap the full benefits of land use policies.
Using TDM policies to augment transportation and land use changes reinforces their effectiveness. For instance, running the simulation assuming the medium-level information provision scenario resulted in 10.13% and 10.6% increase in transit and non-motorized modal shares, respectively (Figure 6a). Similarly, the high-level information provision scenario resulted in 11.7% and 11.6% increase in transit and non-motorized modal share, respectively (Figure 6a). In addition, providing temporary transit passes for 25% and 50% of the population resulted in 8.12% and 8.79% increase in transit modal share, respectively, as shown in Figure 6b. This scenario was particularly useful for agents with knowledge decay, as it increased their chances of exploring the transit mode and thus maintaining familiarity with the service. In accordance with this finding, Lyons ( 81 ) notes that familiarity significantly influences mode choice behavior, which is also supported by several recent studies ( 82 , 83 ).
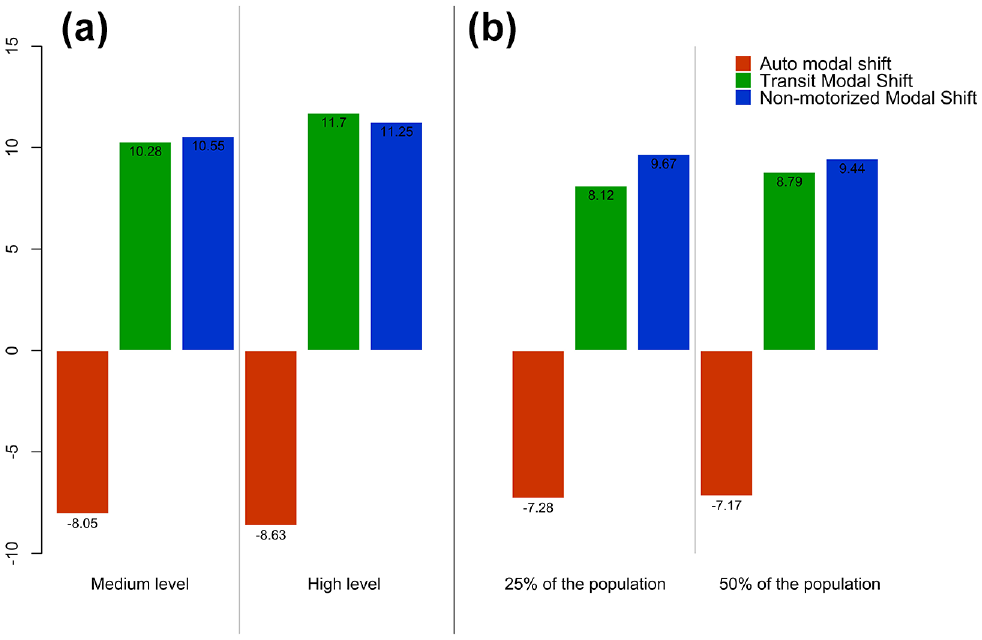
Modal shift for transportation demand management strategy scenarios: (a) information provision levels; (b) free temporary transit pass.
The modal shift forecasting results for the 2016 and 2040 OCP and 2040 SG scenarios show that the Capri-Landmark exhibited a high modal shift toward non-motorized modes in both the 2040 OCP and SG scenarios (see Table 4). In particular, the 2040 OCP scenario resulted in a 12% decrease in auto use, 70% increase in walking, and 17% increase in cycling. A similar but more pronounced modal shift was forecasted for the 2040 SG scenario with a 22% decrease in auto use, 92% increase in walking, and 74% increase in cycling. This finding supports the notion of a system-based approach to sustainable development that integrates both the transportation and land use systems.
Modal Shift in the Capri-Landmark Urban Center Using the Entire Dataset
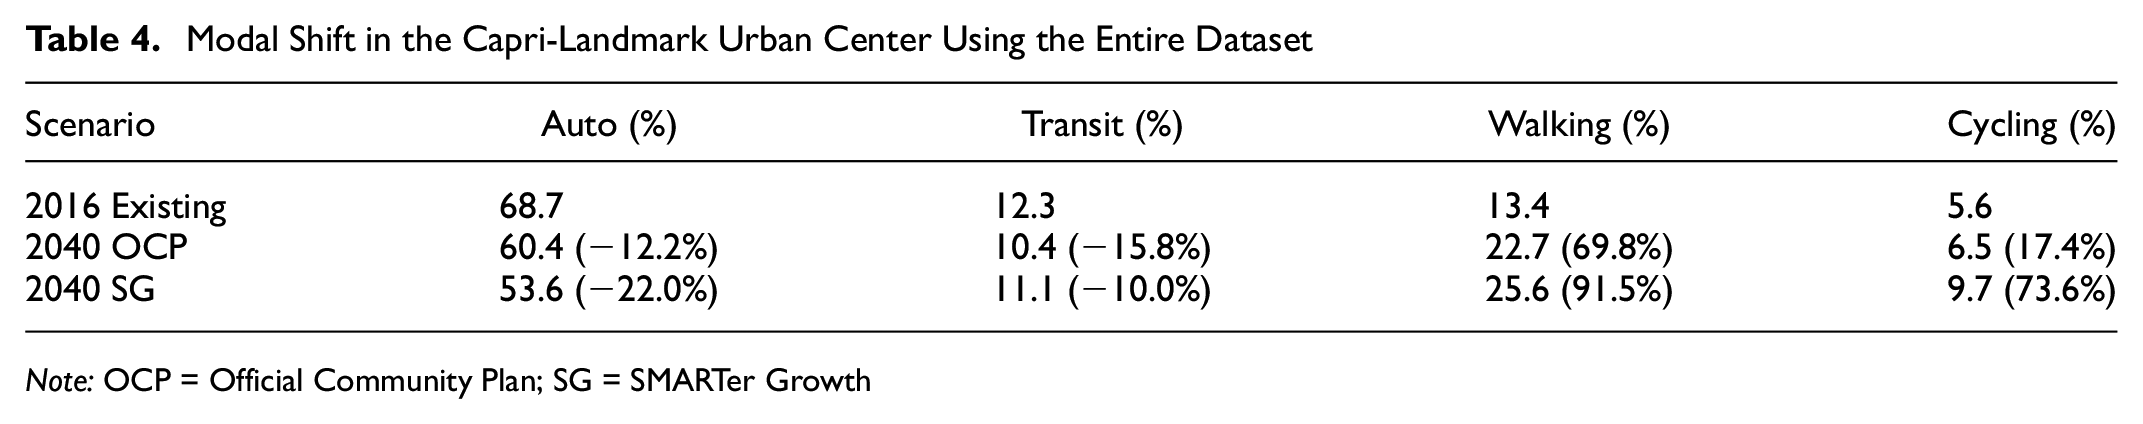
Note: OCP = Official Community Plan; SG = SMARTer Growth
Finally, sensitivity analyses were conducted on the social influence component of the model to analyze the effect of the random assignment of agents to different social influence groups and to better understand the influence of social influence on the simulation results. For the first sensitivity analysis, the simulation was run 10 times using different random seeds such that agents are assigned to different social influence groups in each run. The results of this exercise, as depicted in Figure 7, indicate a very minor change of 0.2% in the resultant modal split because of the agents’ random assignment process, which provides more confidence in the stability of the modeling results.
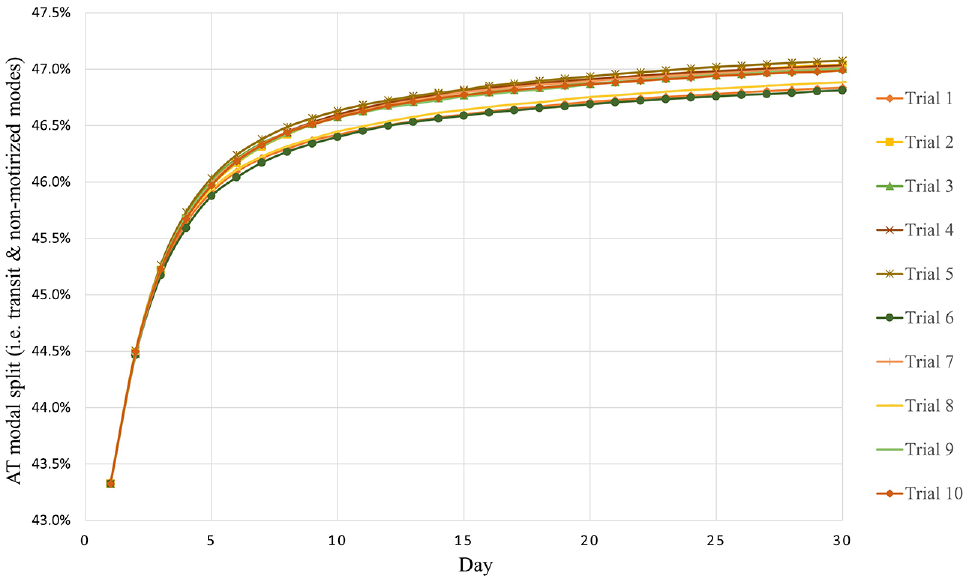
Active transportation (AT) modal split for the sensitivity analysis of agents’ random assignment.
For the second sensitivity analysis, two scenarios were examined using the same random seed but once assuming that all agents are assigned to the innovator social influence group and the other assuming that all agents are assigned to the laggards group. These scenarios were selected as they represent two extreme social influence proportions to emphasize the behavioral change. While the results showed the same modal split for both scenarios, the innovator scenario converged 10.5% faster than the laggard scenario. Perhaps this is because of the strong social influence of innovators and their eagerness to seek information about new alternatives compared to laggards.
Research Conclusions and Policy Implications
This research developed an agent-based modeling framework to provide a comprehensive evaluation of the influence of neighborhood design, at a fine spatial resolution (i.e., parcel level), on travel behavior. To account for habitual inertia and awareness limitations, the developed model integrates the traditional RUM-based modeling technique with reinforcement learning concepts to account for the bounded rationality of human beings and knowledge learning process. Moreover, the developed agent-based model utilizes the diffusion of innovations theory to account for the impact of social interactions by simulating how agents share their knowledge and propagate information about their preferred travel mode across family members and co-workers. In addition, the model accounts for the iterative feedback process between agents’ actions and the environment. It also adds a time dimension to the modal shift process that could be used to indicate the relative duration it would take to reap the full benefits of various proposed scenarios.
We then demonstrated our proposed ABM methodology via an application to assess the change in travel behavior because of retrofitting the Capri-Landmark neighborhood in Kelowna, BC, Canada, using SG neighborhood planning and design principles. Several scenarios were tested using one or a combination of effects to retrofit the road network, the non-motorized network, the activity density, and TDM policies.
Several policy implications can be derived from the findings of this study. Firstly, the results showed that retrofitting the non-motorized network scenario resulted in a higher modal shift toward non-motorized modes compared to retrofitting the road network only scenario. This implies that that infrastructure investments related to providing more accessibility for non-motorized users might have more impact on decreasing auto use compared to restricting vehicular network connectivity. Secondly, the overall modal share results for various scenarios indicate that land use policies have a more significant impact on modal shift toward AT modes compared to retrofitting the transportation network. This finding highlights the importance of the integration of transportation and land use planning in reducing auto-dependency. Thirdly, the results revealed an increase in auto modal share when retrofitting the road network only, which is contrary to expectations. In addition, agents with knowledge decay displayed a significant increase in driving probability in all the proposed scenarios. These results suggest that altering the behavior of individuals with rooted driving culture requires significant changes to the transportation and land use systems to be successful. Finally, the results of the TDM policy scenarios demonstrated the significance of familiarity and awareness on AT modal share. Municipalities and transit agencies can benefit from implementing programs (e.g., temporary free transit service, bike to work week, and transit marketing campaigns) that aim to entice the public to try AT modes and thus gain familiarity with the offered service.
A major limitation of this study is that the current implementation of the agent-based simulation assigns agents randomly to a social influence group. Future research would benefit from developing a systematic procedure to dynamically assign agents to a social influence group and derive their influence probabilities based on empirical data. Addressing this limitation would provide insights on the link between transportation users’ socio-economic characteristics and how they share their knowledge, propagate information, and learn from their experience. It is also worth exploring whether agents are expected to change their information provision/social interaction groups over time during a simulation run.
Footnotes
Author Contributions
The authors confirm contribution to the paper as follows: study conception and design: A. Masoud, A. Idris, G. Lovegrove; data collection: A. Masoud, A. Idris; analysis and interpretation of results: A. Masoud, A. Idris; draft manuscript preparation: A. Masoud, A. Idris, G. Lovegrove. All authors reviewed the results and approved the final version of the manuscript.
Declaration of Conflicting Interests
The authors declared no potential conflicts of interest with respect to the research, authorship, and/or publication of this article.
Funding
The authors received no financial support for the research, authorship, and/or publication of this article.