
Abstract
Heavy-duty diesel trucks (HDDTs), the majority of which are used for freight movement, are major contributors of nitrogen oxides (NO x ) and fine particulate matter (PM2.5) emissions. As a result, communities close to freight hubs such as ports, railyards, and distribution centers are disproportionately affected by diesel-related air pollution. This study evaluates the potential for emission-based access restriction and pricing strategy to reduce HDDT emissions in one such community in Southern California, U.S. Using a regional travel demand model with a dedicated heavy-duty truck submodel, it is assumed that a $10 emission fee is collected from HDDTs that do not meet the 2007 emission standards (i.e., model years 2009 and older) when they enter the community, which is considered to be a low emission zone (LEZ). The modeling results show that the emission fee diverts 60% of the pass-through trips made by HDDTs that do not meet the required emission standards away from the LEZ. The emission fee is found to reduce NO x , PM2.5, and carbon dioxide (CO2) emissions from HDDTs inside the LEZ by 37%, 38%, and 25%, respectively. Also, it is found that the emission fee has minimal impacts on the total emissions in the modeling area. The total NO x and CO2 emissions remain unchanged, while the total PM2.5 emission increases by 1%. These results demonstrate that emission-based access restriction and pricing can be an effective strategy for reducing truck emissions in communities heavily affected by truck traffic without resulting in adverse impacts on the regional emission inventory.
Keywords
Heavy-duty diesel trucks (HDDTs), the majority of which are used for freight movement, are major contributors of nitrogen oxides (NO x ) and fine particulate matter (PM2.5) emissions. As a result, areas close to freight hubs such as ports, railyards, and distribution centers often experience elevated levels of diesel-related air pollution. In recent years, there has been increasing awareness of environmental justice issues across the U.S., which has led to many policy actions. For example, the State of California has mandated the designation of disadvantaged communities (DACs), those that are socioeconomically disadvantaged and disproportionately affected by pollution burdens ( 1 ). These communities are now specifically targeted for investments aimed at improving public health, quality of life, and economic opportunity of their residents ( 2 ). In addition, the California Air Resources Board (CARB) has established the Community Air Protection Program that is focused on reducing human exposure to air pollution in communities most affected by it ( 3 ). Many of the communities selected for program implementation cite freight-related sources, such as diesel trucks, as one of the key pollution sources in their communities ( 4 ). Thus, research is needed to identify or develop strategies that can help reduce the impacts of pollutant emissions from diesel trucks in these communities as well as in other DACs ( 5 ). This paper is focused on one such strategy, which is emission-based access restriction and pricing.
Literature Review
A variety of access restriction and pricing schemes have been used around the world to limit excessive numbers of vehicles or restrict certain types of vehicles from entering a designated area, to address traffic congestion, air pollution, and other issues in the area. The most common ones are congestion pricing schemes and low emission zones (LEZs). Congestion pricing schemes charge a fee or toll for a vehicle to enter a designated area such as a city center. They are implemented primarily to reduce traffic congestion in the area, but they can also help address other issues such as air quality and noise. Some of the well-known congestion pricing schemes are those in the U.K., Sweden, and Singapore ( 6 ). On the other hand, LEZs are focused primarily on reducing air pollution where vehicles with high emissions are not allowed to enter an LEZ or will have to pay a fee to enter. LEZs have been implemented around the world, but most notably in Europe where there are more than 250 LEZs in different cities. These LEZs vary widely in many aspects such as geographic coverage, vehicle types restricted, required emission standards, period (time/day/month) when LEZ is in effect, entry fee and fine, and enforcement, among others ( 7 ). One of the largest LEZs in Europe (and the world) is the London LEZ, which has become increasingly strict in both emission requirements and vehicle types restricted since 2008 ( 8 ).
There have been many studies that evaluated the impacts of LEZs such as those in Germany, the Netherlands, Portugal, Spain, and the U.K. ( 9 – 13 ). Most of these studies have found the implementation of LEZs to have positive effects on reducing air pollutant concentrations inside the LEZs. For example, the evaluation of the recently implemented, more restrictive ultra low emission zone (ULEZ) in central London after 6 months showed that carbon dioxide (CO2) and NO x emissions from motor vehicles inside the zone decreased by 4% and 31%, respectively, compared with if the ULEZ was not in place. The reduction in NO x emission also helped contribute to the drop in nitrogen dioxide (NO2) concentration by 29% as measured before and after the implementation of the ULEZ ( 14 ). As another example, Denmark has implemented LEZs specifically for HDDTs since 2008. According to one study, the LEZ in Copenhagen was associated with a 5% reduction in average PM2.5 concentrations ( 15 ). However, it should be noted that the evaluation of the efficacy of LEZs based on air quality measurement data is complex as there are other confounding factors (e.g., variation in meteorological conditions, fleet turnover) that could affect the levels of air pollutant concentration in the LEZs. Additional reviews of LEZs in Europe can be found in Urban Access Regulations in Europe and Holman et al. ( 7 , 16 ).
Compared with Europe, LEZs are not common in the U.S. While not called LEZs, the emission-based access restriction and pricing strategy has been implemented at the ports of Los Angeles and Long Beach. Beginning in 2008, the Clean Trucks Programs at both ports banned pre-1989 trucks followed by a progressive ban on all trucks that did not meet the 2007 emission standards for heavy-duty diesel engines by 2012. During the phase-in period from 2009 to 2011, a $35 per loaded 20 ft equivalent unit (TEU) container fee was assessed for container moves by trucks that did not meet the 2007 emission standards. The collected fees were used to administer the programs and provide incentives for the purchase of trucks meeting the 2007 emission standards. When the Clean Trucks Programs were fully implemented in 2012, port truck emissions at the port of Los Angeles were estimated to reduce by more than 90% ( 17 ).
Objective and Contributions of the Study
The objective of this study is to evaluate, through a modeling approach, the potential of the emission-based access restriction and pricing strategy to mitigate the impacts of HDDT emissions for DACs. Unlike ports, which often are the origin or the destination of truck trips, many DACs disproportionally bear the traffic congestion and air pollution burdens from pass-through truck traffic. Thus, the focus of the evaluation is on the ability of LEZs to divert some pass-through HDDTs and their emissions away from DACs. The evaluation is conducted for a case study DAC in Southern California.
The contributions of this study are twofold. First, most of the LEZs to date have been implemented around major trip attractions, such as city centers and ports. This type of implementation aims to reduce vehicle emissions inside the LEZ primarily by encouraging the turnover of vehicles entering the LEZ toward cleaner technologies ( 18 , 19 ). In contrast, this study evaluates a different type of LEZ implementation that aims to reduce vehicle emissions inside the LEZ primarily by diverting high-emitting pass-through vehicles away from the LEZ. Second, while LEZs have commonly been regarded as an air pollution mitigation strategy, this study offers a unique perspective that LEZs can simultaneously be used as a strategy for addressing environmental justice issues as well.
Methods
Case Study Area
The emission-based pricing strategy was evaluated for the East Los Angeles/Boyle Height/West Commerce (ELABHWC) community in Southern California. This community is made up of predominantly Hispanic or Latino population, and has median household income well below that of California. It is one of the communities participating in the CARB’s Community Air Protection Program. As shown in Figure 1, this community is located near downtown Los Angeles, and there are three major truck flows that go into, out of, and through the community. The first is the truck traffic on Interstate 710 (I-710), shown as red line, between the ports of Los Angeles and Long Beach (a.k.a. San Pedro port complex) and the ELABHWC community. This is a major freight corridor with a large amount of truck traffic that carries freight containers from the port complex to the railyards inside the community, and vice versa. Since the origin or destination of these truck trips are inside the boundary of the community, the trucks cannot be diverted away.
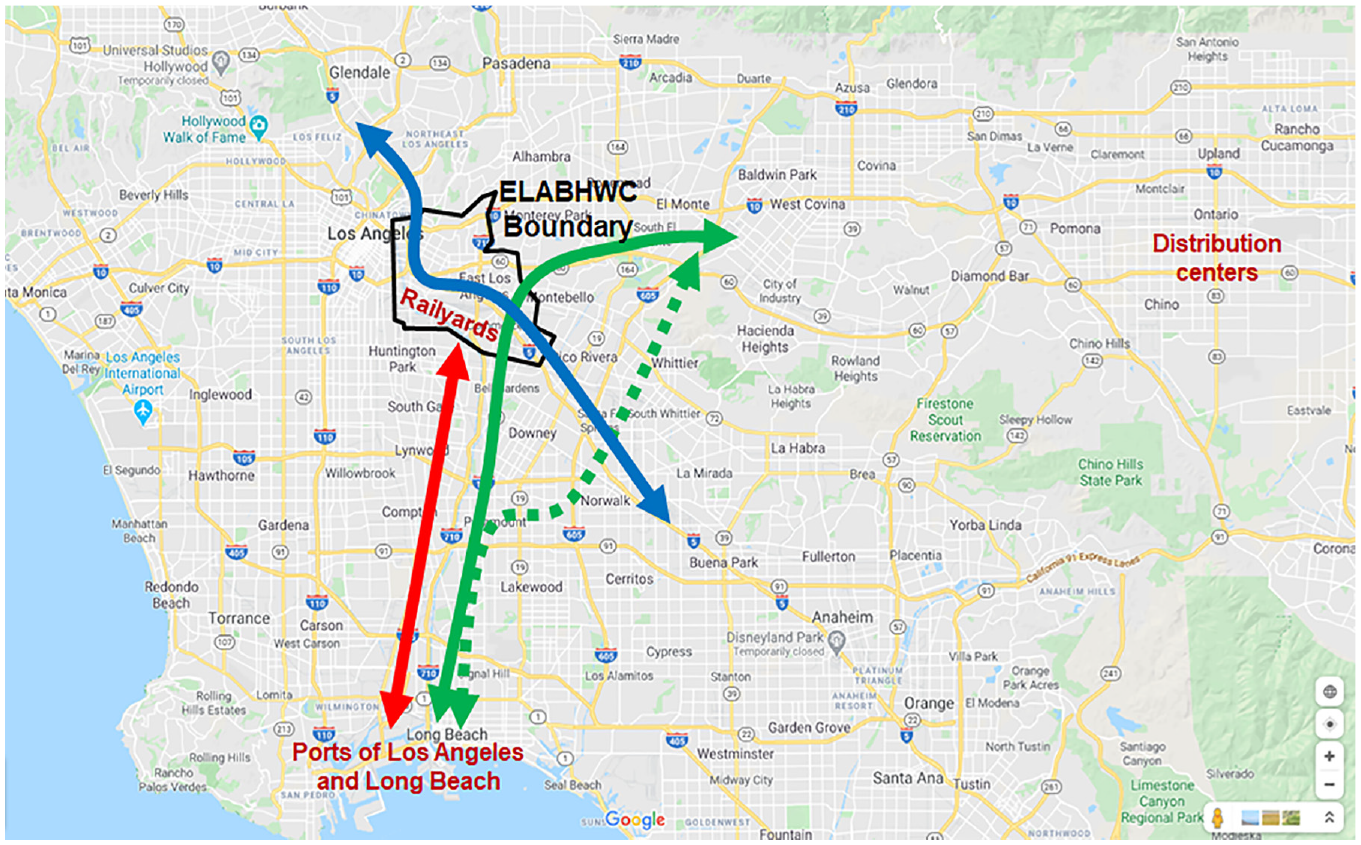
Truck flows around the East Los Angeles/Boyle Height/West Commerce (ELABHWC) community in Southern California.
The second major truck flow around the ELABHWC community is the truck traffic on Interstate 5 (I-5), shown as a blue line in Figure 1, which goes through the community. I-5 is a major freight corridor that connects Northern California, the Central Valley, and Southern California. Many of the trucks on the section of I-5 that goes through the ELABHWC community do not have stops to make inside the community; they are mostly pass-through traffic. Diverting some of these trucks away from passing directly through the community could help reduce the impact of emissions from these trucks on the community. However, based on the topology of the freeway network in the area, there is no comparable alternative route in either northbound or southbound directions for the truck to take. The shortest detour route on the freeway network for the northbound truck traffic is to take Interstate 605 (I-605) North, followed by Interstate 210 (I-210) West, before joining I-5 North again. The shortest detour route on the freeway network for the southbound truck traffic is to take Interstate 110 (I-110) South, followed by Interstate 105 (I-105) East, I-605 South, and State Route 91 (SR-91) East before getting back onto I-5 South. As can be seen in the map, both alternative routes will still incur a large amount of extra distance and, most likely, extra travel time, depending on traffic conditions on the different freeways.
The third major truck flow around the ELABHWC community is the truck traffic that travels from the San Pedro port complex on I-710 North and then heads East toward warehouses and distribution centers in the Inland Empire. One possible route for these trucks is to take I-710 North, and then get onto State Route 60 (SR-60) East, essentially passing through the ELABHWC community, as shown by the green solid line in Figure 1. Another possible route is to take I-710 North from the port complex, and then take either SR-91 East or I-105 East to connect to I-605 North before getting onto SR-60 East, as shown by the green dashed line. Unlike the case with the I-5 pass-through truck traffic, the alternative route for diverting pass-through truck traffic away from the ELABHWC community in this case is more comparable in distance and, possibly, depending on traffic conditions, travel time.
General Scopes and Assumptions
The modeling of the emission pricing strategy was done in the Southern California Association of Governments (SCAG)’s regional travel demand model (TDM) ( 20 ). It covers the transportation network in six counties in Southern California including Los Angeles county in which the ELABHWC community is located. The SCAG’s regional TDM includes a heavy-duty truck model that is used to support project and policy planning related to goods movement in the region, such as port access improvements and freight-related land use strategies, as well as air quality and economic impact analyses. The model forecasts truck trips for three heavy-duty truck weight classes: light-heavy (8,500–14,000 lb of gross vehicle weight rating [GVWR]), medium-heavy (14,001–33,000 lb of GVWR), and heavy-heavy (more than 33,000 lb of GVWR). It captures heavy-duty truck trips that have both origins and destinations within the region as well as external trips that come into, go out of, and pass through the region. In addition, the model includes a sub-model to capture heavy-duty truck trips associated with the San Pedro ports. The modeling of the emission pricing strategy was based on the following scope and assumptions.
The modeling area is a subset of the SCAG regional TDM network for calendar year 2016, as shown in Figure 2. It is centered around the ELABHWC community and includes key freeways that allow trucks to make a detour to avoid the community. This choice to conduct the modeling on a sub-area network was made to reduce the amount of time required to complete a model run. For the chosen sub-area network, each model run took around 18 to 20 h on a typical desktop computer. The boundary of the ELABHWC community was used as the boundary of the LEZ, as shown in Figure 2. The LEZ was implemented by identifying roadway links that cross the boundary of the LEZ, as shown in Figure 3, and then adding an emission fee to only the entry links. This means that vehicles not meeting the LEZ requirements will have to pay the emission fee when entering the LEZ, but not when exiting.
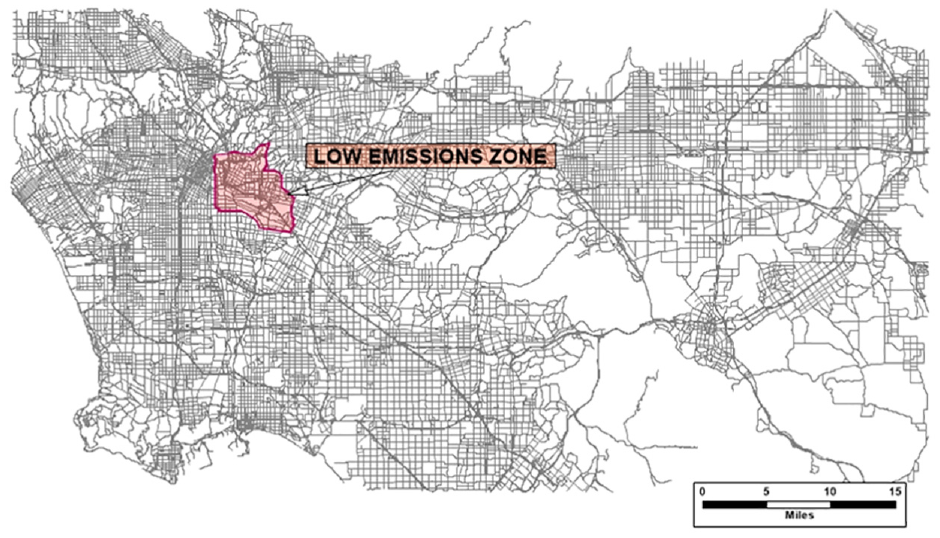
Boundary of the low emissions zone inside the modeling area.
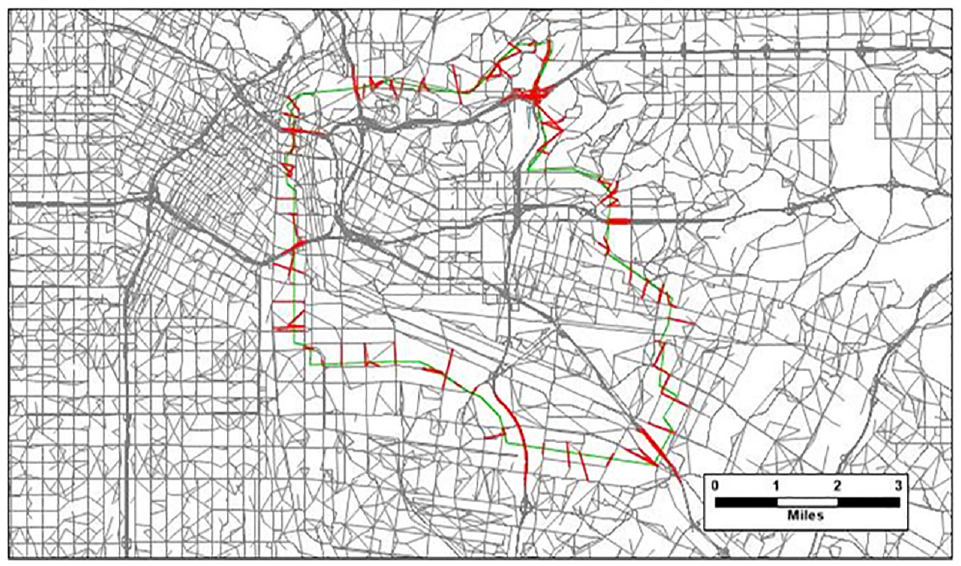
Entry links to the low emissions zone with emission-based entry fees.
Travel Demand
Travel demand in the SCAG regional TDM is expressed in the form of origin-destination (O-D) trip tables. Trip tables for the morning peak period (6–9 a.m.) in calendar year 2016 were used. There are eight trip tables, one for each of the following vehicle/occupancy classes:
Driver-alone passenger cars and trucks
Passenger cars with 2 occupants using high-occupancy vehicle (HOV) facilities
Passenger cars with 3+ occupants using HOV facilities
Passenger cars with 2 occupants not using HOV facilities
Passenger cars with 3+ occupants not using HOV facilities
Light heavy-duty trucks
Medium heavy-duty trucks
Heavy heavy-duty trucks (HHDTs)
Travel Costs
A key assumption in modeling route choice decisions of drivers is that they would choose a route with the smallest total travel cost. The total travel cost is primarily a function of travel time, but it can also be made up of multiple cost components (such as travel time, fuel, and toll) converted into monetary equivalence. In this study, the total travel cost includes travel time and the emission fee, which is only applied to certain HHDTs. To convert travel time of these trucks to monetary value, it was assumed that the value of truck travel time was $60 per hour. This value was based on the average marginal costs per hour for commercial trucking in the U.S. as reported in Hooper and Murray ( 21 ).
Emission Fee Structure
A simple emission fee structure was assumed in this modeling study:
The fee is applied to only HHDTs not meeting the required emission standards. These are Class 8 commercial trucks with GVWR of more than 33,000 lb. These trucks correspond to the T7 category in CARB’s EMFAC2007 emission model (see Table 1).
The fee is applied only when entering the LEZ. No fee is applied when exiting the LEZ. This means that a pass-through truck will only pay the emission fee once.
The amount of the fee is fixed and the same for each entry (i.e., no discount for multiple entries).
Mapping between Different Vehicle Classification Schemes
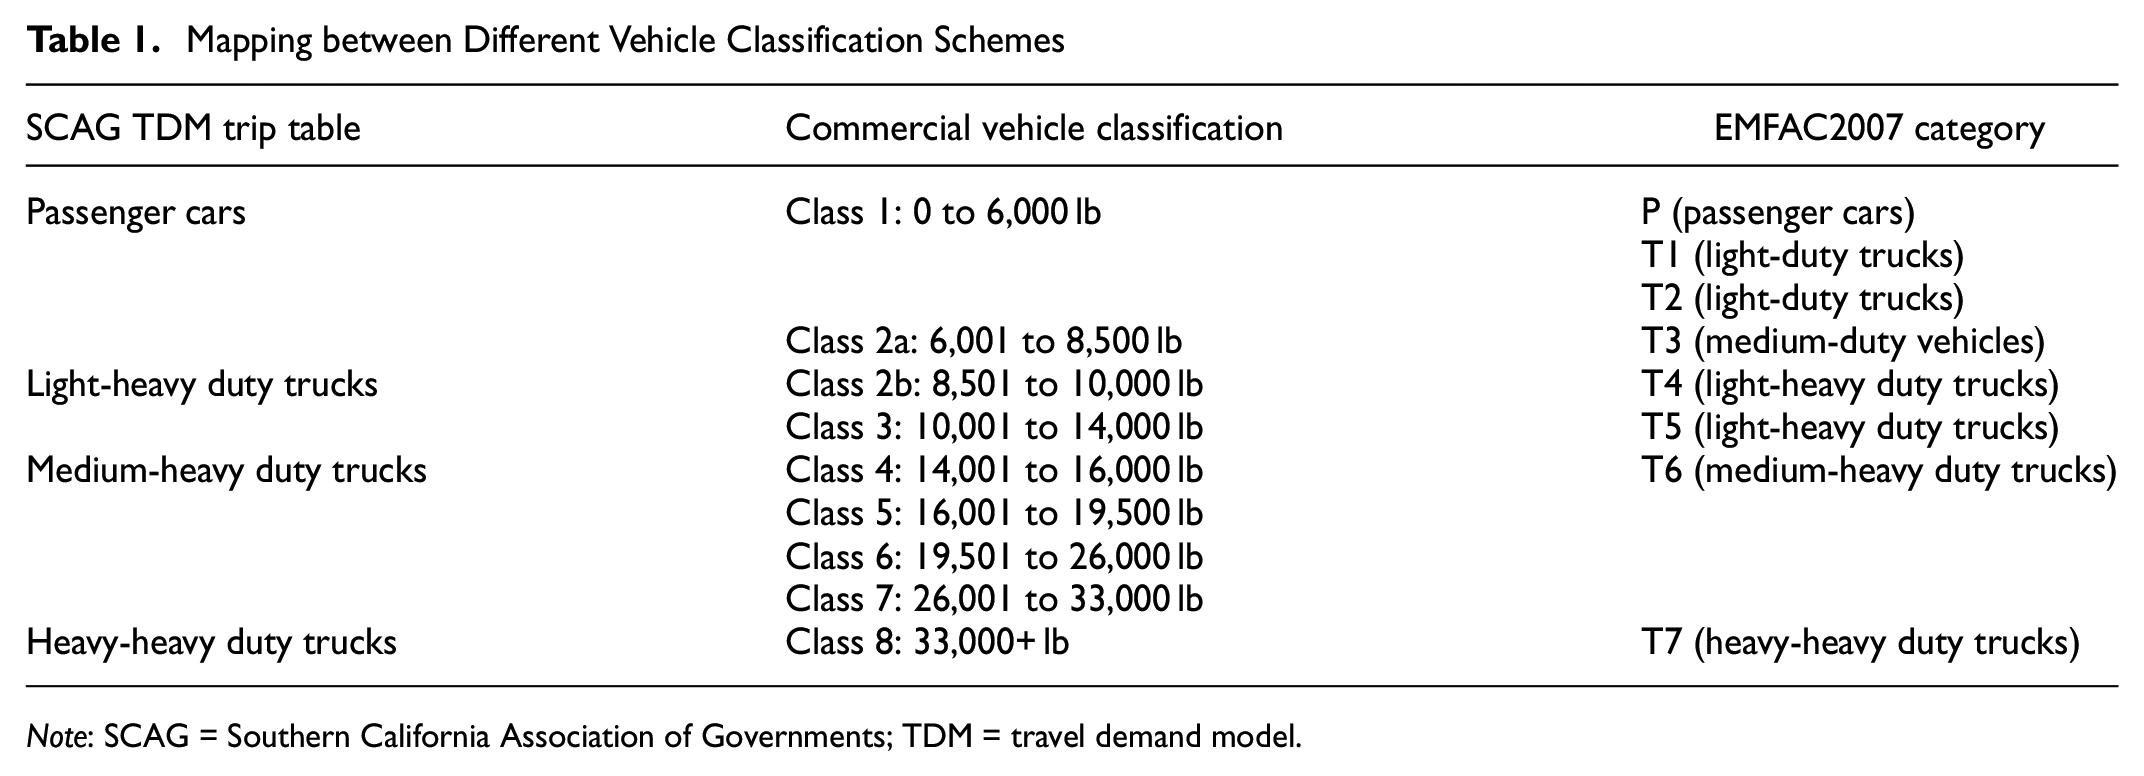
Note: SCAG = Southern California Association of Governments; TDM = travel demand model.
One way for determining whether an HHDT will need to pay the emission fee for entering the LEZ is to base it on the emission standards that the HHDT is in compliance with. In California, CARB adopted the U.S. Environmental Protection Agency (EPA)’s 2007 and later heavy-duty engine emission standards that included very stringent limits for PM and NO x . The PM emission standard took full effect in 2007. The NO x standard was phased-in for diesel engines between 2007 and 2010. The phase-in was defined on a percent-of-sales basis—50% from 2007 to 2009 and 100% in 2010. In this study, it was assumed that all HHDTs were diesel trucks. The emission fee for entering the LEZ was waived for HHDTs of model years 2010 and newer as they met both the PM and NO x emission standards.
Figure 4 shows plots of the fraction of HHDTs by model year grouped according to the emission standards. The plot on the left is for HHDTs registered in the five zip codes that make up the ELABHWC community (i.e., 90022, 90023, 90033, 90040, and 90063). The plot on the right is for HHDTs registered in the Los Angeles sub-area of the South Coast air basin. The plots show that the fraction of HHDTs that would be subject to the emission fee in both areas was similar—44% for the ELABHWC community and 46% for the Los Angeles sub-area. In this modeling study, the average value of the two (i.e., 45%) was used. This means that the HHDT trip table in the TDM was split into two sub-tables, one for HHDTs of model years 2009 and older (45% of the total) and the other for HHDTs of model years 2010 and newer (55% of the total HHDT trips).
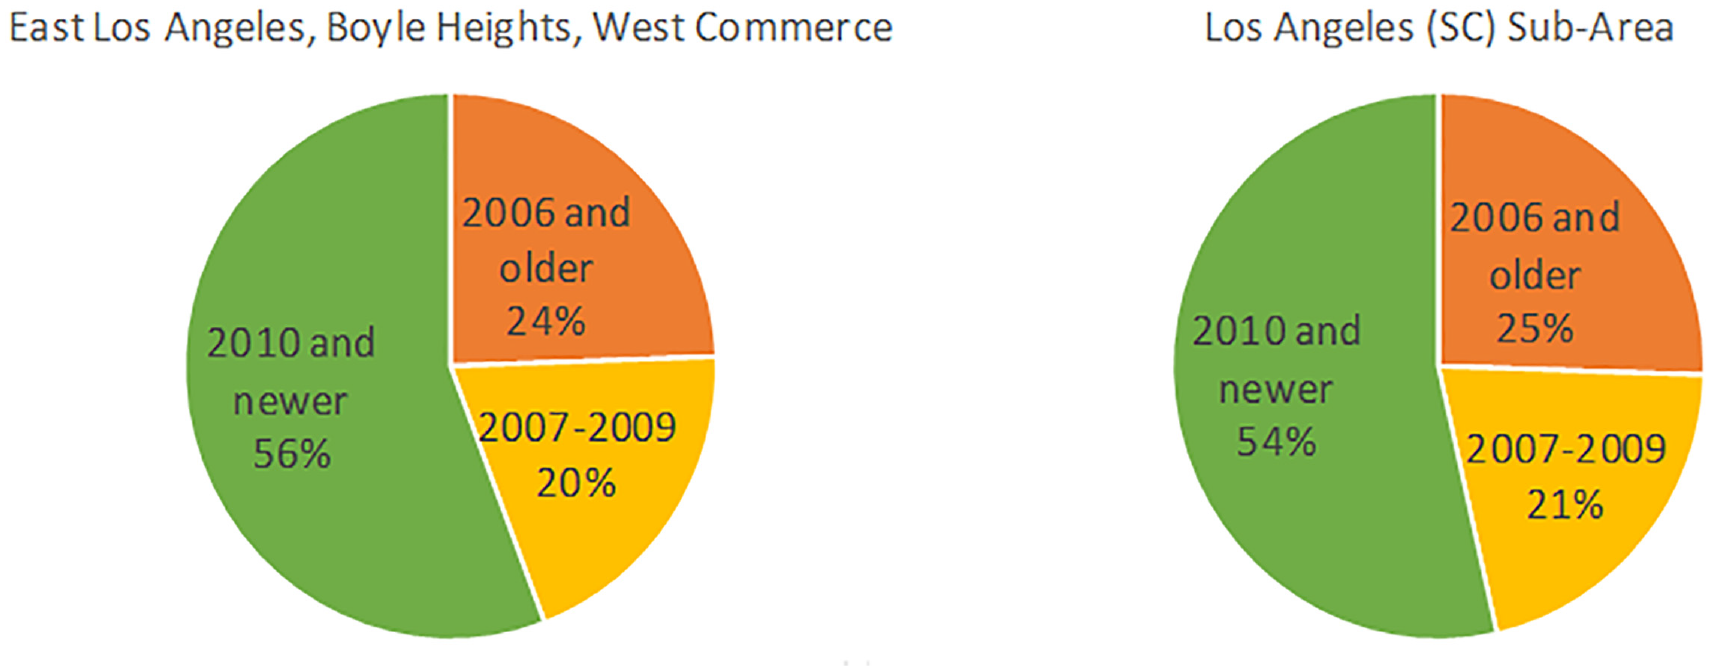
Fraction of heavy heavy-duty trucks (HHDTs) by model year in calendar year 2016, grouped according to emission standards: HHDTs registered in the five zip codes that make up the East Los Angeles/Boyle Height/West Commerce (ELABHWC) community (i.e., 90022, 90023, 90033, 90040, and 90063) (left) and HHDTs registered in the Los Angeles sub-area of the south coast (SC) air basin (right).
Modeling Approach and Scenarios
The modeling area is a subset of the SCAG regional TDM network for calendar year 2016. The full network consists of 4,109 traffic analysis zones (TAZs) whereas the selected sub-area network covered 3,288 TAZs (3,076 internal zones and 212 external zones). The calibrated O-D trip tables were truncated for the sub-area network using the “multi-modal multi-class subarea analysis” utility in TransCAD software. For each trip table, the utility ran the traffic assignment process iteratively until it converged on a truncated table.
Once the sub-area O-D trip tables had been derived, the emission fee was implemented on the entry links to the LEZs, and the traffic assignment routine was executed for scenarios without and with the emission fee. Parameters for the traffic assignment routine are listed below:
Assignment method: Bi-conjugate Frank-Wolfe multi-modal and multi-class assignment
Delay function: Bureau of Public Roads (BPR)
Number of iterations: 100
Relative gap: 0.005
N conjugate: 2
Preload: Preassigned transit volume added as preload to the network
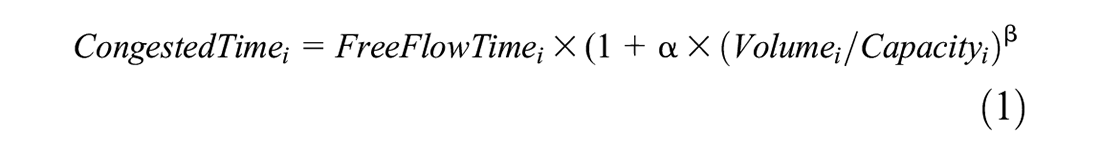
The BPR function follows Equation 1 to calculate congested travel time on link i. The α and β parameters were previously calibrated for each link considered in the sub-area network. Additionally, the values of link capacity were calibrated following the Highway Capacity Manual.
Two scenarios were modeled to evaluate the impact of emission fee on HDDT traffic and their emissions inside the LEZ. The two scenarios are as follows:
BASE: The baseline network with no emission fee
$10 FEE: An emission fee of $10 implemented on the entry links to the LEZ (note that this emission fee is only applied to HHDTs of model years 2009 and older)
The selection of the level of emission fee was based on the container fee of $10 per loaded TEU being considered by the Ports of Los Angeles and Long Beach as part of their updated Clean Trucks Programs ( 22 ).
Emission Calculation
The calculation was focused on PM2.5, NO x , and CO2 emissions from HHDTs. They were calculated using Equation 2:

where
Ei,j = mass emission of pollutant j on link i,
Vi,k = HHDT volume on link i with link speed k,
Li = length of link i, and
EFj,k = emission factor of pollutant j at speed k.
The emission factors for HDDTs were obtained from CARB’s EMFAC2017 emission model for the following model run specifications:
Source: EMFAC2017 (v1.0.2) emission rates
Region Type: Sub-area
Region: Los Angeles (south coast)
Calendar Year: 2016
Season: Annual
Vehicle Classification: EMFAC2007 categories
Model Year: All (1972–2017)
The obtained emission factors were weighted by vehicle miles traveled (VMT) into two groups: 1) model years 2009 and older, and 2) model years 2010 and newer. For PM2.5, the emissions from brake wear (0.02646 g per mile for all speeds and all model years) and tire wear (0.009 g per mile for all speeds and all model years) were also added to the running exhaust emission to result in total PM2.5 emission. Figures 5 to 7 show the emission curves of PM2.5, NO x , and CO2 as a function of speed that were used for the emission calculation in this modeling study. These emission curves clearly show that the PM2.5 and NO x emissions for HDDTs of model years 2010 and newer are much lower than those of the older trucks, as they comply with the 2007 emission standards. For CO2, the emission curve for HDDTs of model years 2010 and newer are only slightly lower than those of the older trucks.
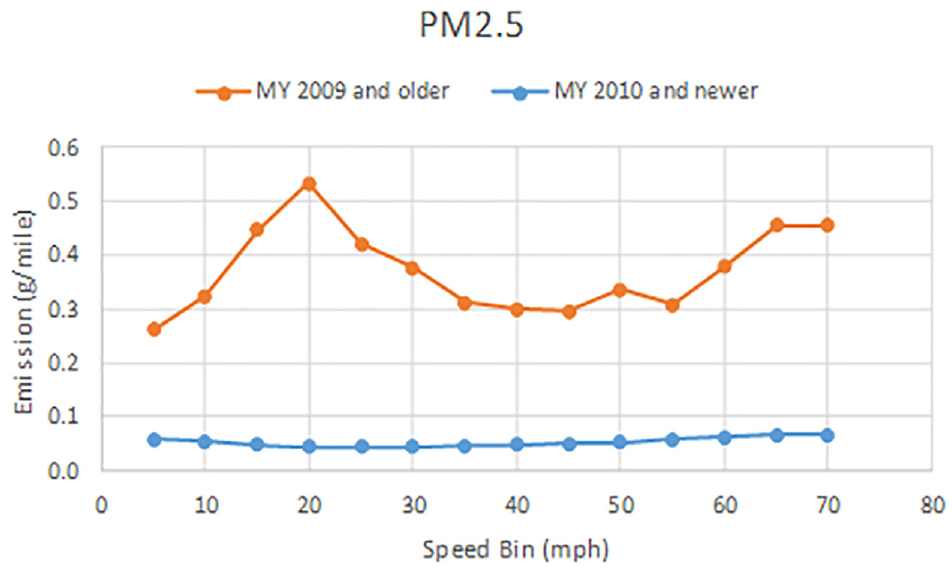
Fine particulate matter (PM2.5) emission factors for heavy-duty diesel trucks obtained from EMFAC2017.
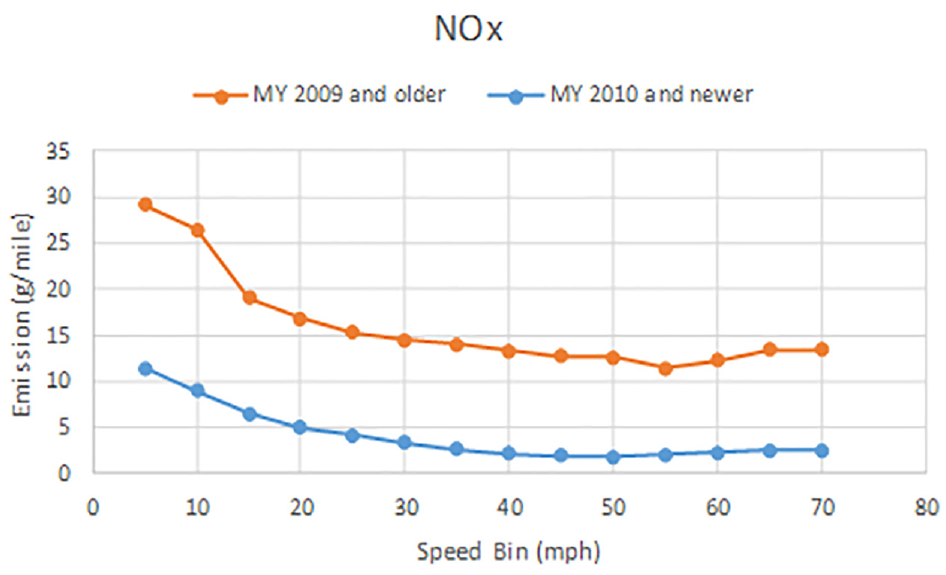
Nitrogen oxides (NO x ) emission factors for heavy-duty diesel trucks obtained from EMFAC2017.
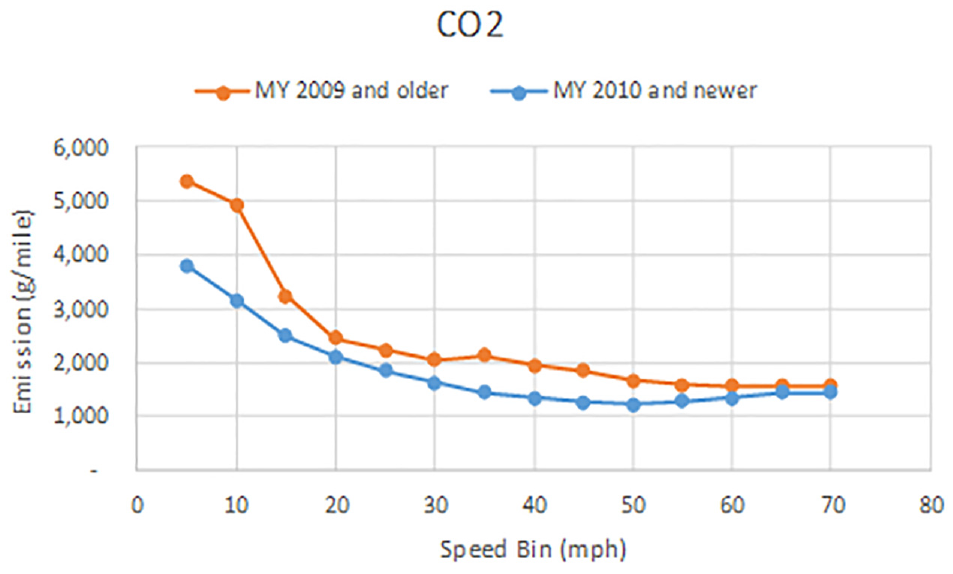
Carbon dioxide (CO2) emission factors for heavy-duty diesel trucks obtained from EMFAC2017.
Results and Discussion
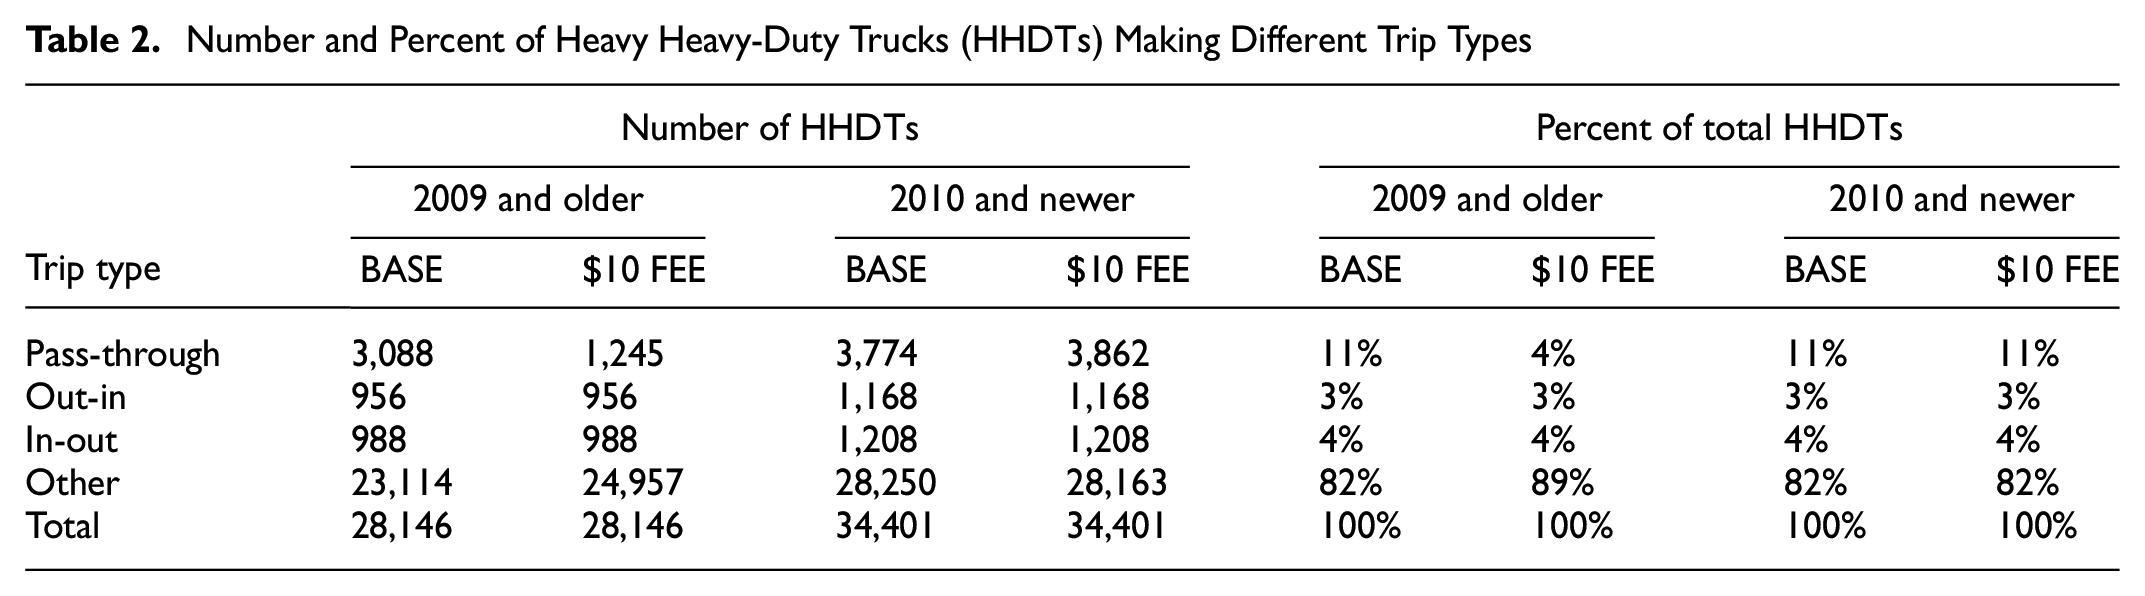
Table 2 presents the number and percent of HHDTs making different trip types relative to the LEZ. The different trip types are described below. Note that, since the LEZ is relatively small (about 3 mi radius), there is no internal HHDT trip that both starts and ends inside the LEZ.
Pass-through: Trips that pass through the LEZ
Out-in: Trips that start outside the LEZ and end inside the LEZ
In-out: Trips that start inside the LEZ and end outside the LEZ
Other: Trips that do not cross the LEZ at all
Number and Percent of Heavy Heavy-Duty Trucks (HHDTs) Making Different Trip Types
Vehicle Miles Traveled (VMT), Vehicle Hours Traveled (VHT), and Emissions from Heavy Heavy-Duty Trucks (HHDTs) in Different Analysis Zones and Pricing Schemes
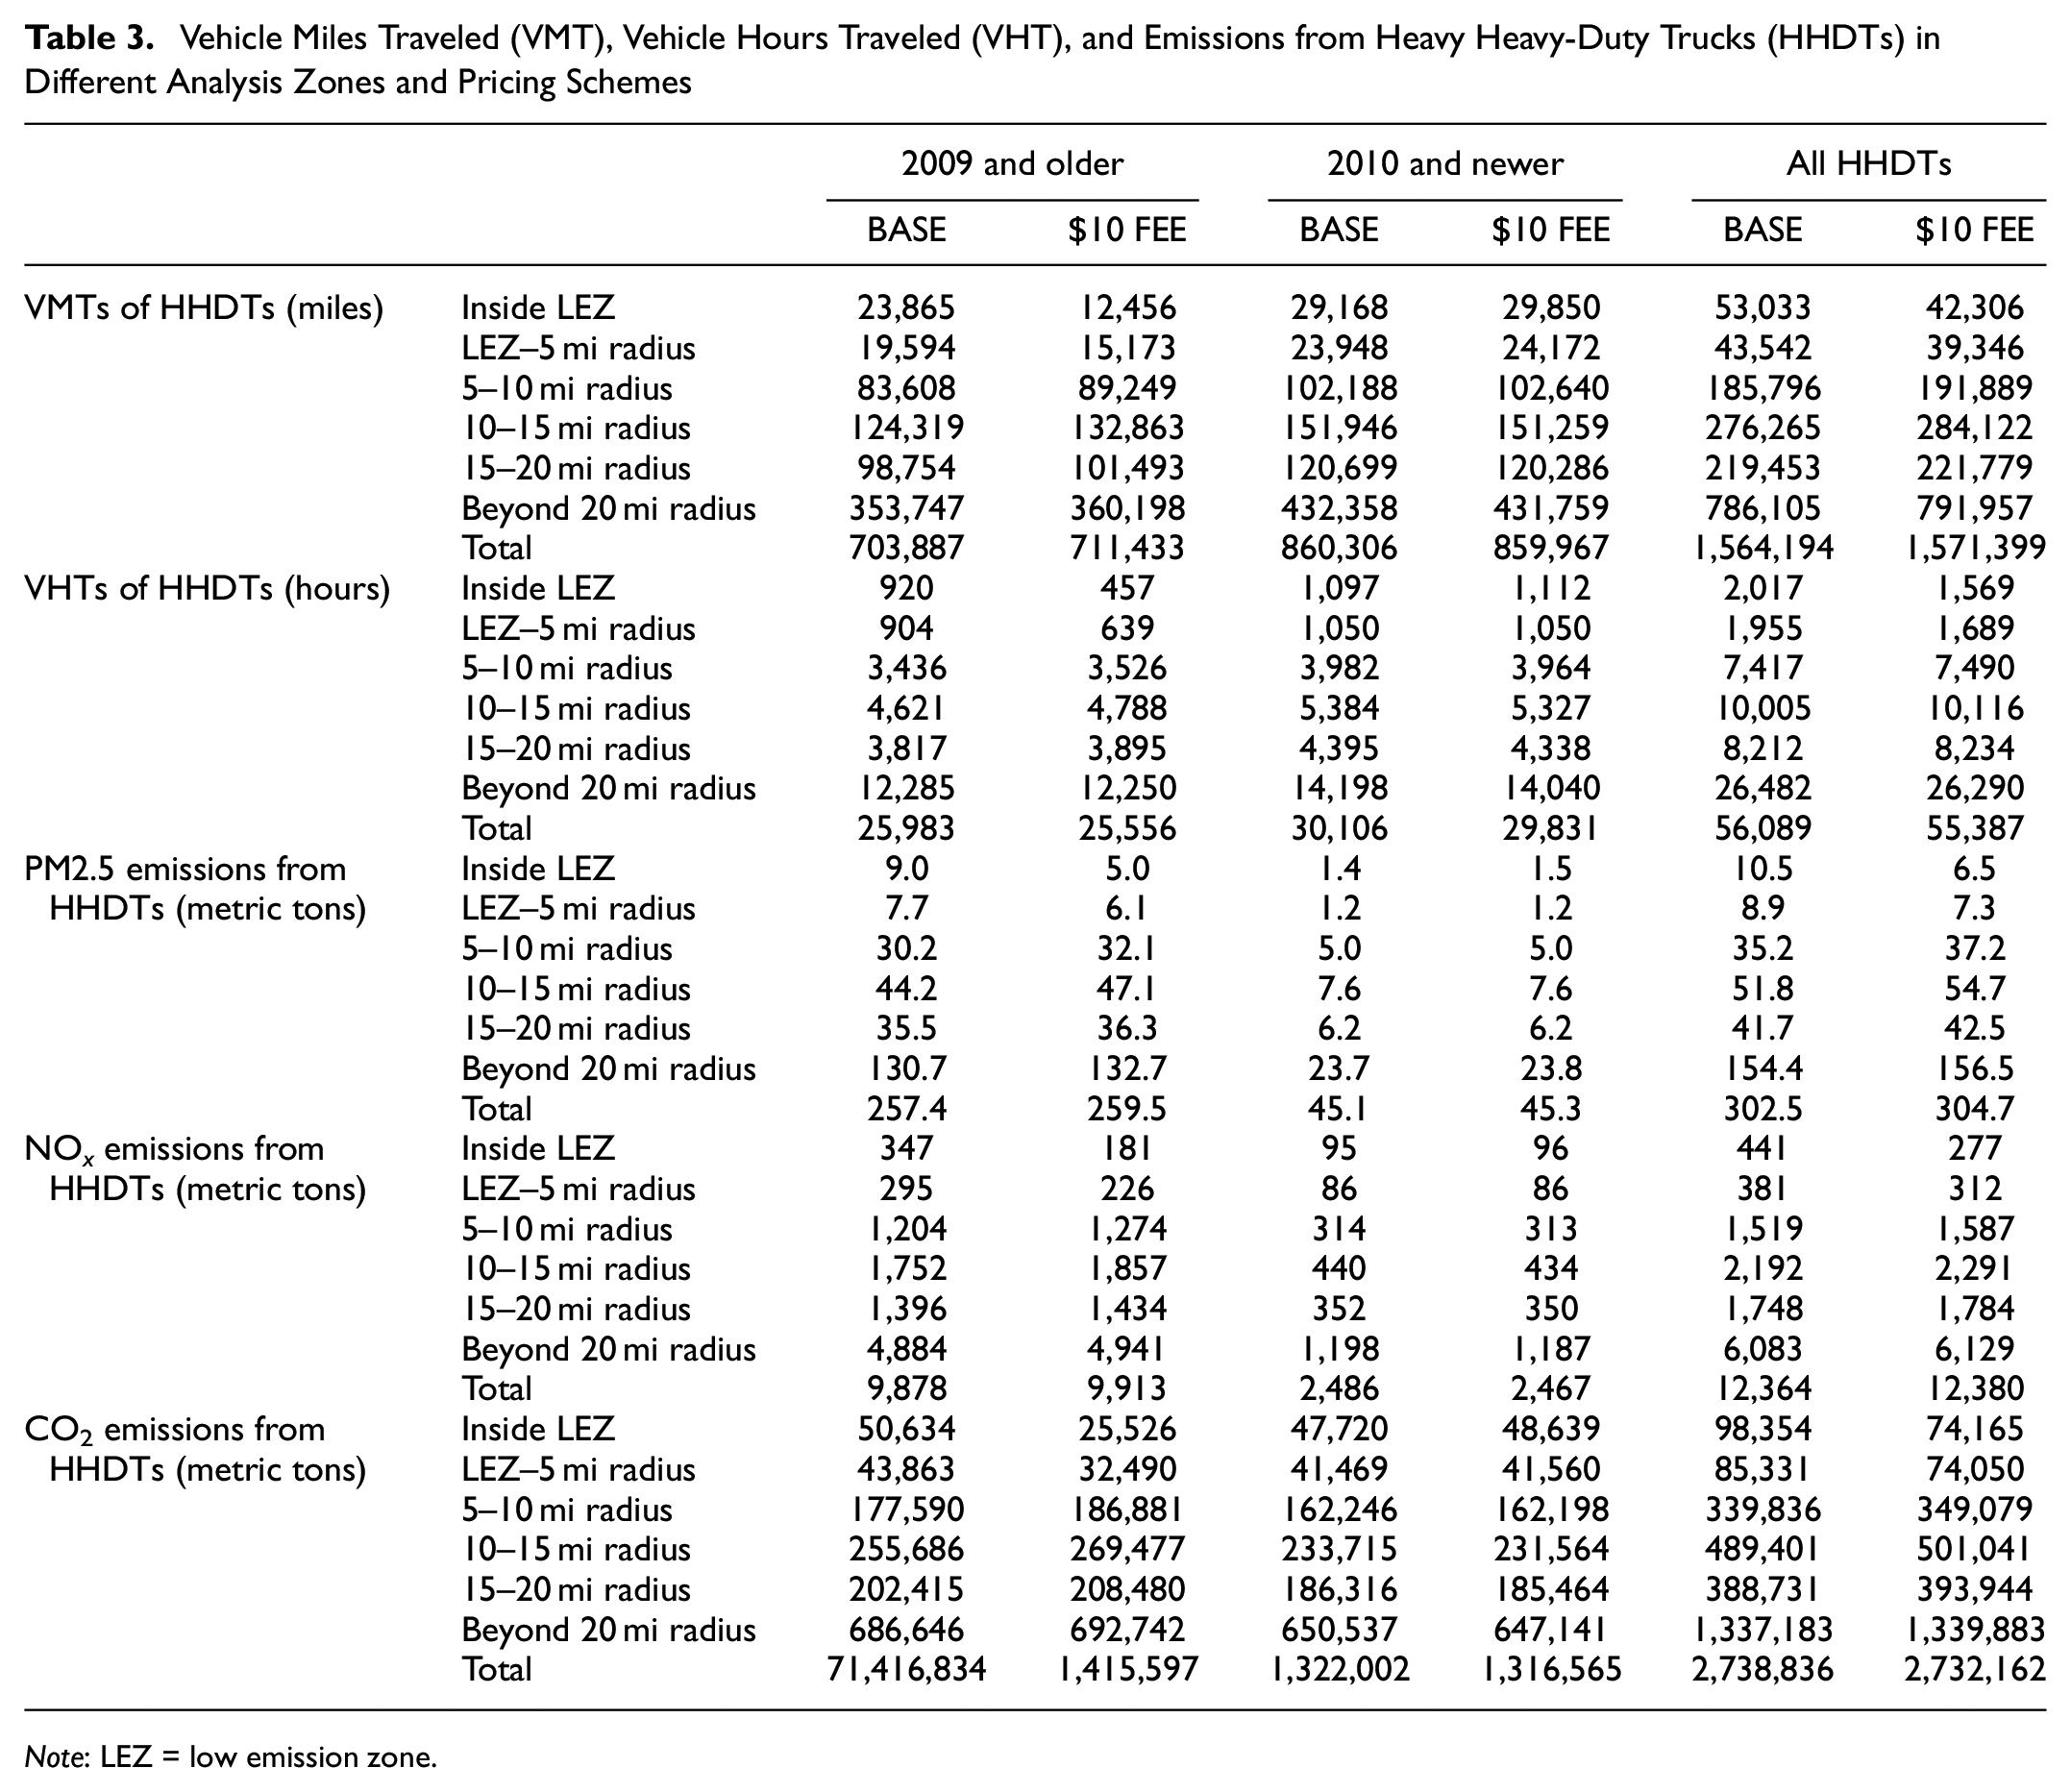
Note: LEZ = low emission zone.
Changes in Vehicle Miles Traveled (VMT), Vehicle Hours Traveled (VHT), and Emissions from Heavy Heavy-Duty Trucks (HHDTs) Compared with the Baseline Scenario
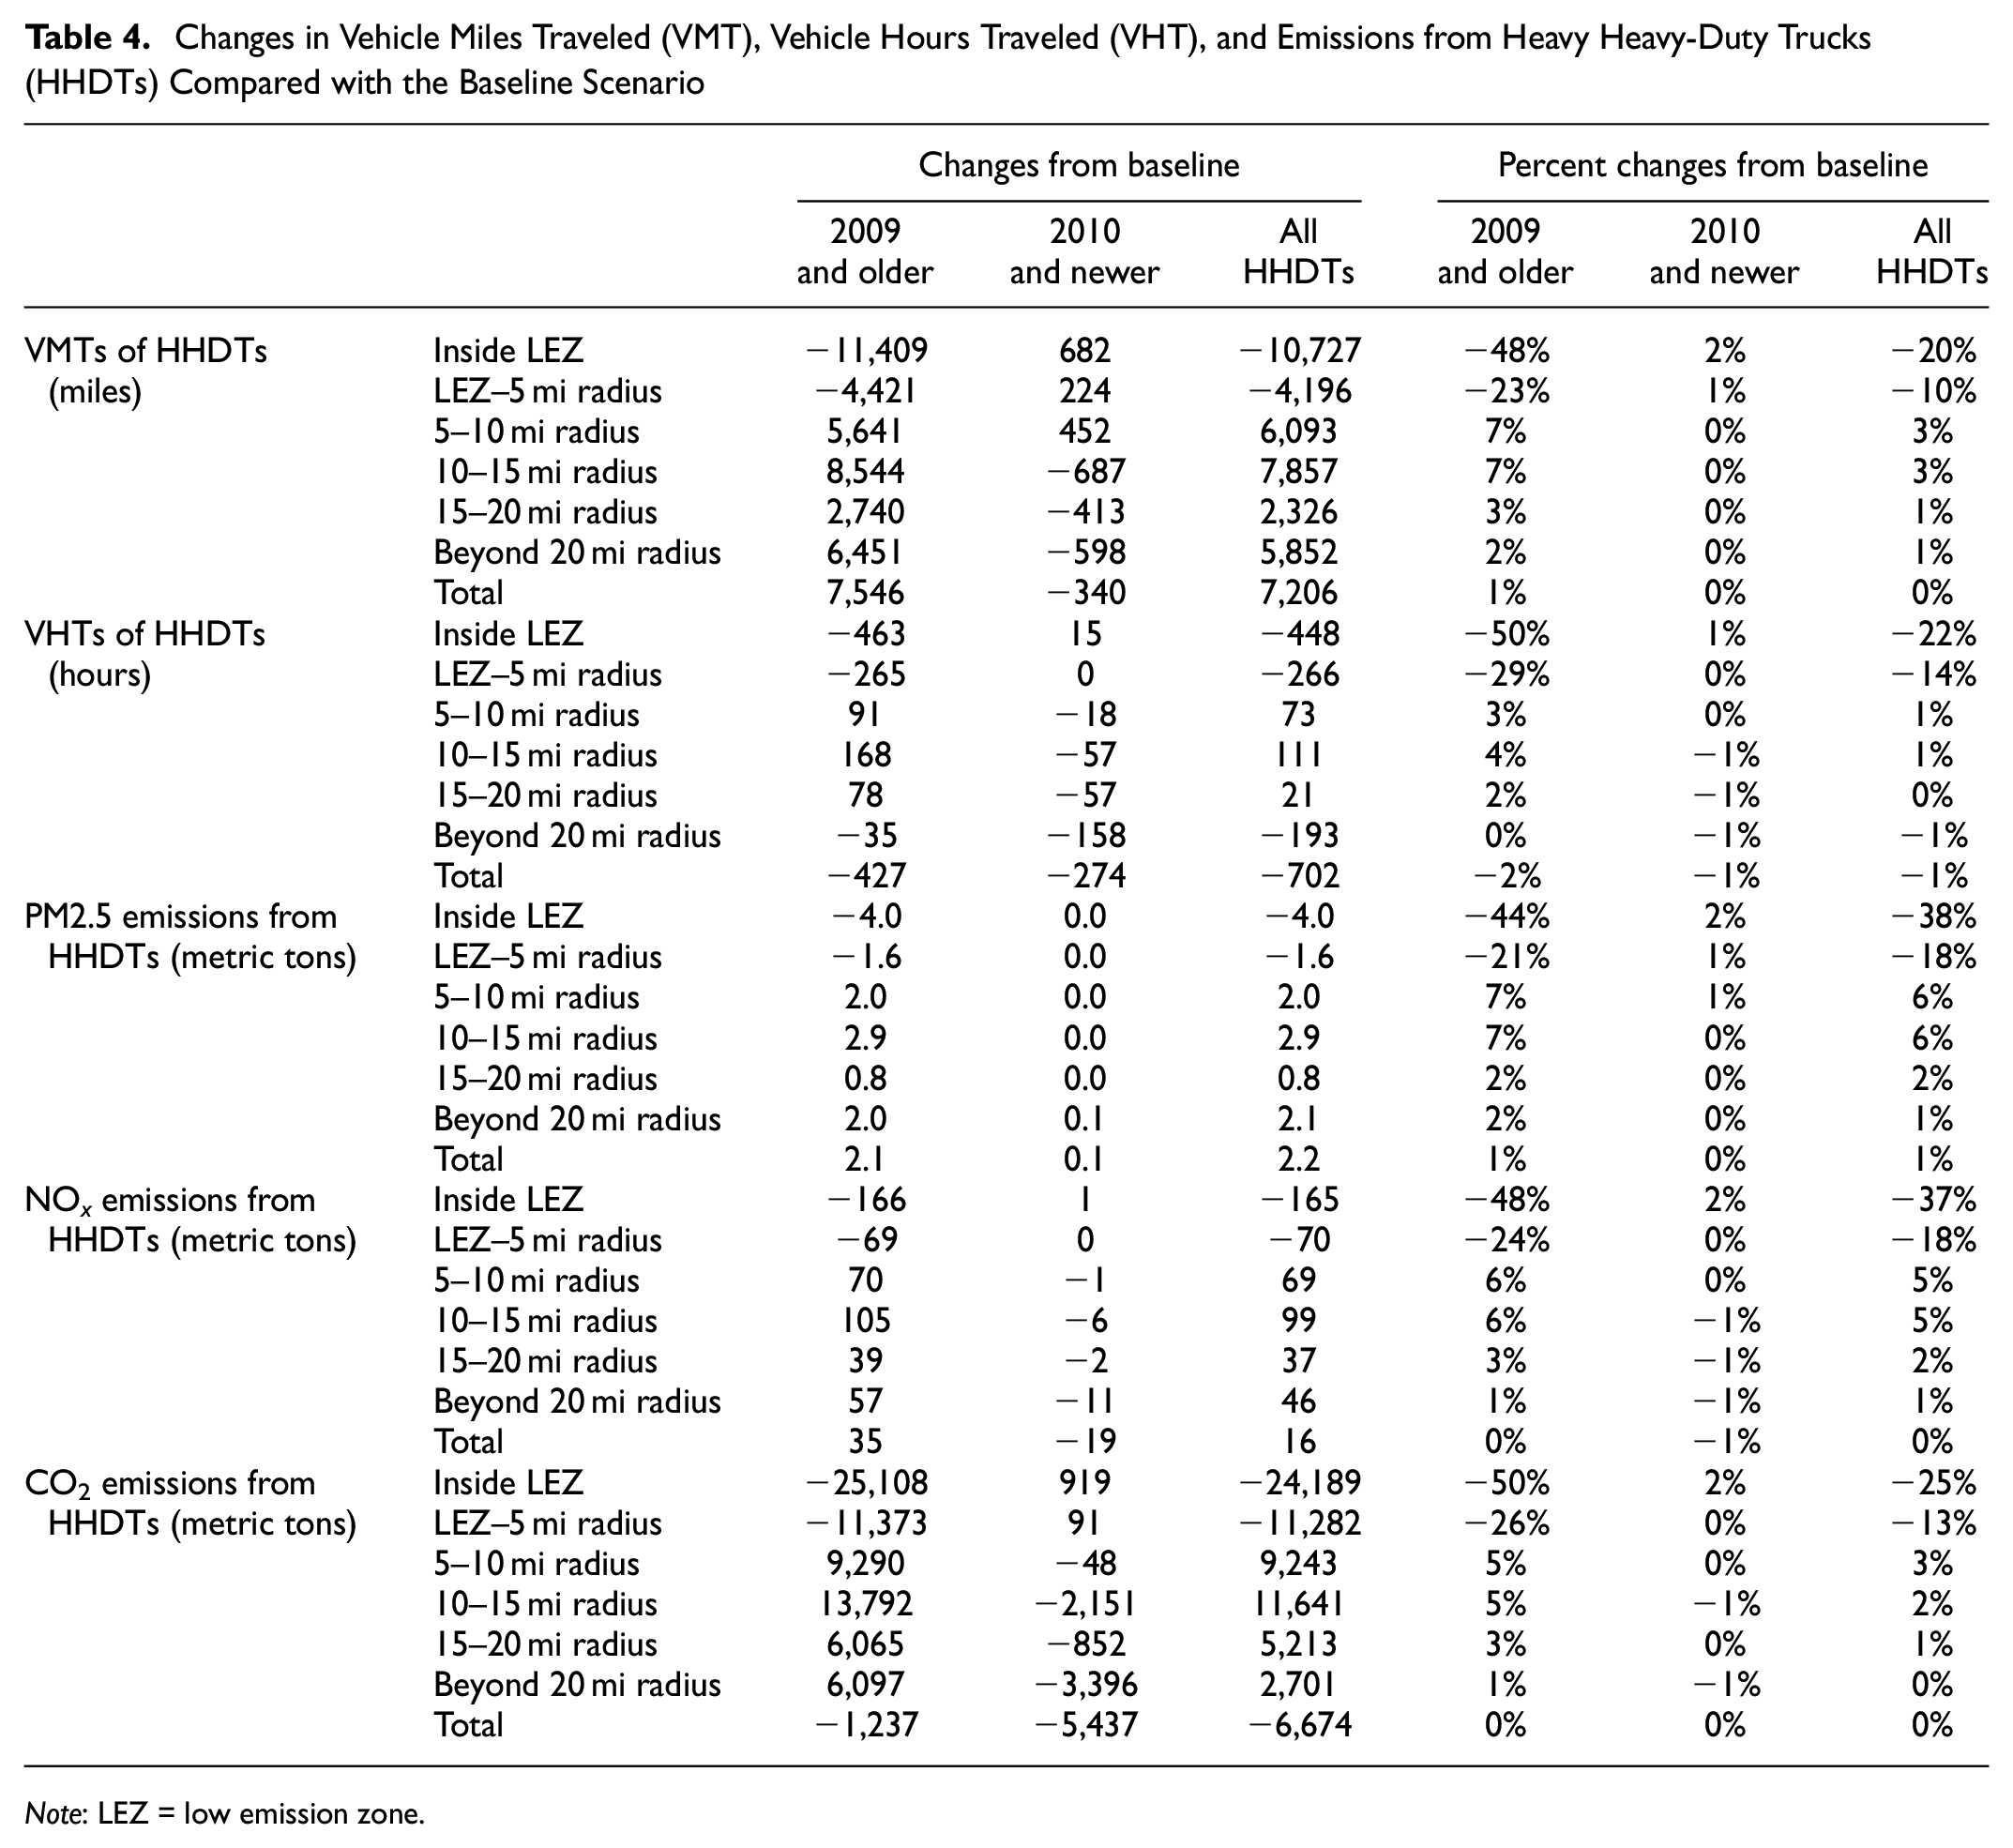
Note: LEZ = low emission zone.
According to Table 2, The distributions of HHDTs by trip type are the same for both model year groups. This is because the HHDT trip table was split into two sub-tables by applying the same ratio of older to newer trucks (45:55) across all the O-D pairs. For the 2010 and newer model year group, the distributions are the same for both the BASE and the $10 FEE scenarios. This is because these trucks were not subject to the emission fee, and, thus, their total travel cost was not affected. For the 2009 and older model year group, the fraction of HHDTs making in-out trips (4%) is the same for both scenarios. This is because these trucks were not subject to the emission fee, and, thus, their total travel cost was not affected. The fraction of HHDTs making out-in trips (3%) is also the same for both scenarios. While these trucks were subject to the emission fee, they had no choice but to pay the fee as their destinations were inside the LEZ. On the other hand, the fraction of 2009 and older model year HHDTs making pass-through trips changed considerably. It was 11% for the BASE scenario, but dropped to 4% for the $10 FEE scenario. That means 7% of the total HHDTs of model years 2009 and older were diverted away from the LEZ with the implementation of the emission fee.
Figures 8 and 9 show the modeled volumes and speeds of 2009 or older model year HHDTs in the BASE and $10 FEE scenarios, respectively. By comparing the thickness of the lines representing the freeway sections marked in Figure 8 with the corresponding lines in Figure 9, it can be seen that these trucks were diverted from I-5 and I-710 that lead up to the LEZ to other freeways such as I-605 and I-110.
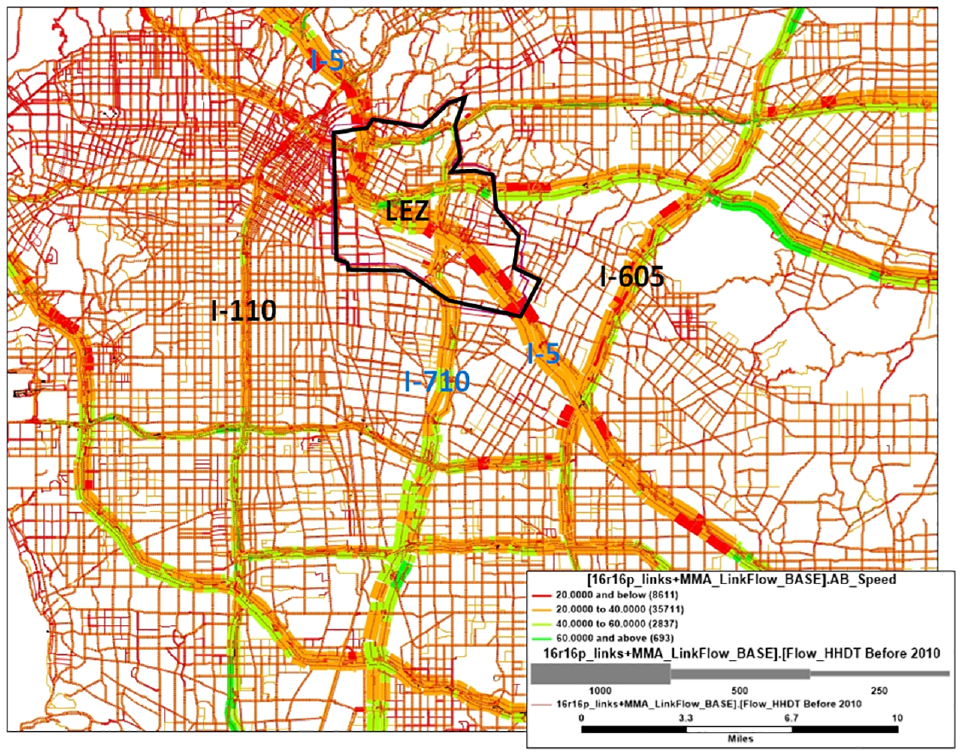
Volume (represented by line thickness) and corresponding speed (represented by line color) for 2009 or older model year heavy heavy-duty trucks in the BASE scenario.
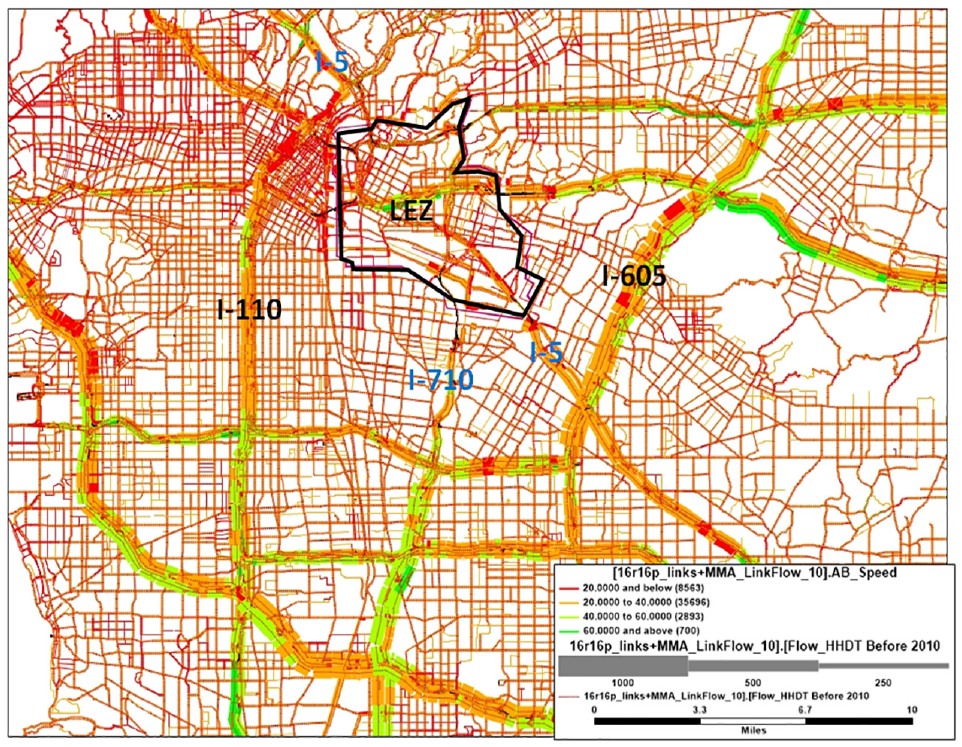
Volume (represented by line thickness) and corresponding speed (represented by line color) for 2009 or older model year heavy heavy-duty trucks in the $10 FEE scenario.
The impacts of the emission fee on HHDT trip patterns and emissions were analyzed for multiple zones to examine the shifting of some HHDT traffic and emissions from inside the LEZ to the surrounding areas. The analysis zones are shown in Figure 10 and include:
Inside LEZ: The area inside the boundary of the LEZ
LEZ–5 mi radius: The area immediately outside the LEZ but within 5 mi radius from the centroid of the LEZ
5–10 mi radius: The area between 5 mi and 10 mi radius from the centroid of the LEZ
10–15 mi radius: The area between 10 mi and 15 mi radius from the centroid of the LEZ
15–20 mi radius: The area between 15 mi and 20 mi radius from the centroid of the LEZ
Beyond 20 mi radius: The area outside 20 mi radius from the centroid of the LEZ
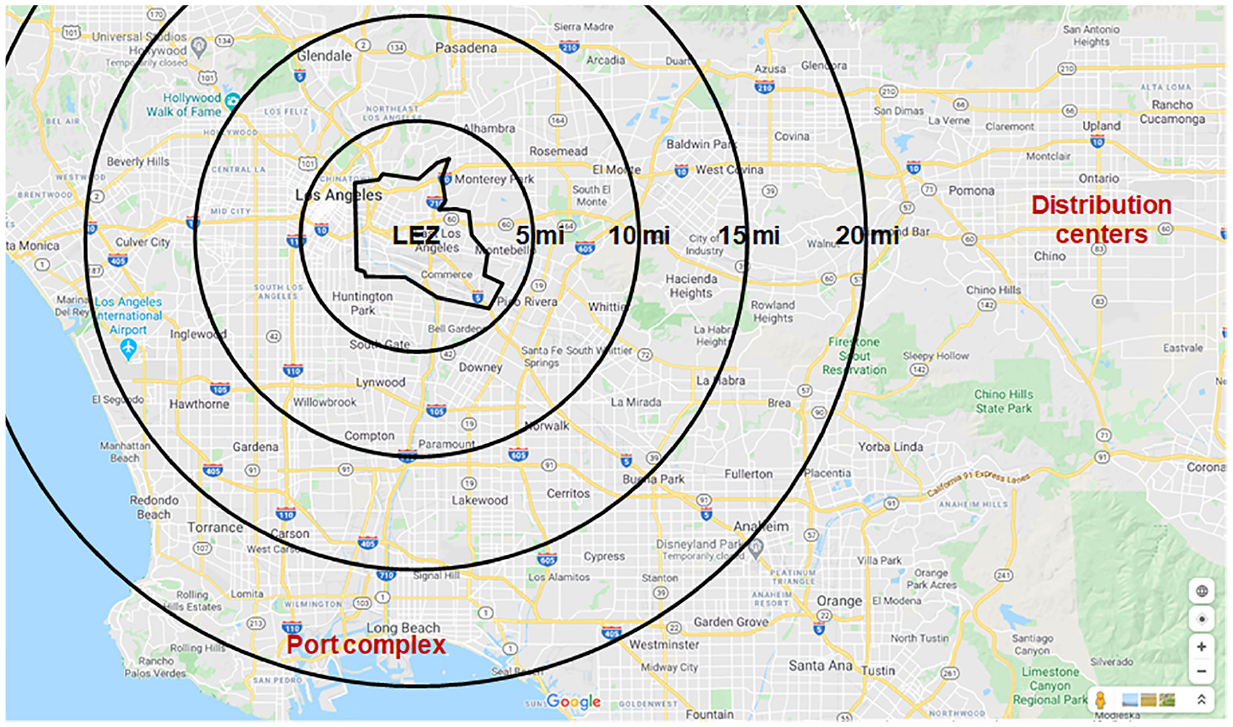
Analysis zones for heavy heavy-duty truck trip and emission impact analysis.
Conclusions
This study evaluates the potential for an emission-based access restriction and pricing strategy to reduce HDDT emissions in the ELABHWC community in Southern California. The evaluation was conducted using the SCAG regional TDM for calendar year 2016 where a $10 emission fee was applied to HDDTs that do not meet the 2007 emission standards (i.e., model years 2009 and older) when they enter the community, which is designated as an LEZ in the model. Under the modeling scopes and assumptions used in this study, the effects of the emission fee are noteworthy. While the emission fee does not affect truck trips that either start or end in the LEZ, it diverts 60% of the pass-through trips made by HDDTs that do not meet the required emission standards away from the LEZ.
The diversion of these truck trips away from the LEZ was found to reduce PM2.5, NO x , and CO2 emissions from HDDTs of model years 2009 and older inside the LEZ by approximately a half. In addition, the diversion also reduces PM2.5, NO x , and CO2 emissions from these older trucks in the area immediately outside the LEZ but within 5 mi radius from the center of the LEZ by about a quarter. On the other hand, the diversion of old truck traffic away from the LEZ causes the emissions from these trucks outside of the 5 mi radius from the center of the LEZ to increase, especially in the areas traversed by the alternative routes taken by these trucks. However, the emission increases are relatively small. For the areas between 5 mi and 15 mi radius from the center of the LEZ, the PM2.5, NO x , and CO2 emissions increased by 7%, 6%, and 5%, respectively. These results demonstrate that the emission-based access restriction and pricing strategy can substantially reduce HDDT emissions inside and in the area immediately surrounding the LEZ with a relatively small negative effect on HDDT emissions in areas further out from the LEZ. Nevertheless, any issues of equity arising between communities should be addressed through, for instance, air quality management plans and other policy mechanisms.
The modeling results also show that the emission fee has minimal impact on the total HDDT emissions in the modeling area. The total NO x and CO2 emissions remain unchanged, while the total PM2.5 emission increases by 1%. These results imply that the emission-based access restriction and pricing strategy, which is aimed at mitigating air pollution impacts at the local level, would not unintentionally cause adverse impacts on the inventories of criteria pollutant and greenhouse gas emissions at the regional scale. It should be noted that this study is focused on the effect of changing travel patterns of the vehicles affected by the emission fee. However, an LEZ implementation would likely drive the turnover of vehicle fleet in the region toward cleaner, low or zero emission vehicles as well. Therefore, the combined emission reduction effects as a result of an LEZ implementation from both mechanisms are expected to be higher, which can contribute to achieving the air quality and climate goals of the region.
Footnotes
Acknowledgements
The research team acknowledges the program support from CARB Contract Manager, Sarah Pittiglio, during the course of the project. We also thank CARB staff and internal stakeholders for comments and feedback on the research.
Author Contributions
The authors confirm contribution to the paper as follows: study conception and design: K. Boriboonsomsin, M. Barth; data collection: S. Tanvir; analysis and interpretation of results: S. Tanvir, K. Boriboonsomsin, M. Barth; draft manuscript preparation: K. Boriboonsomsin, S. Tanvir. All authors reviewed the results and approved the final version of the manuscript.
Declaration of Conflicting Interests
The author(s) declared no potential conflicts of interest with respect to the research, authorship, and/or publication of this article.
Funding
The author(s) disclosed receipt of the following financial support for the research, authorship, and/or publication of this article: This research was conducted in fulfillment of Agreement No. 17RD009 “Geofencing as a Strategy to Lower Emissions in Disadvantaged Communities” under the sponsorship of the California Air Resources Board.