
Abstract
Medium- to long-range planning processes generally aim to fix deficiencies in the current transportation network by better distributing existing resources or acquiring new resources. This requires some way of defining better service patterns, including identifying priority places to and from which the network will increase connectivity. Typically, identifying these priority places happens through project-specific outreach efforts, sometimes with the support of job density or population data. This paper discusses a process for leveraging confirmatory public outreach and combining it with location-based services data (or other sources of multi-modal travel data, e.g., household travel surveys) to create an iteratively developed and reproducible methodology for identifying key destinations. This method allows an agency to minimize outreach fatigue by only conducting periodic public outreach on the subject, rather than asking the same baseline questions for every individual planning project. Additionally, this method better bolsters equity by moving away from normatively selected destinations (which tend to be traditional job centers with 9-to-5 commuters) and supporting more high-participation outreach efforts in the future. Ultimately, this paper makes the case that the output of outreach in a data-informed planning process should be a replicable methodology, not a static list.
Keywords
A critical part of any transportation planning process is thinking about places. A transportation planner cannot connect every building to every other building in a region, regardless of mode. Part of a planner’s job is to distill geographies into legible units and identify key priority places to and from which people will connect. While not universally required, most larger-scale transportation planning processes include the identification of key destinations or focus areas (e.g., 1 – 4 ).
There can be issues with the ways that transportation agencies identify critical locations in planning processes. Most simply, these locations have historically been identified by planners who use either employment information or their own understanding of place, coupled with public input, to identify critical destinations (e.g., Orange County Transport Council’s Long Range Transportation Plan 2045 [ 3 ]). The problem with this normative method is that it often does not correct for the biases of planners themselves. There is a lack of diversity in the American transit planning profession; as of 2010, 80% of American planners were White and 60% were men ( 5 ). American planners have a median annualized wage of $78,500, above the median earnings of $56,287 for full-time, year-round workers ( 6 , 7 ). Because planning jobs themselves are often white-collar professions, the personal travel experiences of planners are typically traditional commutes. Thus, relying simply on normative decision-making can result in a list of destinations selected being highly focused on traditional job centers. More recently, planners have used data to support the selection of places, but often rely only on residential data from the U.S. Census, Longitudinal Employer-Household Dynamics, or local land-use projections to understand job growth (e.g., 1 – 4 ). Employment data which highlight job centers that are filled with more traditional 9-to-5 jobs can unintentionally bias the results of a planning process toward trips made by wealthier and Whiter travelers ( 8 , 9 ). Meanwhile, when residential Census data is used as the primary means to understand the distribution of vulnerable populations in an area, it misses travel that is happening between non-home locations, trips which are even more common among low-income people and people of color ( 10 , 11 ).
More broadly, traditional access measures used in planning projects (e.g., how many “X” can you reach in “Y” minutes) also have implicit assumptions around key destinations, although those usually focus on types of places as opposed to neighborhoods. Many of these measures focus on how many jobs can be reached within a certain time limit, which exacerbates some of the same equity issues mentioned above related to prioritizing particular trip types for particular people ( 12 – 16 ). Some modern versions of these measures expand the list of destination types to include more than jobs, but this still involves some normative decision-making around which destinations are important, inevitably leaving out critical edge cases ( 17 ).
Most agencies employ extensive public outreach in their planning processes, but often ask the same groups of people the same questions for each unique project (e.g., “What would make transportation better in Massachusetts?”). This paper specifically focuses on this in the context of choosing priority places for planning projects, but this issue is also present in other contexts. Researchers know that participants in public outreach experience fatigue, often dropping out of surveys that are long, arduous, or repetitive of other survey efforts in the short term ( 18 , 19 ), or failing to participate in multiple outreach efforts with regularity in the long term ( 20 , 21 ). The more organizations can consolidate the widely applicable outreach they are doing, the more likely they are to achieve broad participation in answering key questions that are specific to individual projects. Additionally, public outreach strategies can underrepresent the most vulnerable members in a community, including lower-income people and people of color, such that direct outreach alone may not fully capture their priorities ( 22 – 24 ).
Big data can provide us a holistic picture of what is happening in a region, while outreach can help us validate the representativeness of the data and identify edge cases that are not adequately represented. There are issues and biases that can appear in plans using both data-informed/quantitative approaches and outreach/qualitative approaches, so this paper recommends combining them to leverage the benefits of replicability and scale from big data and the validation of real experiences from direct outreach to communities. Ultimately, the output of outreach in a data-driven planning process should be a replicable methodology, not a static list.
This paper focuses on the Massachusetts Bay Transportation Authority’s (MBTA) development of a methodology (referred to as Regional Destinations) for identifying critical priority places in the agency’s service area. The primary idea behind the Regional Destinations methodology is to identify key destinations, agnostic of trip purpose so as to not overemphasize commute travel, that are critically important to access regardless of where a person lives in the region. Additionally, this methodology was built to emphasize equity and explicitly to capture and prioritize travel made by low-income people and people of color. More information about the philosophy behind the measure can be found in the discussion by Gartsman et al. ( 10 ). This method was specifically designed in the context of the MBTA’s Bus Network Redesign, but is broadly applicable to other medium- to long-range planning processes for all modes of transportation and beyond.
Data
To identify priority places in the region without relying exclusively on one data source, the Regional Destinations process utilized a combination of Census data, travel data, and survey data.
Geographic Unit of Analysis
Identifying a standard geographic unit of analysis establishes what size area will count as a priority place for decision making. For the Regional Destinations process, we chose to use Bus Analysis Zones (BAZs), a custom geography comprised of groupings of Census block groups within municipal boundaries. Each BAZ is roughly one-half mile in area, although many block groups alone become larger than this toward the edges of the service area. One-half mile is often used in transit planning as the approximate coverage area of a single bus or rail stop ( 25 ); as such, a BAZ is meant to represent an area served by a transit stop for planning purposes. The exact square mileage of each BAZ was calculated using ArcGIS for density assessments. The MBTA bus service area is comprised of 831 BAZ geographies encompassing 51 municipalities and approximately 560 square miles in the Greater Boston region.
Census Data
Data on jobs and employment comes from the Longitudinal Employer-Household Dynamics (LEHD) program within the U.S. Census Bureau. LEHD Origin-Destination Employment Statistics (LODES) Workplace Area Characteristics data contains the total number of jobs in each Census block, which can be aggregated up to the BAZ level to calculate employment density. Estimates for 2018 were the most recent available during the methodology development for this study. Population density was calculated using block group-level population data from American Community Survey (ACS) 2015–2019 five-year estimates.
Travel Data
To set a universe of travel, data on travel in the region for this methodology is location-based services (LBS) data from StreetLight Data, which aggregates “pings” from cellphones into trips and assigns each trip to a mode. We intentionally used travel from all modes (vehicle, transit, bicycle, pedestrian) to explore trip-making beyond transit riders. Trips and connections made by transit riders are inherently limited by the scope of the transit network; incorporating non-fixed-route bicycle, pedestrian, and especially vehicle trips offers an understanding of the full breadth of travel in the region. This is true for this inherently transit-focused process, but also applies to any transportation planning process—capturing travel on all modes gives a more complete universe of potential trips to be served by the mode in question.
Using the custom BAZ geographies, we used StreetLight to pull origins and destinations for trips on each mode in the bus service area, to produce a dataset of the total number of trips between every pairing of geographies in a given time period. Each of these origin–destination pairs also has associated trip type and demographic information, including the percentage of trips assumed to be made by low-income people and people of color, and the percentage of trips with each trip purpose: home-based work, home-based other, and non-home-based. Demographics in StreetLight are assigned based on the Census demographics of a device’s “home” block group, estimated by StreetLight’s algorithm using the device’s travel patterns and typical overnight location ( 26 ). This means that the percentage likelihood of a device belonging to a person in an income bracket or a race/ethnicity group is assigned to the device and its associated trips, then aggregated to the origin–destination level ( 26 ). These demographics were further processed using ACS 2015–2019 five-year estimates to align with MBTA Title VI definitions of minority as non-white and/or Hispanic, which StreetLight Data reports separately.
While LBS data is fairly comprehensive in capturing travel by many modes, it is not perfectly representative of all travelers in the region. Seniors have relatively low representation because of their lower smartphone usage ( 27 ), meaning their travel patterns may be underrepresented in LBS datasets. To correct for this, survey outreach specifically oversampled seniors to ensure their travel patterns were accurately reflected in the final methodology.
Survey Data
Because a key use case for the Regional Destinations process was the MBTA’s Bus Network Redesign project, survey data was primarily collected through the MBTA’s Bus Network Redesign Travel Survey, available online or by phone from June 14 to August 8, 2021. The survey had two online versions: a map-based interactive version and an accessible text-based version. Among other things, the survey asked participants to consider which types of places in the Greater Boston area were important for all residents of the region to be able to access. All participants were given a list of roughly 22 destinations independent of home location (developed from the first iteration of the methodology described below), provided with checkboxes to confirm places with which they agreed and a text box to submit places they felt were missing. Participants taking the survey over the phone received a random list of approximately one-third of the destinations to accommodate time constraints. All survey versions collected demographic information encompassing age, race and ethnicity, gender, income, and self-identified disability.
The survey was available on the MBTA website for its duration, and engagement events such as public meetings and street teams directed participants to the survey to give input. Seniors were oversampled through events in partnership with the Massachusetts Senior Action Council, in which staff often led participants through the survey and recorded their responses. In total, the survey received about 1,700 responses, which were weighted based on respondents’ residential areas.
Methods
Initial Data Processing
The indicators used to assess locations’“regional importance” were based on the travel and density characteristics we expected such places to have: a relatively high volume of total travel to the place, high geographic dispersion of origins from which travelers come (i.e., travel from many places, not high volumes from only a few places), and higher densities of residents and commerce. This translated into five key evaluation variables, with the first three each calculated separately for travel by all people, people in low-income households, and people of color:
Total trips, or the number of total average daily trips to a destination from all origins, intended to measure the total travel demand to a destination;
Minimum trips per origin, or the number of average daily trips between an origin and a destination required for the origin to contribute to a destination’s unique origin count, intended to ensure a meaningful amount of travel between places;
Unique origins, or the number of unique origins with a meaningful amount of average daily travel to a given destination, intended to measure the dispersion or geographic diversity of travel;
Population density, or the number of people per square mile of the destination geography, intended to measure the “gravitational pull” of the location as it pertains to residents living in the area; and
Employment density, or the number of jobs per square mile of the destination geography, intended to measure the “gravitational pull” of the location as it pertains to both employment and commerce in the area.
To process the BAZ-level travel demand dataset from StreetLight and create the variables for analysis, we selected summary travel data for all days of the week and all times of day and excluded trips within the same geography. Trips were combined and aggregated to the origin–destination level for average daily trips per origin to a destination. The total number of average daily trips and the number of unique origins were then aggregated to the destination level. For density information, total population from ACS estimates and total jobs from LEHD LODES estimates were aggregated to the BAZ level and divided by the total area of each BAZ geography, calculated as the combined area of its contained block groups.
To create the same variables for travel by equity groups, we first used the trip demographics associated with the travel demand data to calculate the total trips per origin–destination–time period made by people in low-income households and people of color, calculated as the percent of trips made by travelers in each group multiplied by the total number of trips on all modes. The same aggregations produced versions of each trip-related variable for travelers in low-income households and travelers of color. The overall travel variables, equity variables, and density variables were joined together to create a master table of destination characteristics for filtering. Of the 831 BAZs in the bus service area, 827 had enough travel (at least one origin with at least 10 average daily trips) from all three traveler groups to be entered into the master destinations table.
Importantly, no trips were filtered out based on trip purpose characteristics, ensuring the explicit inclusion of all types of trips. While home-based work commutes, for example, are important in shaping regional travel patterns, non-work and non-home-based trips are equally if not more crucial to identifying priority places and should not be discounted. Indeed, only 16.4% of average daily trips in the MBTA bus service area in Fall 2019 were home-based work travel, while 44.0% were home-based non-work trips, and 39.6% were non-home-based. Using travel demand from all days and times, not only weekdays or peak-hour periods, falls under this same ethos of including all travel rather than primarily work-related travel.
Survey Outreach
Though the primary platform for Regional Destinations survey feedback was the online Bus Network Redesign Travel Survey in summer 2021, generating the initial checkbox list of options relied on input received from an earlier survey of riders in the MBTA’s Monthly Customer Opinion Panel in October 2020.
MBTA Customer Opinion Panel, 2020
Initial investigations into regional destinations began in summer 2020 when the COVID-19 pandemic had already drastically altered regional travel patterns. Exploratory versions of the methodology used pre-pandemic 2018 and 2019 data, while actual travel happening at the current time looked very different—instead of highlighting the prominence of downtown Boston and travel hubs, travel demand from StreetLight during summer 2020 spotlighted destination geographies that contained major hospitals, grocery stores, and other services, often in more suburban areas outside of the urban core. Because the period of travel used affected the destinations with the highest trip volumes and dispersion, we sought an initial outreach opportunity to clarify public thinking around important places during the pandemic. As such, monthly participants in the MBTA Customer Opinion Panel were asked in October 2020 to identify the types of destinations that should be regional destinations from a list including top travel destinations for both periods of time.
Respondents overwhelmingly identified destinations that were more consistent with pre-pandemic travel than summer 2020 pandemic travel, indicating that people’s opinions about priority places in the region had not fundamentally changed with pandemic-related changes in travel, which were perhaps viewed as temporary. The top tier of destinations, indicated by a natural break in the data, coincides with destinations that have majority support (Figure 1). Interest in suburban destinations was found to be concentrated in areas surrounding the destination rather than throughout the region, indicating that they are more comparable to local destinations from a planning perspective.
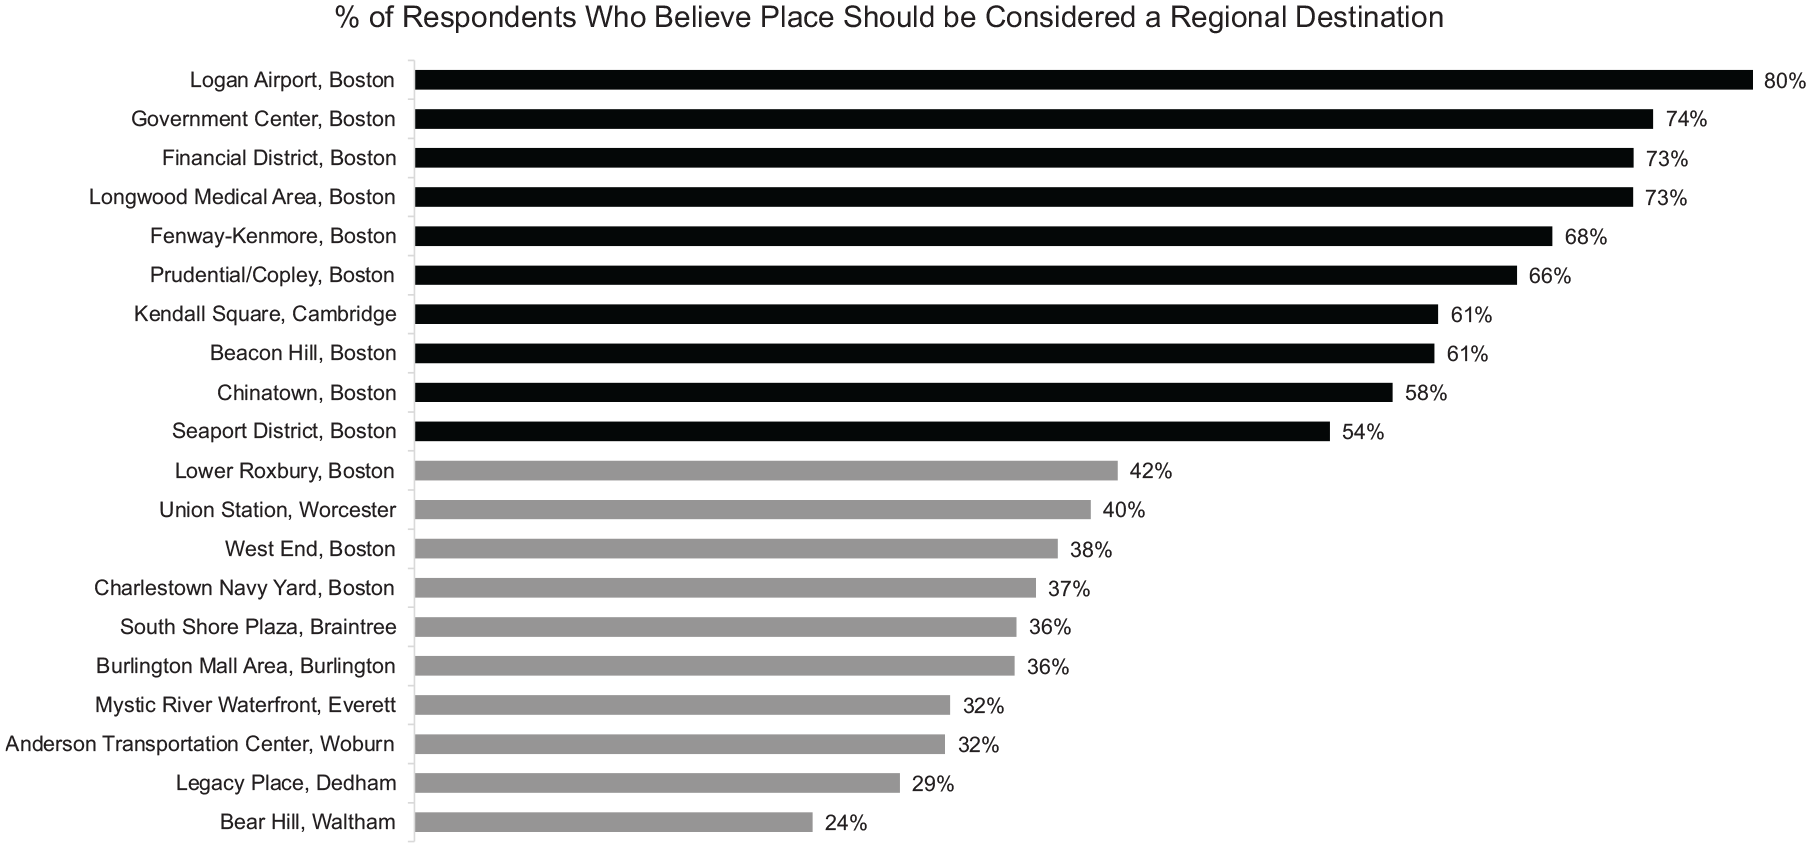
MBTA Customer Opinion Panel, October 2020, percent of respondents who believe place should be considered a regional destination (n = 623), tiers indicated by shade.
MBTA Bus Network Redesign Travel Survey, 2021
The confirmation of pre-pandemic regional destinations in the Customer Opinion Panel allowed for the creation of a base list of destinations for the wider-reaching Bus Network Redesign Travel Survey in summer 2021. The use of pre-pandemic Fall 2019 travel data for regional destinations was also consistent with the data used in the larger Bus Network Redesign project.
To further align the initial methodology with the panel survey feedback, we added population and employment density thresholds, which were set to exclude the densest suburban BAZ that respondents indicated did not represent a regional destination. The base list of destinations for the 2021 survey was assembled from the destinations with high total trip volumes and unique origins that met the density criteria, plus any additional destinations with high trip and origin counts for low-income travelers or travelers of color, and selected write-ins from the 2020 survey.
About halfway through the duration of the 2021 survey, the destination list was adjusted slightly by retiring three destinations with very low selection rates and adding five write-in destinations with geographically dispersed interest; through this, we could check public opinion about suggested destinations without presenting respondents with a significantly longer checkbox list. Many of the added write-ins were commercial districts of major residential neighborhoods in the urban core, such as Allston in Boston and Union Square in Somerville.
On the survey’s completion, subsequent analysis identified natural breaks in the percent of respondents who selected each destination that indicated three tiers of regional destination popularity (Figure 2). For destinations that were retired or added partway through, the percent of respondents reflects the percent of those for whom the destination was a given option.
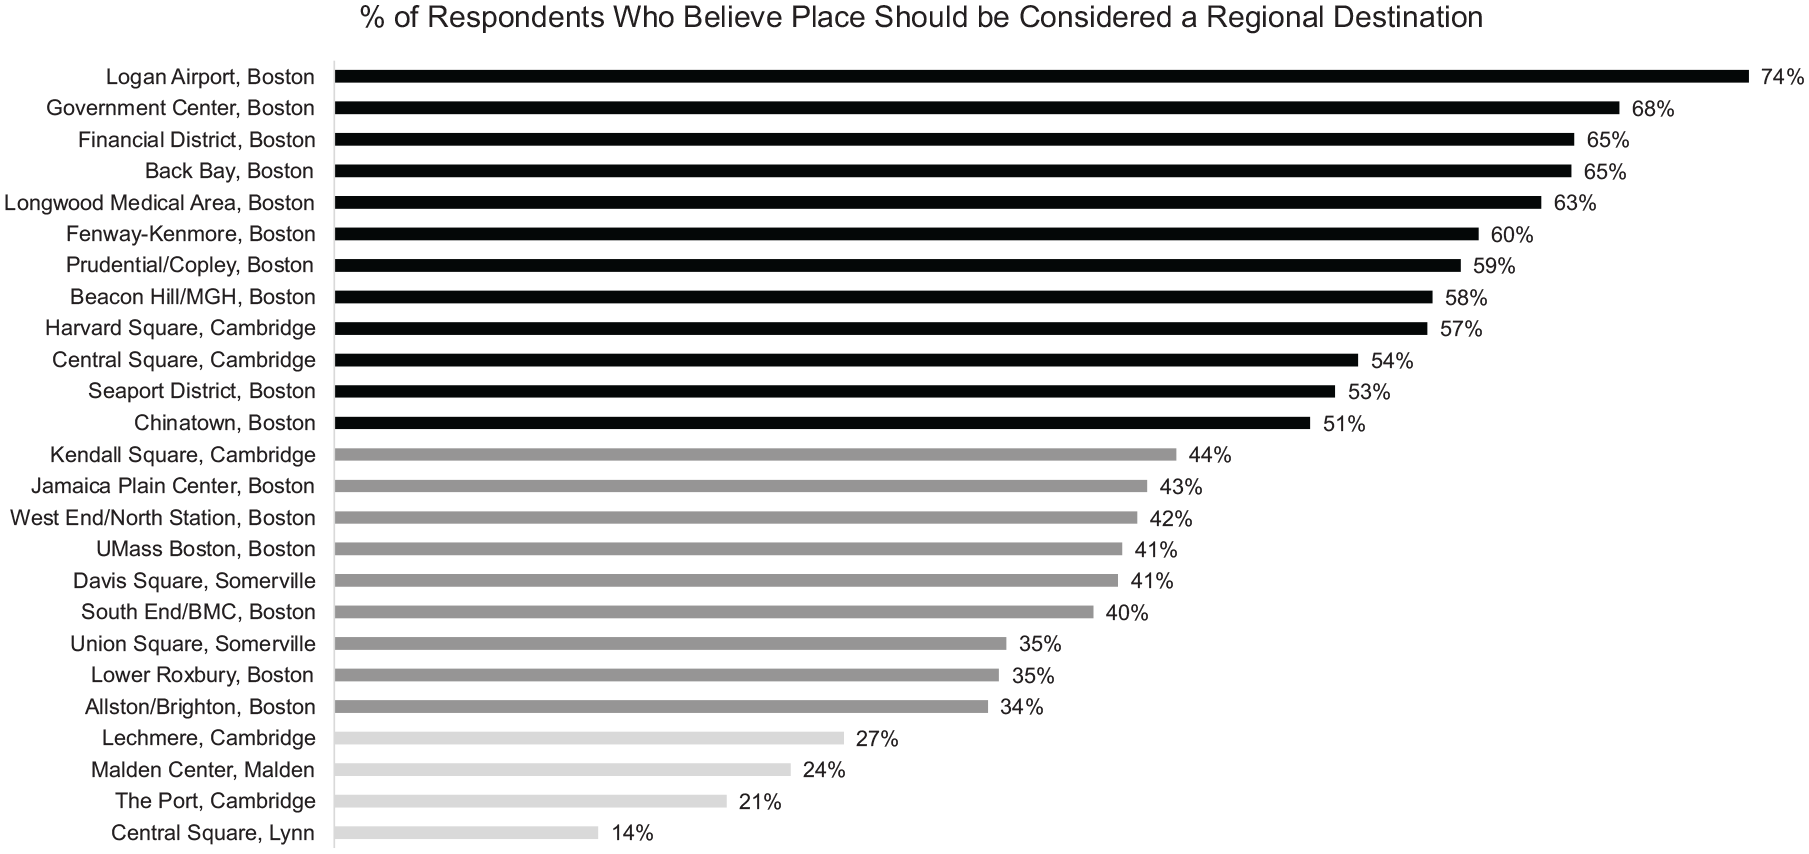
Bus Network Redesign Travel Survey, Summer 2021, percent of respondents who believe place should be considered a regional destination (n = 1,634), tiers indicated by shade.
The top tier of destinations consisted primarily of locations in downtown Boston—such as Government Center, the Financial District, and Boston Chinatown—and key business, travel, medical, and commerce destinations within the urban core—such as Logan International Airport, the Longwood Medical Area, the Fenway-Kenmore neighborhood, and Harvard Square in Cambridge. The top tier represented destinations that received more than 50% support from respondents. The middle tier of destinations (receiving support from more than 33% of respondents) consisted primarily of urban core mixed-use neighborhoods—including Jamaica Plain, Roxbury, and Allston in Boston, and Union Square and Davis Square in Somerville. The bottom tier primarily consisted of the destinations retired midway through the survey. These tiered results provided the basis for building a Regional Destinations methodology that reflected public opinion.
Seniors and people with disabilities, populations oversampled in the survey through targeted outreach, were most unique in exhibiting a demonstrable preference for regional destinations around hospitals—such as Tufts Medical Center near Chinatown and Boston Medical Center in the South End—confirming that connections to hospitals should be prioritized for equity reasons.
Matching Process
With key destinations identified through the public engagement process, we sought to create a final methodology aimed at identifying places that matched the characteristics of the places identified through outreach. Rather than simply accepting the outreach destinations as the final list, we used them as the basis for a replicable methodology. This ensured that similar destinations currently missing were identified, and that future destinations that arise with changes in the region can be identified in a way that reflects public opinion without repeating outreach every year.
The aim was to produce a methodology from the master destinations table that would replicate the list of outreach destinations as closely as possible—ideally including all of the top-tier destinations and many of the middle-tier destinations—without creating too long a list that could dilute the significance of identifying critical places. Rather than attempt the arduous process of tweaking the thresholds of each trip and density variable individually and assessing the resulting destination lists, a sampling process was utilized that would iterate each variable’s threshold independently through a wide range of values and assess the resulting lists of destinations produced by each combination of thresholds.
The four variables involved in the sampling process were total trips per destination, unique origins per destination, trips per origin, and employment density. Employment density was included, and population density excluded, based on survey observations in which respondents tended to select locations with relatively higher concentrations of businesses (e.g., Government Center in Boston) over locations with only high residential density (e.g., the Port area in Cambridge). Additionally, the location identified as regionally important by the largest proportion of respondents was Logan Airport, which has very low population density.
Importantly, each of the travel-related sampling variables was identified for three different sets of travel demand in the region: travel by all people, by people in low-income households, and by people of color. The threshold selection process was applied to all three sets of travel demand, meaning that, for example, a qualifying destination is required to meet the same thresholds of total trips and unique origins for all three traveler groups. Because the sets of travel demand for people in low-income households and people of color inherently have lower total trip volumes and origin counts, by nature of being subsets of all travel, those volumes serve as limiting factors. The methodology thus fits the final list of priority places to travel by equity groups. By extension, changes in future lists of regional destinations will be driven by changes in travel by people in low-income households and people of color, making equity central to the determination of priority places.
Sampling ranges were determined for each of the variables starting from thresholds used in previous versions of the methodology and considering the value ranges for top-tier and middle-tier survey destinations. Step intervals were selected to maximize variation between the output lists without excessive duplication. The sampling parameters were ultimately chosen to generate as many distinct destination lists as possible within the limitations of the access to computing power for this study (Table 1).
Sampling Parameters for Identifying Regional Destination Thresholds to Reflect Survey Feedback
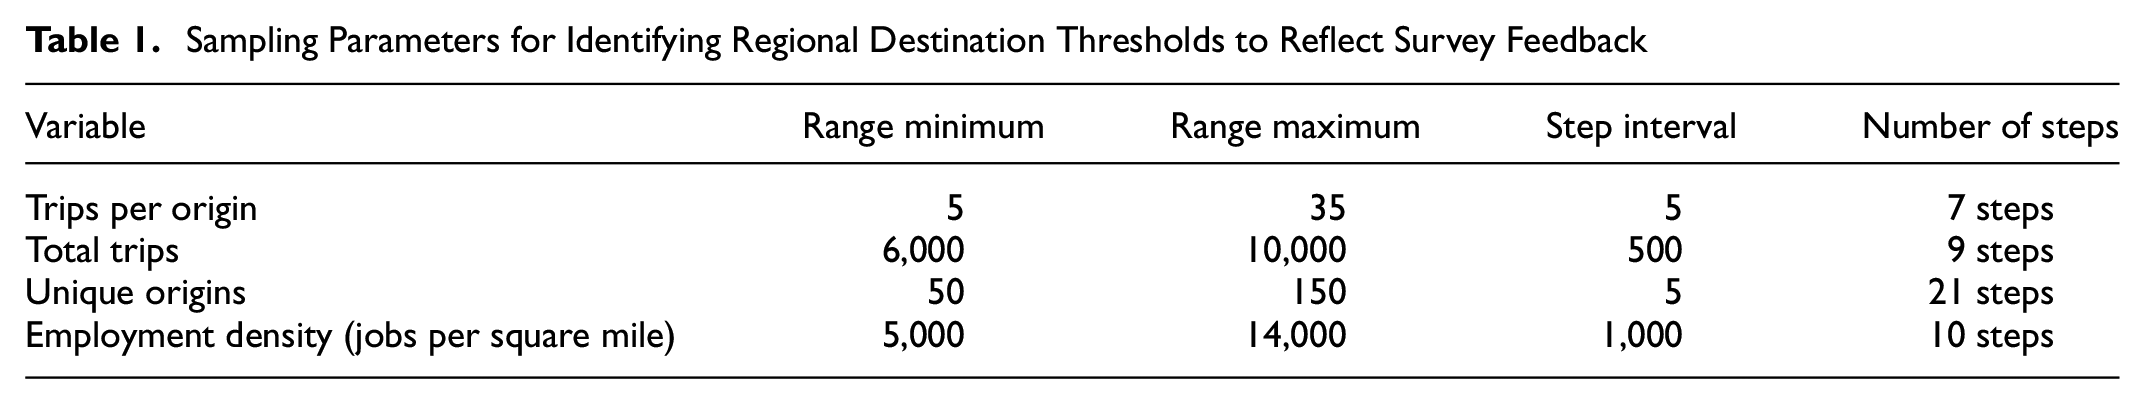
The numbers of steps per variable indicate the possibility of 13,230 output lists, though fewer than 1,000 unique lists were produced since many threshold combinations produced the same lists of destinations. The resulting unique destination lists were filtered to those with length not exceeding 22 locations to eliminate impractically long lists for regional planning, producing a total of fewer than 200 viable lists. From these, lists were filtered to those containing all of the top-tier destinations and at least a few of the middle-tier destinations from survey outreach, resulting in two final lists for selection.
The two most viable lists of destinations were identical except for two additional places in the longer list: the southern portion of Allston, the central commerce district of a dense neighborhood in Boston, and Assembly Square in Somerville, an emerging employment and shopping center. Based on the former destination’s position in the middle outreach tier, and the instinct of staff that the latter destination was newly regionally important, the longer list was selected, having 22 total destinations. This final list for Fall 2019 travel included all of the top-tier destinations and over half of the middle-tier destinations from survey outreach, plus five other locations, including two from the bottom tier. Because 23 distinct combinations of thresholds produced the same well-matched list of destinations, the most restrictive set of thresholds that produced the destination list was chosen.
Final Methodology
The final challenge was that a methodology that uses absolute numeric thresholds for fluctuating variables, like total trips, is inflexible to changes in total travel volumes that may occur, say, in the event of a global pandemic. Indeed, applying the absolute thresholds to travel demand in 2021 resulted in a list of only four regional destinations.
Because the goal was to develop a methodology that highlighted the most important regional places for transportation planning, even in years of lower overall travel, this study converted the absolute thresholds for total trips, unique origins, and employment density into percentiles for replicability in future years to produce lists of similar length despite changes in total travel volumes. Using the Fall 2019 data, each threshold was converted to its relative percentile of the 827 BAZ geographies with substantial travel, such that the qualifying “X” total trips became the qualifying top “Y” percent of geographies when ordered by total trips. The trips per origin threshold was kept at a constant numeric value to capture only meaningful travel volumes.
The final thresholds used to filter regional destinations were applied separately to travel by all people, by people in low-income households, and by people of color (Table 2). The more selective percent thresholds for equity groups reflect the application of the same absolute thresholds across all three sets of travel.
Final Thresholds for Selecting Regional Destinations Using Fall 2019 Travel Demand
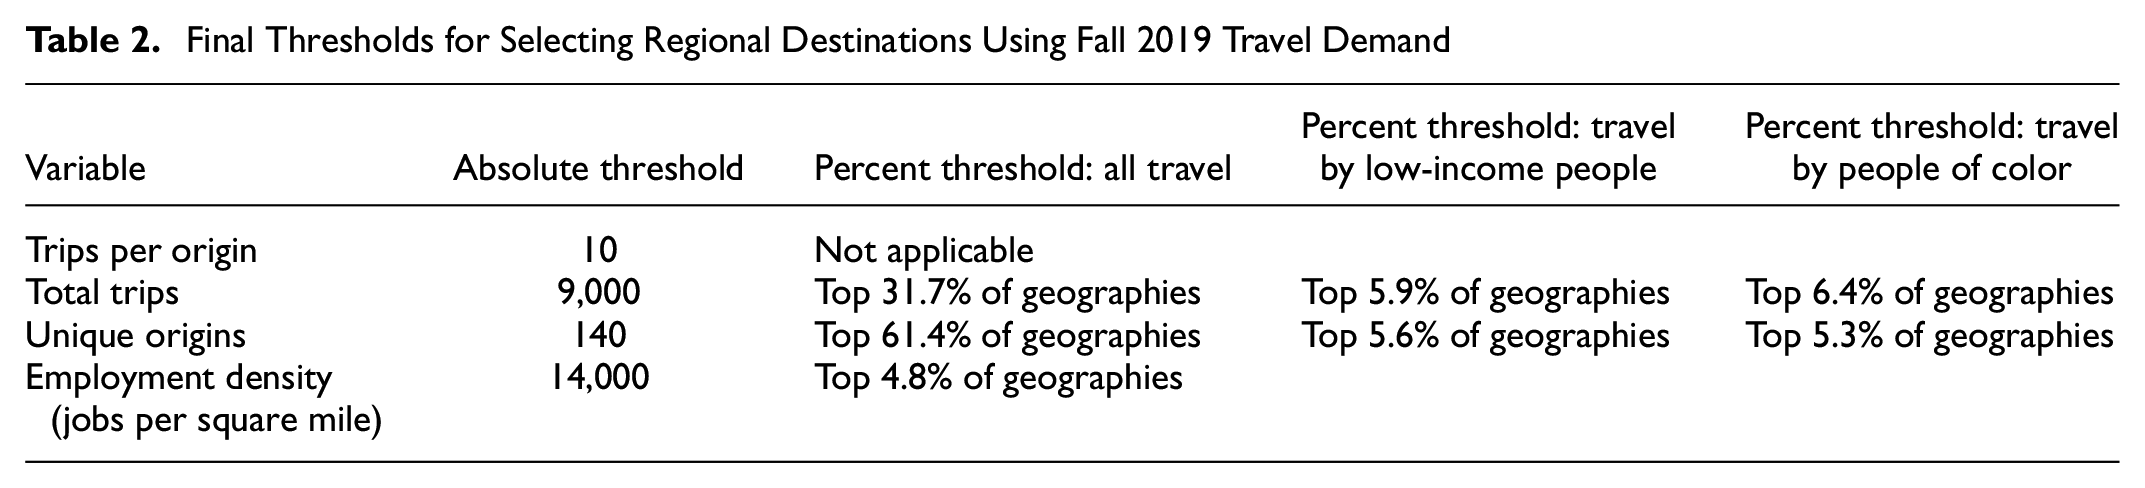
As shown by the percentage thresholds, regional destination selection is primarily determined by travel volumes of people in equity groups, geographic dispersion of travel by people in equity groups, and employment density. The only exception to these final criteria is the Logan Airport BAZ which—by nature of its boundary—does not meet the employment density threshold because of its large physical area. However, because Logan Airport was identified as the top regional destination by survey respondents and holds a unique position as the primary international airport in the region, the final methodology grants an employment density exception for Logan Airport.
Results
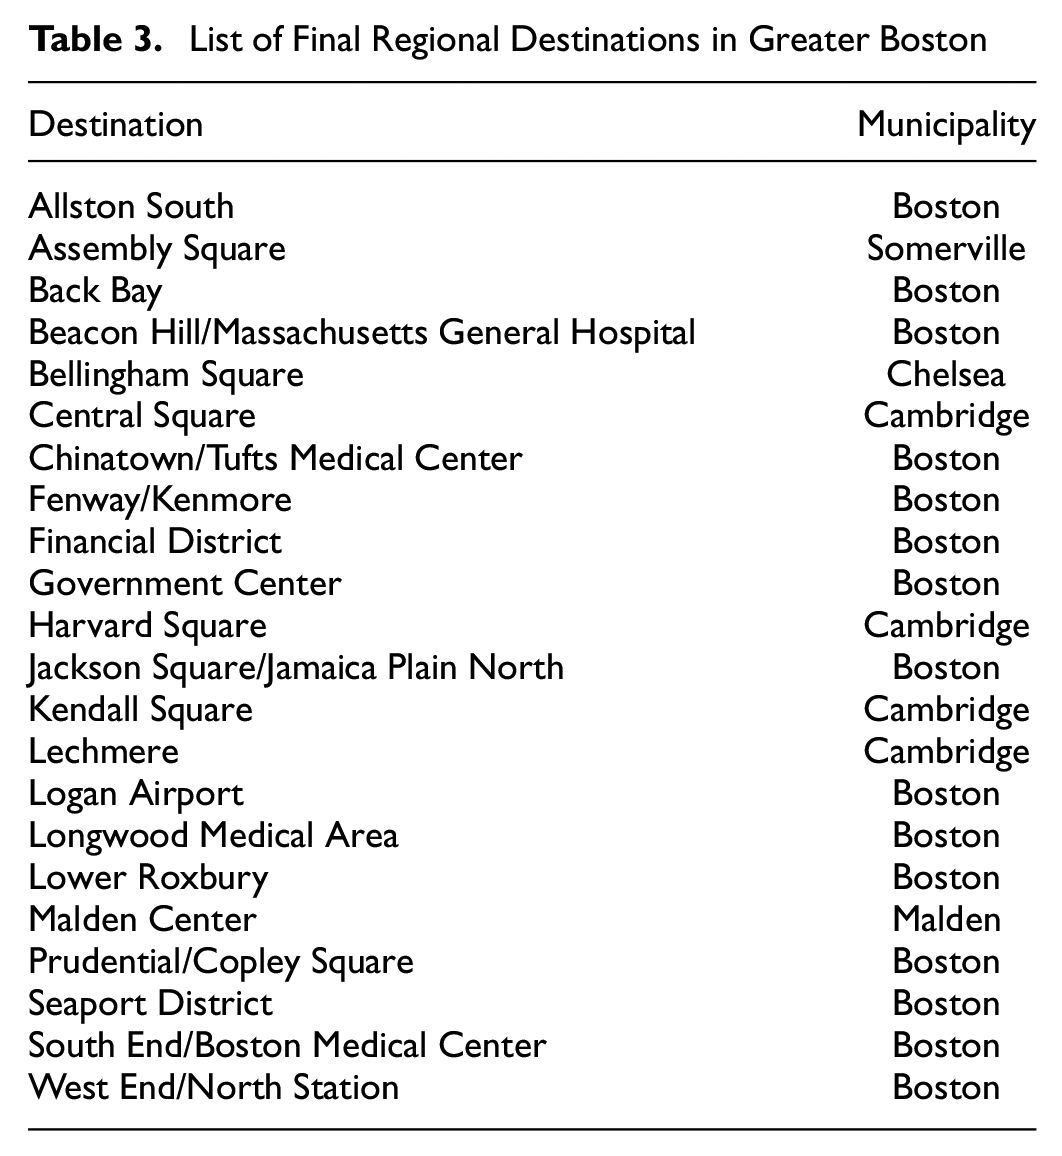
The final list of regional destinations with Fall 2019 data consisted of 22 places. The list included locations in downtown Boston, such as Government Center, the Financial District, and Back Bay/Copley Square; areas with major hospitals, including Longwood Medical Area and Beacon Hill; major travel hubs like Logan Airport; popular mixed commerce and residential destinations like the Fenway neighborhood and Central Square in Cambridge; emerging employment centers, such as Kendall Square and the Seaport district; and the commerce hubs of major residential areas, such as Lower Roxbury, Allston South, Bellingham Square in Chelsea, and Malden Center (Table 3; Figure 3).
List of Final Regional Destinations in Greater Boston
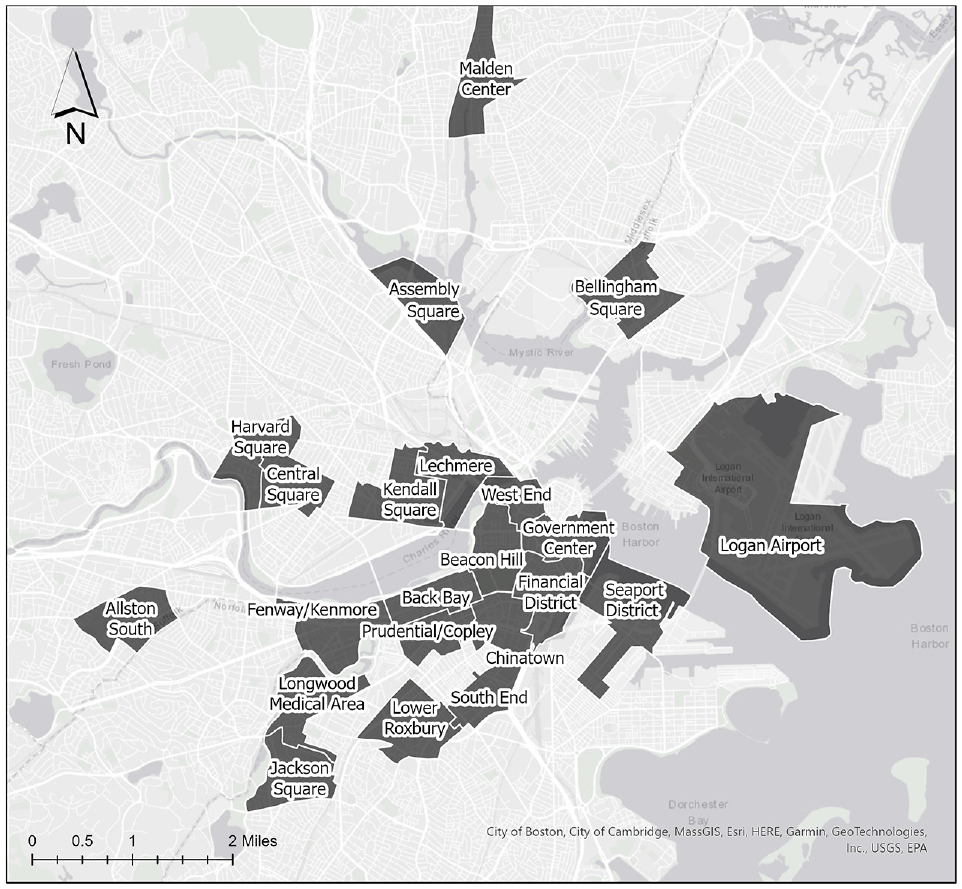
Map of final regional destinations in the Greater Boston region.
The same methodology run with Fall 2021 travel demand data produces a very similar list of 19 destinations, excluding three destinations in Cambridge and Allston in Boston, and adding the Symphony area of Boston. This change reflects the stability of downtown core destinations as regional destinations, with greater fluctuation in locations with higher proportions of student, tourist, or recreational travel.
A case study for the results of the MBTA’s Regional Destinations process was in the initial evaluation of the draft network map for the Bus Network Redesign. While the new bus network was not explicitly designed to serve this set of regional destinations (instead, it was designed based on equity-weighted travel demand), the regional destinations were the basis for a Regional Access measure ( 10 ); this evaluated the quality of the proposed new transit network compared with the existing network by measuring the percent of residents in the region who can access regional destinations with a competitive transit option. Initial evaluations showed increases in the percent of residents with quality transit access to destinations like Longwood Medical Area and Fenway/Kenmore, indicating improvements in the transit network’s ability to serve priority places in the region.
Discussion
Equity
This Regional Destinations approach led to the creation of a methodology that better emphasized equity in selecting priority places for planning. The initial consideration of travel by all people, people in low-income households, and people of color ensured that equity was not an afterthought but a central part of the methodology. Additionally, by applying the same absolute thresholds to all three sets of travel when the latter two have significantly smaller travel volumes, the methodology is effectively fitted to travel by equity groups. Changes in travel by people in low-income households and people of color will drive future changes in the list of priority places. This aligns with agency values around prioritizing equity and the people in the region most likely to rely on transit services.
To assess the value of incorporating equity travel into the methodology, we compared the final destination list with one of the same length produced exclusively using employment density. The latter version excludes many of the commercial districts of residential neighborhoods included in the former list, particularly those with high proportions of low-income residents and residents of color, such as Jackson Square in Boston, Malden Center, and Bellingham Square in Chelsea. Instead, the solely employment density-based methodology includes destinations such as Harvard Business School in Boston and an office park in north Quincy, locations that indeed have high job density but would not be considered priority places for transit planning from an equity lens. This confirms the value of incorporating and prioritizing travel by people in equity groups in determining critical regional places.
Replicability
One of the main benefits of this approach is replicability. For an agency, this means consistent inputs into all planning projects without needing to perform the same outreach multiple times per year. This replicability was particularly important during the COVID-19 pandemic, when travel patterns were changing quickly. The methodology can be rerun after the pandemic as new travel data become available, and new outreach can be done when regions believe they have entered a more static “new normal” and people’s understanding of travel has changed to reflect new travel patterns, as opposed to old habits that have lingered in a region’s collective memory.
More Meaningful Outreach
Frequently, public outreach starts with a “blank slate” approach, where community members are asked to report generally what matters to them or problems they have with the transportation network. These types of open-ended questions can be difficult for respondents to answer and difficult for transportation agencies to incorporate effectively. They can also lead to fatigue when people are asked repeatedly for feedback on many projects (e.g., Dillman et al. [ 19 ] and Andrews [ 28 ]). Creating a replicable methodology not only meaningfully incorporates feedback, but also minimizes repetition experienced by respondents. Instead of asking about new destinations regularly, outreach only needs to be done periodically to check that assumptions around how people perceive the “gravitational pull” of destinations have not changed—and if they have, the methodology can be updated.
In the short term, incorporating outreach into the methodology rather than using the results of outreach directly provides a check that the representativeness of participants will not artificially limit the list of priority places by allowing for the inclusion of other destinations with similar characteristics. In the long term, this process will help to minimize how often the public needs to be asked the same set of questions, because the methodology can recognize new travel patterns from updated data while still reflecting public opinion about the types of places that are important. This leaves more energy for the project-specific questions that cannot be answered outside of the constraints of an individual project. After a broad outreach effort has been performed once, subsequent outreach efforts can be more targeted toward edge cases or outlier groups, since the produced methodology should remain robust in the absence of large-scale shifts in travel needs and behavior (e.g., a pandemic).
Areas for Future Improvement and Research
This methodology has worked well for the MBTA, particularly as a part of the Bus Network Redesign, but certainly has room for improvement.
First, LBS is a relatively new data source, and companies are continuously improving the quality of the data as they improve processing and modal assignment. As the source data continues to theoretically improve, this methodology also will—particularly in places that have high levels of bicycle and pedestrian travel, the modes that often suffer the most from data quality issues because of a lack of counter data for calibration. There may be challenges with LBS data in the future as data privacy policy changes from major smartphone developers may make it more difficult for aggregators to access location data. If data privacy issues make LBS unviable, this methodology would still work with a large-scale household travel survey or a travel demand model, but may be less trustworthy since such data sources do not currently paint as full a picture of travel in a region.
Additionally, while this methodology works for the Boston region, it would be wise to test it in regions with different land-use and travel characteristics, both in the U.S. and internationally. Similarly, the methodology has only been recently developed and has not yet been tested over the long term as public opinion evolves. While it was developed to adapt to changes in both travel patterns and public opinion, this has only been tested with short-run changes, and only over time will we have confirmation that the method is truly robust.
Lastly, this information can be used in performance measures to understand access to priority places, but these results should rarely be used alone. They capture a particular type of travel by flagging destinations that are broadly important to a region; however, local travel should also be considered by planners. While some neighborhood destinations may not be critical for crosstown trips, such as the neighborhood grocery store or elementary school, they are critical for residents and should be considered separately ( 10 ). Other measures may also be important to include depending on the individual planning project’s objective.
Conclusion
This process was developed to standardize the way that the MBTA identified priority places in the service area, and was built with replicability in mind as travel patterns changed during the COVID-19 pandemic. Overall, this method has improved the integration of equity into the process of identifying priority hubs for regional transportation networks. It will also have a significant impact on the way the MBTA should carry out public outreach for planning projects in the future—leveraging the energy for public outreach into project-specific questions as opposed to repetitive outreach that makes the public less engaged. Outside of the methodology itself, the key takeaway from this research process was that from an outreach effort, the most impactful output is a replicable, validated methodology, as opposed to a single-use list of priorities.
Footnotes
Acknowledgements
We would like to thank the Bus Network Redesign team, especially Scott Hamwey, Laurel Paget-Seekins, and Caroline Vanasse. A big acknowledgment to the staff that supported this work, including Heather Bhowmick, Karl Meakin, Joaquin Osio-Norgaard, Ian Thistle, and Sophia Olivieri.
Author Contributions
The authors confirm contribution to the paper as follows: study conception and design: A. Gartsman, A. Zimmer; data collection: M. Reginald, J. Horiuchi; analysis and interpretation of results: J. Horiuchi, M. Reginald, C. D. Martinez, D. Limprevil, C. Brown; draft manuscript preparation: J. Horiuchi, A. Zimmer, C. Brown. All authors reviewed the results and approved the final version of the manuscript.
Declaration of Conflicting Interests
The author(s) declared no potential conflicts of interest with respect to the research, authorship, and/or publication of this article.
Funding
The author(s) received no financial support for the research, authorship, and/or publication of this article.