
Abstract
Transportation research has focused on gaining a better understanding of how the need to travel is influenced by one’s social capital and relates to participation in various leisure activities. This study postulated that increased participation frequency of social-oriented leisure activities is an expressive outcome and thus mostly affected by expressive resources of social capital. To explore the impacts of social capital on leisure activity behavior—particularly the participation frequency—a refined survey was designed to obtain an extensive collection of leisure activities, social capital measures, as well as mobility and sociodemographic characteristics. The survey included questions to ascertain individuals’ instrumental and expressive social capital through position, resource, and generalized name generators. The 20 activities that were most reported by the survey respondents were examined using a zero-inflated ordered probit model with correlated error terms. Respondents with greater expressive resources participated in social leisure activities more frequently than those with fewer expressive resources. However, this relationship did not hold for the activities of drinking and socializing, attending church, or dining out. In contrast, instrumental social capital had mixed effects (i.e., positive, negative, or insignificant) in relation to the participation frequency of social activities.
Transportation has recently become an umbrella name that encompasses research relating to human behavior, health, as well as human interactions with the built environment and with each other. In the end, the need to travel is dictated by the need to participate in activities such as employment, entertainment, and to interact with one’s formal and informal social networks. Recently there has been an increased focus on gaining a better understanding of social capital’s influence on participation in various leisure activities ( 1 ). Because activity-oriented methodological advancement has gained considerable attention in the field of travel behavior ( 2 ), an increased focus on leisure activities has been observed ( 3 , 4 ).
Carrasco and Miller found that social network characteristics, including the number of its members, composition, and their relative location, help to explain social activity travel generation ( 5 ). As the literature suggests, in addition to the issue of simultaneously studying the activity type, its timing, and duration, social activity travel can also be studied from the perspective of social capital and social networks ( 6 – 8 ). Because combining social sciences and human interactions in the context of travel behavior has been a rapidly evolving field, there has been increased interest in exploring the nature and frequency of leisure activities.
Maness argued that social capital essentially captures the value of social networks, whereas social networks enable individuals to perform actions that could not be performed individually ( 9 ). The individuality of an activity becomes an important factor while studying leisure activities with respect to the relationship between social capital and activity types or frequencies. Sadri et al. analyzed the characteristics of individuals’ strong ties on joint trip frequency for different activity types ( 10 ), whereas Maness expanded on this and concluded that the size of an individual’s core network (strong ties) positively affects the frequency of leisure activity participation ( 11 ).
Strong ties and accessible resources are measures of “expressive resources,” defined as a form of social capital that helps individuals strengthen their social connections. “Instrumental resources,” another form of social capital, are defined as the new resources that one can reach for to attain profit or influential gain. Thus, an increase in participation frequency in a particular leisure activity is hypothesized as the capitalization of expressive rather than instrumental resources.
This study examined the effects of social capital on the frequency of leisure activity participation. It was hypothesized that leisure activity frequency is an expressive outcome of social capital, which is used by people to maintain and strengthen their social connections. This research proposed three questions to test the impact of these two forms of social capital on leisure activity participation frequency outcomes:
Do individuals with higher levels of expressive resources participate in particular activities more often than others with lower levels of expressive resources?
Are the activities that are performed more frequently by individuals with higher expressive resources more social in nature?
Do instrumental resources have no effect on activity frequency for social activities?
This study aimed to answer these questions using data gathered from a self-administered web-based survey designed specifically to test differences in social capital and identify its relevance in a leisure activity context. This paper first conceptualizes activity frequency as expressive outcomes of social capital, which is followed by a literature review, descriptions of the data collection process and the methodology, and, lastly, the estimation results and conclusions are presented.
Conceptualization of Activity Frequency as Expressive Outcomes of Social Capital
The concept of social capital describes how individuals acquire beneficial assets and services through social interactions. Häuberer’s scheme ( 12 ) expands on Lin’s theory ( 6 ) and provides causal relationships between preconditions, social capital, and outcomes (Figure 1). Individuals are preconditioned in a societal context and have access to individually owned resources and assets. Access to social resources is mobilized through social networks and their structural properties. Smaller, denser networks help to maintain social connections and promote continued access to group resources through trust and reciprocation. This leads to more resources for expressive actions and, subsequently, capitalization of expressive outcomes. To operationalize Lin’s conception of social capital as socially embedded resources in an activity-travel context, activity behavior is described as outcomes (i.e., the returns of social capital). Lin classifies expressive outcomes as mental health, physical health, and life satisfaction ( 6 ). An increased frequency in leisure activities that are performed to maintain and strengthen social connections is hypothesized to be the capitalization of expressive resources rather than instrumental resources.
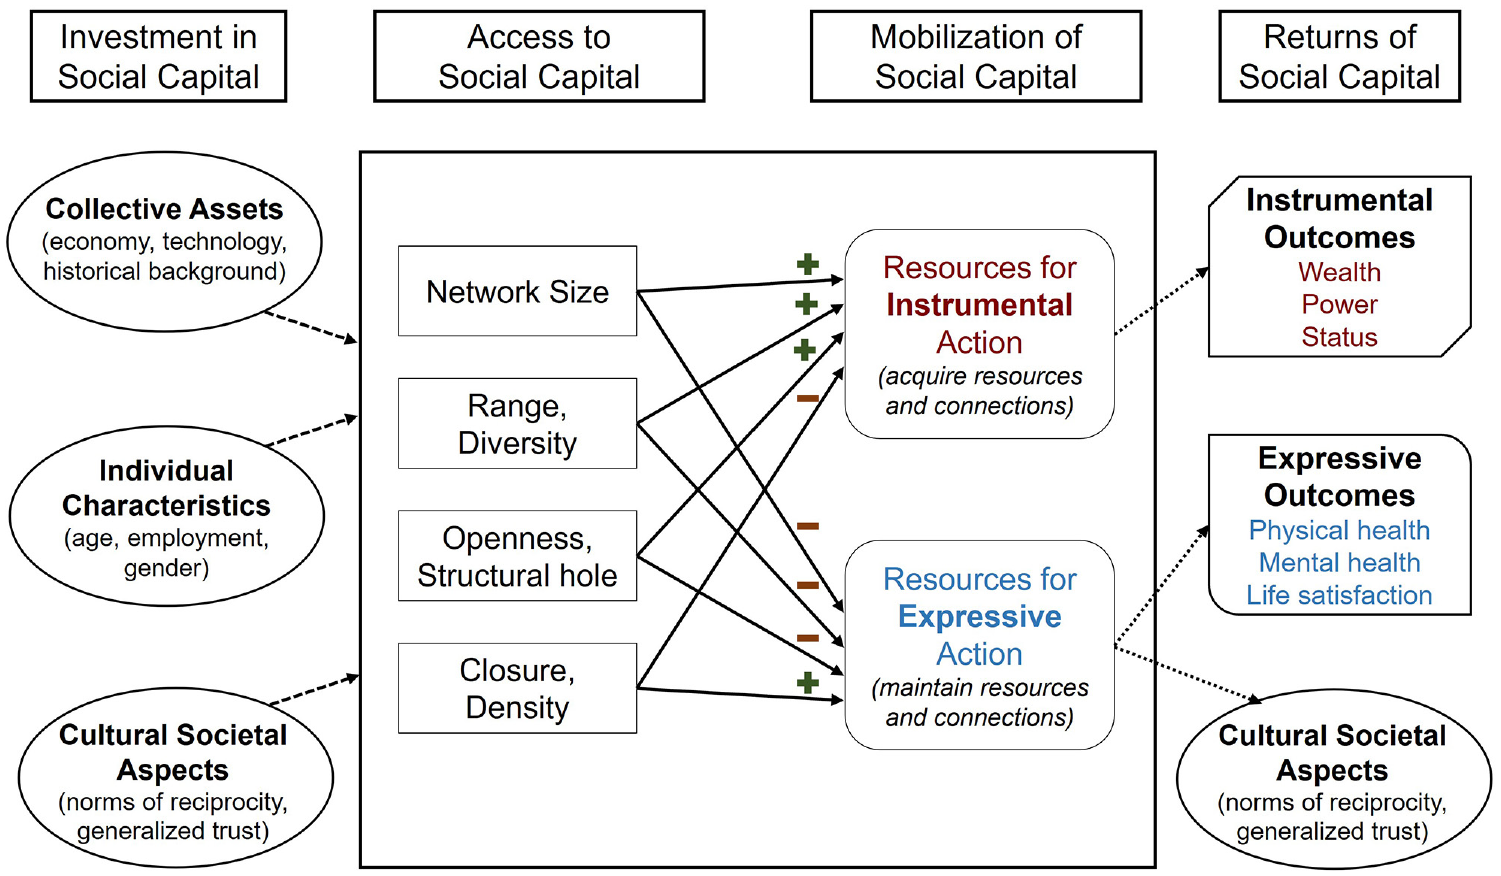
Conceptual diagram of social capital (adapted from Häuberer [ 12 ]).
Resources for expressive actions can provide expressive resources by aiding in maintaining social ties and building closer relations. Closer relations are built through trust and reciprocity, which are gained through shared participation ( 13 ). For those individuals with greater expressive resource access, more time must be devoted to an individual’s stronger ties, and this induces more frequent interaction with their strong ties. It could then be expected that people with greater access to expressive resources would have higher social leisure activity frequency than those with less access. Exploring the potential for social leisure activity frequency to be described as an expressive outcome was the focus of this study.
Hypotheses
This study explored three hypotheses on two dimensions of social capital’s impact on the leisure activity participation frequency outcome:
H1. Individuals with higher levels of expressive resources participate in particular activities more often than those with lower levels of expressive resources.
H2. The activities performed more frequently by individuals with higher expressive resources are more social in nature.
H3. Instrumental resources have no effect on increasing the activity frequency of social activities.
Literature Review
Taxonomy
Historically, the measurement of interests has focused on identifying vocational or occupational interests. The first interest inventories were developed in the early 1900s ( 14 ). Although the field of study of human professional and leisure preferences dates back over a century, the more direct attention and growth of knowledge in the area of social capital, leisure activities, and their broader consequences are rather new. Warde et al. stated that there is a lack of theoretical clarity about how informal recreational practices generate social engagement and participation ( 15 ). They found clear evidence that people’s personal networks make a significant difference in their informal sociability.
As the study of leisure activity has evolved, focus has been placed on classification of specific leisure activities. However, because leisure activities can be grouped by different driving parameters, there is no clear consensus among researchers on how to categorize them. Tinsley and Eldredge designed a taxonomy of leisure activities based on their need-gratifying properties from the Paragraphs About Leisure (PAL) scale ( 16 ). This PAL scale was developed to distinguish the 11 psychological benefits that can be acquired from 82 leisure activities. Based on participant ratings, each leisure activity has varying scores in relation to the psychological needs for exertion, affiliation, enhancement, self-expression, nurturance, compensation, sensibility, conscientiousness, status, challenge, and hedonism. As stated in the current research’s second hypothesis on the frequency of leisure activities that are social in nature, the affiliation score range (described in research by Tinsley and Eldredge as the fulfillment of the need to be around others in an enjoyable and cooperative setting rather than to be alone [ 16 ]) was employed in this study to classify the level of sociability of each activity.
Leisure Activity Frequency and Social Capital in Transportation
Akar et al. argued that, from a transportation point of view, it is critical to find the attributes of activities that make them unique, as they may have significant impacts on travel ( 17 ). For instance, the location and duration of the activity could be key determinants of related transportation patterns. Akar et al. found that gender had significant effects on activity choice: female respondents were more likely to participate in out-of-home preplanned leisure activities and leisure activities that were flexible in time and space ( 17 ). Older adults who were at least 55 years old were found to be more likely to participate in in-home leisure activities that were fixed in time, planned in advance, or as part of a routine. Younger individuals were more likely to participate in all groups of leisure activities as compared to the base case: in-home leisure, planned in advance, or as part of a routine. With the focus on identifying the social network attributes that influence the decision to perform out-of-home nonwork activities with families or friends, Lin and Wang observed a significant goodness-of-fit improvement when including measures on network size and sources of emotional, instrumental resources ( 8 ).
Participation in leisure activities was also found to be reflected and determined by personality traits ( 18 ), which extends previous findings on the reciprocal links between personality traits and leisure interests and engagements ( 19 ). Tilahun and Li ( 20 ) found correlations between the face-to-face meeting frequency of strong ties and an individual's age and gender (and their differences between individuals and their strong ties). Consequently, beyond personality and sociodemographics, social capital's role in the motivational perspective including leisure interests needs to be considered in a comprehensive model. Glover and Hemingway ( 21 ) mention limited research using Bourdieu's resource perspective of social capital in leisure research. This perspective looks at how social ties enable access to resources which can be used for purposive action. Compared to the bonding and brokerage views of social capital, the authors opine the resource conception of leisure to be the “the most theoretically sound of the three views” (p. 390).
Maness combined the theories of strong and weak ties and social capital with travel behavior and identified different impacts across individual, household, and social network characteristics ( 9 ). Independent variables such as level of education or relationship status were found to play a role in leisure activity frequency. Age, gender, and race were statistically significant. The same author also found support for the hypothesis of weak tie diversity increasing activity frequency, however, the model provided weak support for the hypothesis that the number of strong ties increased activity frequency.
Influence of Social Network Characteristics on Social Activity Participation
Carrasco and Miller explicitly asked respondents about the frequency of performing social activities such as hosting, visiting, or dining out ( 5 ). They observed an increase in social activity frequency for individuals with closer ties, a higher number of disconnected subgroups in the network, and more direct connections among the network members.
After accounting for individual and household characteristics in Poisson regression, Van den Berg et al. observed a larger effect of very strong ties compared with reasonably strong ties in generating more face-to-face social interactions ( 7 ). While examining structured leisure activities related to clubs or volunteer organizations, Van den Berg et al. found endogenous effects between greater numbers of social ties and club memberships or more frequent volunteering activity ( 22 ).
Gathering evidence of the linkage between social networks and activity generation, Kim et al. reviewed transportation studies that analyzed the impacts of individuals’ social network characteristics on the frequency of or propensity for social activity participation across three measures and concluded the following relationships ( 23 ):
Network size: more frequent activity participation was associated with larger networks;
Relationship type: no clear consensus owing to varying methodologies and classifications; and
Tie strength: higher social activity frequency was generated by stronger ties.
Parady et al. surveyed the number of leisure activities undertaken by respondents over the 2 weeks immediately before the survey to derive a leisure propensity construct based on leisure shopping, eating out, and other leisure activity frequency ( 24 ). Using multilevel structural models, their study found direct, positive effects of the Japanese respondents’ network size, club membership, income, and urbanization level on leisure propensity.
Data Collection
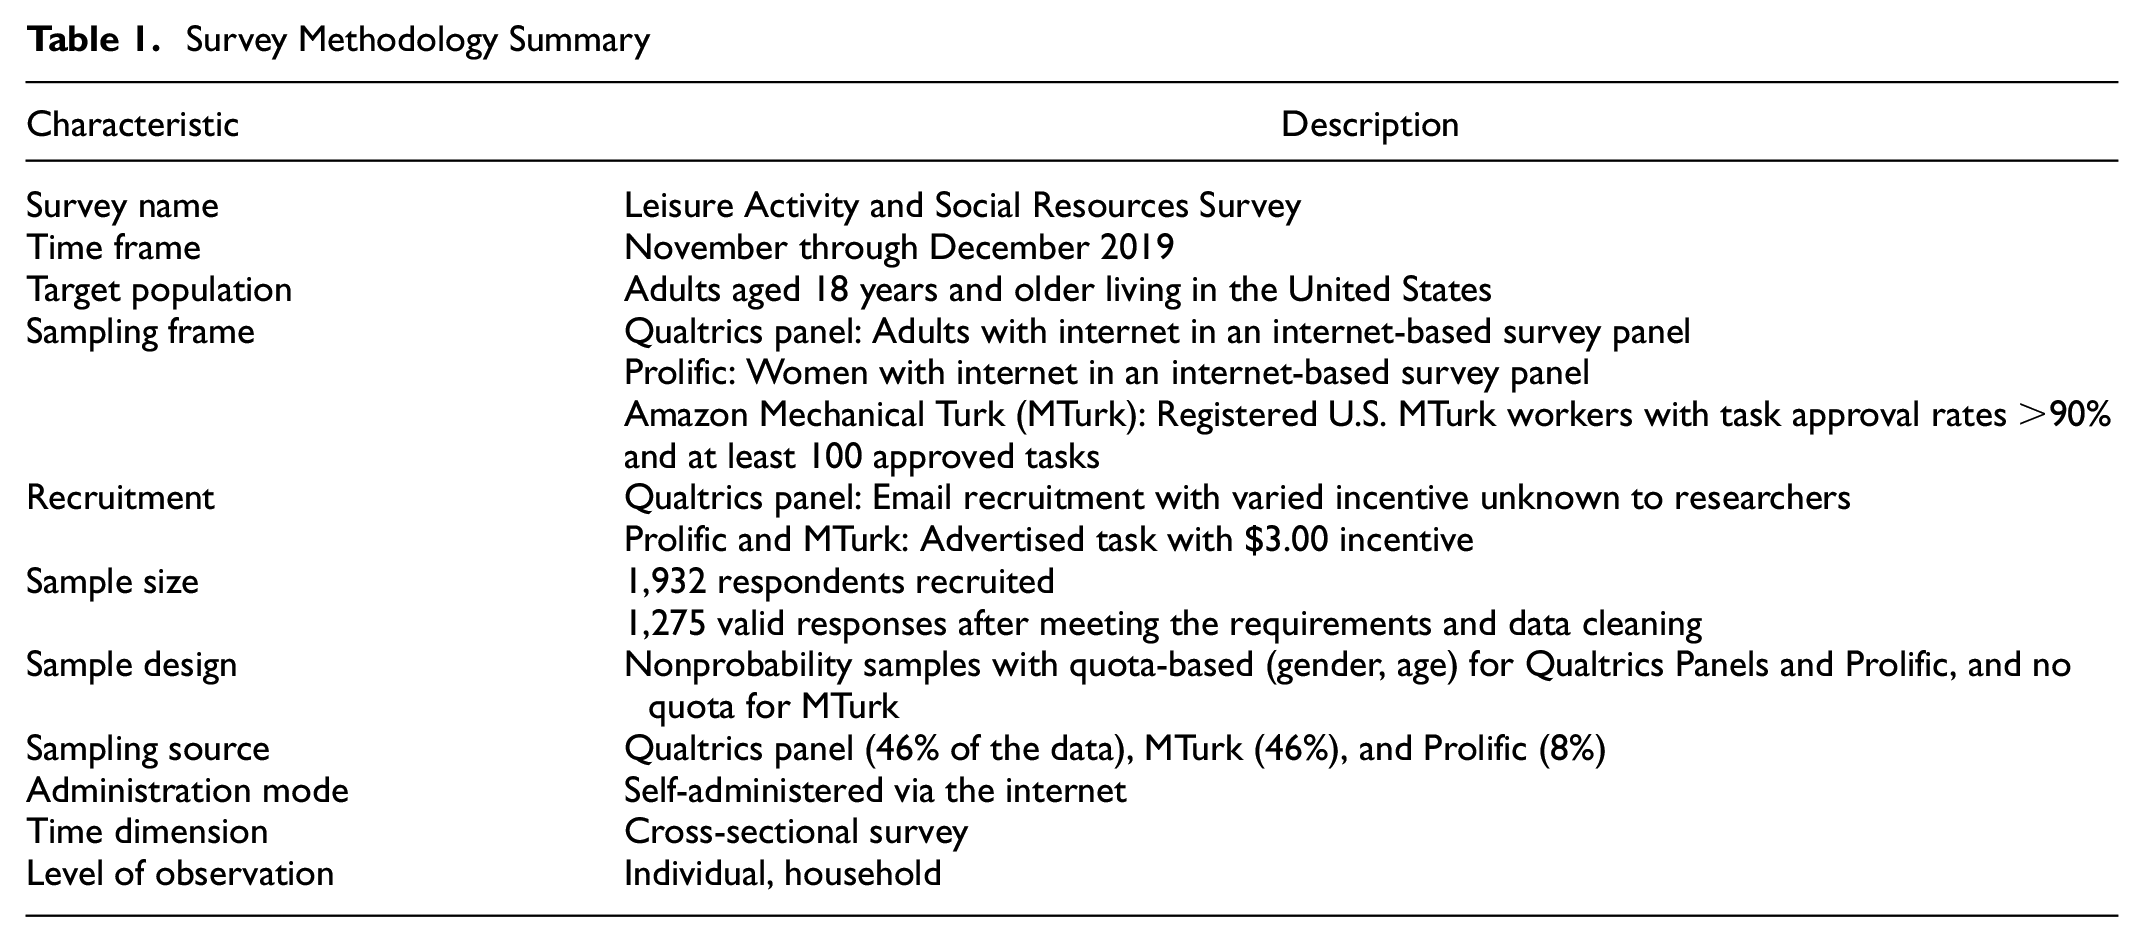
Data for this study were collected in November and December of 2019. The survey methodology (summarized in Table 1) consisted of sections on activity space, social capital, mobility/accessibility, and individual and household characteristics. The activity space section of the survey asked about leisure activity variety and frequency, household mandatory and maintenance activities, and work and school demands.
Survey Methodology Summary
Respondent Characteristics
Data cleaning to remove low-quality responses that were incomplete for most questions or failed the survey’s two attention checks was carried out. Descriptive statistics for the remaining 1,275 survey respondents are provided in Table 2.
Sample Descriptive Statistics
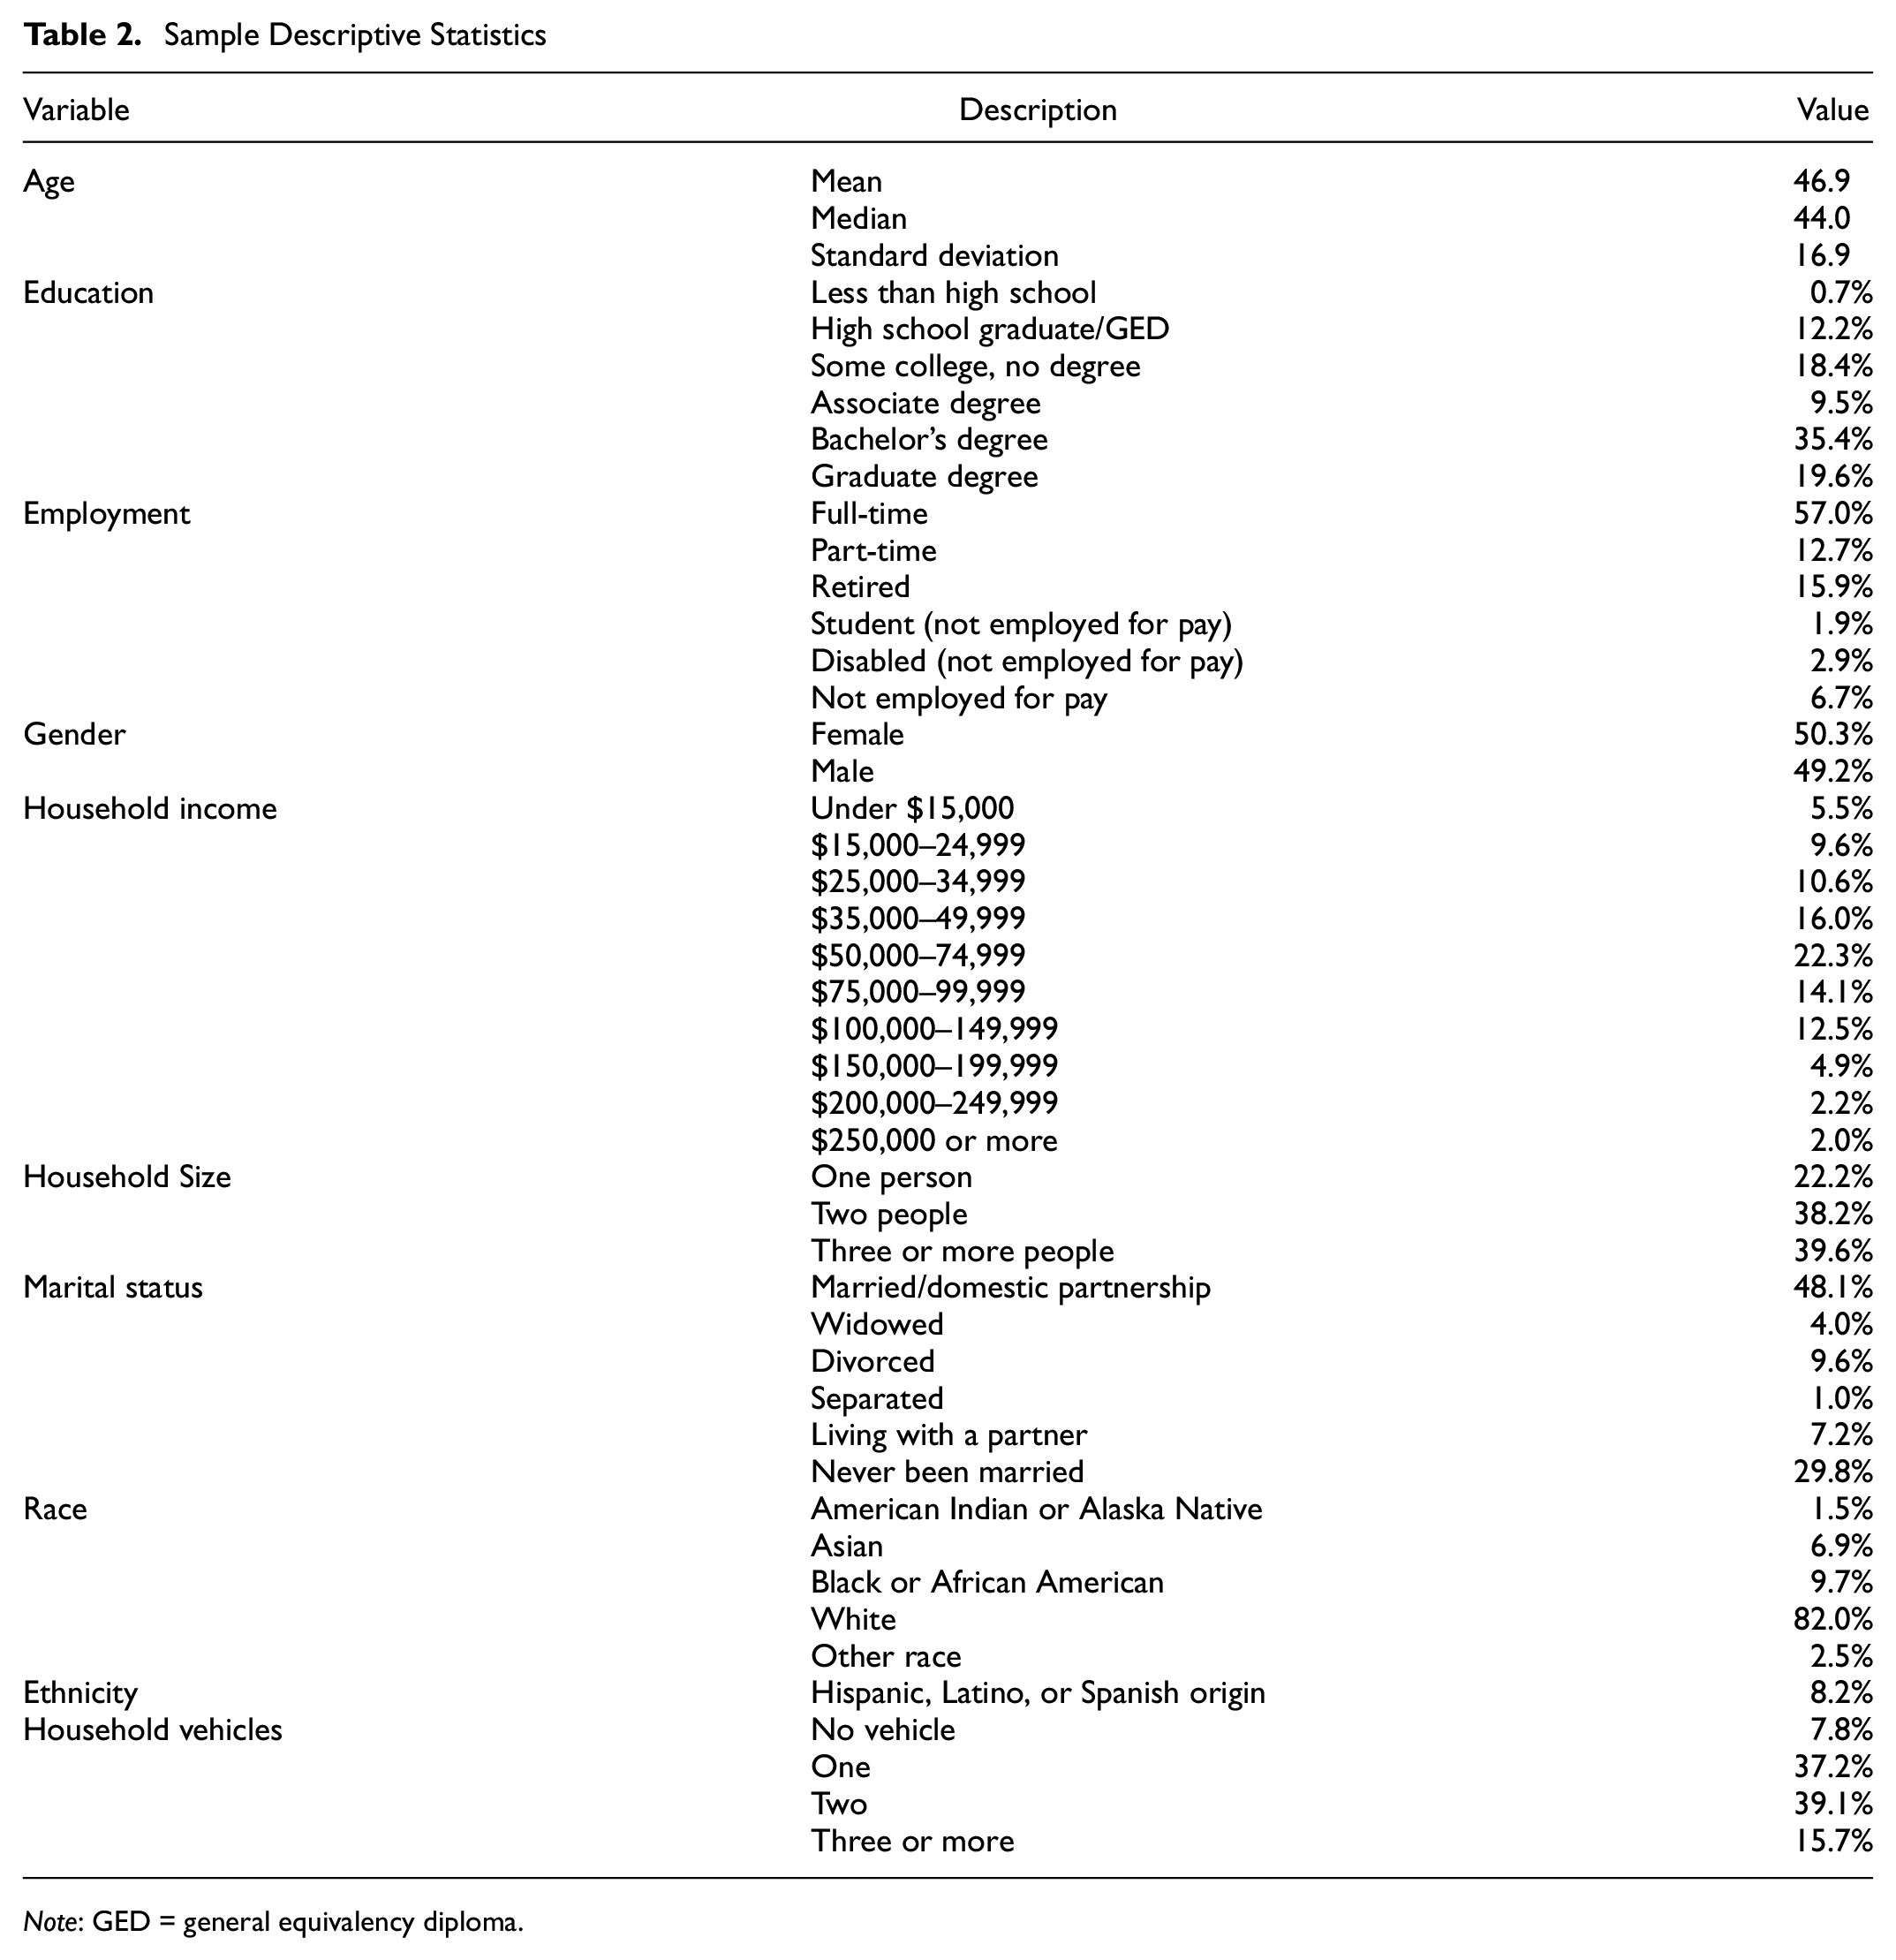
Note: GED = general equivalency diploma.
Leisure Activity Frequency
The main objective of the study was to gain insights into the frequency of leisure activity participation and its impact on social capital, the survey was therefore specifically designed to collect the participation frequency data.
Survey respondents were presented with a list of 86 leisure activities from which to select activities in response to the question, “Which of the following activities have you performed over the last three (3) months?” The list was adopted from the study by Tinsley and Eldredge ( 16 ), however, only 77 of their 82 activities were used because arcade games, collecting bottles, shortwave radio listening, volunteering for crisis intervention, and watching television were excluded owing to being outdated, dependent on specific crisis events, or overabundant. Nine additional leisure activities were added including attending festivals and parades, board gaming, driving for pleasure, gambling, gardening in community gardens, softball, singing karaoke, video games, and visiting amusement/theme parks. Activities that were similar such as hiking and backpacking were placed next to each other in the list for clarification.
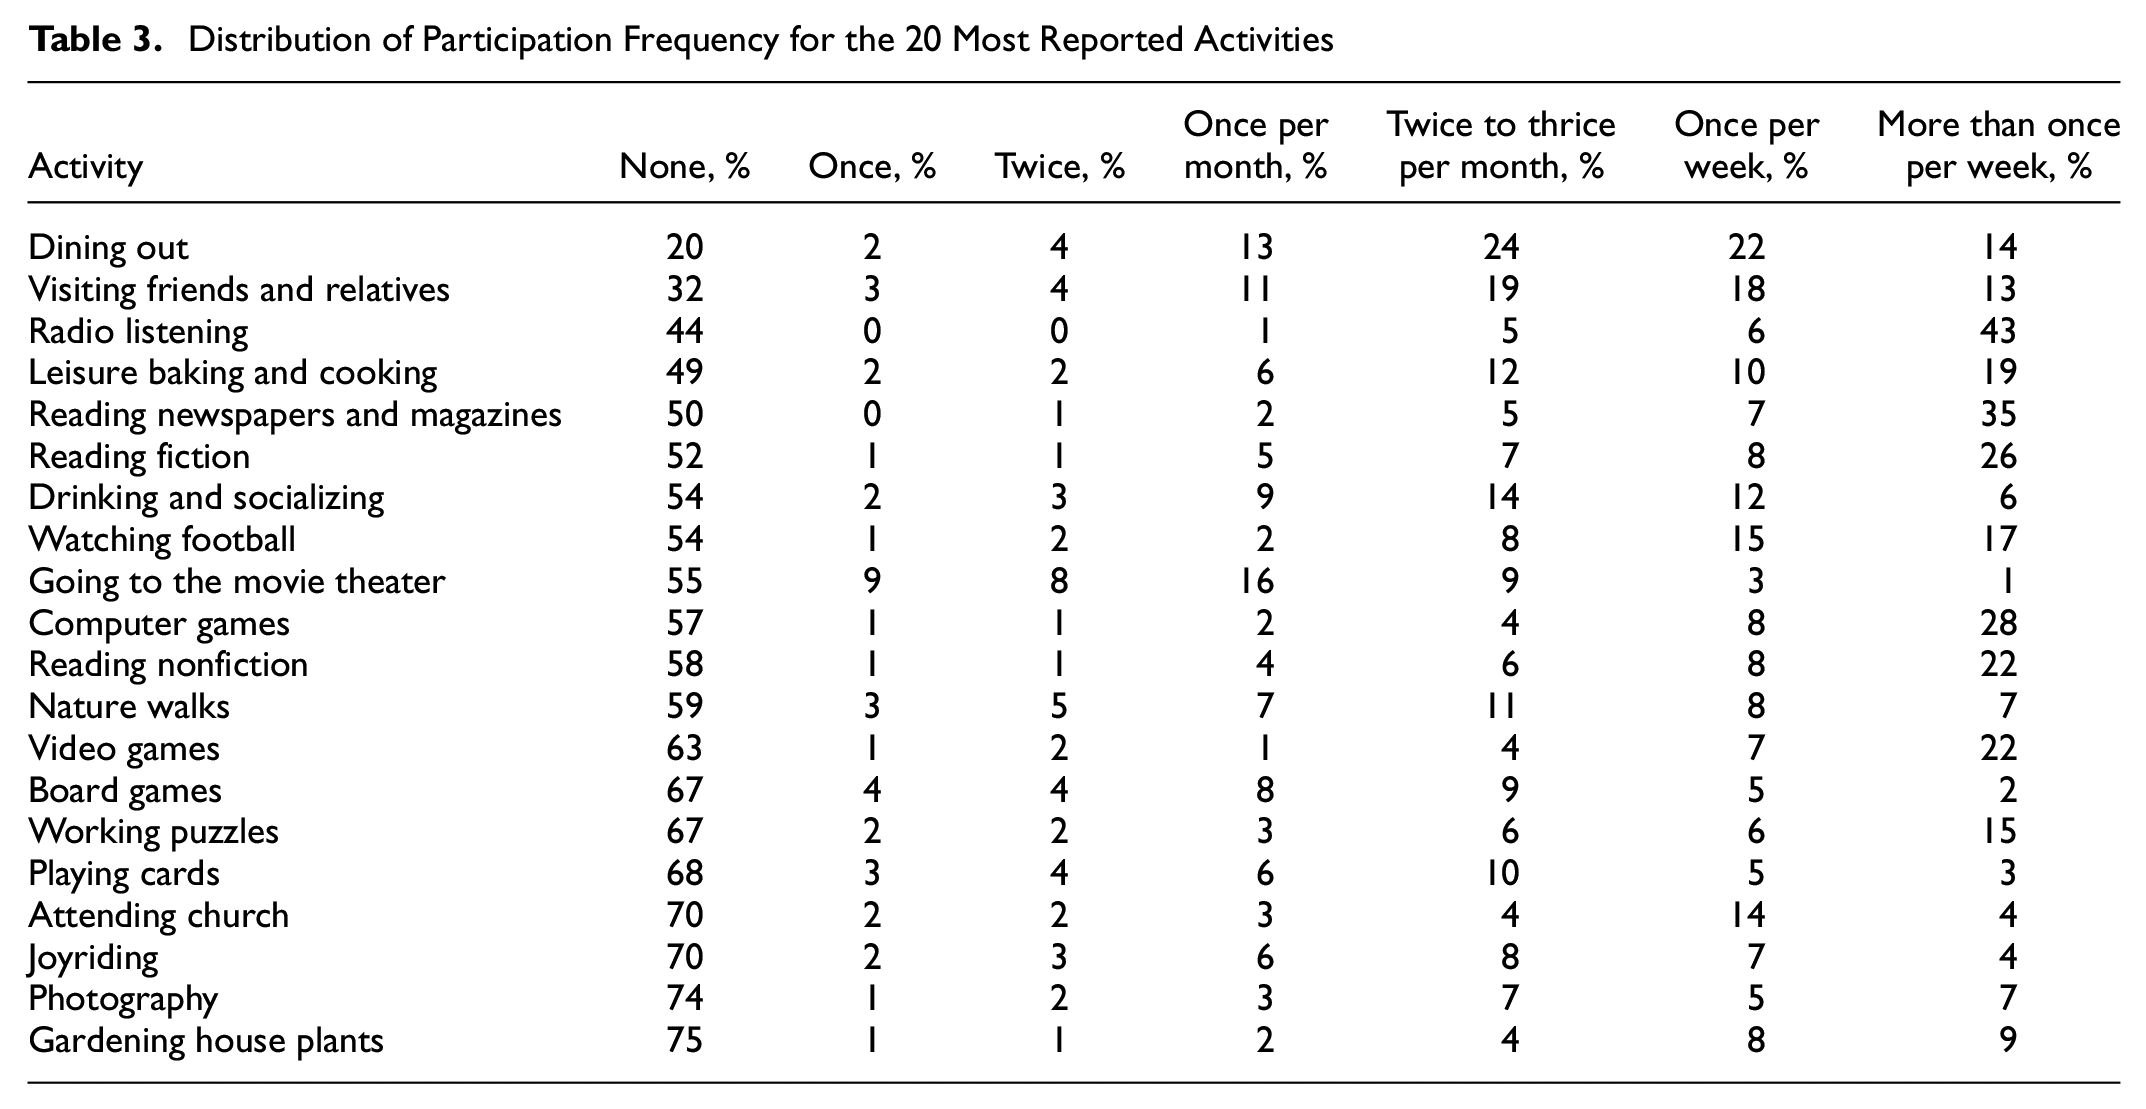
The survey respondents were then asked to indicate their participation frequency for each of the selected activities over the last 3 months according to the following six choice categories: once, twice, once per month, 2 to 3 times per month, once per week, or more than once per week. As the participation frequency was specific to each activity (e.g., a respondent answered that they dined out more than once a week, and visited friends and relatives twice), Table 3 summarizes the participation frequency distribution for the top 20 respondent-reported activities.
Distribution of Participation Frequency for the 20 Most Reported Activities
Social Capital Measures
In addition to activity variety and frequency, social capital was measured through expressive and instrumental resource constructs. These two constructs were subsequently used as explanatory variables in the hierarchical models.
Expressive Resources
To measure the availability of resources that individuals can access through their social network, the following seven-item resource generator (proposed by Joye et al. [ 25 ]) was included in the questionnaire:
Practical resources
a. Help you for a household or a garden job that you can’t do yourself
b. Help you around the house if you were sick and had to stay in bed for a few days
c. Look after you if you were seriously ill
Emotional resources
d. Be there if you felt a bit down or depressed and wanted to talk
e. Give you advice on family problems
f. Make you feel appreciated for who you really are
g. Be there if you just wanted to talk about your day.
Surveyed respondents were advised: “This section is about who you would turn to for help, if you needed it, in different situations. For each situation, please choose who you would turn to first for help. (If there are several people you are equally likely to turn to, please choose the one who you feel is closest to you.)” Joye et al. defined three dimensions of social support that could be offered by immediate family, wider family members, a close friend, a neighbor, “someone I work with,” other friend or acquaintance, or no one ( 25 ). Each resource can be offered or accessible in a nonlinear order. For example, the order of accessible members when one wants to get help with a difficult garden job can decrease monotonically from close family members to no one, but close family and friends would be more important to provide emotional support than other family members, colleagues, or a neighbor. Because the strength of support varies across different social network members for each social resource, the rankings for social network members were ordered based on Joye et al.’s rescaled values ( 25 ).
To further account for the emotional support provided by an individual’s core network size, respondents were asked, “From time to time, most people discuss important matters with other people. Looking back over the last 3 months, think about the people with whom you discussed matters that are important to you. How many people were you able to recall?” This core network size (counted as the number of people with whom they discussed important matters over the last 3 months) was a generalized version of Burt’s name generator in the General Social Survey ( 26 ).
After each resource was ordered by the social network member’s level of support, a confirmatory factor analysis for categorical variables for the aforementioned seven-item resource generator was utilized to obtain two latent variables of expressive resources as follows:
Practical resources = 1.00a + 1.22b + 1.16c
Emotional resources = 1.00d + 1.02e + 1.20f + 0.92g
Subsequently, the expressive resources offered by the social network were computed based on the two latent dimensions of social support and the core network size using second-order confirmatory factor analysis as follows:
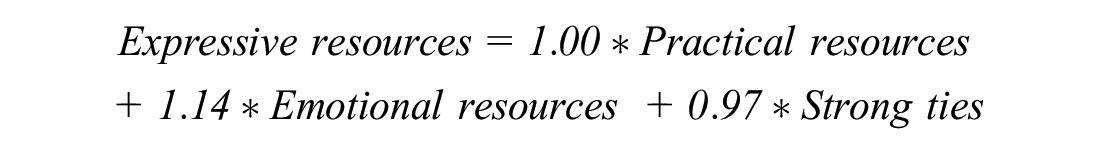
Instrumental Resources
To maintain comparability with the 2009 Pew Internet Personal Networks and Community Survey described in Hampton et al. ( 27 ), a list of 22 occupations for the position generator was applied in this study to measure access to instrumental social resources. Respondents were asked to indicate whether they personally knew someone (a relative, friend, or acquaintance) on a first-name basis with a particular occupation. Each occupation was also given a prestige score determined by the Standard International Occupational Prestige Scale. This score was later used to calculate the occupations’ prestige/status ( 28 ). The list of 22 occupations is reported in decreasing order of prestige score (in parentheses) but were presented to respondents in a random order:
Professor (78),
Lawyer (73),
Chief executive officer (70),
Congressman or congresswoman (64),
Production manager (63),
Middle school teacher (60),
Personnel manager (60),
Writer (58),
Nurse (54),
Computer programmer (51),
Bookkeeper (49),
Administrative assistant in a large company (49),
Police officer (40),
Farmer (38),
Receptionist (38),
Operator in a factory (34),
Hairdresser (32),
Taxi driver (31),
Security guard (30),
Full-time babysitter or nanny (23),
Janitor (21),
Hotel bellhop (20).
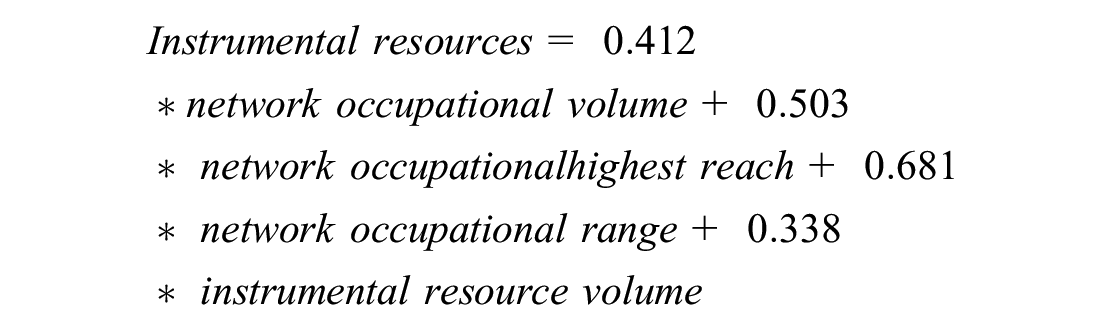
Instrumental resources were derived by principal component analysis with three measures from the position generator and one measure from the resource generator. The first metric, network occupational volume, was the total count of different occupations a respondent knew in their social network on a first-name basis. The second metric, network occupational highest reach, was the highest prestige score of all the occupations accessible in the social network. The third metric, network occupational range, was defined as the difference between the maximum and minimum prestige scores of the occupations within one’s social network. The fourth metric, instrumental resource volume, was the total count among nine instrumental resources that a respondent could turn to for help from their social network.
Using the four aforementioned measures, instrumental resources were computed as the sum of the principal rotations obtained from principal component analysis as follows:
Methodology
Zero-Inflated Ordered Probit Model with Correlated Error Terms
As this study focused on exploring the effects of social capital, especially expressive resources on increasing participation frequency, the 20 most selected activities in the survey were examined. This set of 20 activities was determined by balancing the number of different activities versus their popularity. As reported in Table 2, only 25% of the respondents selected the 20th most popular activity (i.e., gardening house plants).
Survey respondents were asked to indicate the participation frequency for each of their chosen activities using six choice categories: once, twice, once per month, 2 to 3 times per month, once per week, more than once per week. As participation frequency is a cardinal variable that has increasing frequency values, the ranges between the two categories were not linear. Thus, an ordered response model was appropriate to examine the participation frequency (dependent variable) for each of the 20 selected activities. There were seven participation frequency categories with the zero-participation category being coded when the survey respondents did not select that activity when asked “Which of the following activities have you performed over the last three (3) months?” Zero participation implies either never having participated in a specific activity or just not in the 3 months before completing the questionnaire.
The lack of a specific survey question to clarify those two nonparticipation reasons required a zero-inflated model to account for the ambiguous zero category. The zero-inflated ordered probit (ZIOP) model developed by Harris and Zhao can help assess the relationship between access to social resources and increased activity participation frequency ( 29 ). The ZIOP modeling structure accounts for the two different stages of whether one participates in an activity, and if so, how much might the influencing factors affect participation frequency. Using a double-hurdle combination of a split probit model and an ordered probit model, Harris and Zhao specified a ZIOP model to address the limited data of zero participation compared with traditional, ordered probity models ( 29 ). The ZIOP model automatically classified the two latent groups of zero participation respondents for a particular activity. Thus, we interpreted those latent groups as sempiternal nonparticipants and temporary nonparticipants. Sempiternal nonparticipants are the respondents who have not and will never participate in a certain activity (e.g., a respondent who does not watch football or someone who does not play video games because they are not interested in these activities, as opposed to this being a reaction to other temporary constraints). Temporary nonparticipants are the respondents who might have participated in the past but did not during the designated survey period of “the last 3 months” (e.g., a respondent who has not visited relatives or friends or attended church during the last 3 months owing to work demands). Nonetheless, the modeling methods to distinguish these two groups were still somewhat limited because no question asking whether the respondents would participate in such activities given the right time or conditions was included.
Harris and Zhao specified the ZIOP model using two latent equations: a binary probit equation for zero-inflation and an ordered probit equation for categorization (
29
). In this study’s interpretation, the zero-inflated binary probit determined the likelihood of having ever participated in a particular activity. Let
Latent variable

where
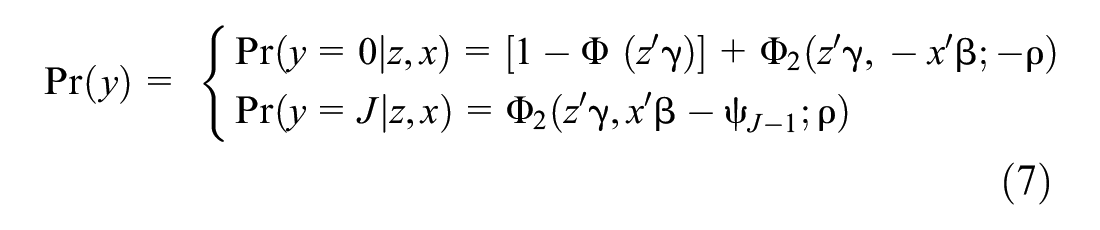
Under this assumption of separated sempiternal and temporary nonparticipation, the probability of a survey respondent participating in a leisure activity is,

where
Conditional on r = 1 for the activity participants, let

The second equation of the ZIOP model consists of a second latent variable,

where
Variable
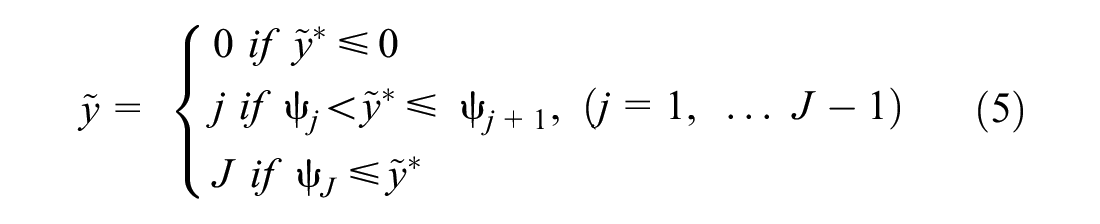
where
Combining Equations 3 and 5 gives
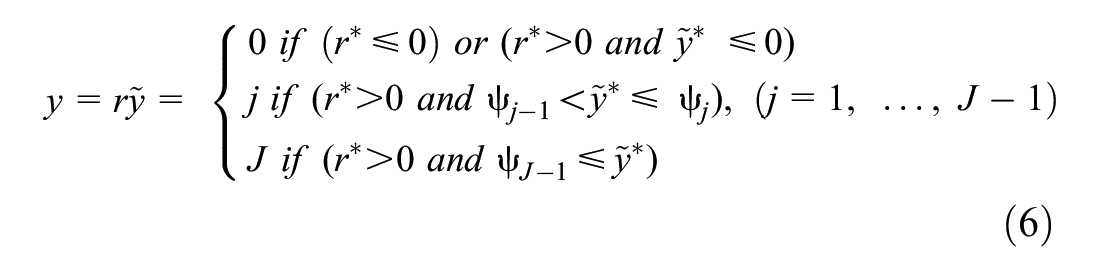
Vectors z and x in Equations 4 and 1, respectively, may have overlapping explanatory variables.
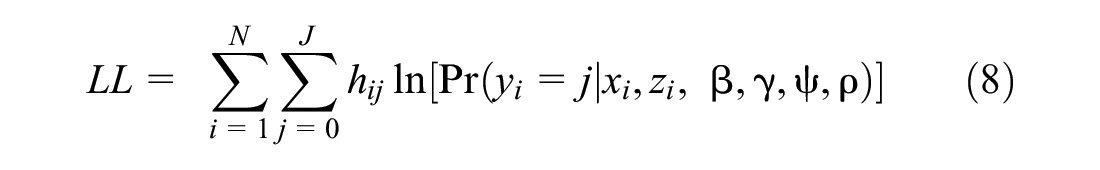
Since each survey respondent may have interrelated motivations for the likelihood and the frequency of participating in a leisure activity, a ZIOP model accounting for the correlation between the two stochastic terms
where
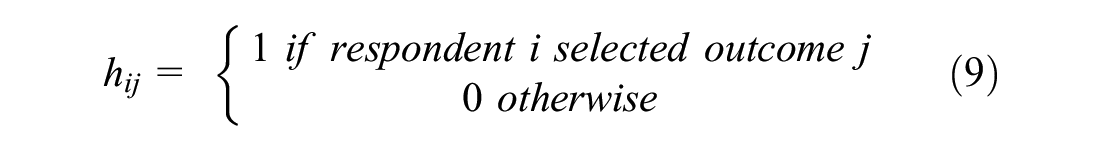
For this study’s number of respondents, N, the maximum likelihood method was used to consistently and efficiently estimate the unknown parameters
with the indicator function,
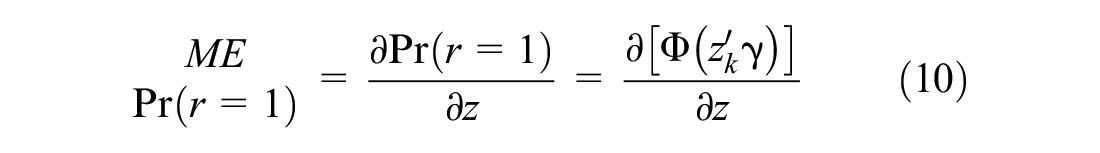
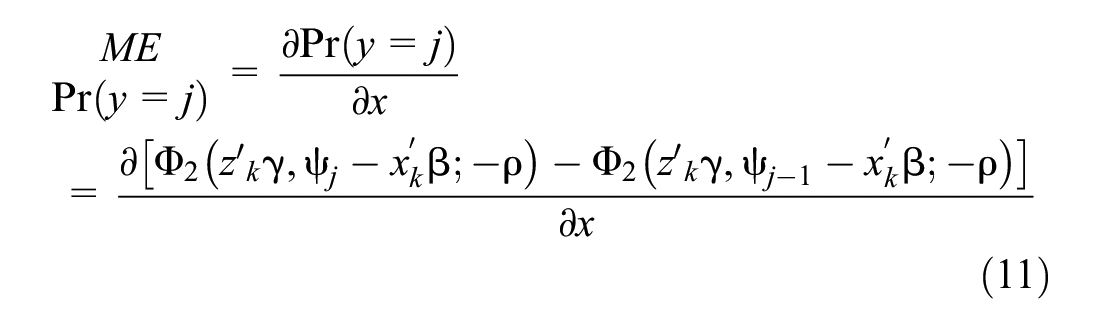
As the estimated coefficients for ordered outcomes were not directly interpretable, marginal effects were further estimated to better understand the impact of a one-unit change of the explanatory variables on specific probabilities of activity participation frequency (
29
). With regard to the zero-inflated binary probit equation, the probability to have ever participated in a particular activity for every unit change of an explanatory variable,
In the ordered probit equation, the overall probabilities for J categories of participation frequency (i.e., marginal effects) for every unit change of an explanatory variable,
Estimation Results
Twenty ZIOPC models were estimated to examine the relationship between the participation likelihood/frequency of each leisure activity and social capital measures, individual attributes (e.g., age, gender, personalities), mobility factors (e.g., vehicle accessibility, indicator of disability to travel), and household characteristics (e.g., number of members/children, income, geographical location). To highlight the impacts of social capital on the participation likelihood and frequency of each leisure activity (ordered by affiliation score), the model estimation results for expressive- and instrumental resources are summarized in Table 4. The correlations between activity participation likelihood and frequency (and several other explanatory factors) are presented in Tables 5 and 6, respectively.
Estimation Results of Zero-inflated Ordered Probit Models for 20 Activities
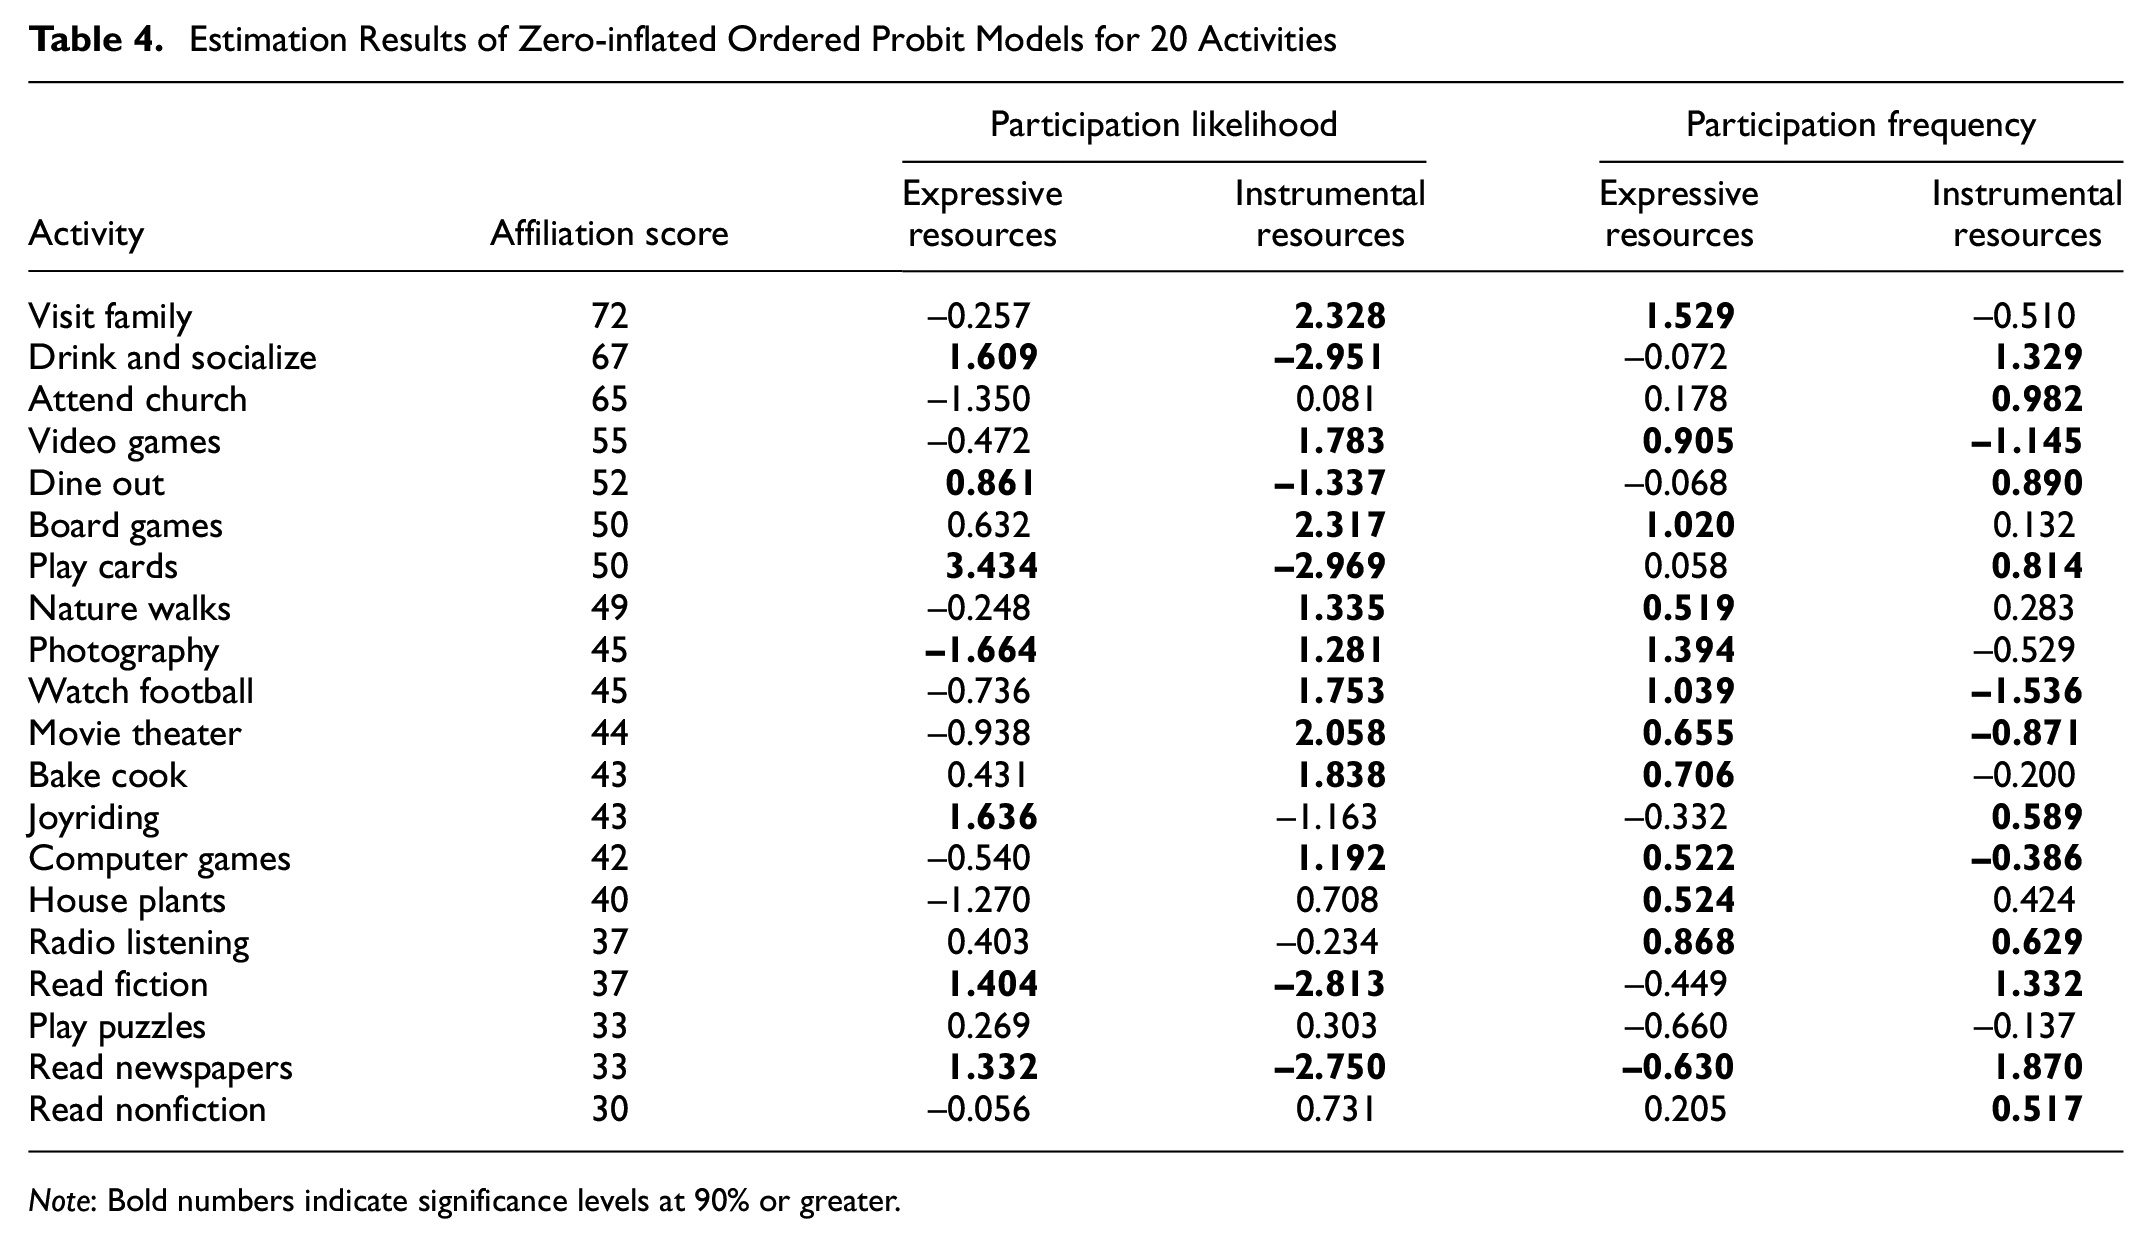
Note: Bold numbers indicate significance levels at 90% or greater.
Directionality of Estimated Variables’ Correlations with Increased Participation Likelihood of 20 Leisure Activities
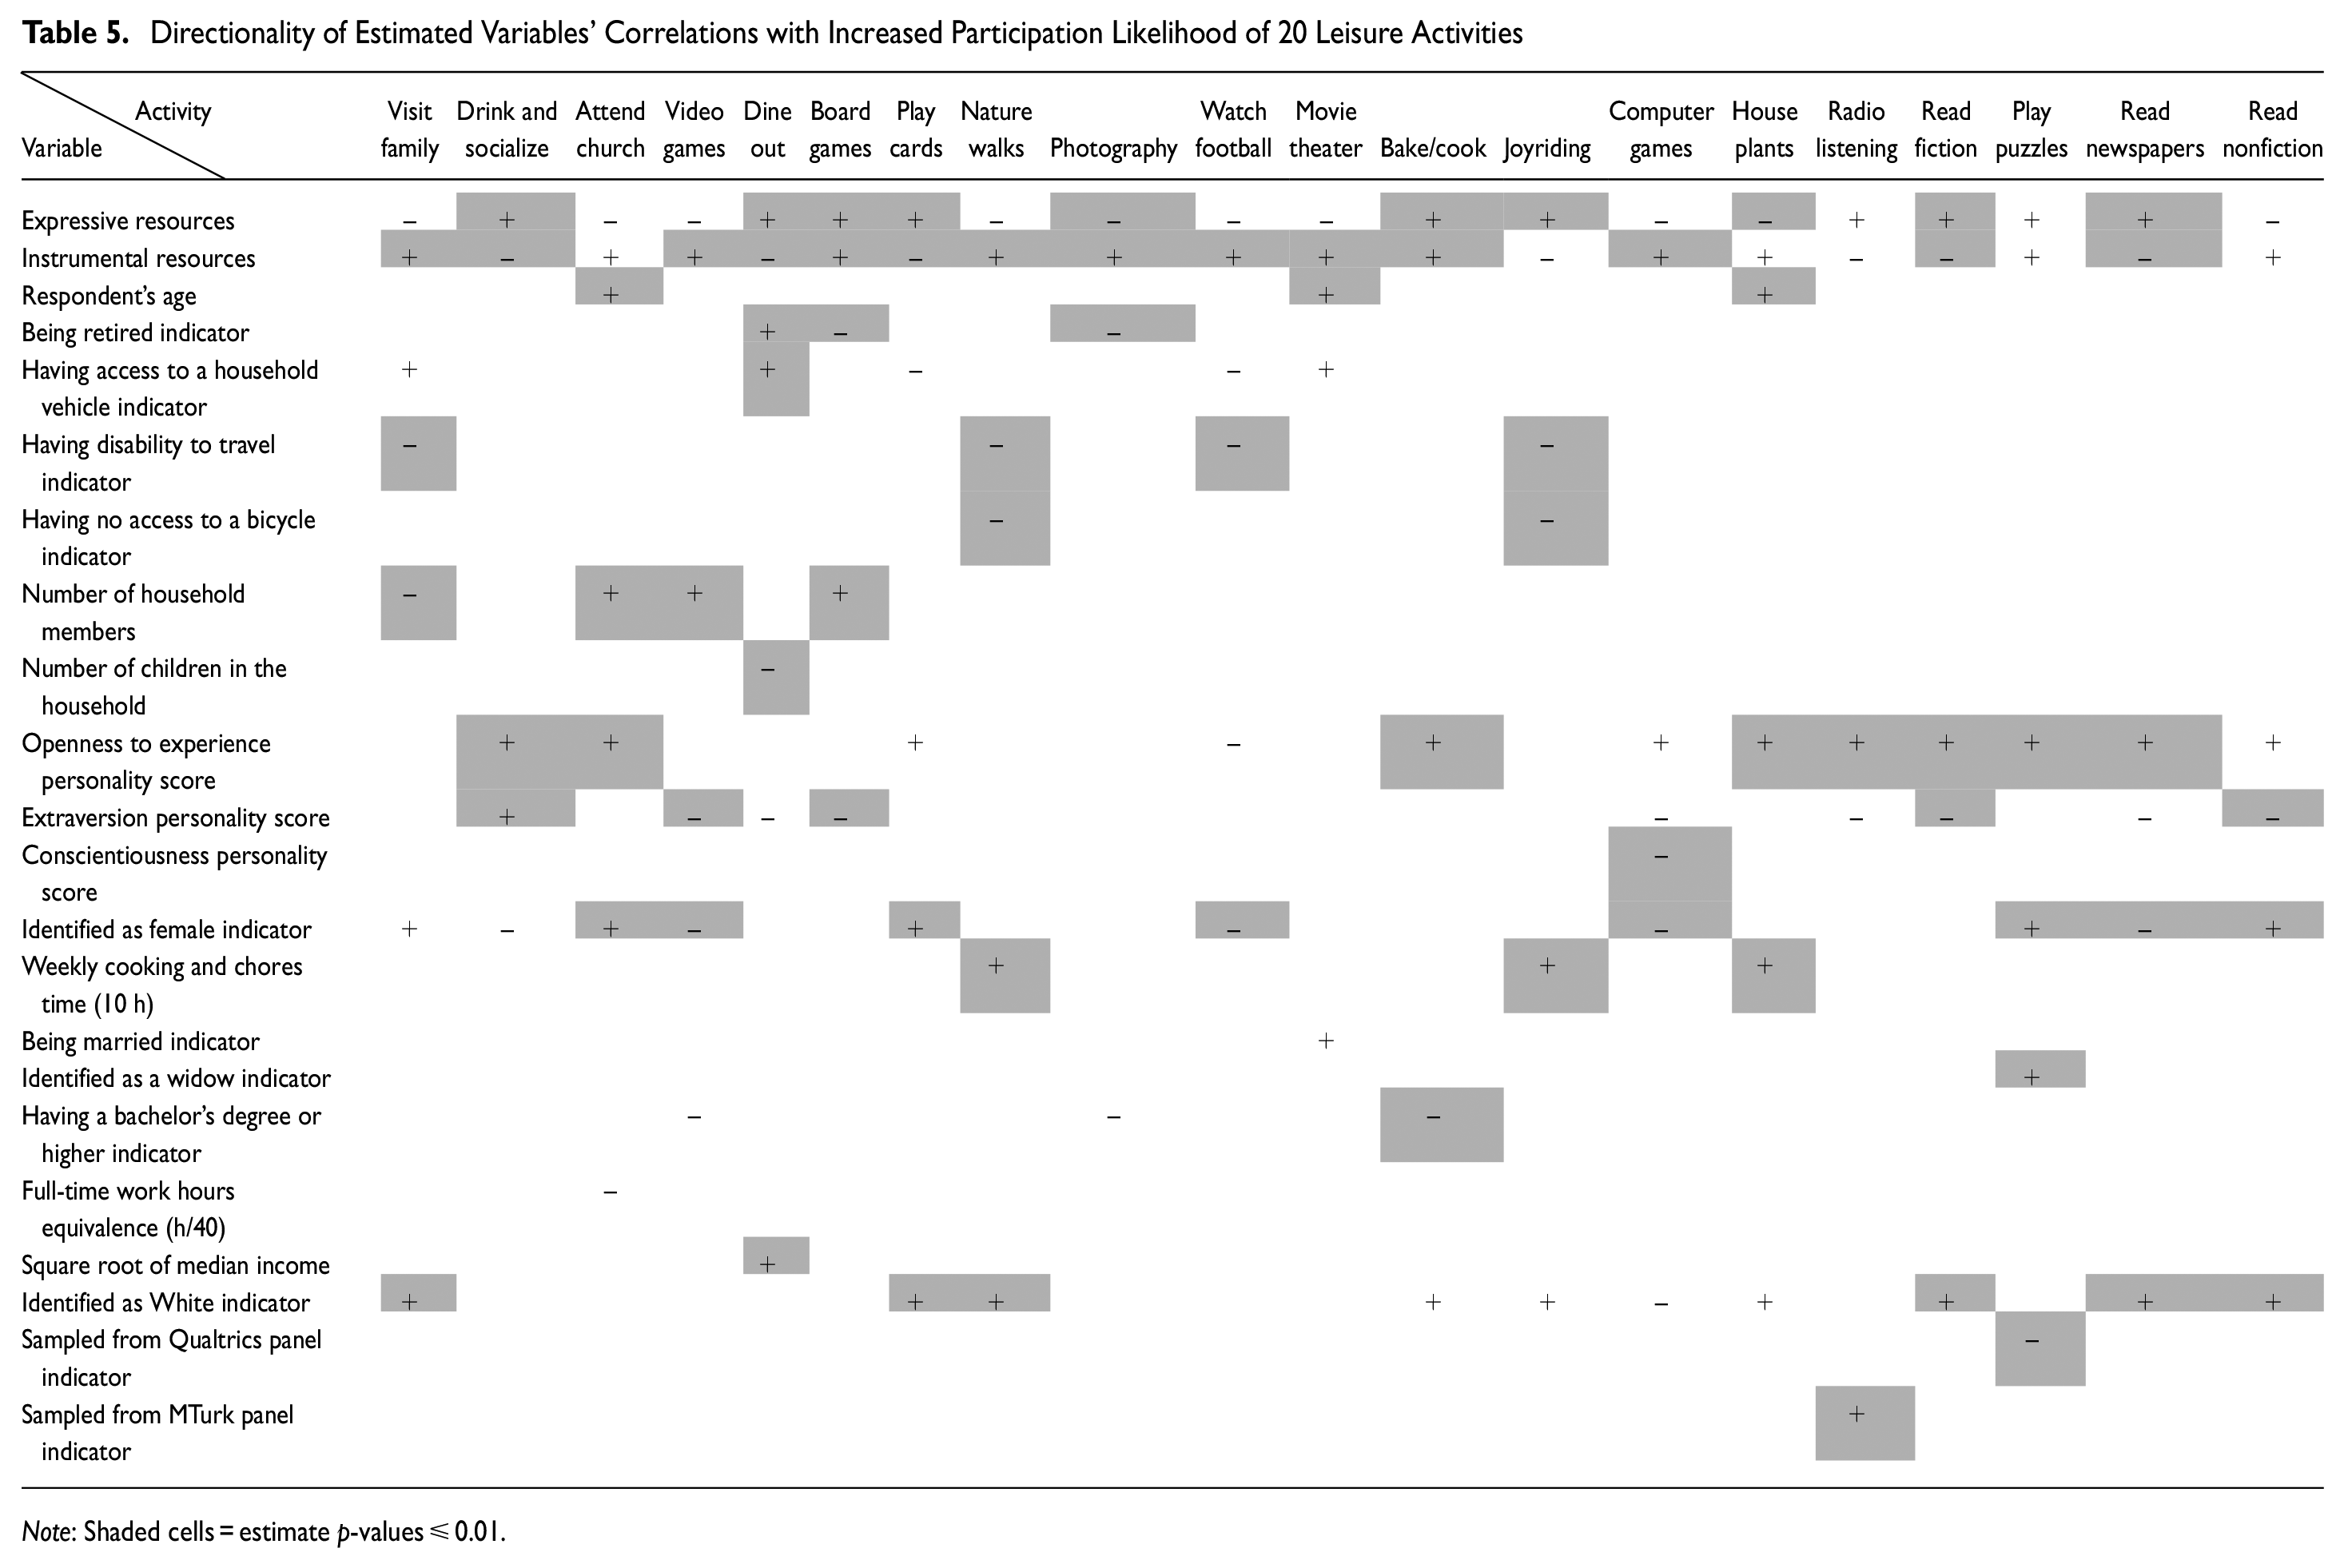
Note: Shaded cells = estimate p-values ≤ 0.01.
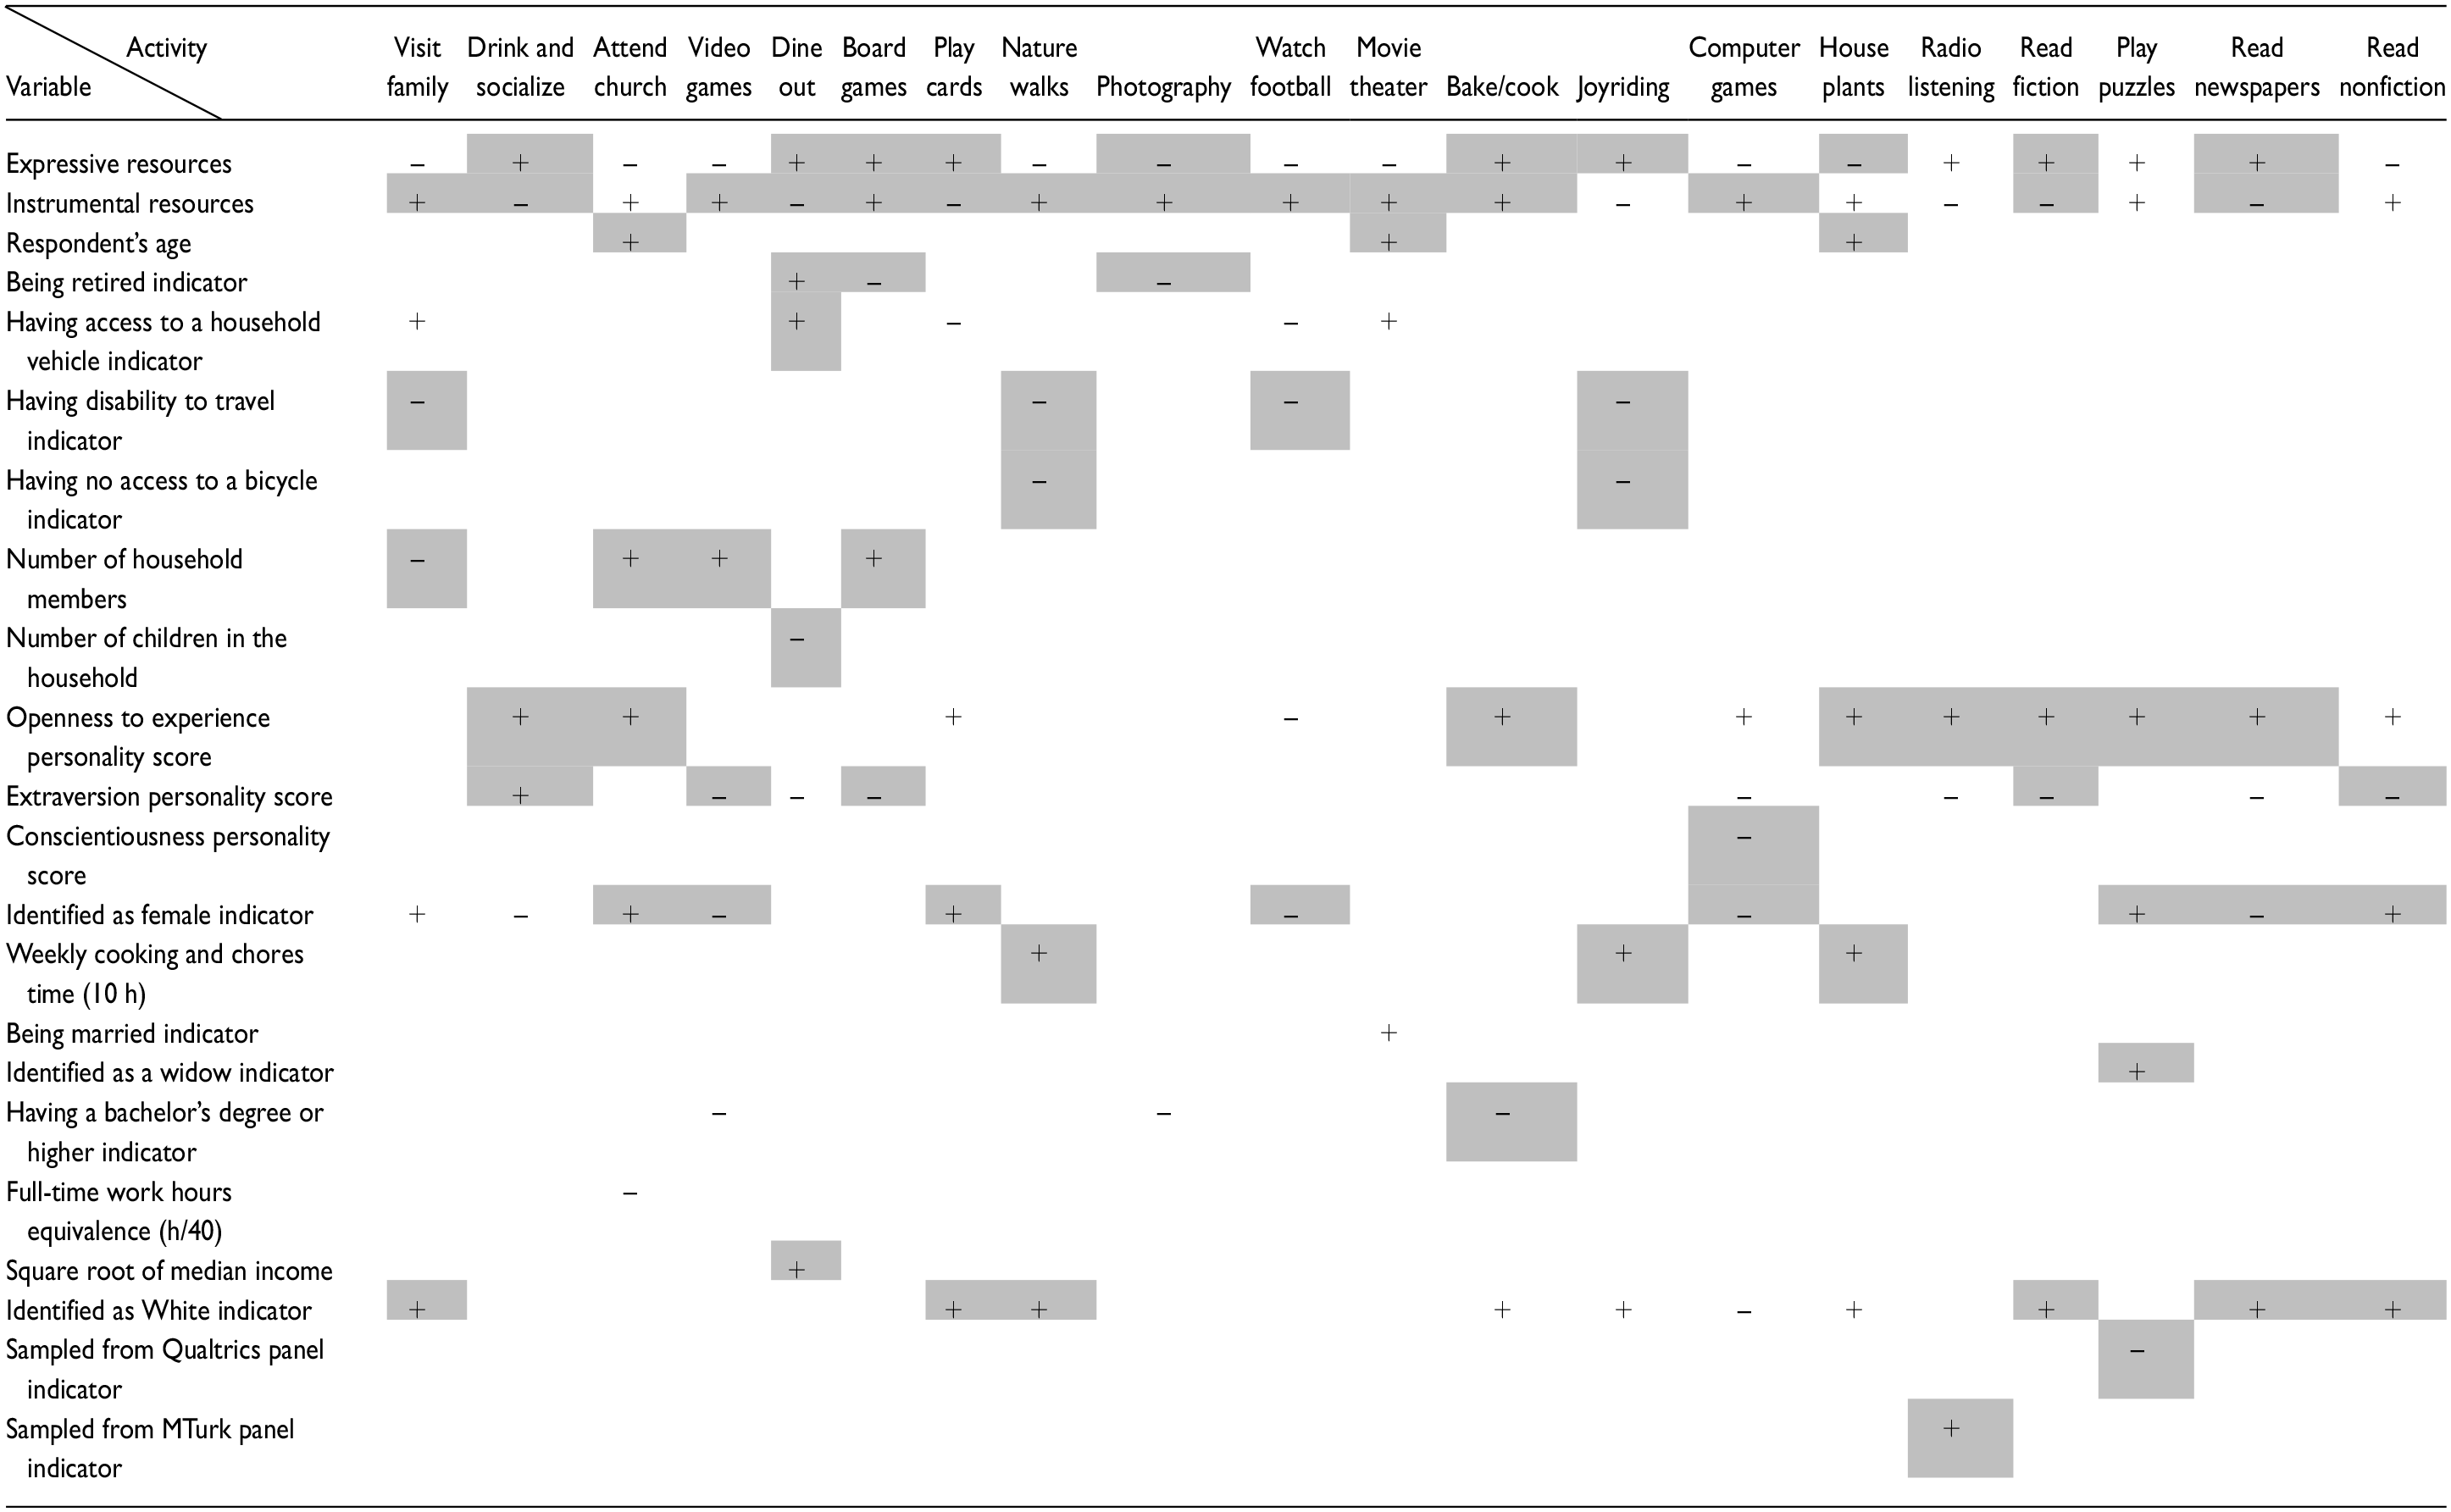
Directionality of Estimated Variables’ Correlations with Increased Participation Frequency of 20 Leisure Activities
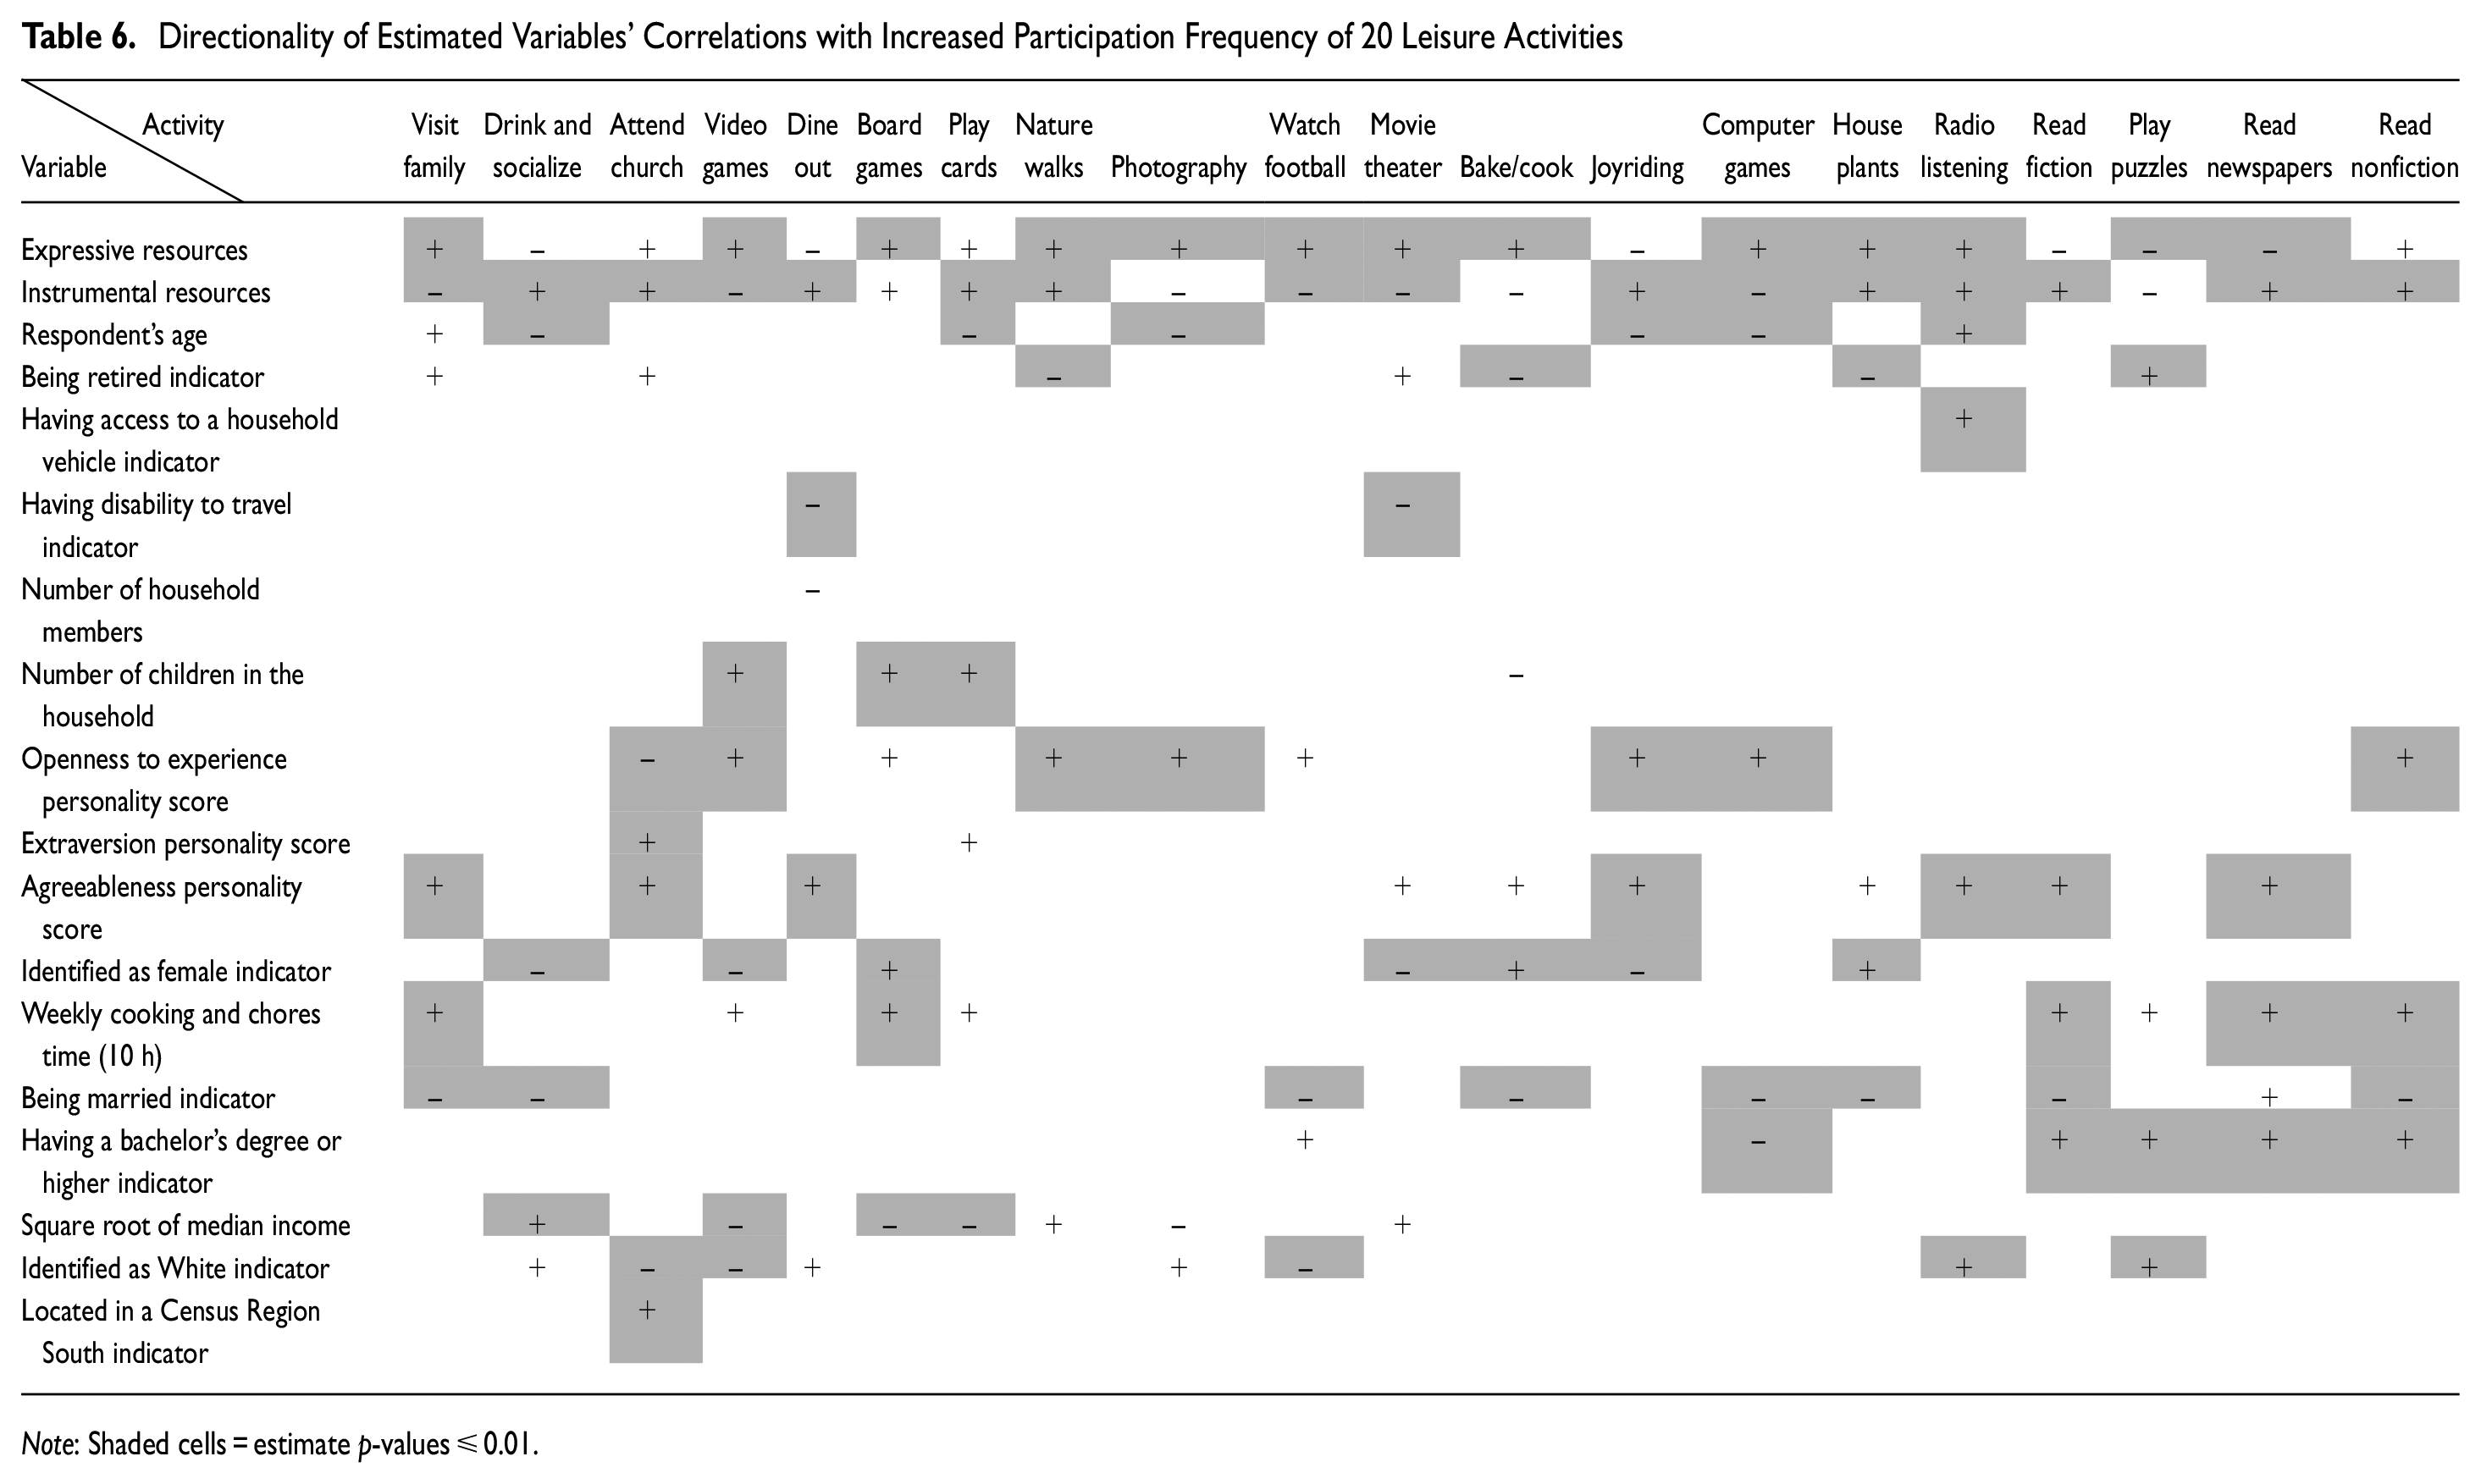
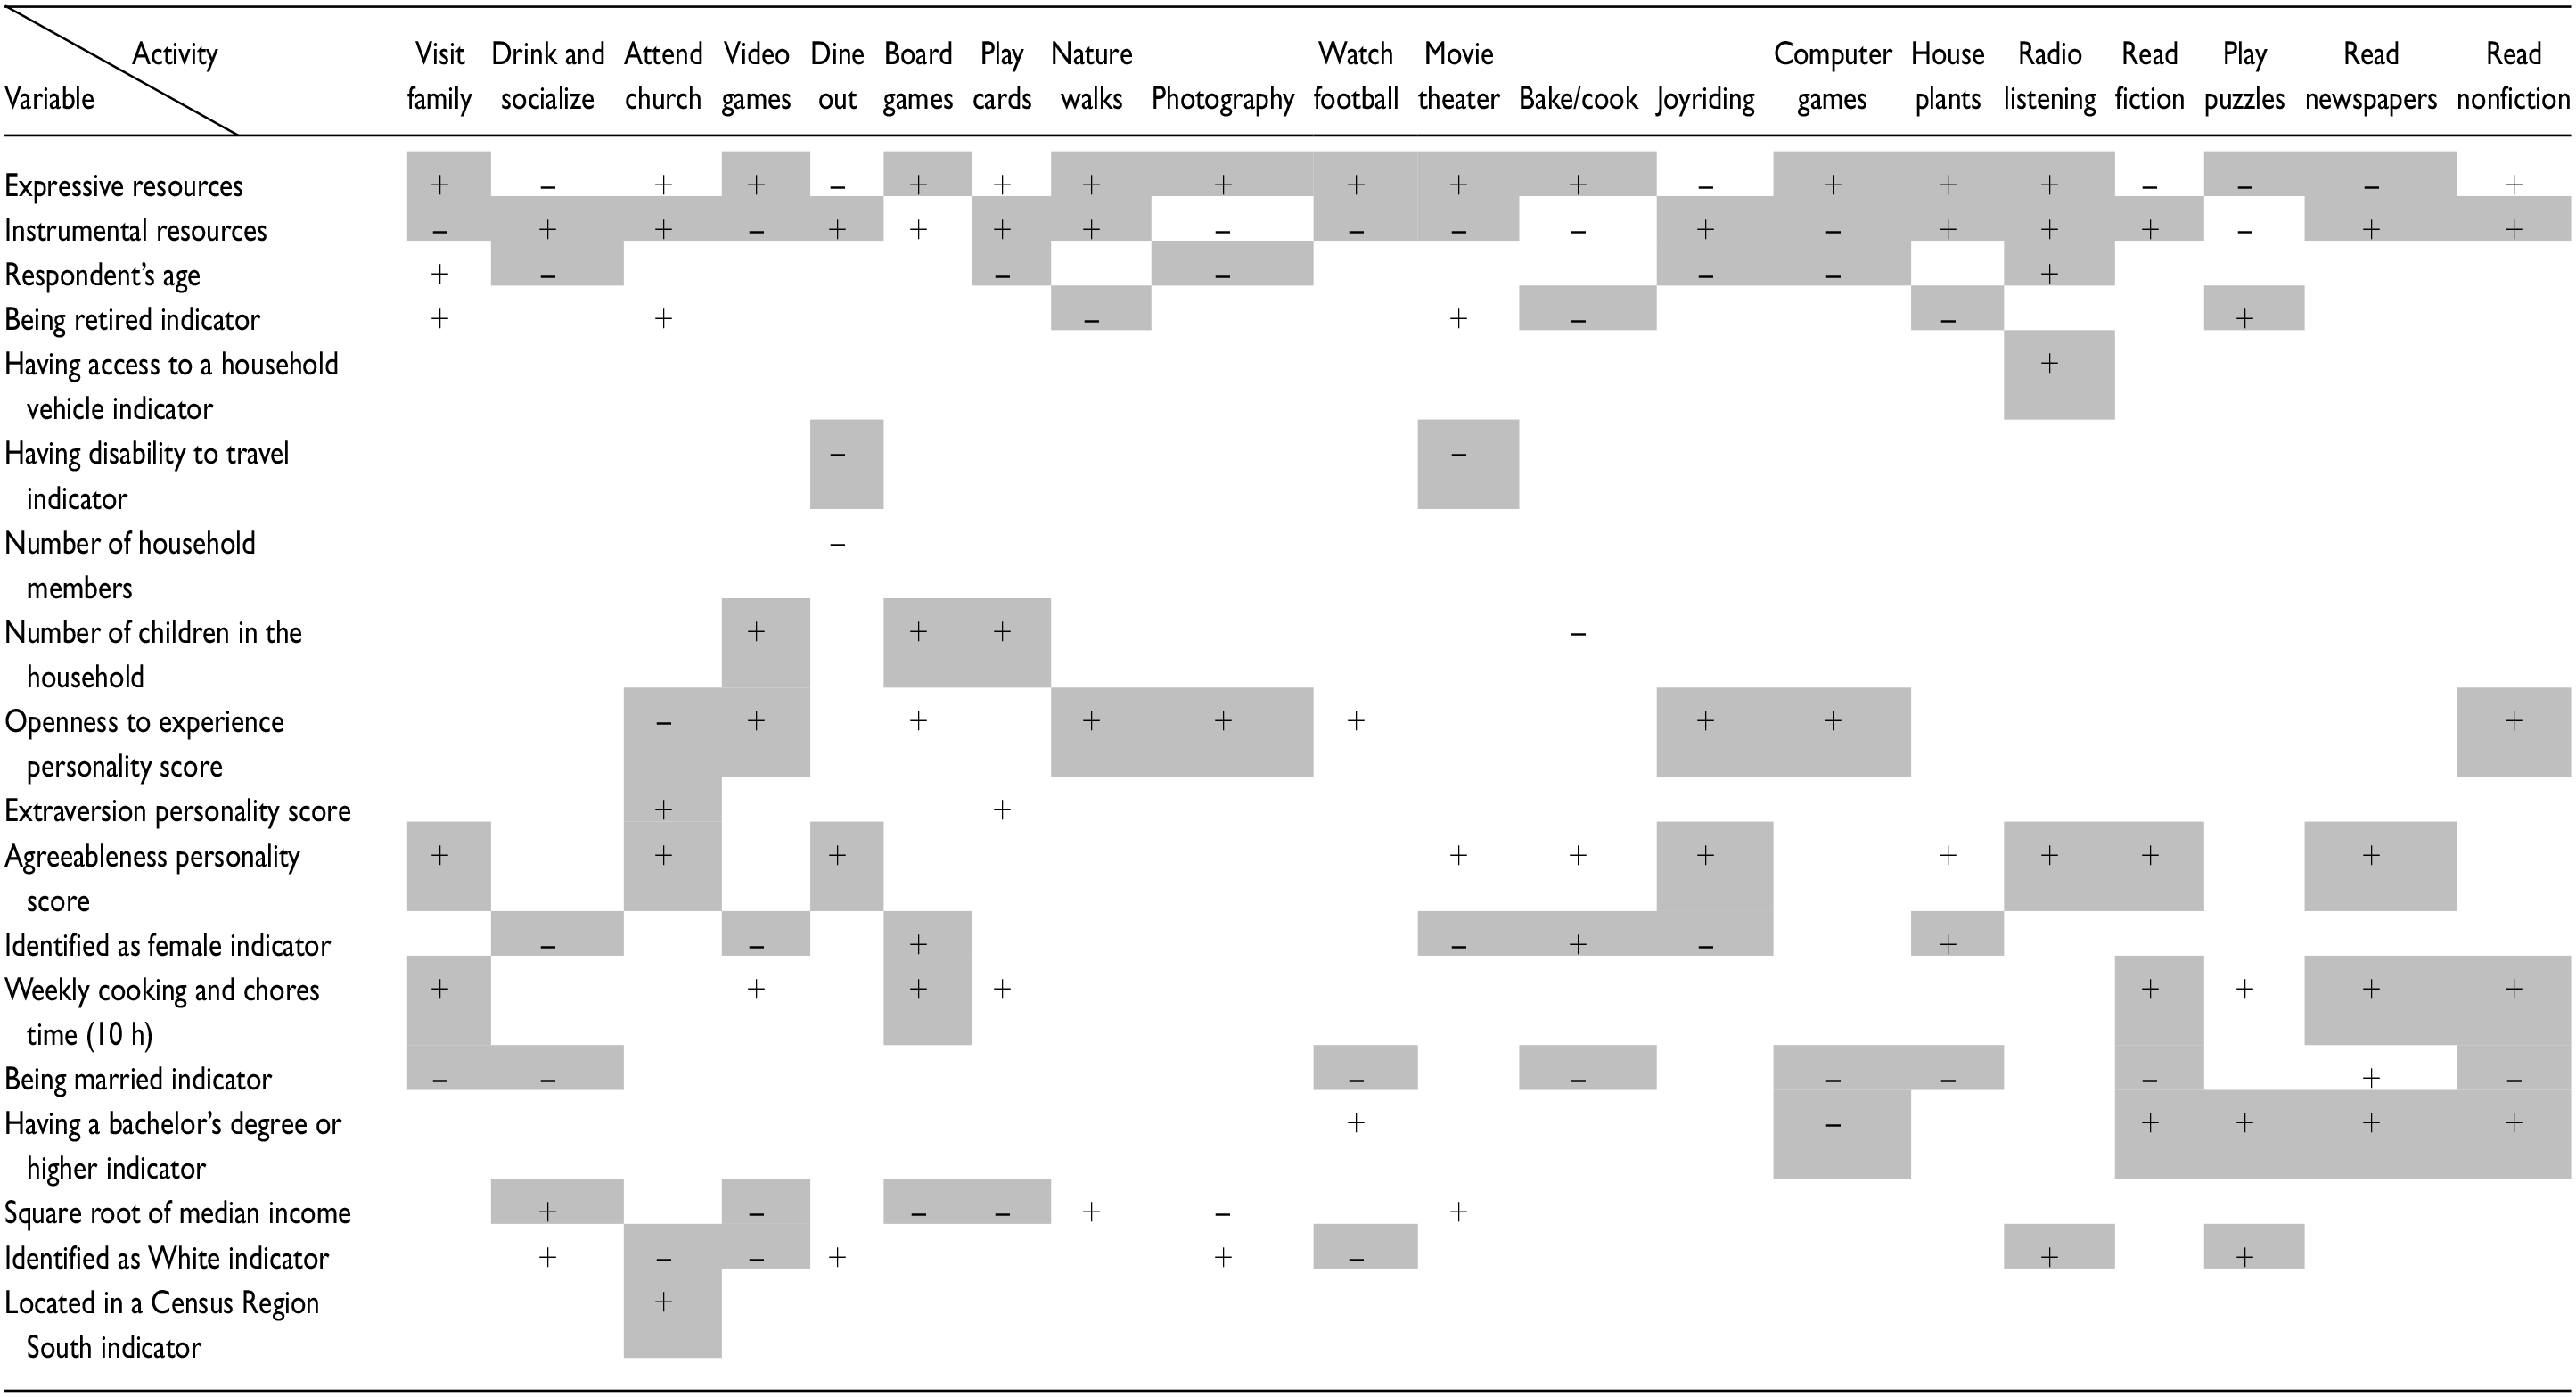
Note: Shaded cells = estimate p-values ≤ 0.01.
This research theorizes that an individual’s expressive resources increase the frequency of activities performed to maintain and strengthen social connections. These activities are likely to have higher affiliation scores, as provided in the research by Tinsley and Eldredge ( 16 ). They defined their affiliation scale as ranging from “gratification of the need to be with and relate to others in a cooperative, enjoyable way [(high score)] vs. the need to do things alone [(low score)].” In the current research, the 20 most popular activities ranged from the highest score of 72 for visiting family and friends to the lowest score of 30 for reading nonfiction. Figure 2 illustrates the expressive and instrumental resources’ coefficients obtained from the binary probit element of the 20 ZIOPC models estimated for each of the 20 leisure activities. Instrumental resources tended to increase the probability of participating in most activities—this was expected as it is theorized that activity variety is an instrumental outcome ( 30 ).
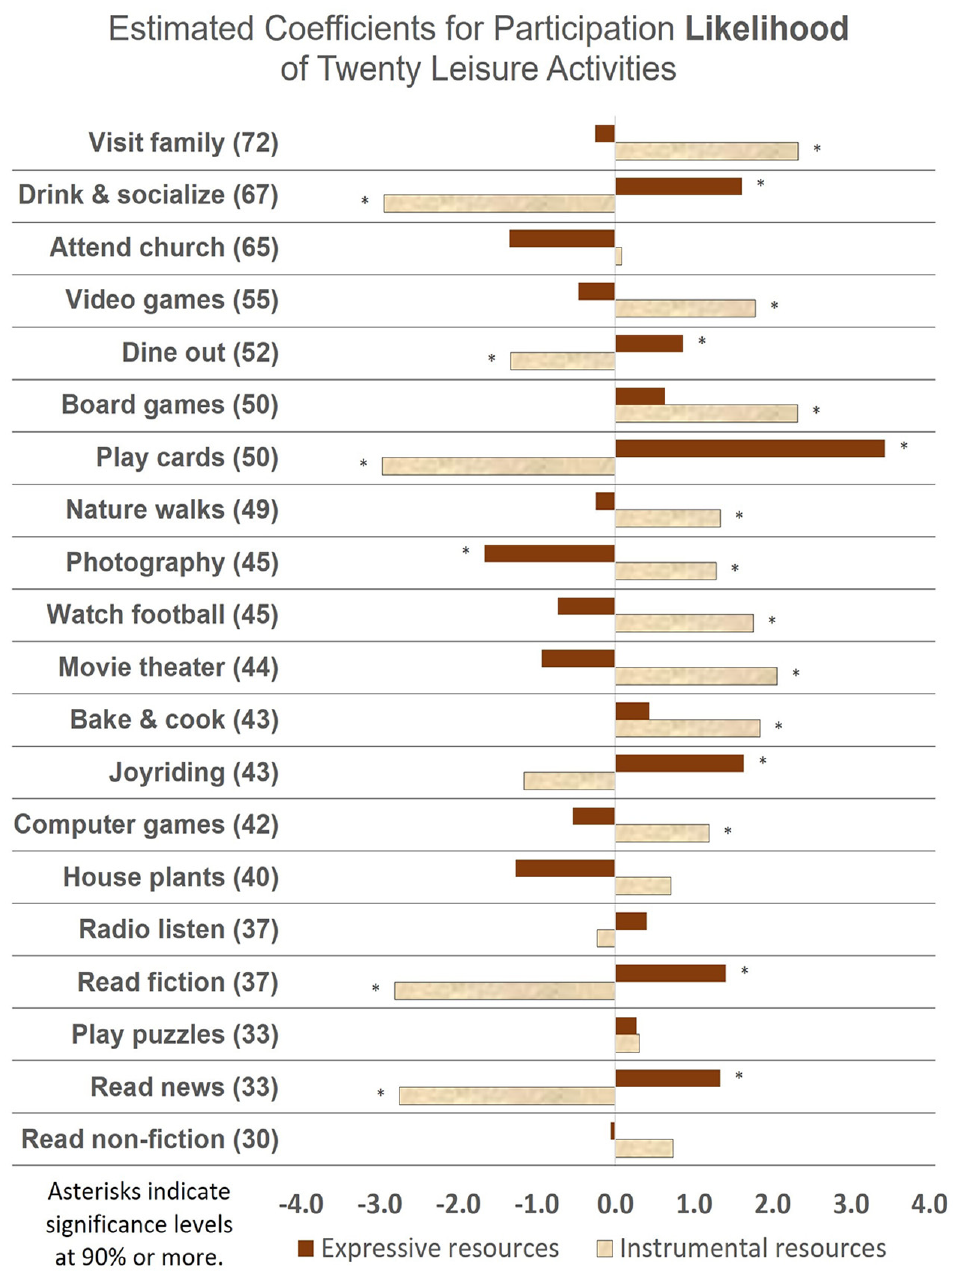
Effects of expressive and instrumental resources on participation likelihood.
Figure 3 presents the estimated coefficients of the expressive and instrumental resources on the increasing participation frequency for each of the 20 leisure activities. Eleven activities exhibited significant, positive impacts for increasing expressive resources on participation frequency. These included visiting friends and relatives, playing video games, playing board games, taking nature walks, photography, watching football, going to the movie theater, leisure cooking, playing computer games, gardening house plants, and listening to the radio. This tended to occur more often among the more social activities (i.e., activities with higher affiliation scores).
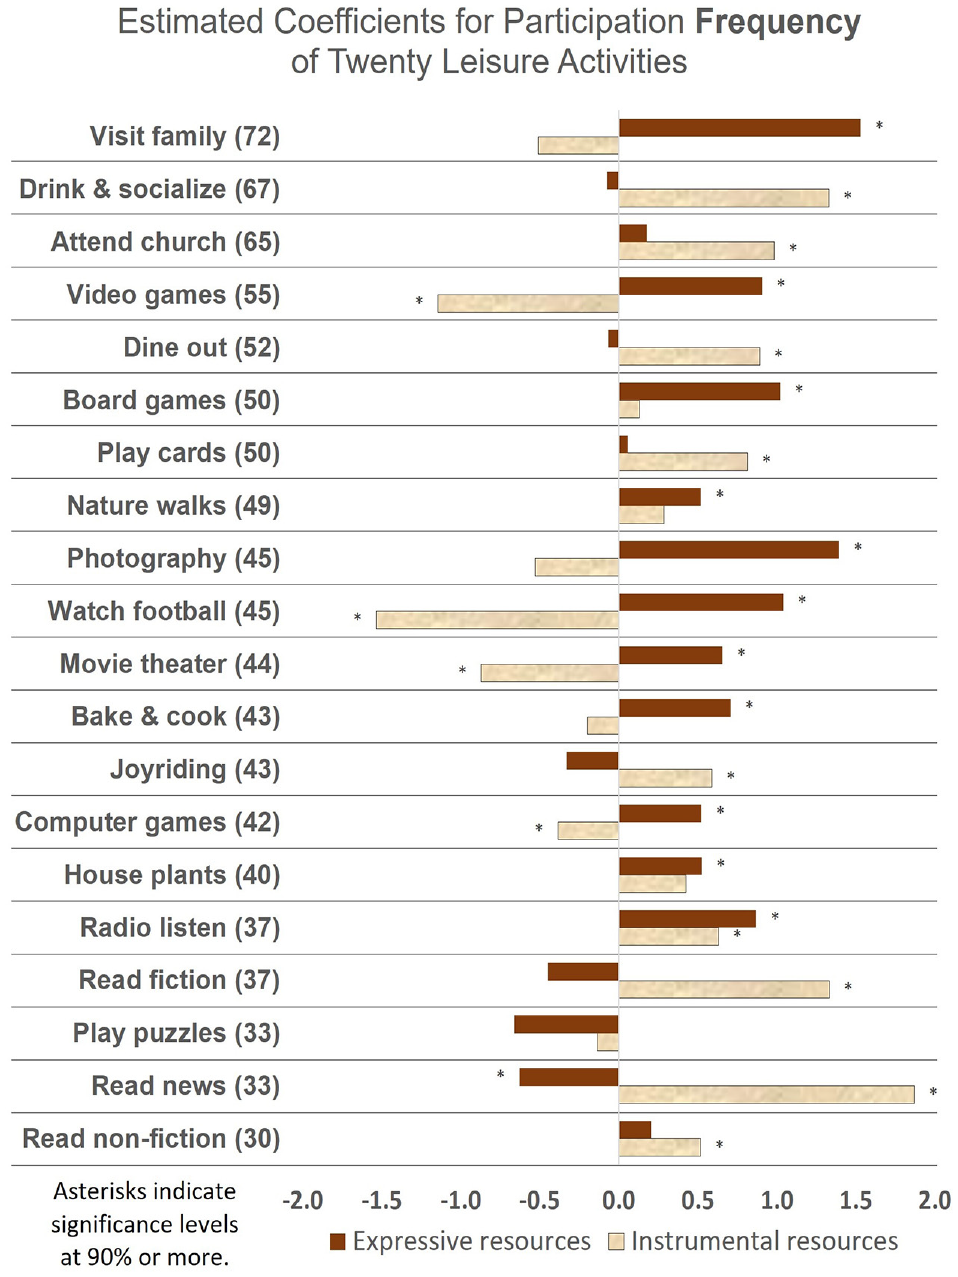
Effects of expressive and instrumental resources on participation frequency.
Social Capital Measures
Expressive resources were not found to be statistically significant for drinking/socializing and dining out participation frequencies. The lack of a relationship between expressive resources and increased frequency of drinking and socializing may have two underlying reasons. First, increased drinking can have negative health and safety impacts; no other leisure activity in the list posed any significant health risk. Second, it could be the result of how the activity was worded in the survey, that is, combining drinking and socializing: some people may drink but not socialize, and some may socialize but not drink. The compounded meaning of this activity description suggests an improvement in future research would be to ensure single interpretation of each survey instrument to separate it into two singular activities. Although expressive resources had a decreased probability of participation frequency for drinking and socializing at an 88% confidence level, expressive resources had a strong and statistically significant effect at a 99% confidence level for enabling participation in this activity (i.e., someone with higher expressive support was more likely to have had a drink and socialized at least once over the last 3 months). Similar correlations were also shown in the model for dining out, which implied that, despite being a social activity with high affiliation scores (to strengthen social connections), dining out does not necessarily require the company of others (e.g., eating out alone). Future surveys could specify this activity as “dining out with others” to emphasize its social nature.
Expressive resources were found to be statistically insignificant in both participation likelihood and frequency in the case of church-attending activity. These correlations could be a result of church-attending frequency being dictated by a fixed schedule (shown as the highest percentage of once per week). However, it is important to note the strong positive effect of instrumental resources on increasing church-attending frequency, which implied that this activity has potential for both expressive and instrumental outcomes.
In contrast to expressive resources, instrumental resources were statistically significant and increased the participation frequency of activities with moderate or low affiliation scores, such as playing cards, joyriding, gardening house plants, listening to the radio, reading fiction/nonfiction, and reading newspapers. However, instrumental resources had statistically insignificant effects on participation frequency for the following seven leisure activities: visiting family, playing board games, walking in nature, photography, cooking for leisure, gardening house plants, and playing puzzles.
It is also worth noting that instrumental and expressive resources were found to play different roles in activity participation and -frequency. Instrumental resources were found to be statistically significant and increased the probability of participating in family visiting activity, whereas expressive resources increased the participation frequency of this activity.
Individual Attributes and Household Characteristics
In addition to the effects of the aforementioned social capital measures, individual attributes, mobility factors, and household characteristics were tested in all of the models. The final model results contained the statistically significant variables (p-value ≤ 0.01) or the policy-focused variables.
Among the factors affecting participation likelihood, being open to experience significantly increased the likelihood of participating in 8 of the 20 activities. In contrast, being more extraverted only increased the likelihood of participating in the drinking and socializing activity and had a negative effect on several other activities. Limited mobility (indicated by having disability to travel) had statistically significant negative effects on activities that would be conducted out of home, such as visiting family and friends, taking a walk in nature, or leisure driving. Female respondents were estimated to be more likely to attend church, play puzzles, or read nonfiction, and less likely to play video/computer games, watch football, or read newspapers. Having more members in the household also decreased the likelihood of visiting family and friends, as would be expected, intuitively. Higher household income had a positive effect on the likelihood of dining out.
With regard to the factors that influenced participation frequency (which was hypothesized as an expressive outcome of social capital), several other explanatory variables were included as controls in the models. Increased age was estimated to be related to a decreased frequency for most activities, except for visiting family/friends or listening to the radio. Similarly, retired respondents participated less frequently in activities that were more physically demanding such as nature walks, leisure baking/cooking, and gardening house plants. As expected, radio listening activity had increased frequency for respondents with access to a household vehicle. Respondents having disability to travel had a statistically significant decreased frequency of participating in activities that were explicitly out of home, for example, dining out and going to the movie theater. Although being extraverted had an impact on increasing church-attending frequency, being more open to experiences or being more agreeable had statistically significant effects on increasing the frequency of participation in several modeled activities. Respondents who reported spending more time cooking and undertaking chores had increased participation frequency in activities requiring time commitments, such as visiting family/friends, playing board games, reading fiction/nonfiction, and reading newspapers. Respondents who attained a bachelor’s degree or graduate education participated more frequently in reading fiction/nonfiction/newspapers, and playing puzzles. Being married was estimated to have statistically significant effects on decreasing the frequency of participation in eight activities, which could be because of their commitment to other marital responsibilities. Every additional child in the household significantly increased the frequency of playing video games, board games, and cards. Higher household income only had a positive effect on increasing drinking and socializing frequency, whereas this decreased the frequency of playing video games, board games, and cards.
Conclusion
Findings
Being one of the first analyses of the participation frequency of a wide range of leisure activities, this research has yielded deeper insights into the likelihood and participation frequency of 20 leisure activities. A refined survey was designed to obtain an extensive collection of leisure activities, social capital measures, and mobility and sociodemographic characteristics. All of these factors were tested by numerous estimations of ZIOPC models to extract the most significant determinants. Among the variables that had statistically significant correlations with activity participation frequency, social capital measures helped to improve the model fit.
By examining the 20 most selected activities using ZIOPC models, this study found positive correlations between social capital and increased frequency of leisure activity participation in addition to sociodemographic factors. Individuals with higher levels of expressive resources tended to participate in activities that are social in nature more often than others with lower levels of expressive resources. In contrast, instrumental support had mixed effects (i.e., positive, negative, or insignificant) on increasing the frequency of social activities.
These findings contribute to a conceptualization of activity and travel that focuses on personal-level social capital. Being able to describe travel’s impact on social capital enables the analysis of social sustainability through a social capital lens. As more data are collected and explored, other aspects of activity behavior, such as scheduling, location choice, and activity-travel preferences can be theorized and tested while considering differences in the expressive and instrumental social capital between individuals. By understanding differences in activity patterns and thus travel differences between individuals with varying degrees and combinations of social capital, the social capital of neighborhoods can be understood via aggregated travel traces, thus, giving municipalities additional tools to understand inequities in opportunities, access, health, and wellbeing.
For travel demand forecasting, these findings contribute to improving the social realism of activity-based modeling, particularly in the selection of activity type and with regard to activity frequency. As population synthesis models advance and incorporate social connections between agents, the ability to understand how people are connected and how this relates to their associated activities will motivate inclusion of such factors into the modeling frameworks. For data-driven forecasting, observing activity locations may provide additional information that could facilitate determining the distribution of social capital among individuals in a region. This could provide useful information to derive more realistic distributions of activity behavior probabilities (particularly type and location) because regions as a whole, and especially communities within a region, vary greatly in social resource equality.
Limitations of the Research
One of the main limitations of this study was the independent modeling framework of each chosen activity. These separate models did not capture the interdependency of one’s finite activity space and time budget. For example, a respondent who dines out frequently but does not participate in any other activities would have a very different activity profile compared with someone who only dines out once or twice per month, but also attends church, watches football, and plays board games more frequently. This analysis could be enhanced by incorporating other modeling techniques such as multivariate random parameters zero-inflated order probit models. The effects could also be compared with hierarchical ordered probit models with heterogeneous thresholds for the six participation frequency categories. A further limitation is that the applied models assessed whether the independent variables had a statistically significant impact on the increased or decreased participation in relation to two types of social capital, instead of exploring the causal influence of social capital on activity frequency. Furthermore, owing to the interrelated nature of social connections and activities, other methodological approaches and the use of longitudinal data would help to capture causal relationships.
Future Work
Although the data used in the analysis were from a 2019 survey, it was also distributed in 2020 and 2022. The 3-year sample could facilitate examination of the temporal stability of social capital’s influence on leisure activity participation frequency, especially through the restriction and discouragement of nonessential activities and other public health interventions during this period because of the COVID-19 pandemic. The newer survey waves also incorporated subjective wellbeing questions; their correlation with social capital and activity participation could therefore be explored. As social connections and activity participation have intertwined influences on each other, a deeper examination of the causal effects would only be possible using longitudinal data collected from the same respondents over several years. Such longitudinal data could enable observation of activity changes in relation to the changes in each person’s social capital.
Footnotes
Acknowledgements
The authors gratefully acknowledge the support provided by the Center for Teaching Old Models New Tricks—a University Transportation Center sponsored by the U.S. Department of Transportation (Grant no. 69A3551747116). The authors also appreciate valuable feedback provided by Fred Mannering of University of South Florida.
Author Contributions
The authors confirm contribution to the paper as follows: study conception and design: T. Luong, N. Barbour, M. Maness; data collection: T. Luong; analysis and interpretation of results: T. Luong, M. Maness, N. Barbour; draft manuscript preparation: T. Luong, N. Barbour, M. Maness. All authors reviewed the results and approved the final version of the manuscript.
Declaration of Conflicting Interests
The authors declared no potential conflicts of interest with respect to the research, authorship, and/or publication of this article.
Funding
The authors disclosed receipt of the following financial support for the research, authorship, and/or publication of this article: This research was supported by the Center for Teaching Old Models New Tricks—a University Transportation Center sponsored by the U.S. Department of Transportation (Grant no. 69A3551747116). The first author was also supported by the 2019 Dwight David Eisenhower Transportation Fellowship Program.