
Abstract
After two years of living with the threat of COVID-19 in Ontario, Canada, pre-pandemic circumstances returned. During the pandemic, we relied on ICT-based tools to carry out our daily tasks, and now we have reached a tipping point. Should we keep our new routines to benefit us in the future? Or should we return to our routines before the pandemic? This study utilized a travel survey to examine the impact of the COVID-19 pandemic on work activity-travel behavior and the persistence of new traditions in the post-pandemic era. The data for this study comes from a sample of 1,000 Greater Toronto Area residents who participated in a web-based survey in July, 2021, when Ontario began the third phase of reopening. This paper investigates work activity and workplace selection in more depth. Using factor analysis, a collection of latent attitudinal variables was identified. An integrated choice and latent variable model estimated the influential systematic and latent variables on the perceived workplace selection in the post-pandemic condition. The results showed that 71% of responders want to continue working from home at least once weekly after the pandemic. The preferred frequency of telecommuting in the post-pandemic period was positively correlated with education level, positive feelings about telecommuting experience, and certain occupation types, while negatively associated with age.
Keywords
As 2020 approached, the new Coronavirus (COVID-19) stunned the world. From the early days, several efforts were made to combat the spread of the virus in Canada ( 1 ). For example, various rules were introduced to limit mandatory and leisure outdoor activities and their respective travels. As a result, many studies investigated and identified alterations in travel patterns and activity behavior from the early days of the COVID-19 pandemic lockdown ( 2 , 3 ). Although the COVID-19-related restrictions were eased a few times during the pandemic, they were not abolished, and, at the time of writing, our lives had not returned to pre-pandemic normal. Despite this, we accustomed ourselves to this new situation, or better to say, the “new normal” ( 4 ).
This new normal offers alternatives to everyday activities, using the internet and information and communication technologies (ICT). For instance, individuals practiced telecommuting and online meetings, online grocery and non-grocery shopping, and socializing with family and friends using video calls. Besides, corporations and enterprises used ICT to keep providing their services to clients, on the one hand, and to create a working platform for their employees on the other.
As of this writing, COVID-19-related restrictions have been completely lifted, and we have almost returned to our everyday lives. The external incentives or compulsions to engage in tele-activities during the pandemic have vanished, and tele-activities are now a matter of comfort and personal preference. The real-life experience of performing tasks from a distance affected attitudes and motivated many individuals to maintain this new pattern. The important question for researchers is the level of interest society has in continuing to use tele-activities post-pandemic. The stability of these new routines needs to be perceived entirely and all of its aspects reflected on in the next generation of activity-travel scheduling models.
Although not the first time a natural disruption led to activity-travel alterations, COVID-19 was distinctly different ( 5 ). The authors believe the long temporal and wide spatial distribution of this interruption could have deeply affected personal habits. At least we can expect that, compared with previous disruptions, a greater proportion of society would substitute or retain new routines for a longer duration afterward. This hypothesis motivated us to write this paper. This study aims to predict the future of telecommuting in the post-pandemic era by examining evidence and individual perspectives on telecommuting experience during the pandemic. Also, we estimated a model to predict the frequency of telecommuting in the post-pandemic era, reflecting the influence of observable and latent factors on telecommuting frequency selection.
The paper is structured as follows. Reviewing previous studies is presented first. Then, the sample and the survey method are introduced. Next, we discuss the methodology used to extract the latent attitudinal factors. Then, a statistic model is presented in the Results section, and the findings are discussed. After that, we discuss the implications of the findings for public policy and planning. Finally, the paper summarizes the findings and discusses suggestions for later studies in the Conclusions section.
Literature Review
ICT and Activity-Travel Behavior
ICT-based alternatives can have four effects on activity-travel behavior: substitution, complementation, modification, and non-effect ( 6 ). Comprehensive literature is available in transportation on the different impacts of ICT on activity-travel behaviour and its positive and negative outcomes ( 7 ). Overall, it is expected that, in optimal conditions, telecommuting can expand job opportunities to many, enhance active interaction and communication among workers, mitigate physical characteristics of the workplace environment, and remove transportation-related boundaries ( 8 ). In addition, the substitution of traveling to work with using ICT to work at home was found to be beneficial in reducing congestion, traffic pick period, air pollution (improved air quality), and vehicle miles traveled ( 9 – 12 ).
However, all these benefits were insufficient to persuade people to telecommute, especially employees. For instance, in 2016, less than 7.4% of employees in Canada worked from home (WFH) ( 13 ). This may be attributed to the characteristics of telecommuting, such as limiting access to colleagues, supervisors, and business partners (professional engagement), the potential for missed promotion opportunities, and the absence of social engagement ( 14 – 16 ). Baker et al. categorized some of these barriers into four groups: 1) structural barriers (physical and social requirements of work); 2) policy/regulatory barriers (lack of policy to direct telecommuting); 3) economic barriers (cost imposed on telecommuters to prepare work-related furniture and technologies); and 4) technological barriers (how to utilize the required ICT software, hardware, and applications) ( 8 ).
Some hurdles to telecommuting adoption were lifted because of the pandemic’s long-term forced lockdown. Professional relationships, for example, remained to be conducted using online meeting software. Furthermore, the enforcement of telecommuting during the lockdown rendered it normative, and, according to Golden and Eddleston, when telecommuting is very normative, telecommuters obtain even more promotions ( 15 ).
ICT and Transportation Disruptions
One of the ICT implementations is to provide an alternate means of doing activities, especially during a transportation disruption. Previous research looked at how people used ICT if there was a human-caused (e.g., Olympics) or natural-caused (e.g., earthquake) disruption in transportation networks or activity destinations ( 5 , 17 ). Brewer and Hensher looked at the influence of travel restrictions imposed by the 2000 Sydney Olympics on activity changes throughout the event ( 18 ). Parkes et al. investigated the same problem in preparation for the 2012 London Olympics ( 19 ). According to later research, the newly adaptive behaviors did not persist after the Olympics.
In addition, some research looked at the influence of different natural disasters (flood, storm, and earthquake) on travel behavior ( 20 – 25 ). In contrast to human-caused disruptions, natural-disaster-induced behavior changes persisted for longer after the disruption had passed. However, many people did not stick to their new routines established by natural disasters for a long time following the disruption.
The instability of resuming new routines and travel patterns following a disturbance is common in these investigations. Understanding individual resistance to new activity/travel behaviors is critical to comprehending why new routines are unstable. Constraints cannot provide a strong incentive to overcome inertia and alter previous habits when a disruption or access restriction vanishes quickly. Also, alternative routes to reach destinations, or alternative destinations themselves, allow individuals to have other options to use in this resilient transport system.
In contrast, the COVID-19 disruption caused a very distinct situation. There was no opportunity to travel or engage in outdoor activities because of the widespread shutdown of activities, strict travel restriction laws, and the risk of contracting a fatal infection. Also, from the beginning, the expectation of persistent constraints diminished the prospect of “returning to normal soon” and compelled persons to engage in tele-activities. Putting together the pieces of this puzzle, we hypothesize that individuals adopted new patterns during the pandemic and that many are interested in continuing these practices.
COVID-19 and Adoption of New Routines
Since the earliest days of the COVID-19 pandemic, the influence of the pandemic on the mobility of various sociodemographic groups has been thoroughly investigated ( 26 – 29 ). In contrast, activity-travel behavior during the pandemic was given less attention ( 2 , 30 ). As an effort, Fatmi et al. investigated the frequency and duration of in-home and out-of-home activities for various sociodemographic categories before and during the pandemic ( 3 ). De Haas et al. (31) found that teleworkers had a favorable outlook on their experience and that 27% of teleworkers anticipate WFH more in the future ( 30 ). Bin et al. examined activity-travel changes during the pandemic to foresee the potential for long-term behavior changes in a few nations for various sociodemographic categories ( 2 ). They discovered an association between respondents’ sociodemographic characteristics and their inclination to adopt tele-activities in the post-COVID-19 period ( 2 ). Beck and Hensher examined the days that persons WFH during and after the lockdown ( 32 ). After reopening, the number of new telecommuters who WFH 5 days per week decreased by 40%. However, respondents saw telecommuting as a pleasant experience and expressed future interest in telecommuting more regularly ( 32 ).
Data
This study is the second cycle of a COVID Activity Scheduling Alteration Survey (CASAS) ( 5 , 26 ). CASAS was designed as a hybrid cross-sectional and panel survey, with some respondents participating in both waves. The first cycle of CASAS data was collected in July, 2020, about 4 months after Ontario declared a state of emergency, and the second cycle was done almost a year later. The two cycles share a questionnaire which is similar in content. In the second cycle, several questions about job productivity and COVID-19 were added to the survey, but the section concerning stated preference (SP) choices for grocery shopping was removed. The findings from CASAS’s second cycle are the focus of this research. Another published article further discusses the results of the first cycle of CASAS ( 5 ).
A representative sample of Greater Toronto Area (GTA) adult residents (18 years and older) was selected for this study. After cleaning the data, 991 records remained from the 1,000 participants in an online survey. Participants are from the five GTA municipalities: Toronto, Halton, Durham, Peel, and York. The survey was prepared using commercial survey software, and survey sampling was carried out utilizing an online market research platform ( 33 , 34 ). This survey began on July 11, 2021, (in conjunction with the third phase of reopening in Ontario) and ended on August 17, 2021 ( 35 ). Henceforth, “during the pandemic” refers to an entire lockdown period between the start of COVID-19 in March, 2020, and the time of data collection, and “after the pandemic” refers to the time after the third phase of reopening in Ontario on July 19, 2021.
In the third stage of reopening in Ontario, 25% of people were completely vaccinated (two doses), while 70% to 80% of adults received at least the first dose ( 35 ). Indoor meetings were authorized for up to 25 people, while outdoor events were permitted for up to 100 people. Most recreational sites were authorized to operate within a capacity that enabled social distancing. This time window was chosen for data gathering as a benchmark for restoring normal circumstances. At that point, individuals could participate in outdoor activities and inside events. Thus, this time window is an ideal choice to examine the activity-travel behavior of individuals to test the hypothesis of this research.
The sample population distribution across subdivisions was set to correspond with Census 2016 population proportions ( 36 ). Census 2016 validated sample conformance concerning the sample’s distribution and other characteristics (Figure 1). In light of the negative correlation between age and the employment of ICT-based alternatives, ignoring this mismatching issue may lead to validity concerns in subsequent analyses. To overcome this issue, an iterative proportional fitting method was employed to determine the weight of each age group in each location. Later analysis in this study incorporated the influence of this weighting.
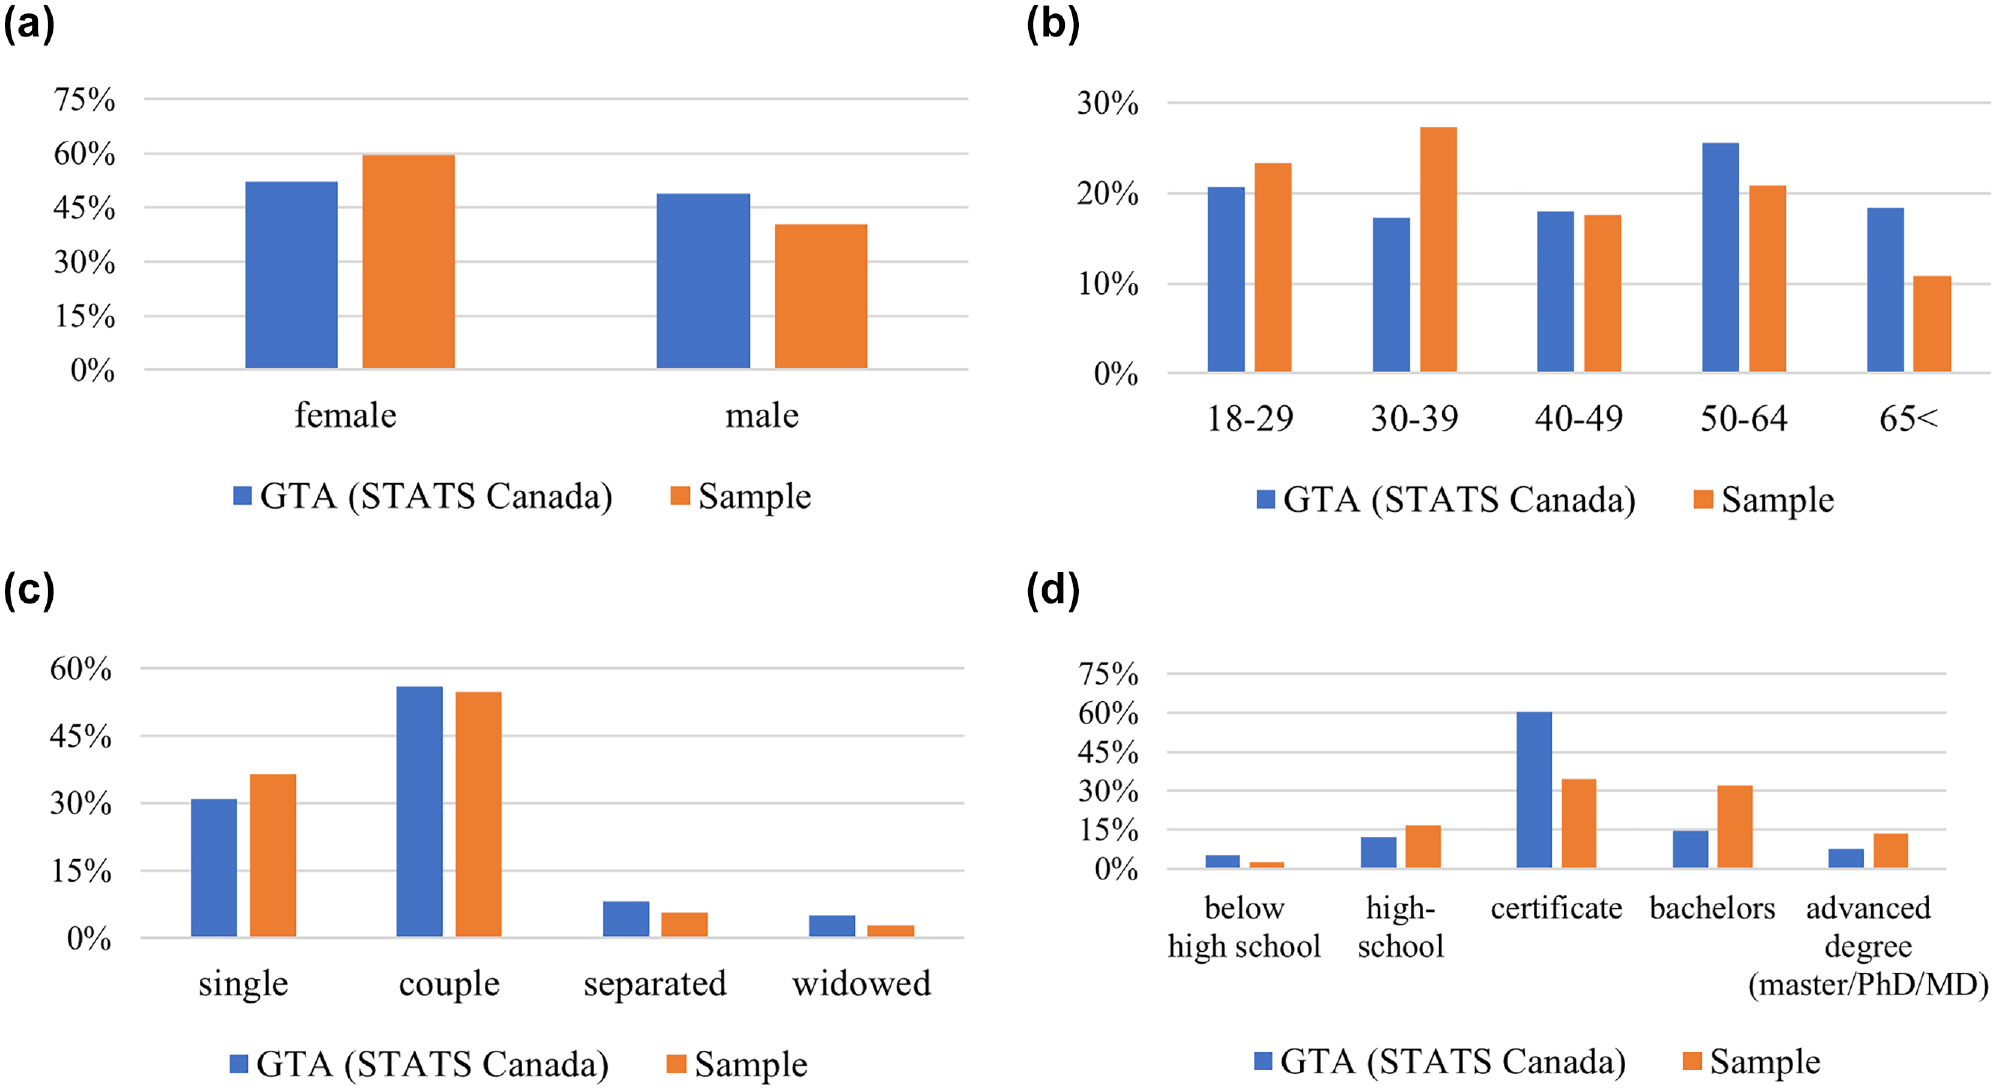
Sample and Census 2016 conformation based on: (a) Gender; (b) Age; (c) Marital Status; and (d) Level of Education.
The questionnaire for this study was set up as shown in the data model (see Appendix, Figure A.1). It includes questions about sociodemographic characteristics at the individual and household levels, pandemic-related topics, frequency of performing activities using various in-person and remote methods, SP for workplace choice, and attitudinal questions about workplace selection and online grocery shopping. SP scenarios were developed by NGENE software employing the orthogonal fractional factorial design approach ( 37 ).
Descriptive Analysis
This section presents data descriptions of COVID-19-related topics and an overview of work activity. These analyses are based on data acquired when COVID-19 was still a public health concern. Observing the present condition provides a peek into the future. As a result, in this section, we are concentrating on information that may assist us in anticipating future situations.
Attitudes Toward COVID-19-Related Topics
To determine their worries and attitudes toward COVID-19, participants were asked questions about their perceptions of the virus and its characteristics. Figure 2 provides a list of potential respondent-related metrics. We can deduce that most of our respondents were concerned about various aspects of COVID-19, especially the “Emergence of the novel COVID-19 variant.” This may be because a new variant would result in a fresh wave of infection/hospitalization and another phase of restriction/lockdown.
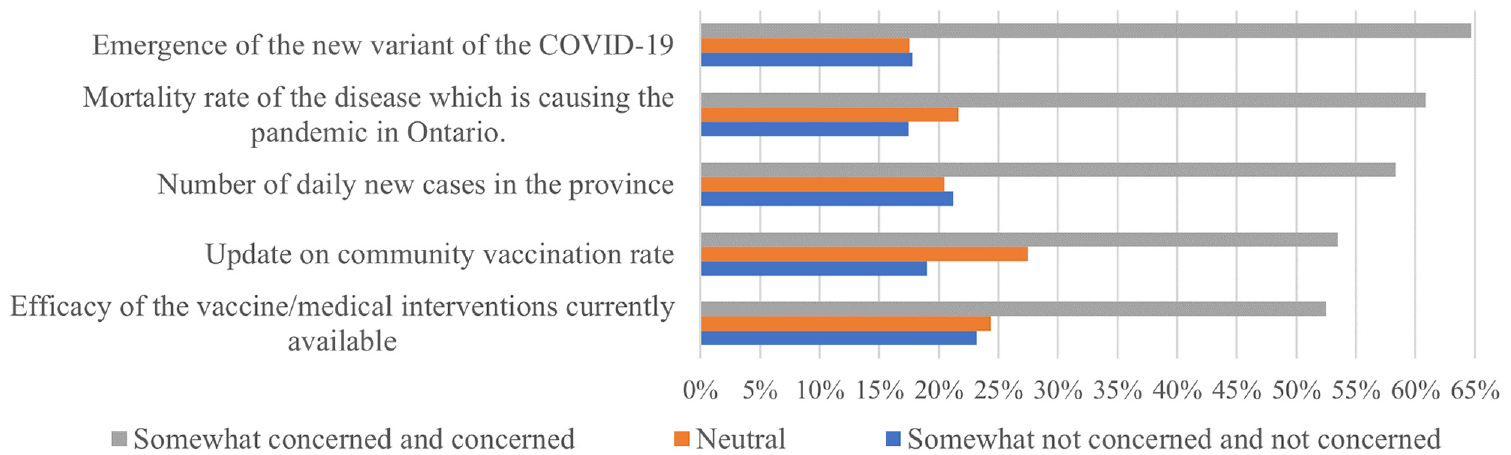
COVID-19-related topics that concerned respondents.
These worries motivated our responders to take precautions against the COVID-19 virus, such as getting vaccinated and maintaining social distancing. Although 56.8% of respondents were fully vaccinated and 16.7% of them had received their first dose and awaited the second, more than 50% of responders doubted the vaccine’s effectiveness in controlling the spreading of the virus (Figure 3). Therefore, 61.6% of respondents predicted the next COVID-19 outbreak would occur in Ontario in less than 6 months, while only 20% of respondents felt that vaccination programs will end the story.
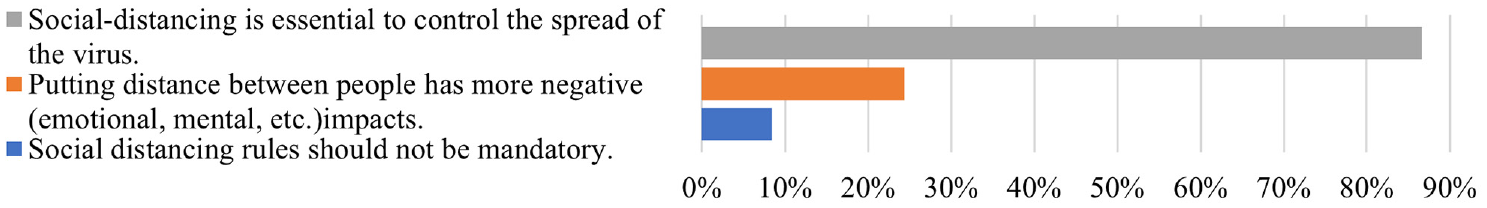
Attitudes toward social distancing.
The attitude toward social distancing, however, was more positive. Social distancing was recognized as an effective approach for preventing the virus’s transmission ( 38 ). It was required in public spaces during the third phase of reopening in Ontario. Figure 3 displays the opinions of respondents about social distancing. Readers should note that respondents were allowed to choose all statements they agreed with. It reveals that most respondents believed social distancing was necessary to stop the spread of the virus. Comparing the attitude about social distancing between the two cycles, we can infer that respondents who agreed with social separation decreased from 87% to 74% in the second cycle. In contrast, those who believed social distance had a greater negative influence remained relatively unchanged (18.5% in the previous cycle against 19.5% in this round) ( 5 ).
Work Activity Overview
Employment Status Comparison
During the pandemic lockdown, everyone was obliged to work remotely except some groups of vocations, including healthcare professionals and other essential personnel. By easing pandemic restrictions, more employees returned to on-site work. According to our second cycle data, 54.2% of the employed respondents were required to physically attend their workplace.
Figure 4 depicts the transition between job status (including work location) before the pandemic (on the left side) and during the reopening phase after the pandemic lockdown (on the right side). Although most full-time workers who worked on-site before the pandemic returned to their offices after reopening, 26% wanted (and were permitted) to WFH or have a hybrid workplace. This shift doubles the percentage of full-time telecommuters from before the pandemic. The percentage of full-time telecommuters declined from 24% in CASAS 1 to about 19% in CASAS 2. However, 80% of new full-time telecommuters maintained their new habit for over a year. This continuous activity-travel behavior alteration is unprecedented in any other transportation outbreak.
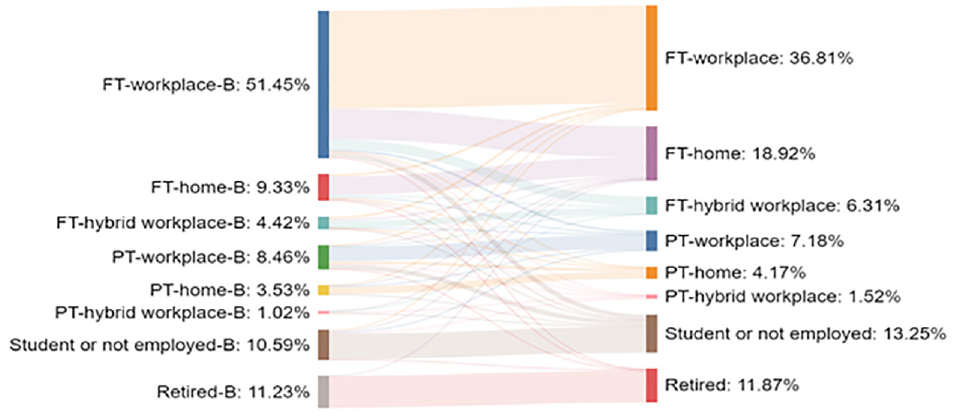
Employment status before the pandemic and during the reopening phase.
Telecommuting Experience
The frequency distribution of telecommuting has shifted since the pandemic (Figure 5). According to Figure 5, 18.5% of workers who had never tried telecommuting before the pandemic did so during the outbreak. Additionally, there is a trend toward more frequent telecommuting during the pandemic than before. For example, the number of people who worked remotely 4 and 5 days a week increased by about 95% and 60%, respectively.
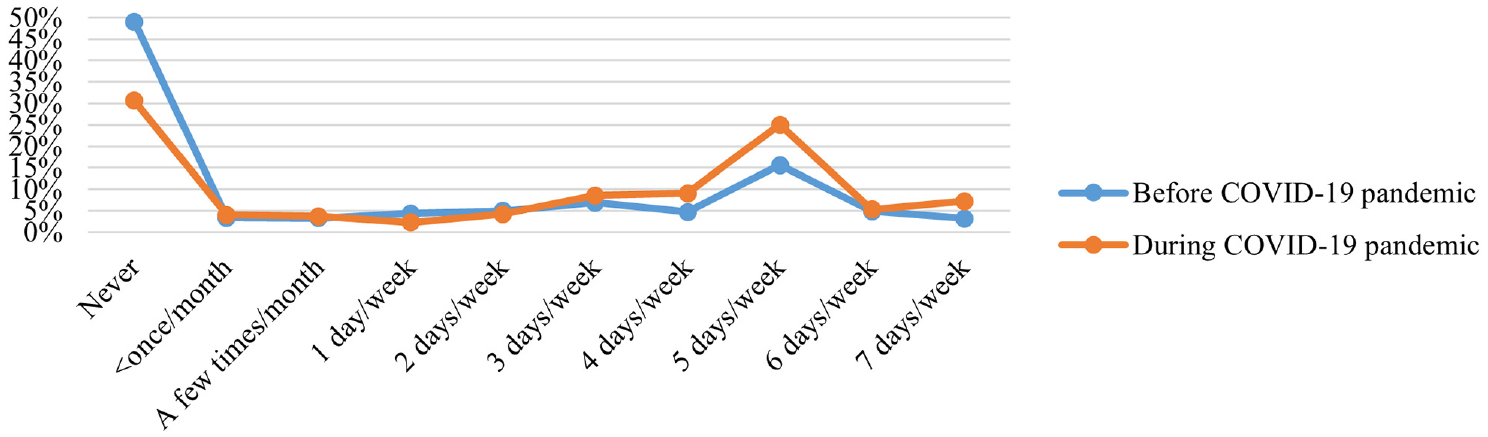
Frequency of telecommuting before and during lockdown (relative to all workers).
Distribution of Telecommuting Types
Not everyone has the same definition or boundaries for telecommuting. From the list of possible options for different forms and meanings of WFH, we picked four types of telecommuting: 1) telecommuting as an employee; 2) owning or collaborating in a home-based business; 3) working as an overflow to a normal workday; 4) working at weekends, holidays, or both ( 39 ). Respondents who had engaged in telecommuting before and during the pandemic were required to pick all suitable types of telecommuting they performed from this list. Figure 6 depicts the distribution of telecommuting types before and throughout the pandemic. According to Figure 6, most new telecommuters were full-time employees who utilized ICT to perform their job obligations, which is consistent with the prior findings from Figure 5.
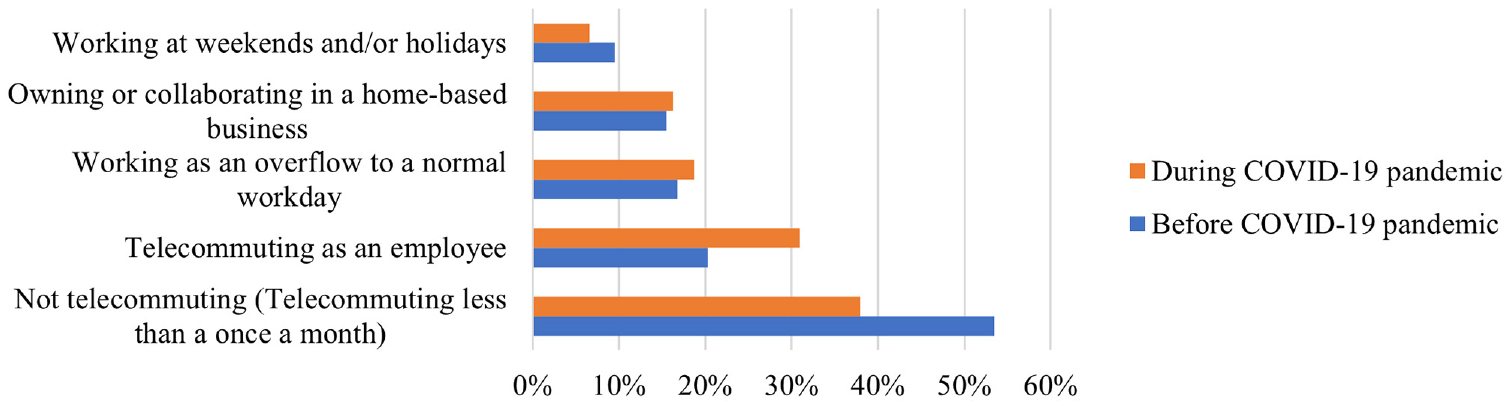
Distribution of telecommuting types before and during lockdown (relative to all workers).
Productivity Changes
Productivity, or work performance, significantly influences telecommuters’ desire to continue WFH. We questioned telecommuters about how their productivity levels had changed compared with before the pandemic and what factors influenced their productivity. The questions and parameters were borrowed from the Future Survey ( 40 ). The results are summarized in Figure 7. Eliminating travel time, more demanding jobs, and a comfortable workspace was cited as having the greatest influence on the growth of telecommuting. Distractions at home, communication, and technical difficulties with technology negatively influence job productivity, whereas working with people and being sick have the least impact. The influence of “concerns” and “distractions” on the decline in productivity is a significant observation. When we return to normal and facilities reopen, particularly daycares and schools, the primary causes of such disruptions will diminish or be eliminated. Additionally, reservations about COVID-19-related matters will no longer be viable. Therefore, when time eliminates these obstacles, telecommuting will become more appealing for those who choose to do so but have been distracted or concerned.
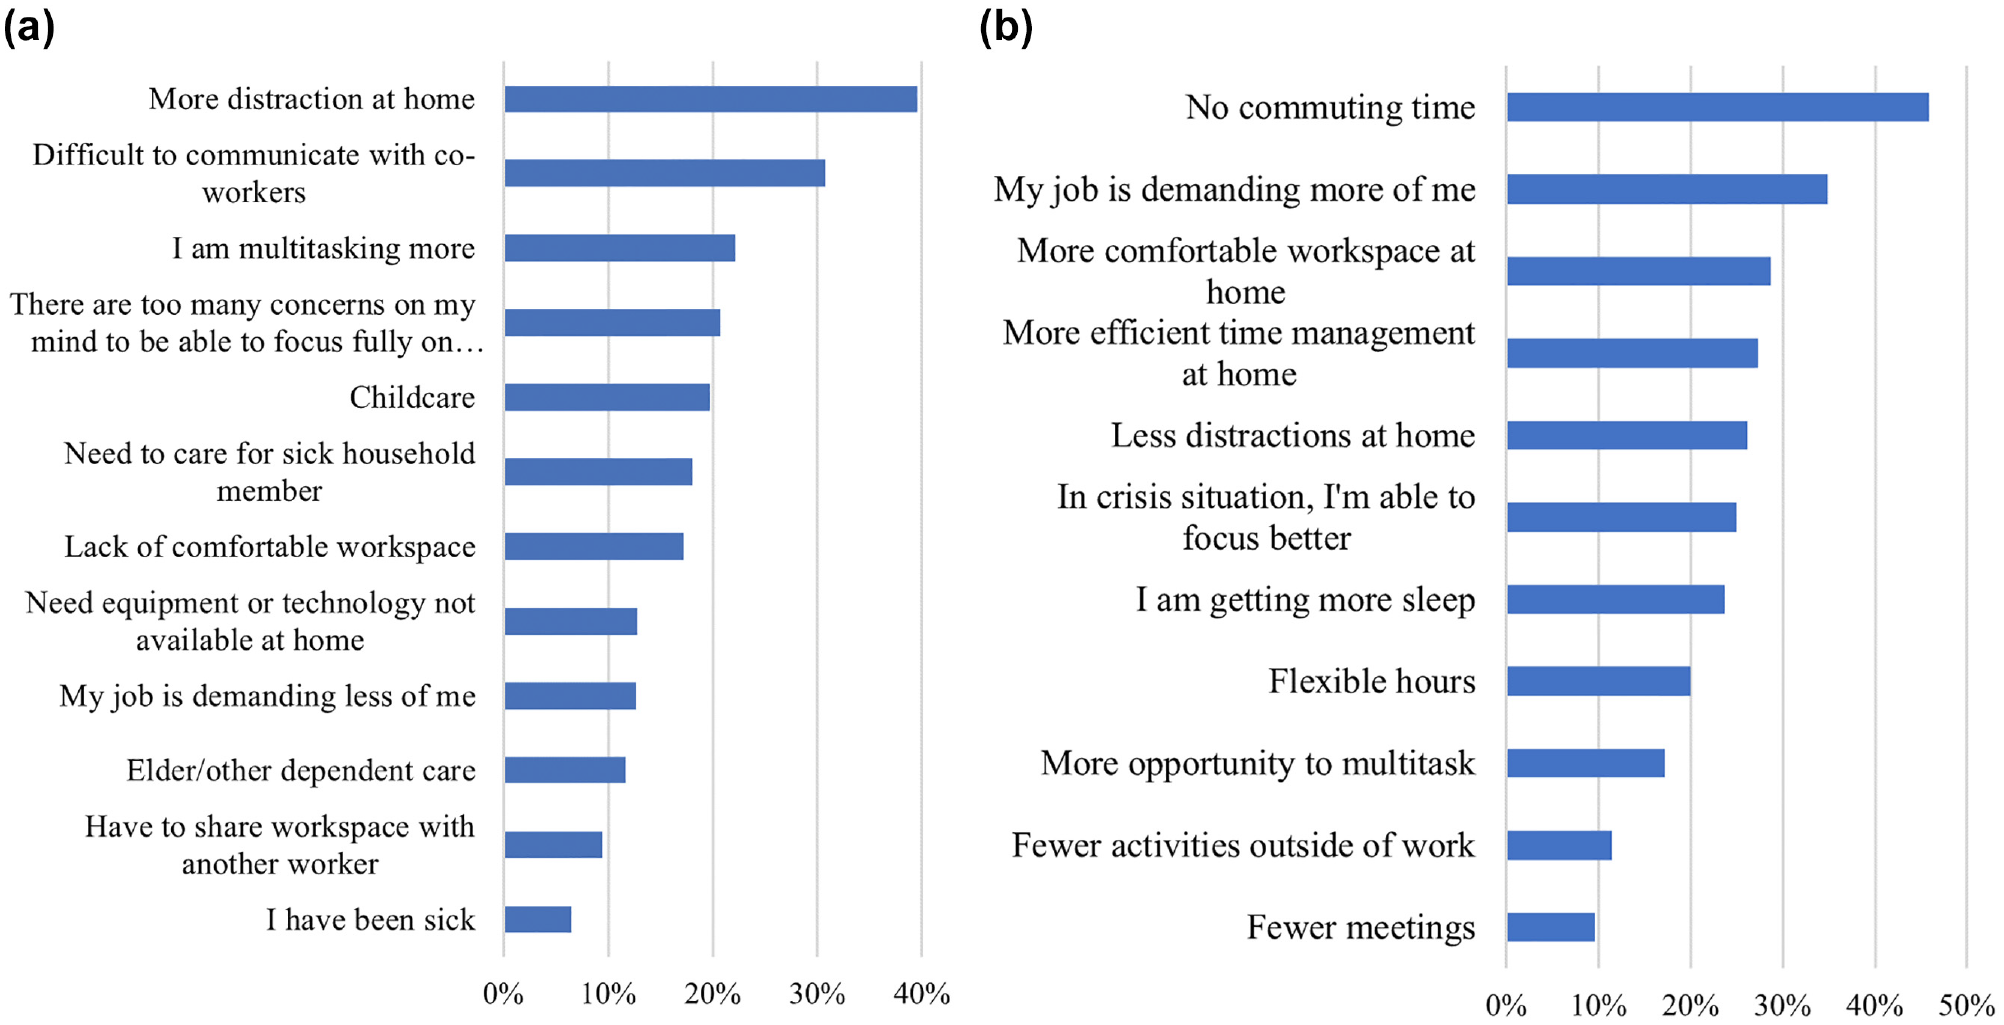
Parameters affecting the telecommuting productivity: (a) reasons for productivity decreased; and (b) reasons for productivity increased.
Work-Hours Flexibility
Flexible work hours were not observed to influence telecommuting productivity considerably. However, this characteristic can be a component that increases the usefulness of telecommuting ( 41 ). This study examined two measures for flexible work hours: shifting work hours (variable start time of the work hours) and splitting work hours (the ability to complete the work hours in several sittings) (Figure 8). According to Figure 8, the COVID-19 criterion has persuaded more businesses to offer flexible work hours, particularly for shifting work hours. Figure 8b indicates that the proportion of employees who were authorized to split their work hours but did not do so has remained unchanged. Therefore, the share drop in “not permitted to split work hours before pandemic” moved to “permitted and used split work hours option during the pandemic.” In other words, those permitted to split their work hours during the lockdown took advantage of the opportunity. No such trend was observed for shifting work hours. These results indicate that employees are more interested in splitting their work hours than shifting them.
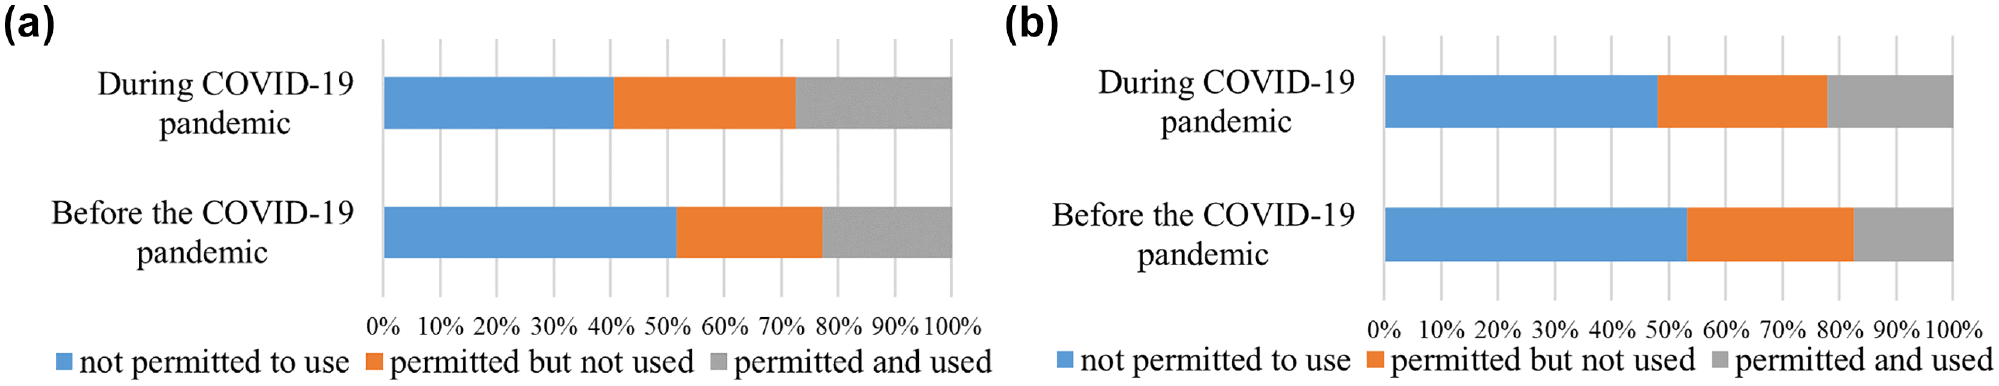
Work-hours flexibility before and since the pandemic: (a) shifting work-hours; and (b) splitting work-hours.
Attitudes Toward Telecommuting in the Future
We asked the participants about their general attitudes toward telecommuting. For these attitudinal questions, we used the Likert scale (strongly disagree, disagree, neutral, agree, strongly agree). A total of 53.6% of respondents agreed or strongly agreed that telecommuting provides more advantages than problems, while 15.6% disagreed. In addition, 61.1% felt that telecommuting should become more prevalent than before, while 9.8% disagreed.
We asked people who telecommuted if they intended to continue doing so when COVID-19 was no longer a concern. Figure 9 demonstrates that a substantial proportion of those who experienced telecommuting during the pandemic are inclined to continue telecommuting regularly in the future. These findings suggest the possibility of a persistent change in activity patterns. To further comprehend the scope of this change, we estimate an integrated choice and latent variable (ICLV) model based on the participant’s responses to this question to identify the influential observed and latent attitudinal variables in workplace choice.
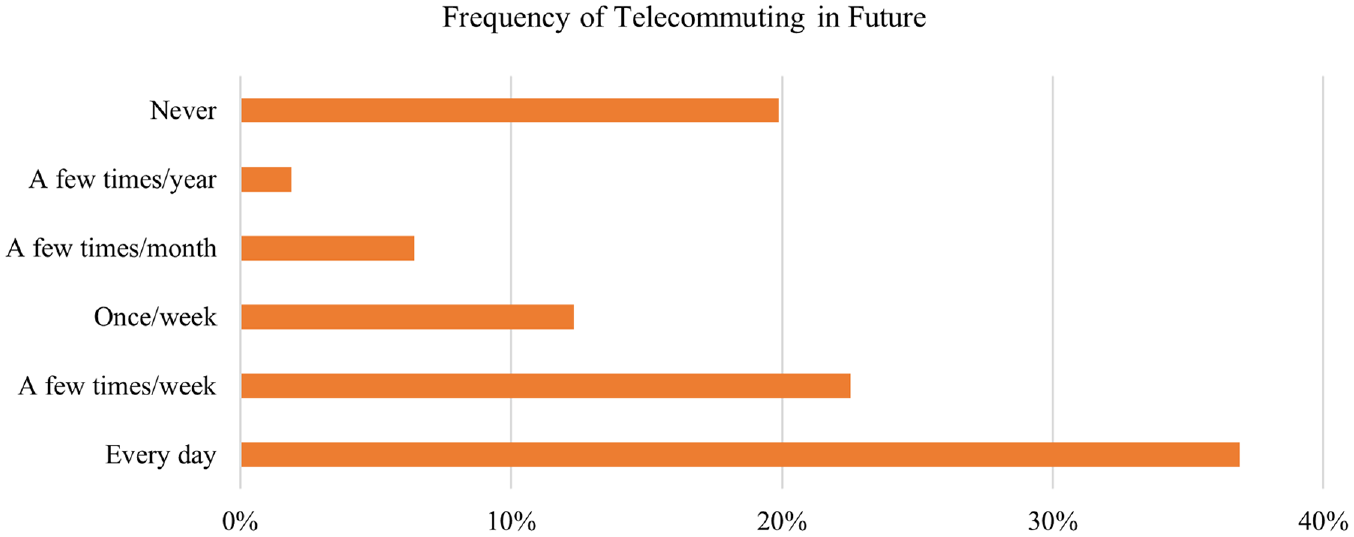
Preference to continue telecommuting in the future.
Method
In this part, we describe the statistical analysis techniques employed later. This article tries to identify the influential variables (observable and latent variables) on workplace decisions in the post-COVID-19 period. To do this, factor analysis was used to identify latent variables. In addition, an ICLV model was estimated to identify significant parameters influencing the selection of telecommuting. The remaining discussion in this section may be divided into factor analysis and the ICLV model.
Factor Analysis
Numerous attitudinal questions are included in the CASAS survey, covering personal viewpoints about work/workplace and COVID-19-related topics. For example, the pros and cons of WFH or at a traditional workplace, changes in work-related activities since COVID-19, and respondents’ feelings about these changes and COVID-related restrictions and precautions. To include the attitude of decision-makers in our research, we extract several latent variables from these attitudinal questions using factor analysis. Factor analysis refers to statistical processes meant to identify the number of unique constructs necessary to explain the pattern of correlations among a collection of measurements ( 42 ). This section defines two forms of factor analysis: exploratory factor analysis (EFA) and confirmatory factor analysis (CFA). Relative reliability and fit measurement checks are highlighted, and the model structure between factors and indicators is introduced.
Exploratory Factor Analysis (EFA)
The purpose of factor analysis is to establish the correlation structure between metrics. EFA is required to identify the correlation structure when there is no clear expectation. Using parallel analysis, it would be possible to determine the optimal number of common factors and the contribution of measurements to each factor (factor loadings). Then, factors (latent variables) can be named/interpreted depending on the weight (load) and mix of measures within each factor ( 42 ).
Parallel analysis determines the optimum number of variables (i.e., comparing the eigenvalues from observed and completely random data). As a result of utilizing oblique rotation to determine the basic factor structure, the factors were connected. Maximum likelihood was used to establish the factor structure and fit the common factor model (i.e., factor extraction) ( 42 ). All the analysis was performed using various libraries (mostly Lavaan and Psych) written in the open-source programming language R ( 43 , 44 ).
Checks of Factor Analysis
EFA-provided factors must be tested for construct reliability, validity, and model fit. The reliability test is to validate the internal consistency of the indicators inside the factors (i.e., to assure that the indicators within each factor measure the same concept) ( 45 ). To test reliability, we used Cronbach’s alpha (also known as Tau-equivalent reliability and coefficient alpha) with a threshold >0.70 ( 46 ). Also, two validity tests—convergent validity and discriminant validity—were performed on all of the notions (presented in Table 1). Table 1 exhibits symmetry along its diagonal, with extraneous information omitted to minimize numerical overload. All of the constructs’ average variance extracted (AVE) values exceeded the AVE cut-off of 0.50, which is required for convergent validity. The square root of the AVE of each construct should be computed and compared with the correlation between the constructs to determine the discriminant validity. The intercorrelation between the constructs was observed to be higher than all square roots. The results of this investigation proved the validity of the described constructs.
Validity Test Results of the Latent Constructs
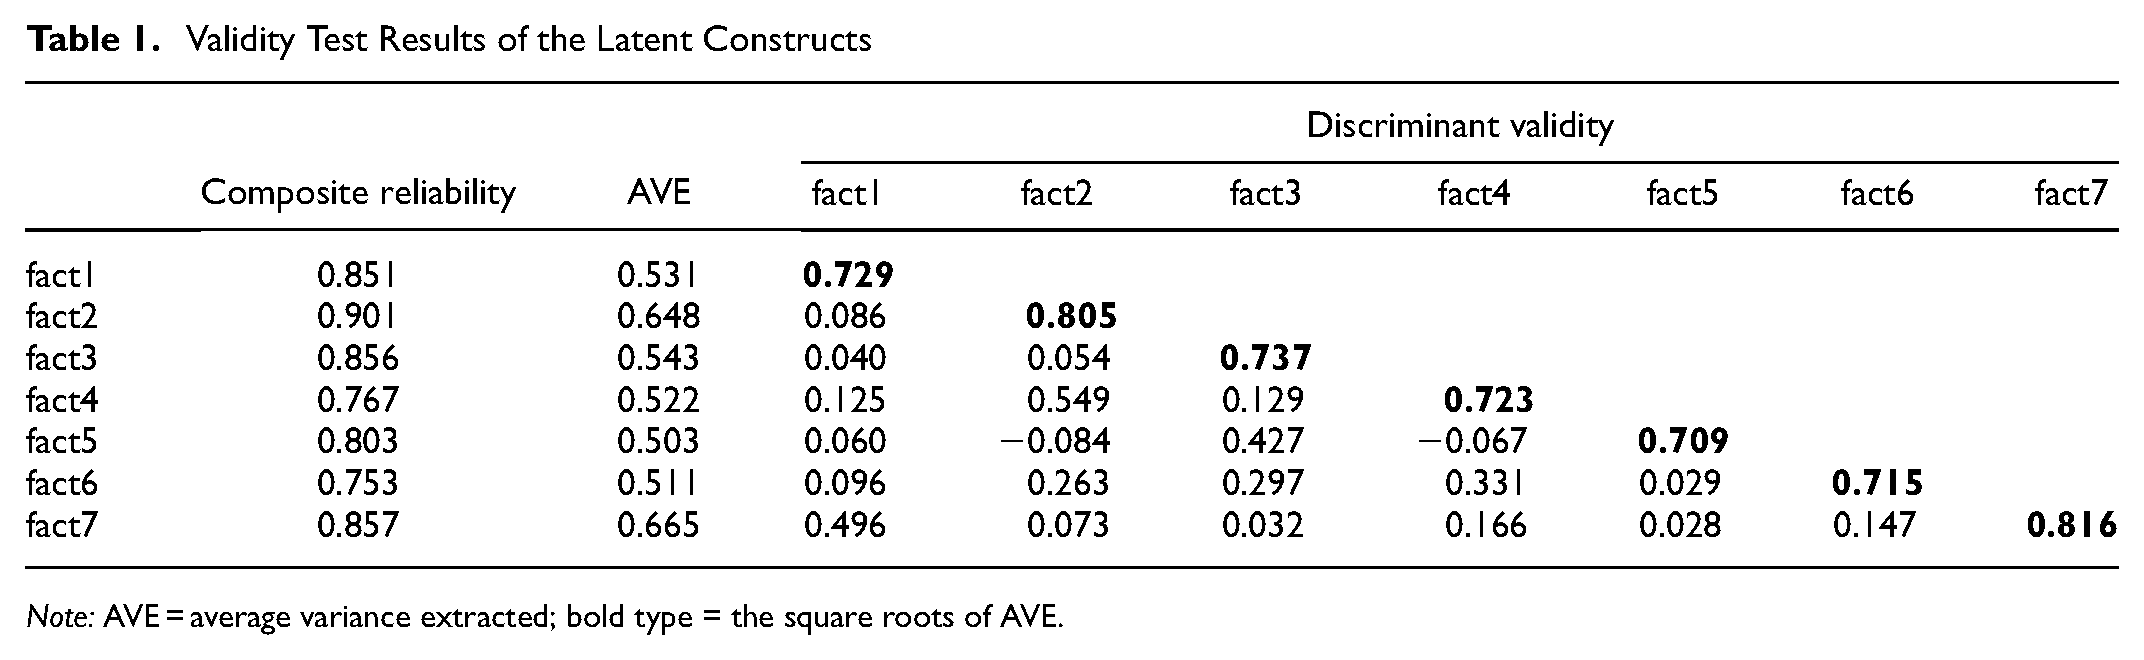
Note: AVE = average variance extracted; bold type = the square roots of AVE.
In addition, we assess the goodness of fit of the EFA structure. Root mean square error of approximation (RMSEA), standardized root mean square residual, Tucker–Lewis index, and comparative fit index are only a handful of the many available tests for determining the quality of fit. In Table 2, we summarized the reported values of these tests for the factor structure created by EFA and the cut-off values that indicated a good match. As shown, some of these tests do not meet the threshold requirements. This indicates that the extracted factor structure requires modification. Based on the residual correlation, one proposal is to alter the factor structure (break the current factors or define new ones). The revised factor structure must be retested using CFA.
Summary of Values and Thresholds for Goodness-of-Fit Measures
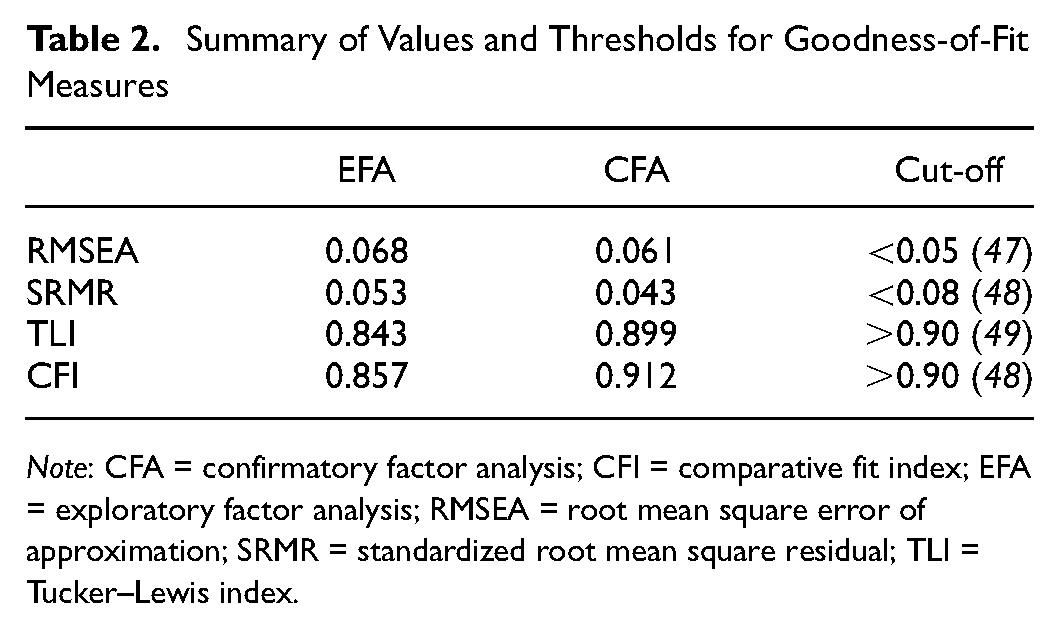
Note: CFA = confirmatory factor analysis; CFI = comparative fit index; EFA = exploratory factor analysis; RMSEA = root mean square error of approximation; SRMR = standardized root mean square residual; TLI = Tucker–Lewis index.
Confirmatory Factor Analysis (CFA)
We redesigned the components to enhance the fit indices by modifying the EFA-suggested structure. Table 3 presents the updated factor loadings and factor structure. Comparing the findings of CFA and EFA (Table 2) indicates that the fit of CFA has improved and can now satisfy the tests’ limitations for all but one test (RMSEA). Thus, we successfully introduced a few latent variables that may be utilized to estimate statistical models in the future. The significance of these latent variables will be evaluated using an ICLV model later in this paper.
Factor Structure and Factor Loadings (from Confirmatory Factor Analysis)
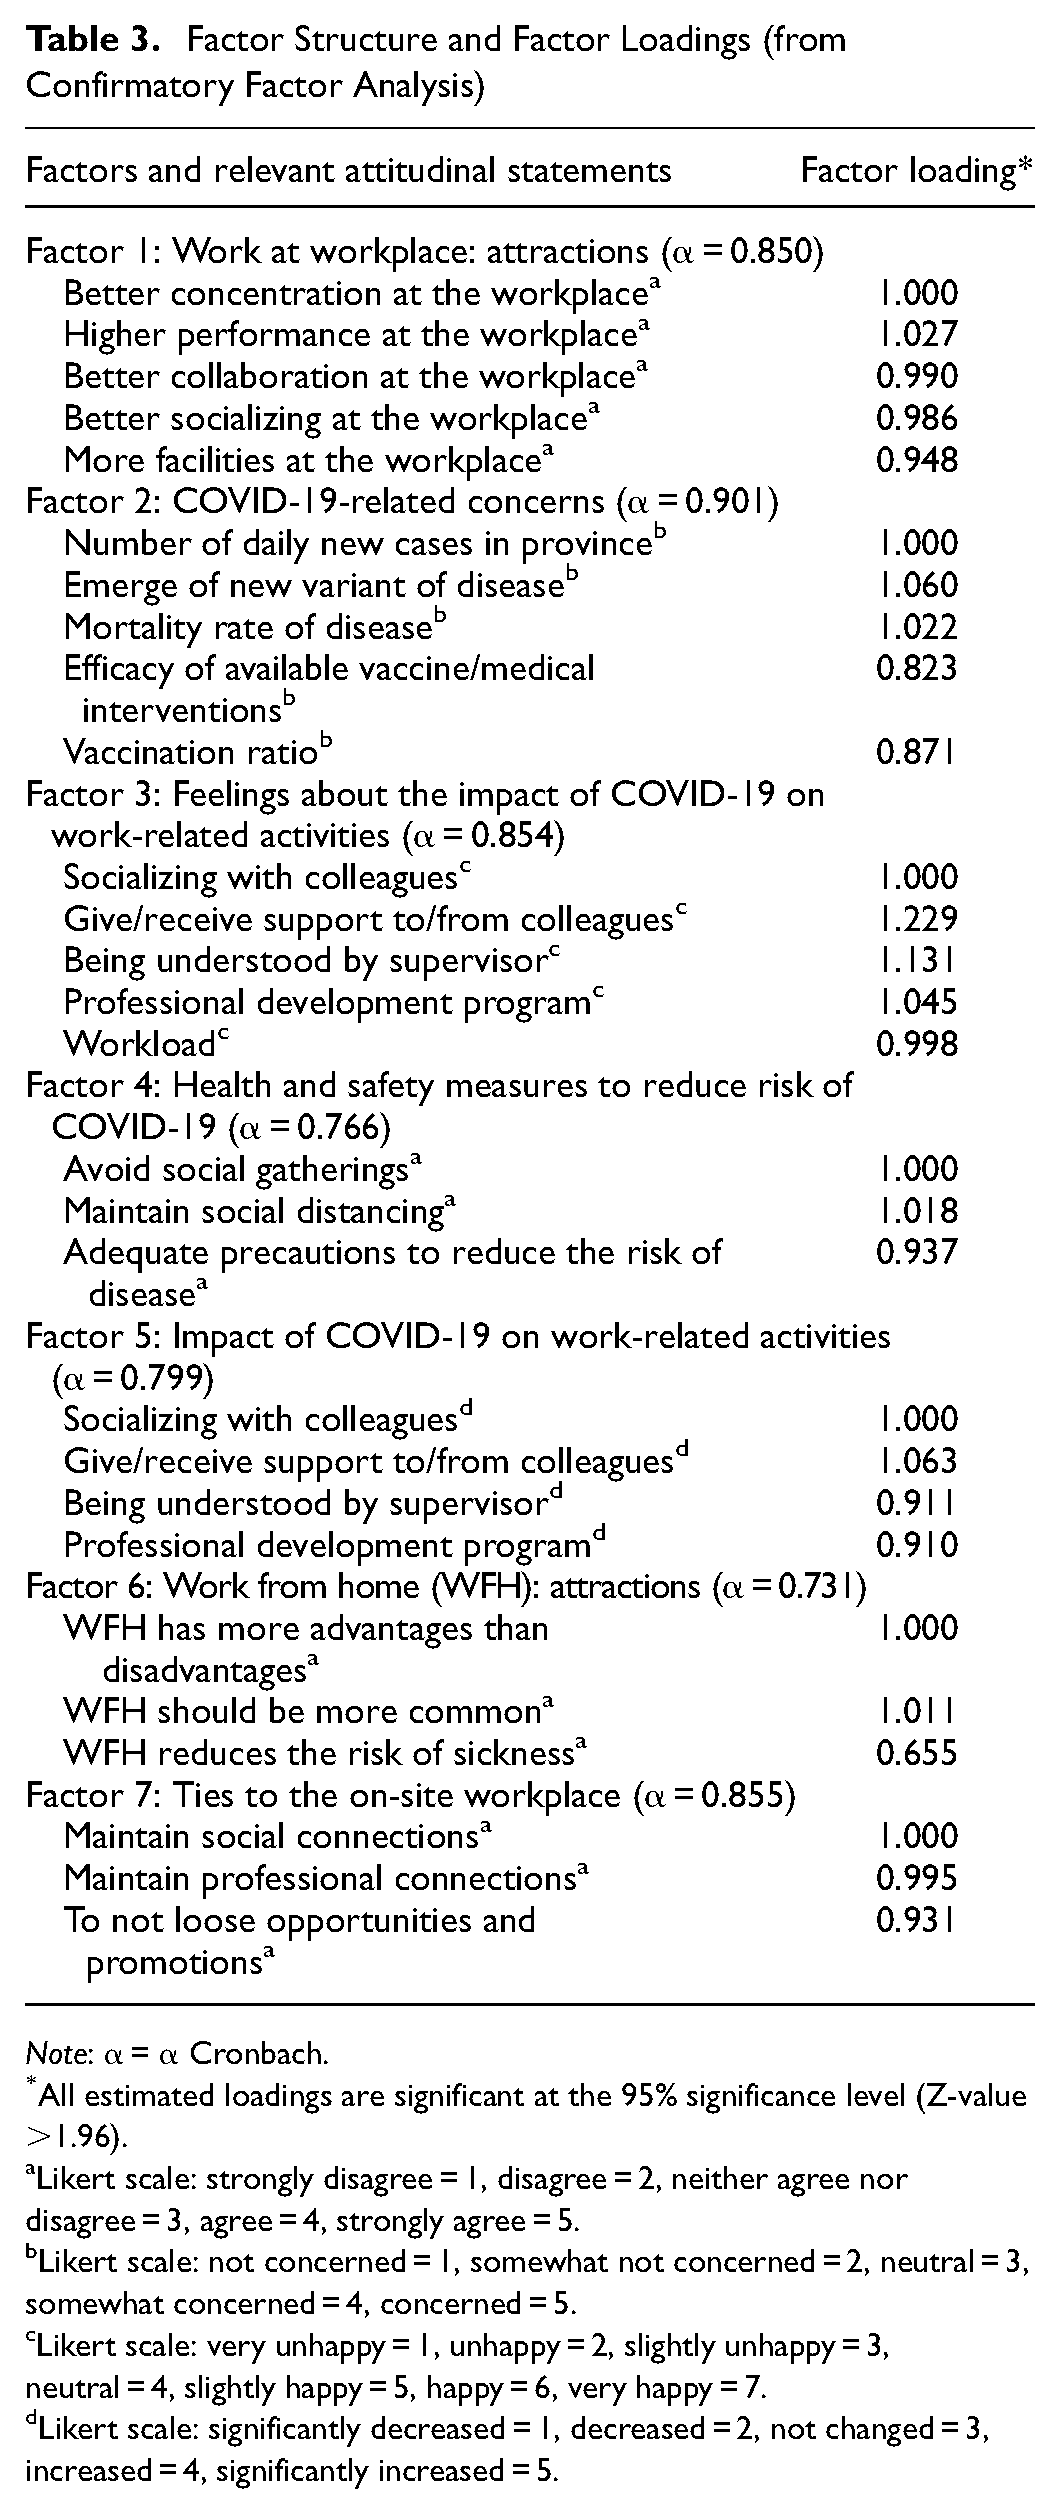
Note: α = α Cronbach.
All estimated loadings are significant at the 95% significance level (Z-value >1.96).
Likert scale: strongly disagree = 1, disagree = 2, neither agree nor disagree = 3, agree = 4, strongly agree = 5.
Likert scale: not concerned = 1, somewhat not concerned = 2, neutral = 3, somewhat concerned = 4, concerned = 5.
Likert scale: very unhappy = 1, unhappy = 2, slightly unhappy = 3, neutral = 4, slightly happy = 5, happy = 6, very happy = 7.
Likert scale: significantly decreased = 1, decreased = 2, not changed = 3, increased = 4, significantly increased = 5.
Integrated Choice and Latent Variable (ICLV) Model
ICLV is a method and framework for incorporating latent variables, namely attitudes and perceptions, into choice models. To avoid inconsistent estimates, the latent variable and the choice model are estimated simultaneously in the ICLV model, as opposed to sequential estimation. The approach needs the estimate of an integrated multi-equation model comprised of a discrete choice model and the structural and measurement equations of the latent variable model. Simultaneously, the integrated model is estimated with a maximum likelihood estimator in which the likelihood function incorporates complicated multidimensional integrals ( 50 ).
Including psychological aspects results in a more accurate behavioral portrayal of the decision-making process and, therefore, enhanced explanatory power. As demonstrated in the preceding section, we examined the distribution of several COVID-19-related characteristics and personal attitudes that may influence the selection of a workplace. We are estimating the ICLV model to capture the effect of these latent variables on our choice model and improve its explanatory power. The ICLV model’s conceptual framework is depicted in Figure 10.
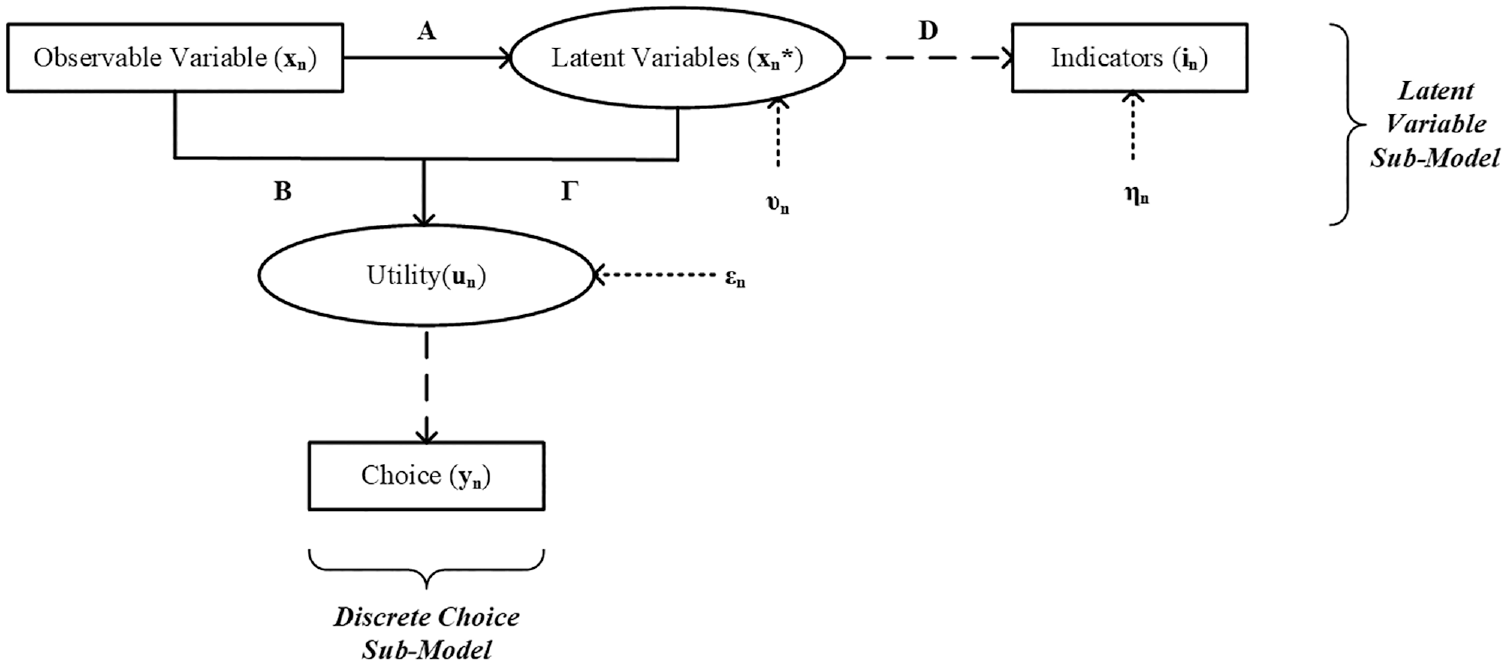
Framework of the integrated choice and latent variable model.
There are two distinct parts to the general formulation for ICLV: a latent variable model and a multinomial discrete choice model. The utility of the alternatives in the discrete choice component may be influenced by both the observable and latent properties of the alternatives as well as the characteristics of the decision-makers. Following the random utility maximization model, utility as a theoretical concept is operationalized by presuming that individuals select the option with the highest utility. The latent variable component is adaptable because it allows for simultaneous linkages between latent variables and the influence of observable exogenous variables on latent variables. Using such a definition, the researcher can separate the direct and indirect impacts of observable and latent factors on the utility of the alternatives. Many indicators, such as responses to Likert-scale survey questions, are supposed to measure the latent variables. Typically, the model is represented mathematically by the following set of four equations ( 51 ):


where
un = the (J× 1) vector of utility of each of the J alternatives as seen by decision-maker n, which influenced by observable explanatory variables (xn, the (K× 1) vector) and latent explanatory variables (x*n, the (M× 1) vector),
B = the (J×K) matrix of model parameters representing observable variable sensitivities,
Γ = the (J×M) matrix of model parameters representing latent variable sensitivities,
εn = the (J× 1) vector representing the stochastic portion of the utility specification,
A = the (M×K) matrix of model parameters that represents the structural relationship between the latent and observable variables,
υn = the (M× 1) vector that represents the stochastic component of this relationship,
in = the (R× 1) vector of indicators utilized to measure the latent variables and supposed to indicate deviations from the mean,
D = the (R×M) matrix of model parameters representing the sensitivities of measurement indicators to latent variables,
ηn = the (R× 1) vector representing the stochastic component of the measurement equation,
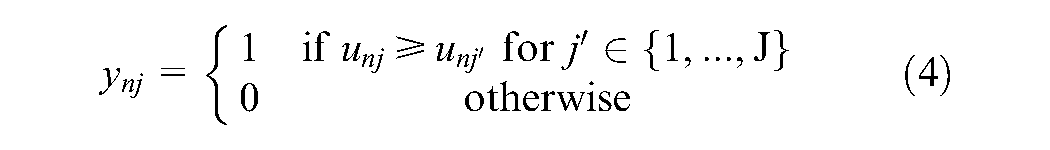
ynj = the choice indicator, which is equal to one if the decision-maker selected alternative j and zero otherwise.
The stochastic components εn, υn, and ηn are assumed to be mutually independent. Assuming that εnj is Independent and Identically Distributed (i.i.d.) Gumbel across alternatives and decision-makers with location zero and scale one, the probability that decision-maker n chooses alternative j can be calculated from Equation 4 to get the following functional form:
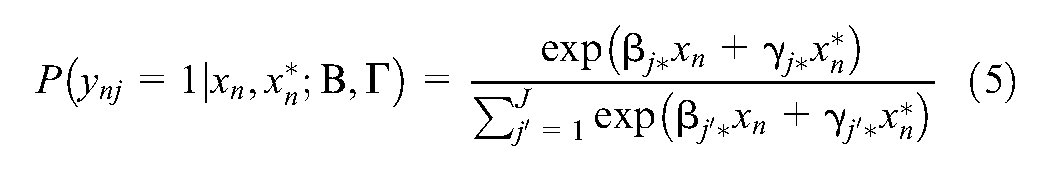
In the measurement equation (Equation 3) that relates indicators to the latent variable, as the indicators were attitudinal questions with Likert scale responses, the ordered regression model was utilized (see Daly et al.) ( 52 ). The estimated model is presented in the next section, results are discussed, and popular significance and prediction-power tests are reported.
Results
This section gives the findings of the estimated ICLV model for “perceived decision of workplace in the post-COVID era.” We modeled participants’ workplace choices using their desired frequency of telework. It is noteworthy that participants were instructed to select their place of work under the assumption that their employers do not impose any duty for them to attend their conventional workplace physically. Respondents were required to select one of the following six options: 1) every day, 2) a few times a week, 3) once a week, 4) a few times a month, 5) a few times a year, and 6) never. We altered the answers to this question into a workplace choice scenario with three options: 1) WFH (when 1 was selected), 2) hybrid workplace (when 2 or 3 were selected), and 3) working on-site (when 4, 5, or 6 were selected). An estimated ICLV model was used to identify the influential variables affecting the perceived teleworking frequency selection. We checked the impact of observed and latent variables extracted in the previous section. The R programming language package Apollo ( 53 ) was utilized to estimate the model.
Table 4 summarizes the choice model components and their goodness-of-fit measures, structural relationships, and measurement equations. All but some factors in the choice model were judged to be statistically significant at the 95% confidence level. These insignificant variables were retained because they provide insight into an important trend in the data and enhance the interpretive capacity of the model. Although certain researchers may object, several distinguished scientists endorse this methodology ( 54 ).
Estimation Results for Choice Model Components
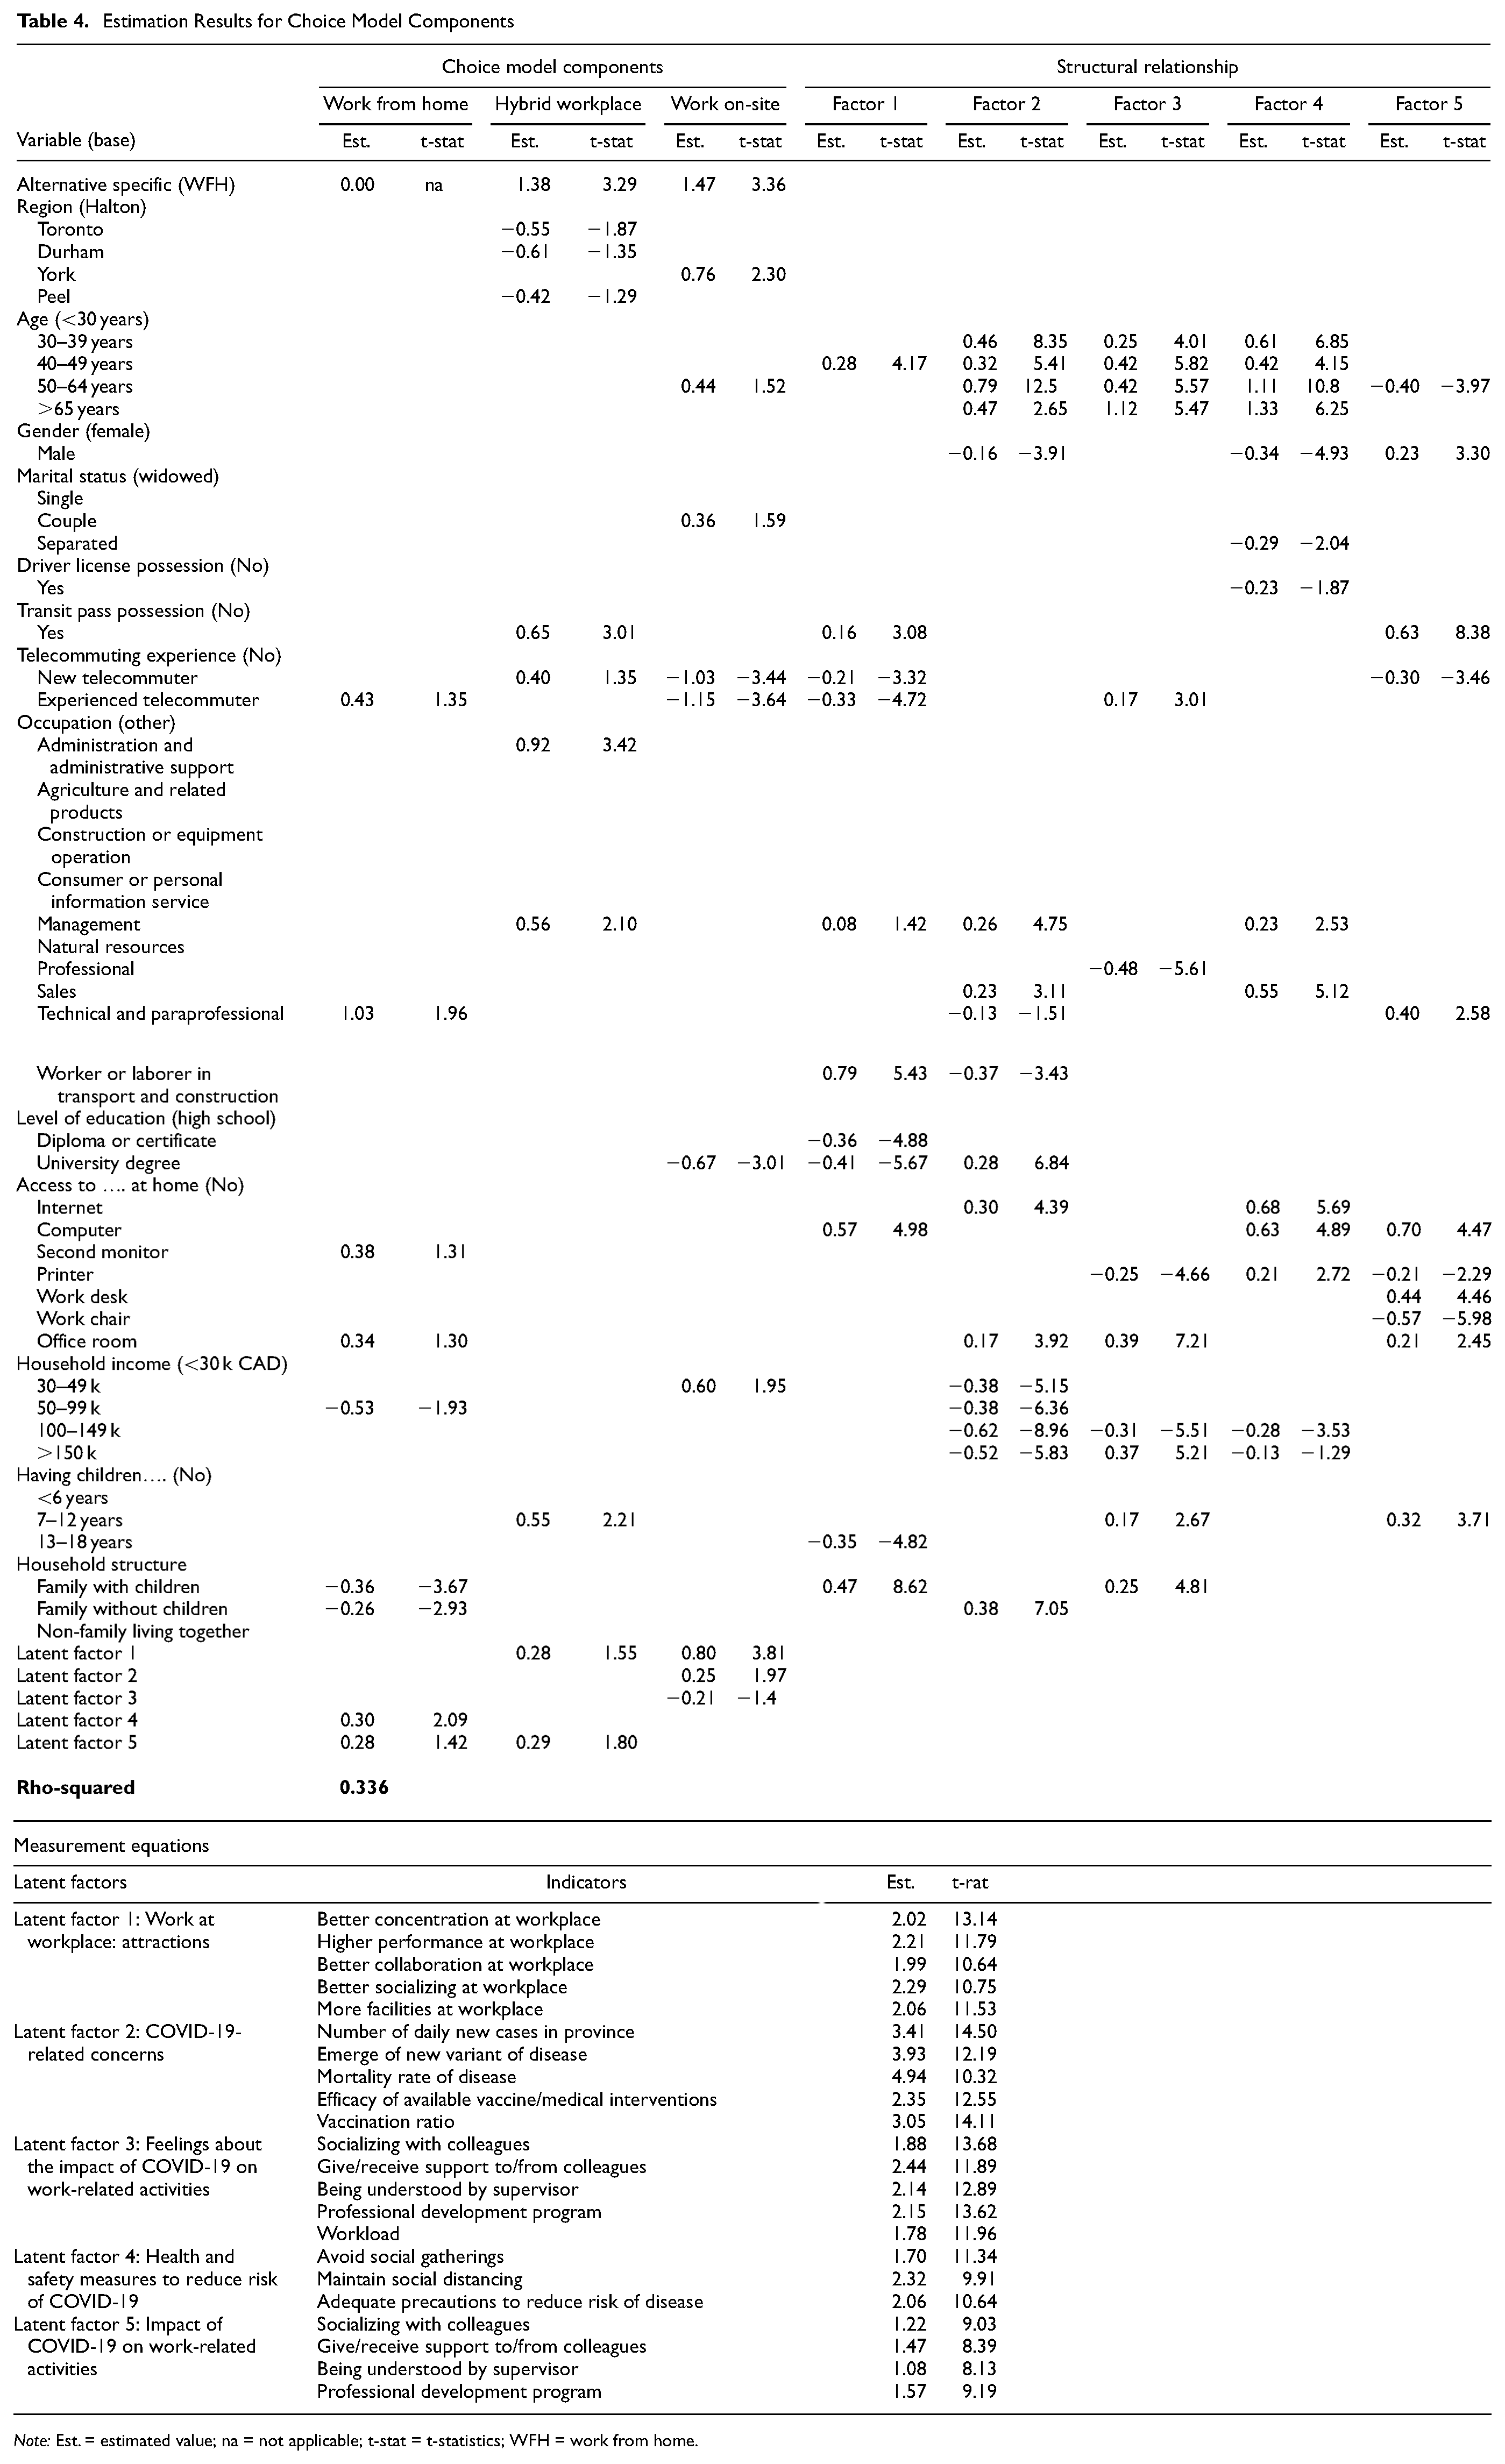
Note: Est. = estimated value; na = not applicable; t-stat = t-statistics; WFH = work from home.
According to the results of the estimated choice model, respondents with higher levels of education and younger ages had a greater interest in WFH. To put it another way, older people are less likely to use the internet and other forms of ICT, and the limitations imposed by technology continue to be a significant issue that prevents older people from telecommuting. On the other hand, persons with a higher degree of education have a better chance of finding remote jobs because of their proficiency in ICT.
The model reveals that prior telecommuting experience (at least once a month before the pandemic) positively influenced post-pandemic distant employment selection. Those with some experience with telecommuting before the pandemic insisted on continuing to do so more regularly, while novice telecommuters (i.e., those with no/less than once-a-month experience of telecommuting before the pandemic) enjoyed the experience and planned to pursue a hybrid workplace. This conclusion reinforces the idea that society’s experience with telecommuting was pleasant, and this positive memory will ensure telecommuting’s continuation in the post-pandemic period.
For some other sociodemographic factors included in this estimation, significant effects were differentiated for residence location, marital status, and income. However, gender was shown to have no significant effect on workplace selection. Certain occupation groupings, such as management, administration, and technical, embrace telecommuting more than others, as these positions are well-suited for remote work. Telecommuting is more desirable when there is a designated area at home for work and the appropriate equipment. Possession of a transit card membership, indicative of regular public transit usage or mainly out-of-home travel, suggested an individual’s propensity for on-site employment.
In addition, the modeling approach reveals that five out of seven distinguished latent variables are significant. The findings indicate a positive correlation between the preference for off-site workplaces and adherence to COVID-19 restrictions and protection measures among the respondents. Also, the results demonstrate a positive correlation between Factor 1 and on-site workplace, confirming the hypothesis that individuals who see conventional workplaces as more appealing are more likely to express a greater interest in on-site or hybrid work arrangements. On the contrary, certain groups have derived benefits from the possibility of telecommuting and perceive on-site employment as less desirable. A negative correlation between Factor 5 and on-site selection suggests that certain groups of individuals have reported experiencing more positive interactions with their coworkers and supervisors, forming stronger social relationships, and achieving professional growth as a result of choosing the off-site option. Furthermore, the findings of Factor 3 indicate that the positive emotions experienced by individuals who telecommute serve as an additional motivating factor for their aversion toward returning to physical workspaces.
An observed correlation exists between the selection of on-site workplaces and concerns related to COVID-19 (Factor 2). Two interpretations come to mind for this phenomenon. Individuals who are required to be physically present at their place of employment may express apprehension over updates about the transmission of COVID-19, the emergence of novel variations, and mortality rates. Because of the direct correlation between their earnings and physical presence in the workplace, individuals exhibit heightened sensitivity toward any alterations in the prevailing COVID-19 situation. Furthermore, persons who have a greater inclination to resume working in their physical workplaces exhibit a heightened level of anxiety about COVID-19 indicators. The members of this group may exhibit a strong inclination toward an on-site workplace, with their apprehension of COVID-19 being the sole impediment preventing their return.
Policy Analysis
The lifestyle change brought on by the COVID-19 pandemic restriction had a direct impact on people’s travel habits. Daily journeys decreased substantially, and the demand for public transportation dropped. With the end of the virus’s dissemination, some of these new tendencies are anticipated to partially revert to their prior state. For example, individuals who did not use public transportation because of fear of disease transmission can return to this service by eradicating the risk of disease. In addition, reopening administrative and commercial hubs will revive a portion of demand. However, it cannot be denied that the unique experience of the pervasive closure of COVID-19 made everyone and policymakers aware of the tremendous potential of outdoor activities and the possibility of substituting them for interior activities. How willing individuals are to continue working remotely in the future is a crucial matter for policymakers.
As demonstrated in this study, the answer to this question can vary based on factors such as individual characteristics, work environment, company policies, and personal attitudes and emotions. This research aimed to incorporate some of these variables into the advanced model employed in this study and investigate their effects. These effects were extensively discussed in the preceding sections. We observed that, in our society, people always choose to work outside the home based on existing conditions (external compulsion or personal preference). This presumption that it is feasible or desirable to do all job tasks remotely is extremely far from the truth. However, the results revealed that a significant portion of individuals who previously lacked the experience or desire to perform remote work, if the option is available, currently choose remote work. The growing demand for remote work is an indisputable reality that transport policymakers and business proprietors should consider in the future.
Employers and employees face unique difficulties in finding a method for both parties in workplace selection. There are several reasons why companies may not want their employees to telecommute, including a lack of supervision and communication, training requirements, and accountability checks. For instance, companies may believe remote work impedes managers’ ability to supervise and direct employees. Or, they believe that telecommuting reduces the social connections of employees, thereby diminishing their sense of belonging to the company and the workplace. Therefore, it was natural to assume that, after the end of the COVID-19 pandemic, companies would increase their pressure to bring employees back to their offices.
On the other hand, some employees who had a positive experience working remotely during the pandemic will attempt to deal with the pressure as best they can. For this reason, employers and workers must reach a compromise. According to the findings of this study, the most popular solution among employees is the ability to work in a hybrid capacity. It is anticipated that this work method will be highly regarded as the dominant method in the days following the pandemic because it enables individuals to have a flexible work schedule while simultaneously allowing businesses to achieve their goals.
Conclusions and Future Works
This study evaluated the work behavior of respondents before, during, and after the COVID-19 pandemic. We used a sample of 1,000 residents of GTA. They participated in a web-based survey in July, 2021, about the influence of COVID-19 on activity-travel schedule alterations. A descriptive analysis was presented to comprehend the shift in usage of in-person and ICT-based methods of conducting work activity and related subjects during the pandemic compared with before the pandemic, and the likelihood of their continuation after the pandemic. In addition, exploratory and confirmatory factor analyses identified latent attitude variables. Then, these characteristics were used to estimate an ICLV model of the perceived selection of workplace post-pandemic.
Our findings indicate that in summer 2021 (during the data collection time), responders remained apprehensive about the possibility of a new COVID-19 variation. Even though more than 73% of the sample had at least one dose of the vaccine, they were unsure about its effectiveness. In addition, the stability and future significance of the new routines was the central topic we sought to answer in this study. Work activity appeared to be performed from home by half of the employed respondents during the pandemic. Almost 70% of respondents indicated that telecommuting was desired for at least a few days per week. The employed respondents cited a comfortable workspace and the elimination of commuting time as contributing to their enhanced productivity when telecommuting. In addition, communication difficulty and distractions are two factors that hinder the efficiency of telecommuters. Employers should know that allowing a hybrid workplace can increase employees’ happiness. They can also increase workplace productivity by offering a more pleasant environment. Employees may also choose many carrier hubs dispersed across the city rather than one central hub, to avoid commute time.
Using a complex statistical model, we could account for the direct and indirect effects of observable factors and latent variables on workplace selection. We successfully introduced significant attitudinal factors representing participants’ perceptions in real-world decisions. The model validated the favorable effect of telecommuting experience on people’s desire to continue doing so. In addition, the model accounted for the influence of several sociodemographic and attitude characteristics on workplace choices.
Finally, here are suggestions for future research. First, the survey can be recalled now that things have returned to normal. It can provide further comparison data for long-term behavior modification. One may also apply dynamic models to future research using panel data from CASAS cycles (after filtering for individuals who attend both cycles). To test the generalizability of the attitudinal factors, the derived latent variables might be validated by additional research in regions other than GTA or Canada. Lastly, one might utilize the latent factors identified in this study to examine their impact in another survey.
Supplemental Material
sj-docx-1-trr-10.1177_03611981241274650 – Supplemental material for On the Selection of Workplace in the COVID-19 Era Using Attitudinal Factors
Supplemental material, sj-docx-1-trr-10.1177_03611981241274650 for On the Selection of Workplace in the COVID-19 Era Using Attitudinal Factors by Alireza Dianat and Khandker Nurul Habib in Transportation Research Record
Footnotes
Acknowledgements
We thank several colleagues and friends for their helpful comments when developing the survey. Also, Alireza Pourabdollah for his help reviewing the draft, and Jason Hawkins for his help with the first cycle of the CASAS survey. Finally, we must thank Sanjana Hossain and Patrick Loa for their great discussion and help.
Author Contributions
The authors confirm contribution to the paper as follows: study conception and design: A. Dianat, K. Habib; data collection: A. Dianat, K. Habib; analysis and interpretation of results: A. Dianat; draft manuscript preparation: A. Dianat, K. Habib. All authors reviewed the results and approved the final version of the manuscript.
Declaration of Conflicting Interests
The author(s) declared no potential conflicts of interest with respect to the research, authorship, and/or publication of this article.
Funding
The author(s) disclosed receipt of the following financial support for the research, authorship, and/or publication of this article: An NSERC Discovery Fund and Percy Edward Hart Professorship Fund funded the study.
Supplemental Material
Supplemental material for this article is available online.
References
Supplementary Material
Please find the following supplemental material available below.
For Open Access articles published under a Creative Commons License, all supplemental material carries the same license as the article it is associated with.
For non-Open Access articles published, all supplemental material carries a non-exclusive license, and permission requests for re-use of supplemental material or any part of supplemental material shall be sent directly to the copyright owner as specified in the copyright notice associated with the article.