
Abstract
Urban transportation systems' structure and functionality can be affected by unexpected disruptions for several reasons, such as natural hazards, intentional attacks, accidents, and so forth. The conventional definition of resilience is the capacity to withstand, assimilate, adjust, and expeditiously recuperate from various forms of perturbations such as shocks, disturbances, and deliberate attacks. Though multiple studies in the literature focus on resilience assessment and improving the resilience level of mobility services before disruption, few studies offer solutions for the operators of transportation systems during disruptions to alleviate their negative effects, such as reducing the recovery time. In this context, a new paradigm called ``resilience as a service'' (RaaS) has emerged in the field of operations management. The idea of RaaS is to integrate the available resources of different service providers to manage disruptions and maintain the system's resilience. This paper proposes a definition of RaaS dedicated to transportation systems. To provide a methodological example for the RaaS paradigm, we formulate a bi-level optimization problem to represent a solution example that RaaS providers can deliver. The upper-level model formulates the resource reallocation problem during disruption from the perspective of RaaS providers, while the lower-level model considers user perspectives. We provide a numerical example in a real test case of a French city to illustrate the benefits of implementing a RaaS solution. The results show that we can reduce the average travel delay of all users by 69%, including the delay results from the proposed RaaS strategy compared with the absence of RaaS.
Keywords
Disruption can happen in different circumstances based on various factors, ranging from catastrophic natural hazards such as earthquakes and extreme weather conditions to manufactured disasters such as terrorist attacks, severe congestion, and road construction. They are distinguished by their rapid evolution and severe effects on transportation systems during and after the impact of disruption. Distribution of any kind can result in a host system experiencing various issues, which can be measured by performance indicators that signify cost. For instance, in France in 2018, 340 million minutes of people’s time lost from transport failures and delays ( 1 ). Making transportation systems more resilient against those disruptions to maintain public safety and comfort has become a priority agenda for many urban transport authorities. It is considered a critical skill to build modern and intelligent transportation systems.
The concept of resilience was first introduced by Holling ( 2 ) in 1973 to define an ecological system’s capacity to withstand disruption under stress and return to a stable condition. It was then introduced in other fields, such as ecology, disaster management, risk engineering, and so forth. In the transportation engineering and science field, resilience is defined as the ability of a transportation system to maintain its structure and functionality in the face of disruptions ( 3 ). Many studies have been undertaken to measure the resiliency of transportation systems based on various indicators, for example, robustness, reliability, redundancy, resourcefulness, rapidity, and so forth ( 4 ). However, most of the works only focus on scanning the disruption and do not propose a framework able to provide practical solutions in the event of disruptions. In addition, the state of the art in urban transport resilience is considerably limited to investigating either one scenario of disruption or a single mobility service ( 4 , 5 ). In this study, we focus on a new paradigm in resilience that is mostly dedicated to managing various types of disruption in multimodal transportation systems.
The development of transportation systems and networks in urban areas and high mobility (population movement) requires innovative solutions to increase the service reliability and robustness of the system. Recently, a new paradigm has been introduced in the context of resilience. It is called “resilience as a service” (RaaS) and was first introduced in the literature in the field of cloud computing by ( 6 ). The general idea of RaaS is to support the disrupted component of the system by using the operating or reserved resources of other components unaffected by perturbations.
In this paper, we aim to define RaaS in transportation systems. To illustrate the concept of RaaS, we need to take into account the complexity and challenges of modern transportation systems. To this end, we investigate recent approaches that have similarities with RaaS. In particular, we focus on mobility as a service (MaaS), which is a recent paradigm in transportation systems. MaaS has resemblances with RaaS contextually, but they differ in architecture, as they have different objectives. The idea of MaaS is to provide integrated packages of transport, including multiple services based on travelers’ needs. In other words, people can buy mobility services that are provided by the same or different operators by using just one platform and a single payment ( 7 ). MaaS has been welcomed as a sustainable alternative to car travel as it is environmentally friendly. In response to this conceptual revolution that is currently taking place, some cities (e.g., Helsinki, Vienna, Tokyo) are making an effort to switch to centralized systems, even though mobility services are often provided by decentralized operators.
In the context of resilience, a new management solution is required for both centralized and decentralized mobility services to maintain the highest level of service while lowering the risk of disruptions and the effects of perturbations. In this paper, we define RaaS as a management system for the different mobility service providers, enabling them to integrate their operating and reserved resources to reduce the recovery time from any kind of disruption. In particular, RaaS aims to empower multimodal transportation systems by outlining a management mechanism to reduce the recovery time from a disruption event. RaaS can be interpreted as a kind of agreement between multiple mobility service providers to reallocate their operating resources during disruptions for a fast recovery of the entire system.
Turning to the organization of this study, we first perform a comprehensive literature review on resilience in transportation systems which will enable us to propose a standard definition for the RaaS paradigm. Second, to illustrate how a RaaS system can be designed and operated, we propose a mathematical framework to make an example of how it can contribute to transportation systems. Third, we apply the proposed methodology to a real test case of public transport in the city of Rennes in France to validate our framework and show the effectiveness of RaaS in an urban area. The remainder of the paper is organized as follows. A literature review on transportation resilience and RaaS is presented in the next section. The results of the literature review lead us to propose the definition of RaaS at the end of that section. A methodological framework for RaaS is presented in the third section, then the numerical experiment and its results are detailed. Finally, we conclude this study and mention our future works in the last section.
Literature Review and Contribution Statement
We present a literature review on transportation system resilience to cover the concept and applications of resilience in mobility systems. We then highlight the limitations in the literature. Next, we discuss disruption types and investigate how they can affect the transportation network. Based on the outcome of this review, we propose a definition of RaaS.
Transportation Systems Resilience
There are several studies in the literature that provide various definitions of resilience in the field of transportation systems. We present four complementary definitions. Chopra et al. ( 3 ) define resilience as the ability of a system to maintain its structure and function in the face of disruptions. Tamvakis and Xenidis ( 8 ) represent resilience as the ability of a system to react to stresses that challenge its performance. Imran et al. ( 9 ) define a resilient transport as a system able to absorb shocks as well as accommodate slow onset long-term events. Finally, according to Pan et al. ( 5 ), resilience is the ability of the transportation system to resist and adapt to external or internal disturbances and then quickly return to a normal service level to meet the original travel demand. All of these definitions attempt to demonstrate that resilience is a solution to face disruptions to minimize their effect and return to the normal situation as fast as possible.
Resilience is also addressed in the literature as a range of concepts and definitions that play a crucial role in designing assessment tools. Pan et al. ( 5 ) provide some keywords to quantify resilience: redundancy, resourcefulness, rapidity, strength, and stability. Henry and Ramirez-Marquez ( 10 ) propose that the key parameters in resilience quantification are as follows: disruptive events, component restoration, and overall resilience strategy. In a comparative study to highlight the importance of resilience in system infrastructure, Tamvakis and Xenidis ( 11 ) propose a process to evaluate the system’s resilience based on the entropy theory. This process is similar to how resilience is quantified, as both aim to demonstrate the system’s vulnerability to disruptions.
To design a sustainable and resilient system, we need to consider three phases in the disruption management, that is, before, during, and after the perturbation. In this context, Dekker et al. ( 12 ) defined a resilient system as a system that can effectively adjust its functioning before, during, or following changes and disturbances.
There is a lack of a universally accepted definition of resilience which raises significant uncertainty about what is being measured, limiting the ability to compare different approaches ( 4 ). In addition, the majority of the studies refer to a single independent system, while in the real world multi-modality should be taken into account. In this study, we try to address the resilience concept in a multimodal disruption situation,
Disruptions in Transportation Systems
Disturbances affecting transportation systems vary in nature, scale, impact, duration, and source. It is important to evaluate the costs of disruption to have a better understanding of the solution needed.
Without considering day-to-day variability, which is typically measured by travel time reliability ( 13 ), disturbances can be categorized into internal and external threats ( 14 ). Internal threats may originate from mistakes or/and accidents caused by staff or users, technical failures, components that break down, faulty constructions, overload, and so forth. They could also be intentional, such as labor market conflicts. External threats may be related to natural phenomena including various degrees of adverse weather and natural disasters: heavy rain, snowfall, thunderstorms, hurricanes, volcanic eruptions, earthquakes, and so forth. Another threat that is considered as long term is global warming, which is partially a consequence of human activities in the transport sector. External threats also include deliberate attacks such as sabotage, terrorism, and acts of war. The consequences of disruptions in transportation networks vary according to many factors, including the type of disruption, duration, and location. Some studies have divided disruption consequences into direct and indirect costs. For example, Wei et al. ( 15 ) propose a framework to provide a comprehensive estimation of the indirect economic impacts of transportation disruptions. Besides, Mahdavi Moghaddam et al. ( 16 ) conclude that the failures are not significantly related to the topological properties of the network, but to the duration of failure and passenger flow re-distributions.
In the literature, there are several approaches to measure and quantify resilience, providing different strategies to reduce the impact of disruptions, however, the perturbations are generally difficult to estimate and predict. In the urban transportation systems, most of the studies focus on the independent systems that try to optimize their own resilience, but, in real complex urban systems like MaaS, several parts are working together and affecting each other. For these reasons, we need a framework providing resilient solutions in the face of any kind of disruption, taking into account the systems’ multi-modality.
Resilience as a Service (RaaS)
In (6), “resilience as a service” is introduced on the cloud computing field and it refers to the capacity of the infrastructure to support uninterrupted functionality of the applications despite failures of components. In this paper, we extend this concept to multimodal transportation systems.
Definition of RaaS
We propose the following defintion for RaaS: RaaS in a transportation system is the integration of various forms of resilience services into a single service accessible on demand by the system’s stakeholders. It aims to support multiple mobility services operating and correlating together in a single complex transport system to empower the ability of the global system to anticipate, prepare for, and adapt to changing conditions and to resist, respond to, and recover rapidly from disruptions.
RaaS can be designed for a centralized or decentralized structure. In its decentralized form, each service provider controls their own resources independently, but they collaborate with each other in the case of a disruption. It means RaaS provides a management system for the different mobility service providers to cooperate to improve the resilience of the whole transportation system. Thus, it can be represented as an agreement contract between them enabling resource reallocation in the case of a disruption to reduce the recovery time and costs. In its centralized structure, all transportation services are managed under a single entity. In this case, RaaS is an additional service that can optimize all service plans together to respond to the disruption considering all the available modes in the network. Here, we focus on the decentralized structure to describe the concept of RaaS for a current transportation network including multiple independent providers.
In this paper, we restrict our example to a specific scenario that RaaS can offer during a disruption event. Specifically, RaaS must cover all combinations of multimodal mobility services to sustain their structure and function in the face of disruptions, ensuring a rapid recovery capability or proposing alternative solutions to travelers. The primary objective of RaaS is to be fully prepared to cope with any exceptional events that may occur.
Problem Statement
In this paper, we consider a multimodal urban transportation system, in which there are multiple modes of transport. Each of them corresponds to a mobility service managed by different service providers. In the urban area, these transportation modes can be correlated; consequently, if a disruption happens, travelers and service providers are affected, and this effect will vary based on the level of service and the impact of the disruption factor. The idea of RaaS in this situation is to integrate resources of all the available services in the system, to empower it to face both infrastructure-based and the service-based disruptions, and to optimize the objectives of all stakeholders in the system.
Figure 1 depicts the placement of RaaS and its relationship with the different stakeholders in the system. When a disruption occurs, RaaS unit is activated, and the disruption causes a cost for operators, travelers, and consequently mobility authorities. The impact on travelers indirectly influences the RaaS operations. RaaS considers the goals of travelers, by respecting the policy that comes from the authorities, then tries to increase the utility of the users in the system. On the other hand, it provides mobility operators with a service to reduce their recovery time and increase their service level. In Figure 1, the direct arrows show the direct relationships between different stakeholders, while the dash arrows show the indirect relationships between the other units of RaaS.
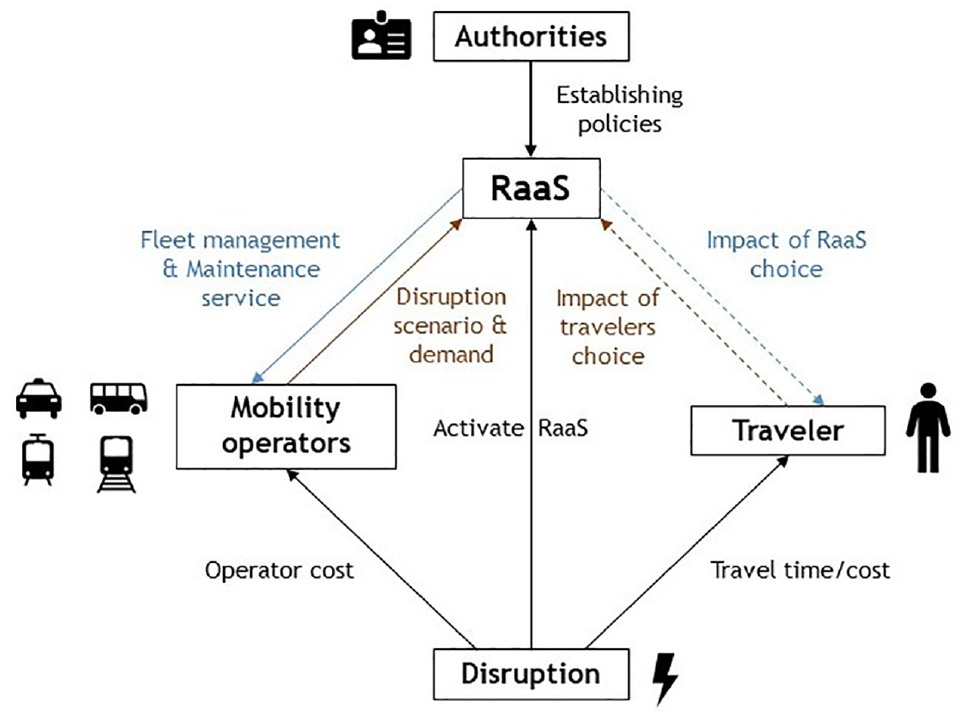
Relationship between the different stakeholders.
To formulate the problem taking into consideration the different perspectives, we used a bi-level mathematical model. According to Sun et al. ( 17 ), the bi-level programming model has much greater advantages compared with the traditional single-level programming model. First, it can be used to analyze two different and even conflicting objectives at the same time in the decision-making process; second, the multiple-criteria decision-making methods of bi-level programming can reflect the practical problem better; and third, the bi-level programming methods can explicitly represent the mutual action between the system managers and the customers, that is, different stakeholders.
In this work, we use bi-level optimization to consider the problem solved by RaaS. Different perspectives and goals of the stakeholders should be taken into consideration. For this reason, RaaS aims to minimize the allocation of resources as well as achieve user equilibrium ( 18 ). This interaction can be represented through the following bi-level programming problem ( 19 ).
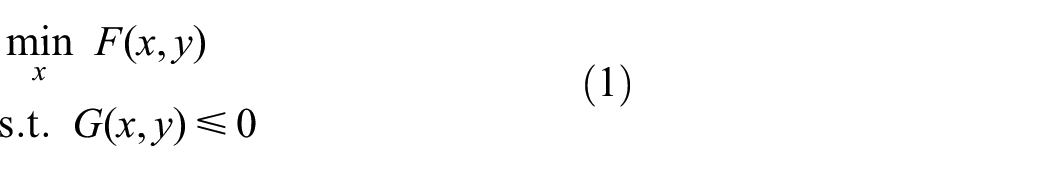
where y = y(x) is implicitly defined by the lower-level problem:
The idea of bi-level optimization is to represent the problem as a model consisting of two sub-models, an upper level and a lower level. Equation 1 represents a generic form of the upper level, in which
The problem defined by RaaS involves two main sets of decision variables: the first set is related to service providers, and the other to travelers. In the next section we will present our mathematical model in detail.
Methodological Framework
In this section, we formulate a small management unit of RaaS as a bi-level mathematical model. The upper-level model considers the objectives of RaaS providers. Note that these objectives indirectly serve the goals of service providers and authorities. In the upper-level model, we aim to find the best resource reallocation for all mobility services in a disruption event.
Let us represent the resources with two components, the number of vehicles assigned to scheduled services and the maintenance or supporting units. The assignment problem at the upper level is about assigning these two resources to defined services to serve the demand. The objectives of the model are to minimize: (i) the resources used by the undisrupted services with respect to their demand, (ii) the recovery time, and (iii) the difference between the current (disrupted) service level and the normal level. Optimizing the upper level leads us to find the optimal values for the supply side in which more resources are reallocated to the disrupted service to reduce the recovery time and increase the service level toward the normal situation. Afterward, we represent the decision-making process of the travelers in the lower-level model. Recall that the goal of this model is to achieve user equilibrium. Therefore, the objective function is formulated as minimizing the travel cost of every traveler ( 20 ). The decision variable in this level is the assignment variable, which denotes the decision of travelers about choosing their travel mode among the available transportation modes ( 21 ).
We proceed first by presenting the analytical formulation of the problem. Then we deploy an agent-based simulator and propose a practical framework based on our bi-level model for multimodal transportation systems.
Analytical Formulation of the RaaS Management Unit
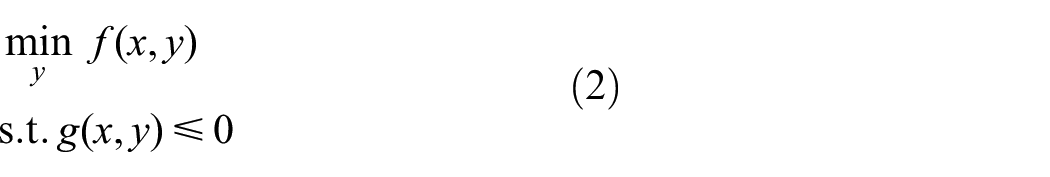
To reduce the complexity of the mathematical model in presentation, we define the model in a single time interval, wherein a single or multiple disruptions are already affecting the system. The duration of an interval can be different based on the evolution of the disruption(s) and the effective period of the decisions made by stakeholders. Thus, we factor out the index of time in our formulation. In addition, we simplify the definition of travel time and avoid defining the dynamics of the multimodal traffic system, which is beyond the scope of this study. We formulate the travel time and the impact of maintenance units on disruptions in a generic, deterministic, and simplified manner. The employed notations in this study are summarized in Table 1.
Table of Notations
Upper-level model: The upper-level model is formulated from the perspective of RaaS providers. Before presenting the model, let us define a disrupted scenario
where
where
The mathematical formulation of the upper-level model is as follows:
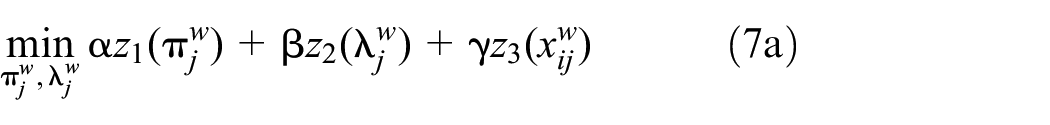
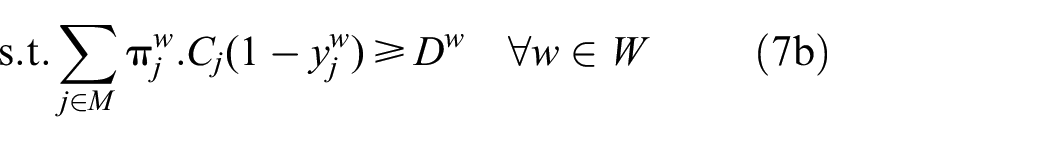

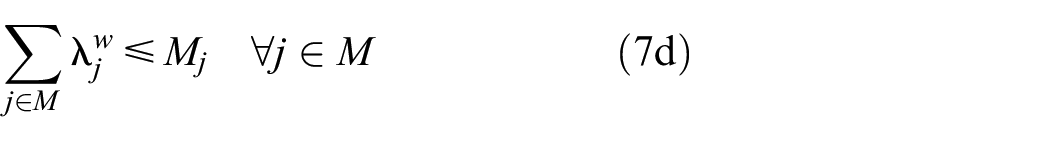
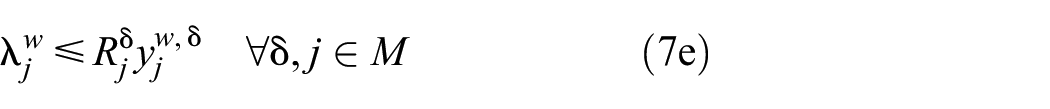

where
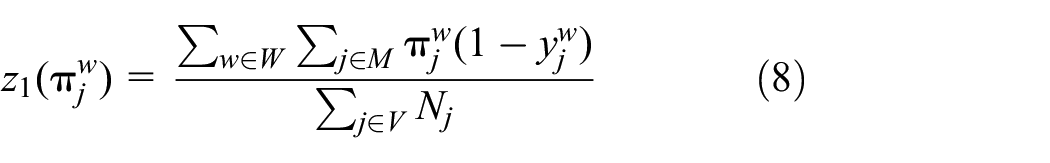
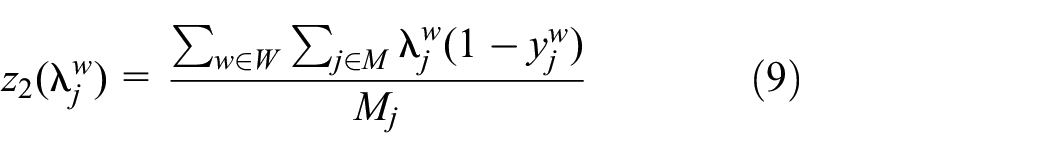
Equation 7a presents the objective function of the system for the RaaS providers, it includes three main components. The first (Equation 8) is related to minimizing the non-disrupted service resources used by service providers, where
The constraint Equation 7b forces the non-disrupted mobility services to serve all their demand. We exclude the disrupted services as they are already perturbed, and cannot fully serve their demand, where
Lower-level model: The lower-level model is from the perspective of the travelers. It aims to reach users’ equilibrium, and its mathematical formulation is expressed as follows:
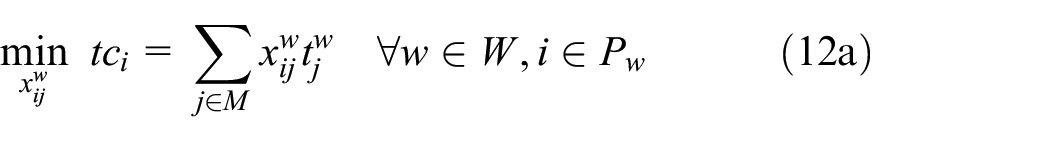
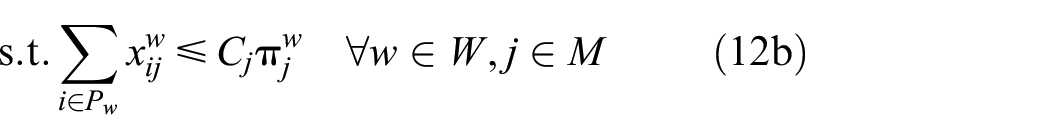
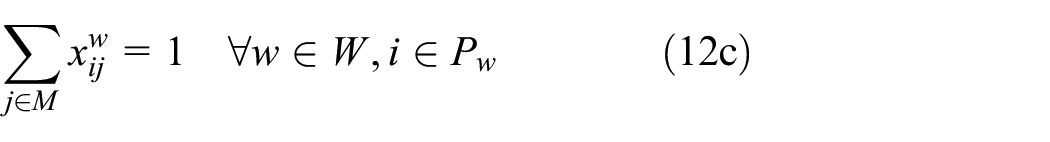


where
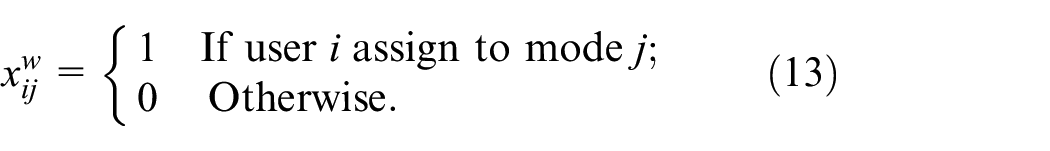
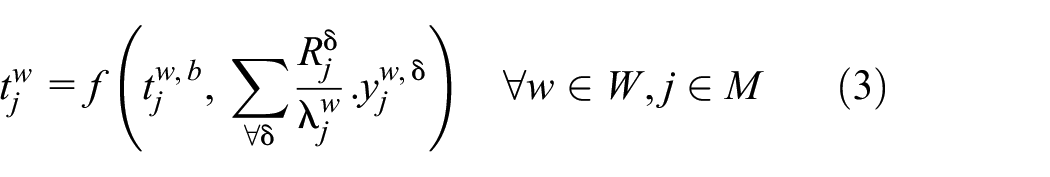
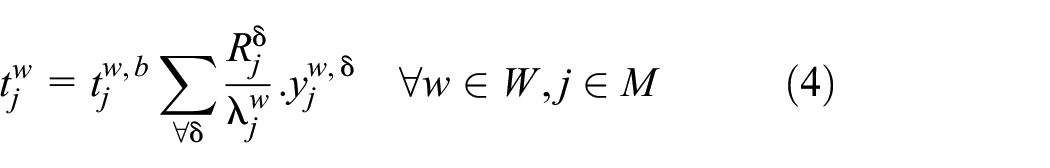
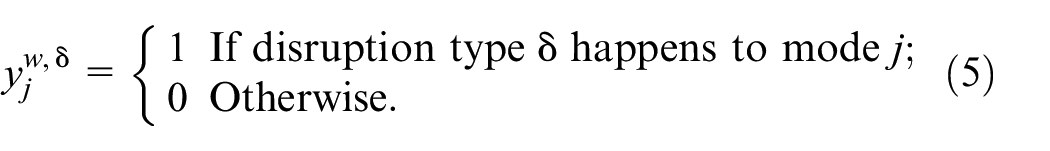
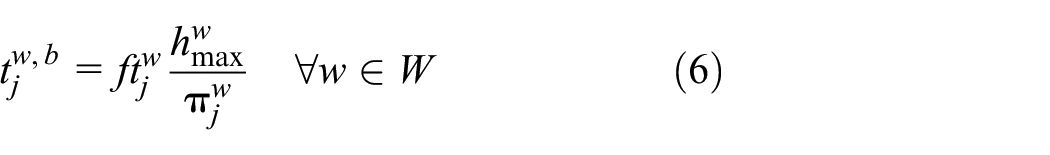
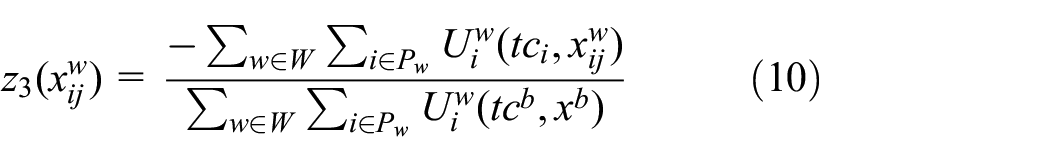
At this level, the objective function is formulated in Equation 12a, which seeks to minimize the total cost incurred by each traveler to achieve the user equilibrium. In this equation,
The constraint presented in Equation 12b aims to ensure that the capacity of the service is conserved by guaranteeing that the sum of all passengers assigned to mode
In this paper, we present a mathematical model designed for a multimodal urban transportation system. Because many parameters are involved, which arise from the various modes of transportation and their complex interactions, an exact analytical solution is not feasible. The use of heuristic methods would require making assumptions and simplifications that may not be realistic or accurate. Instead, we have chosen a simulation-based approach, which allows us to incorporate the time dimension in the calculations and capture the dynamics of the multimodal transportation system. With a traffic simulator, we provide all the input data needed and also capture the dynamics of the multimodal transportation systems.
Simulation-Based Framework for the RaaS Management Unit
This study combines the bi-level programming model with an agent-based simulation. In the case of a disruption, the simulator provides the travel time of the users and the dynamics of the system during the service duration. At the upper level, the third component of the objective function, which is based on the travel cost of users, is calculated. At the lower level, the simulation handles the lower level by calculating the user equilibrium and providing the distribution of the users over different modes.
The proposed iterative process includes the steps detailed in the flowchart in Figure 2. The description of each step is highlighted as follows:
Step 1 Disruption identification: This step corresponds to identifying the disrupted network, the scenario of perturbation, and the demand of users. In our process, the disruption can be the absence or the delay of service, and the impact is measured by the simulation.
Step 2 Traffic simulation: This step corresponds to simulating the traffic where the perturbation is identified. The objective here is to measure the impact of the disruption on travelers, by determining the effect on travel time and capturing the system’s dynamics.
Step 3 Update the cost functions: This is the first part of the upper-level resolution, where all the cost functions and indicators are updated. The measure is changed in the utility and the cost of different agents in the system.
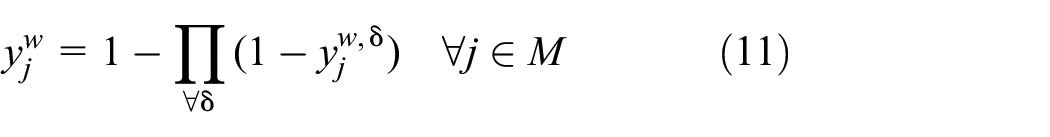
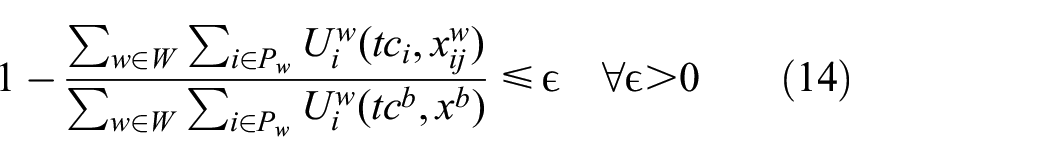
Step 4 Upper-level convergence test: In this step we check the convergence of the objective function of the upper level. If a disruption happens, the first two components of the objective function are eliminated, we use the indicator shown in Equation 14 which is the disruption utility, that is designed to determine how far we are from the normal situation. The best value for this equation is 1, meaning that we are in the normal situation, the difference between this indicator and the value of 1 shows the level of disruption. The number of iterations is limited as shown in Equation 14.
Step 5 Solve the fleet management problem: In this step, we solve the fleet management problem (formulated in Equation 7). We obtain the optimum values of
Step 6 Update lower-level parameters: This step is for updating all the lower-level inputs which characterize the supply side based on the optimum values that come from Step 5.
Step 7 Solve the lower level: This step corresponds to finding a network for user equilibrium, for the targeted transportation system including all the users. After finding the equilibrium solution
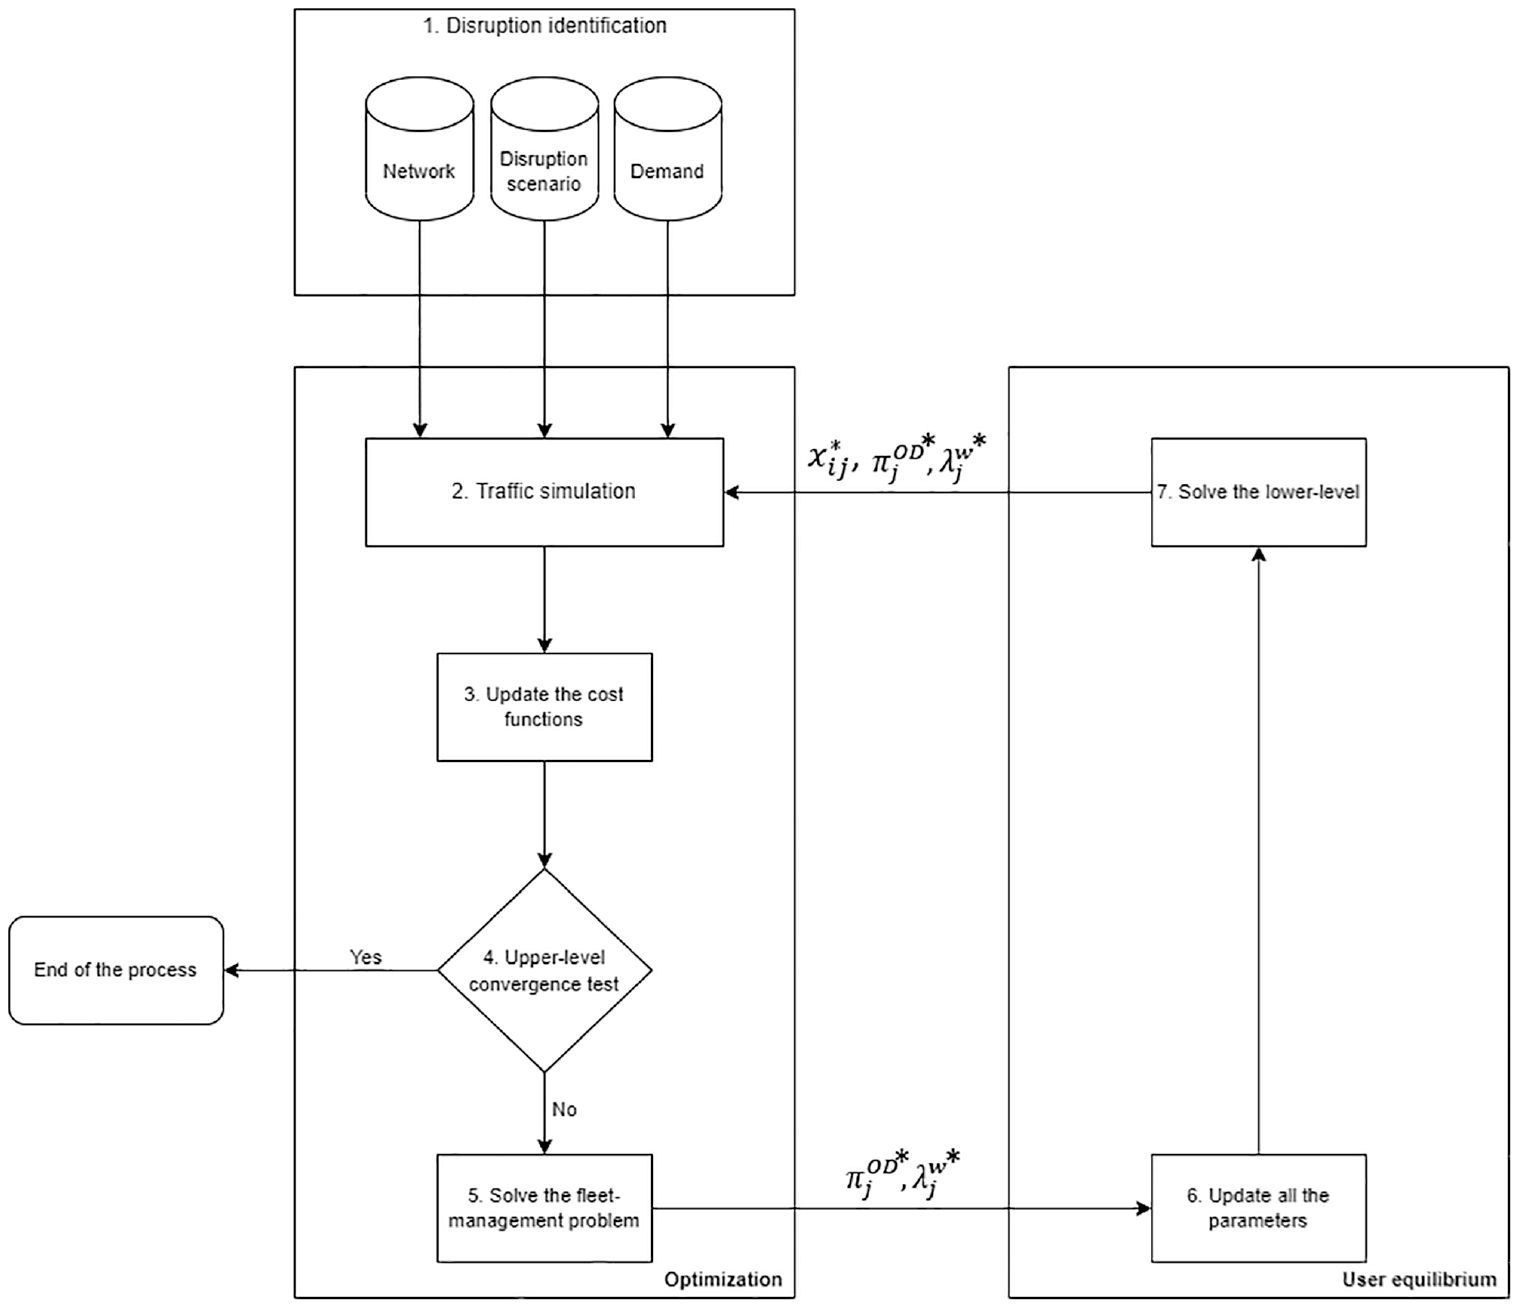
Flowchart of the simulation-based framework.
Test Network and Results
The numerical results are obtained by simulation of a bus network where two different operators are supposed to operate.
Agent-Based Traffic Simulation
MATSim (Multi-Agent Transport Simulator), which is an open-source simulator that provides a framework to implement large-scale activity-based transport simulations, is used. In MATSim, network attributes (e.g., flow capacity and free speed) can be changed during the simulation to represent disruption events. In this study, we use MATSim to capture the dynamics of the multimodal system during a disruption event in a single-day model.
MATSim has different modules working together to simulate traffic dynamics ( 24 ). Mobsim (mobility simulation module) is in charge of simulating the network loading ( 25 ). In every iteration, MATSim will take control of the lower level, and calculate the user equilibrium based on an iterative algorithm. Each agent selects a plan from its memory based on the user equilibrium principle, to optimize the initial demand. The plan’s selection is done by means of a utility function that generates a score and associates it to each plan in the scoring module. The replanning module is responsible for the plan modification for each agent, and the user equilibrium is calculated in this module. The replanning process in our context is carried out based on the shortest path algorithm of Lefebvre and Balmer ( 26 ) and Wan et al.’s ( 27 ) assignment algorithm to reroute users and converge to an equilibrium.
The Network
To provide an example to illustrate how the proposed RaaS framework performs in a disrupted scenario, we implement our methodology for the network of the city of Rennes in France and its surrounding area (Figure 3a). The transport service of the Rennes metropolitan area is made up of a metro line and 150 bus lines (regular and scholar) serving 43 municipalities. The Rennes network is built of 22,384 edges and 32,995 links. There are 1,529 transit stops serving 73 regular bus lines. These lines serve 711 km of surface and about 280,000 daily trips. Figure 3 represents the Rennes transport map, Figure 3a is the real map of Rennes, and Figure 3b is the network captured by MATSim. We used the web map OSM (OpenStreetMap) to obtain the geographical and topological data of this region, and the GTFS (General Transit Feed Specification) file provided by Rennes Metropole (https://data.rennesmetropole.fr) in July 2022. The OSM data provides us with the activity facilities to be used in creating our OD demands, and the GTFS data is used to create the public transport fleet in the simulated area. By gathering and processing the data we obtain a multimodal network containing the infrastructure on which the vehicles and agents can move around in the simulation, and the transit schedule file and vehicles file needed to integrate the public transport mode in the simulation.
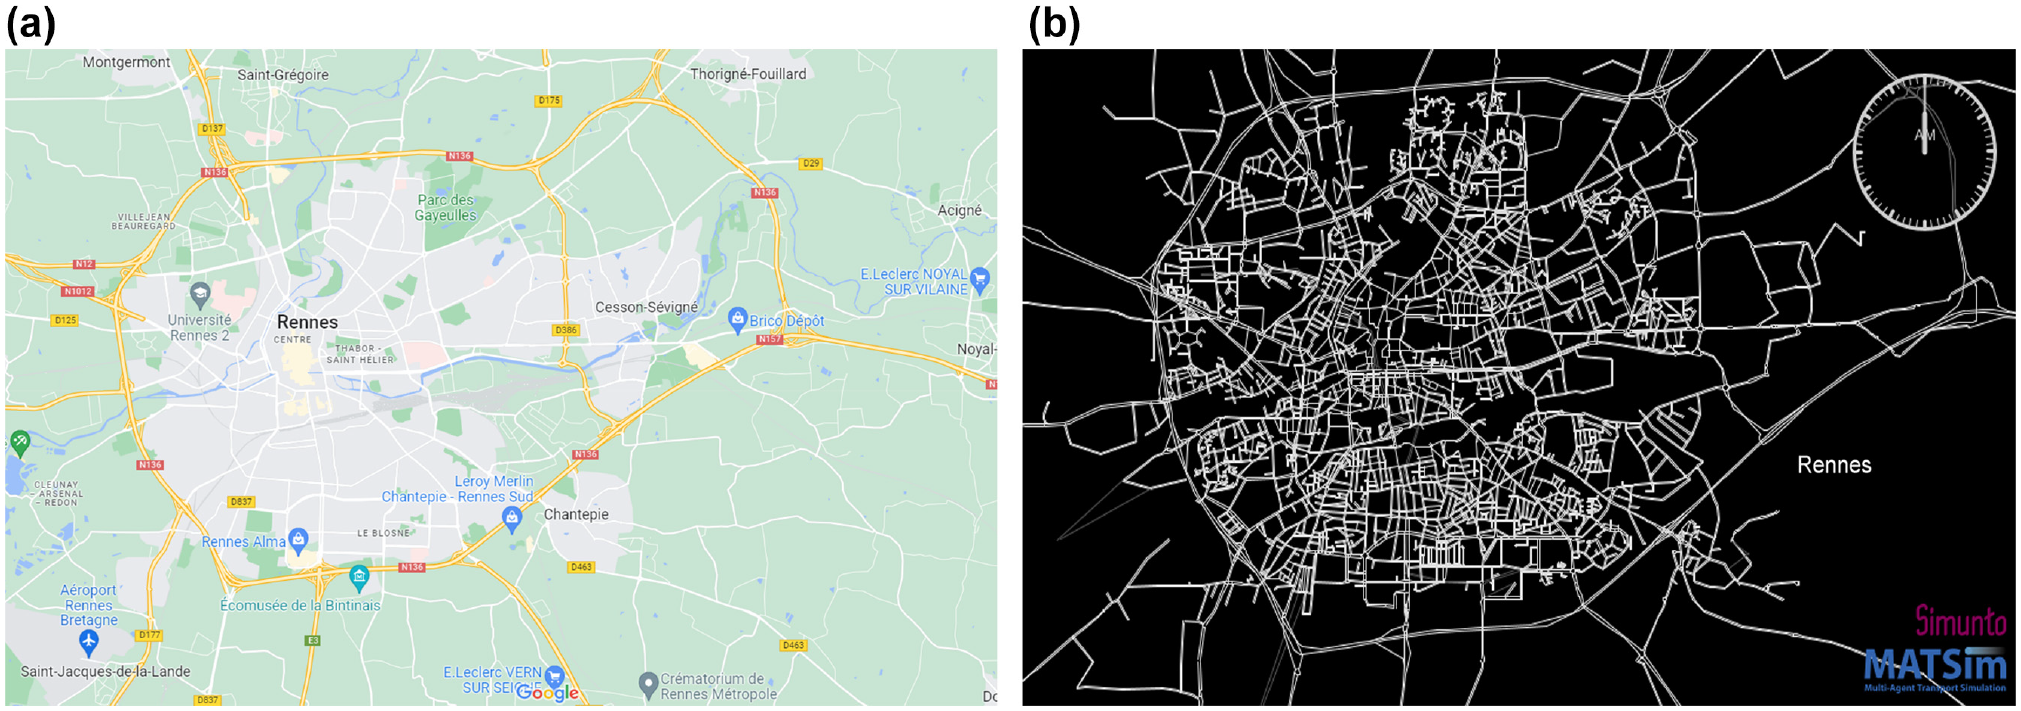
Network map of city of Rennes: (a) Rennes mapping data © Google 2022, and (b) MATSim city network.
The Application Scenario
The scenario consists of simulating the traffic of Rennes and its surroundings in different circumstances, that is, normal traffic and disrupted traffic. The disruption event is a fleet failure mainly applied to the bus line that connects Chantepie (a suburb of Rennes) to Rennes city center. It means that the passengers in Chantepie will not be able to go directly to Rennes. We are using a subpopulation of almost
Figure 4a displays in orange an example of Line C1 that goes from Rosa Parks in Chantepie to Champs Blanc in Cesson Sévigné via Rennes city center. It travels 13.692 km and serves 39 stops. When Line C1 is disrupted, our methodology proposes to reallocate a bus from Line 11. In other words, Line 11 is passing by the nearest stop (called Forum) to rescue Line C1. Line 11 is shown in yellow in Figure 4b. It goes from La Poterie in Rennes to ZI Ouest in Vesin-Le-Coquet via Rennes city center, making a traveling distance of 15.889 km and serving 41 stops. The taken bus will make the route from the terminus of Line 11 (La Poterie) to the terminus of Line C1 (Rosa Parks) to rescue the passengers, making an additional distance of 6.845 km and an additional travel time of 23 min 23 s. This additional travel time made by Line 11 from La Poterie (Line 11 terminus) to Rosa Parks (Line C1 terminus) will cause an additional waiting time for passengers using Line C1 at Rosa Parks.
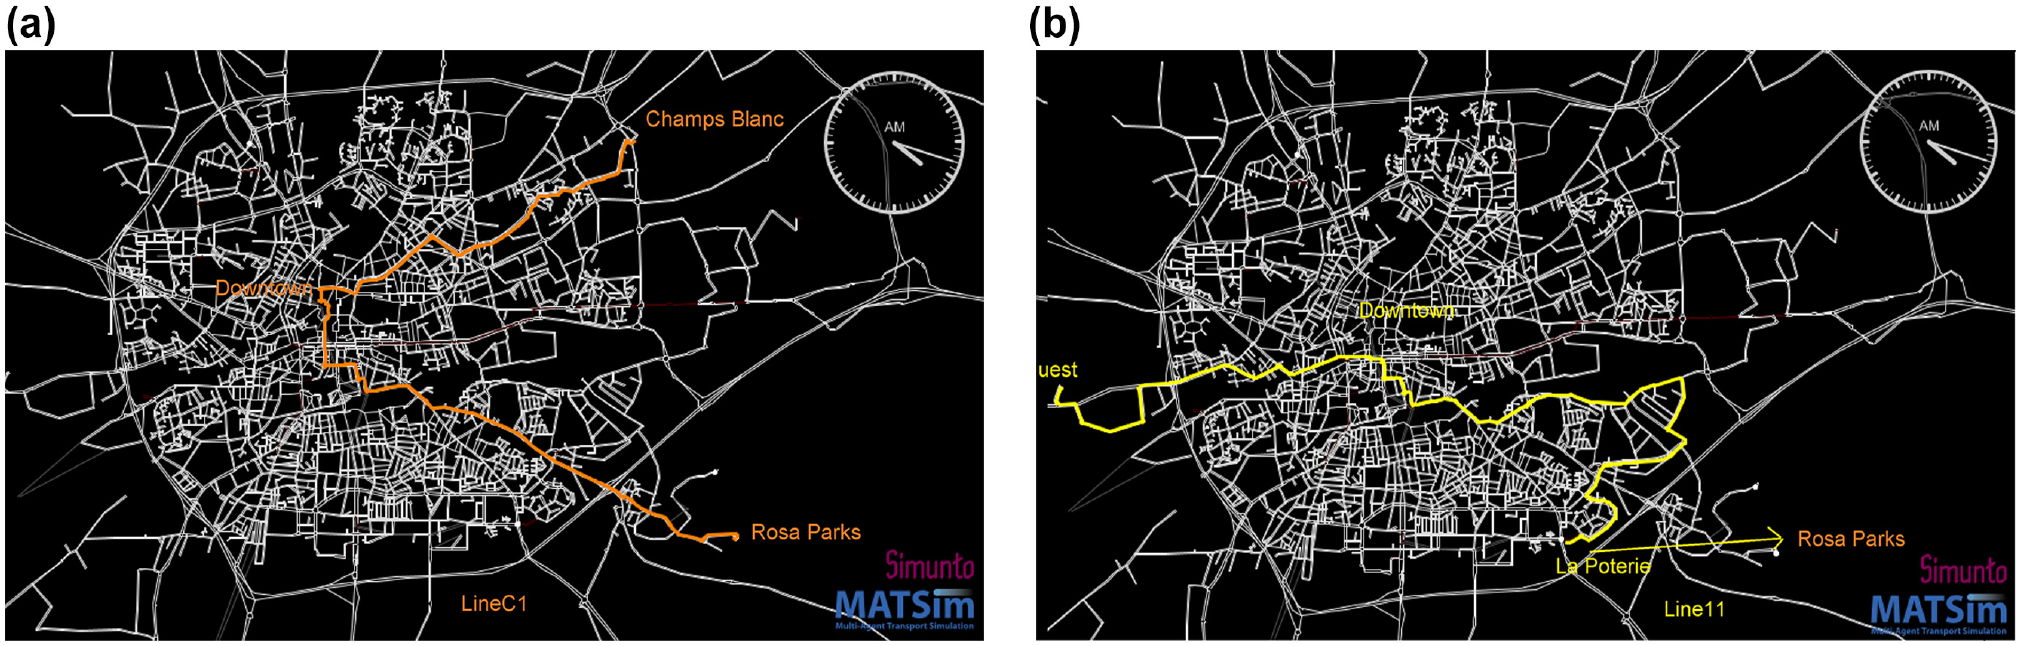
Disrupted scenario and the “resilience as a service” (RaaS) solution: (a) Line C1, in orange, is the disrupted line, (b) Line 11, in yellow, is selected by RaaS providers to rescue Line C1.
To evaluate the effectiveness of the RaaS strategy, we need to compare the scenario of disruption with and without the RaaS solution. In addition, we need to consider the normal scenario (no disruption) as the reference/baseline scenario to measure the cost and benefits of RaaS. Thus, the analysis should be carried out for the three following cases:
Normal situation: Simulate the public transport demand in a normal situation.
Disruption: Simulate the public transport demand in a disruption situation without RaaS.
RaaS: Simulate the public transport demand in a rescue situation (application of RaaS).
Results
To understand how travel time, waiting time, and distances traveled by passengers and vehicles are affected, we conducted simulations for three different cases (i.e., normal situation, disruption without RaaS, and disruption with RaaS). Table 2 outlines the results of these simulations for bus Line C1 during normal operations and during the disruption without and with the help of RaaS units.
Summary of the Simulation Results for the Disrupted Line C1 and the Rescuing Line 11 in Different Scenarios
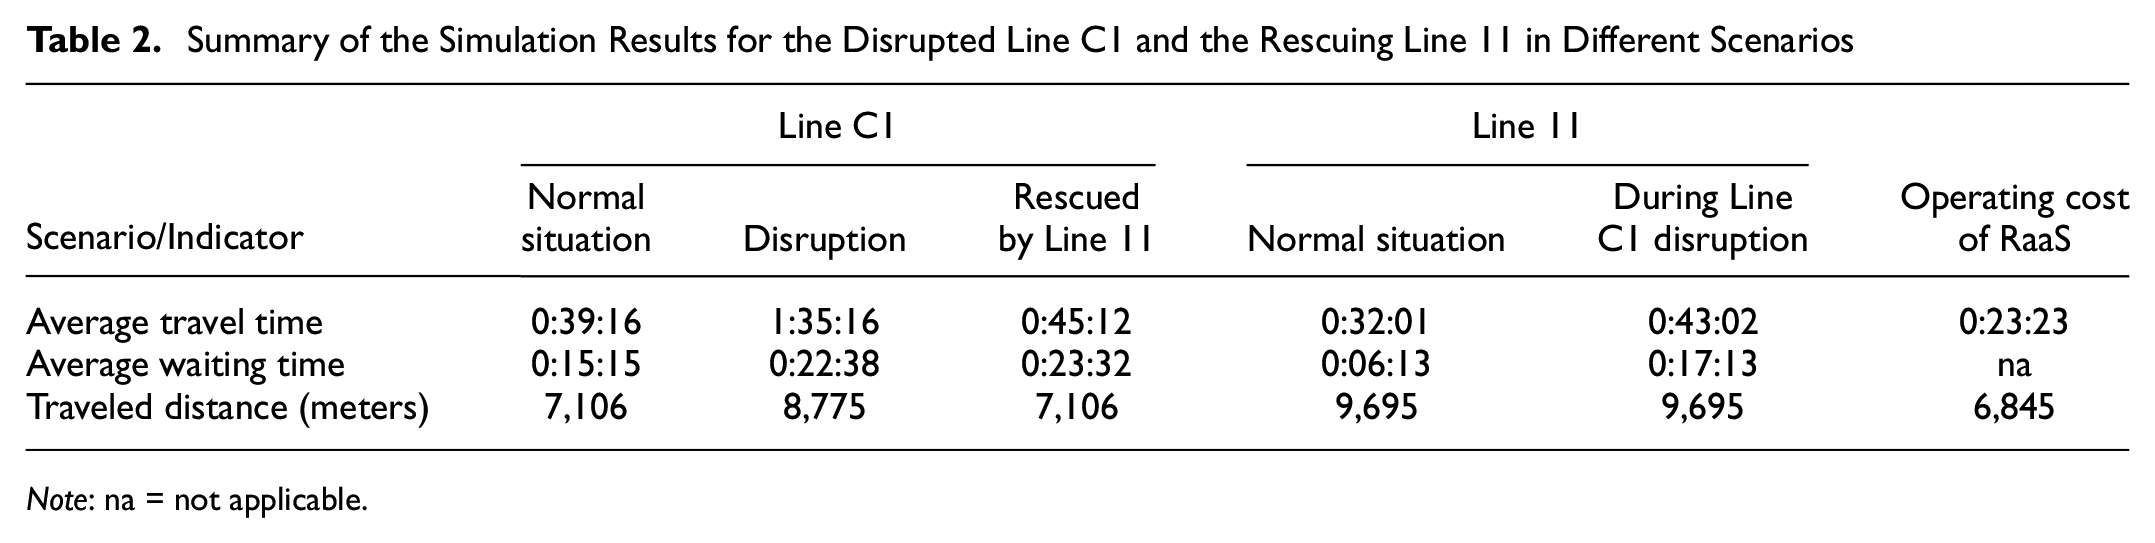
Note: na = not applicable.
Within the simulation of the RaaS decision model at upper level, the impact of the disruption on Line C1 is investigated. To minimize the impact, Line 11, the nearest bus to disruption point is interrupted and necessary fleet is dispatched to rescue the passengers of disrupted line C1. This intervention resulted in reduction of the travel time of passengers of Line C1 by more than 50 min (from 01:35:16 (h:m:s) in the disruption situation to 00:45:12 when the Line C1 is rescued by units of Line 11.
The traveled distance is also decreased, from 8,775 m to 7,106 m, which is exactly the traveled distance in the normal situation because it eliminates the walking distance by passengers in the disruption situation to reach the nearest bus station. In the absence of RaaS, the delay in the average travel time would be 56 min. When we apply RaaS, the delay is 6 min for Line C1 and 11 min for Line 11, which gives a total delay of 17 min. Consequently, the average travel time of all users would be reduced by 69%. While we have an important gain in rescuing Line C1 by Line 11, there is a cost to be paid by Line 11; however, it is negligible compared with the time saved for Line C1.
Discussion
Figure 5 illustrates the performance differences between the two bus lines, providing insights into the resilience of transportation systems (
28
). The performances (e.g., speed, capacity) with respect to the occurrence time of the disruptive event can be divided into three stages: pre-disruption, during disruption, and post-disruption periods. In the pre-disruption stage, the system operates in a normal state as planned (
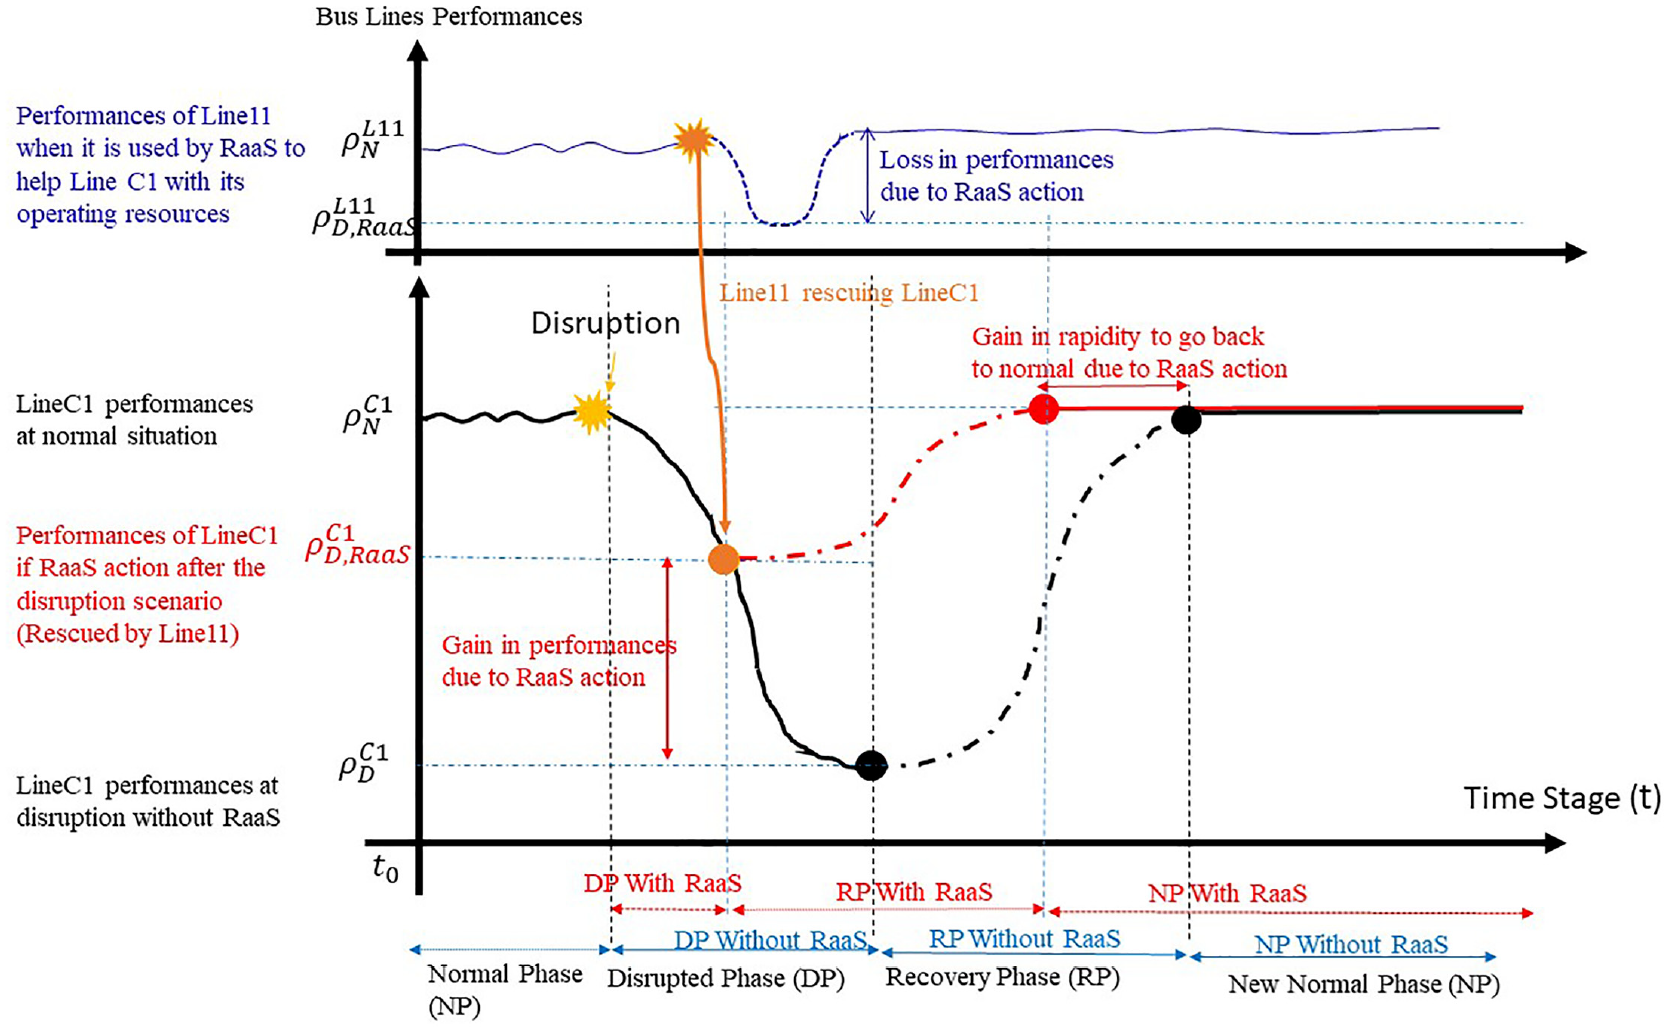
Schematic of performances of Line C1 and Line 11 with and without RaaS.
Conclusion
This paper provides a definition of a new paradigm in resilience for transportation systems, which is called “resilience as a service” (RaaS). The idea behind this concept is to propose a framework that aims to integrate the different forms of resilience services into one single resilience service. Taking into account the benefits of the transportation system’s stakeholders, this framework considers the complexity of transportation systems as a means to achieve fast recovery from any kind of disruption. To elaborate on the concept of RaaS and the way this management service works, we provide an example representing one management unit of RaaS in a multimodal urban transportation system. To reach this objective, we propose a bi-level mathematical model. The upper-level problem directly fulfills the RaaS providers’ goals, which are partially aligned with the benefits of service providers and authorities. The objective of this level is to find the best resource reallocation for all mobility services in the case of a disruption. The lower-level model represents the decision-making process of the traveler to achieve user equilibrium. After formulating the lower-level, we extended the bi-level programming model to a simulation-based framework to address practical test cases. The framework optimizes the objectives of both levels, and the summary of the proposed framework is shown in Figure 2.
To examine the feasibility and effectiveness of our solution method, we deployed an agent-based simulator and conducted a case study on the city of Rennes. One of the key findings of this study is that by disrupting a mobility service that operates at the nominal level, we might use some new resources to help another fully disrupted mobility service. Our test case demonstrates that the benefit of applying the proposed method in reducing the average travel delay of all users is about 70%.
This work has several limitations; for example, to clearly illustrate and describe the concept of RaaS, we only take into account a management issue of bus providers for our test case. Other RaaS units (e.g., re-routing models in case of infrastructure disruption) should be considered. Also, including all the transportation services in the urban area (e.g., shared vehicle services, taxis, trains, etc.) will be more interesting for the RaaS service, and challenging as it will extend our model to other modes. It will increase the computation time and complicate the simulation-based framework. Besides, we did not address the impact of the rescue plan on the recovery time, which could be an interesting question to be investigated.
This study opens a new door to resilience research. One of the interesting future works could be investigating other applications of RaaS, including the urban area and other transportation systems, for example, air mobility or maritime mobility. Future research also illustrate more complex methods by including dynamic traffic models inside the bi-level program.
Footnotes
Author Contributions
The authors confirm contribution to the paper as follows: study conception and design: R. Amghar, S. Jaber, S. M. Hassan Mahdavi Moghaddam, N. Bhouri, M. Ameli; data collection: R. Amghar, S. Jaber, S. M. Hassan Mahdavi Moghaddam, N. Bhouri, M. Ameli; analysis and interpretation of the results: R. Amghar, S. Jaber, S. M. Hassan Mahdavi Moghaddam, N. Bhouri, M. Ameli; draft manuscript preparation: R. Amghar, S. Jaber, S. M. Hassan Mahdavi Moghaddam, N. Bhouri, M. Ameli. All authors reviewed the results and approved the final version of the manuscript.
Declaration of Conflicting Interests
The author(s) declared no potential conflicts of interest with respect to the research, authorship, and/or publication of this article.
Funding
The author(s) received no financial support for the research, authorship, and/or publication of this article.