
Abstract
To date, there is limited evidence on how shared micro-mobility services are being used in Mobility as a Service (MaaS) trials. To add new evidence, this research investigated the MaaS trial data from the University of Queensland in Brisbane, Australia. Descriptive analysis and statistical models were employed to analyze participants’ usage behavior in shared micro-mobility services with MaaS bundles. From this analysis, several critical and interesting findings emerged. First, when compared with bundles including micro-mobility, basic mobility bundles with unlimited public transport services were more popular in the university community. Second, compared with the pay-as-you-go option, trial participants were more willing to adopt shared micro-mobility services with PASS options with daily travel budgets. Third, there was a substantial underutilization of shared micro-mobility budgets within existing mobility bundles. Fourth, multimodal bundle subscribers used shared micro-mobility services about two to three times longer per day, compared with basic bundle users. Finally, shared micro-mobility service providers seemed to experience positive externalities from other micro-mobility providers in the market. The findings could provide insights to optimize existing MaaS business models with micro-mobility and to help evaluate the impacts of MaaS on the travel behavior of university populations.
Keywords
An emerging integrated information technology platform, involving the integration of trip planning, booking, and payment systems, known as Mobility as a Service (MaaS), promises to reduce the complexity of trip planning and execution. In such a fully integrated platform, MaaS can reduce users’ travel costs by providing more user-oriented and customized mobility services on a mobility bundle (subscription) or pay-as-you-go (PAYG) option. MaaS is also regarded as an innovative way to enhance environmental sustainability by encouraging sustainable changes in travel behavior, including shifting passengers’ travel away from the dependence on private mobility services ( 1 ) and increasing the use of low-emission and shared modes (e.g., shared mobility and public transport) ( 2 – 7 ). Given the huge potential of MaaS in promoting sustainable travel behavior, mobility bundles have received considerable attention and become a popular research area owing to their critical role in business models.
To understand the effects of MaaS on travel behavior, existing studies have mainly analyzed either stated preference (SP) data collected by survey questionnaires or revealed preference data collected from trials. Several studies have employed SP surveys and discrete choice models to identify potential adopters, investigate their willingness to pay, and predict future market penetration ( 8 – 20 ). Previous findings suggest that potential adopters are those in younger age groups, with higher education backgrounds, and with higher income levels ( 8 , 16 ). In addition, travelers’ previous mobility use also appears to be associated with bundle uptake ( 12 , 13 , 18 , 21 ). In general, customers have a high willingness to adopt MaaS. For example, Ho et al. reported that in Sydney nearly half of the respondents were willing to purchase one of the presented MaaS bundles ( 12 ). Similarly, Vij et al. surveyed 3,985 representative Australians nationwide and found that up to 46% of them would be willing to adopt MaaS ( 20 ).
Another stream of MaaS studies utilized real trial datasets to validate previous SP studies and evaluate the potential impacts of MaaS on travel behavior. The review started from the case of the MaaS trial in Gothenburg, Sweden, known as UbiGo, which was conducted between November 2013 and April 2014. Five different modes were available to be booked through the platform: regional public transportation, car-sharing, bike-sharing, rental car, and taxi services. The trial participants represented 195 individuals from 83 households. Through qualitative analysis of questionnaires and personal interviews, Strömberg et al. reported that 42% of respondents changed their mode choice within the UbiGo MaaS trial ( 22 ). Separately, when looking into the case of the first MaaS trial in Germany, Reck et al. analyzed longitudinal panel data on uptake and car-sharing usage and pointed out that customers who subscribed to mobility bundles including higher car-sharing budgets used the car-sharing service for more time than PAYG customers ( 6 ). Further, subscribers underutilized their car-sharing allowances within the purchased mobility bundles. Another MaaS trial, known as Tripi, was conducted in Sydney between November 2019 and April 2020. The mobility bundles were designed for Insurance Australia Group employees, 93 of whom participated in the MaaS trial. Ho et al. developed a mixed logit choice model to investigate participants’ real bundle subscription behavior, and the results confirmed a substantial market for mobility bundles; however, PAYG was also popular for participants with varying travel needs ( 23 ). Through analyzing their real bundle subscription behavior, trip booking data, and corresponding private car use during the MaaS trial, Hensher et al. explored the impacts of MaaS on private car usage and pointed out that bundle uptake was indeed associated with decreases in monthly private car trips and kilometers ( 24 ). Furthermore, Ho investigated whether MaaS could change users’ travel behavior to deliver positive commercial and societal outcomes, and the results suggest a possible business model for MaaS operation ( 25 ). Storme et al. conducted a MaaS trial at Ghent University in Belgium to explore the impacts of MaaS on university employees’ private car use ( 26 ). The results suggest that MaaS may not be effective in reducing private car usage significantly in a real-life setting.
In general, these studies provide insights into the operation and development of MaaS. Shared micro-mobility services, such as e-scooters and e-bikes, show promise in reducing travelers’ reliance on private mobility for short-distance trips and in providing first- and last-mile connections to public transport ( 27 ), However, to the best of our knowledge, the role of shared micro-mobility services within MaaS trials remains largely unexplored. Specifically, the lack of public commercial data for MaaS business analysis raises questions about how micro-mobility allowances in mobility bundles are utilized. Understanding participants’ behaviors with shared micro-mobility services in MaaS trials is essential for informing real-world MaaS development, such as the design and pricing of mobility bundles and adjustments to business models, and ultimately enhancing sustainability.
To address this gap, our research analyzed shared micro-mobility service usage data from the MaaS trial at the University of Queensland (UQ) between January 2022 and January 2023. Previous studies indicate that trips to and from universities account for a significant proportion of daily urban travel, affecting the broader mobility system ( 28 ). The frequent and necessary trips made by university students and staff may also influence their future travel decisions ( 29 ). Notably, the UQ St Lucia campus is the second-largest commuter destination in South East Queensland after the Brisbane Central Business District (CBD) ( 30 ). Therefore, understanding UQ participants’ behavior with shared micro-mobility services within MaaS bundles would also be insightful for the operation and planning of local transport systems in South East Queensland.
Driven by the objectives, this paper aims to answer the following questions:
What are the preferred subscription patterns and trip characteristics of shared micro-mobility services in this MaaS trial?
Is there an underutilization of time budgets within existing mobility bundles? What are the differences in daily utilization of shared micro-mobility services between basic and multimodal bundle subscribers?
Which factors (e.g., user type, trip type, day of week, public holiday, semester, weather characteristics) affect subscribers’ daily utilization of shared micro-mobility services?
Which factors (e.g., day of week, public holiday, semester, weather characteristics) affect the daily demand for trips in shared micro-mobility bundles? How do the offerings from different service providers interact?
The remainder of this paper is organized as follows. The following section describes the MaaS trial at UQ. The third section describes the data and explanatory variables for the analysis. It also introduces the modeling approaches, including ordinary least squares and negative binomial regression models. The results section includes the descriptive analysis of bundle subscriptions and usage characteristics of shared micro-mobility services in the MaaS environment. In addition, it presents the modeling analysis of participants’ daily utilization and demand for trips with PASS options that include shared micro-mobility services. The final section concludes the main findings and discusses future directions.
MaaS Trial
UQ, the Queensland Department of Transport and Main Roads, and the iMOVE Australia Cooperative Research Centre, deployed a MaaS trial in late July 2021, called ODIN PASS, exclusively for UQ staff and students. UQ is a large university community, consisting of three campuses, including St Lucia, Gatton, and Herston. The total population of students and staff is around 63,000, of which nearly 90% are based at the St Lucia campus ( 31 ). The St Lucia campus is about 7 km from the CBD of Brisbane and is well-serviced and connected by South East Queensland (SEQ) public transport networks: bus, ferry, train, and tram networks, as shown in Figure 1. SEQ also has extensive active travel infrastructure for walking, cycling, and shared micro-mobility ( 30 ).
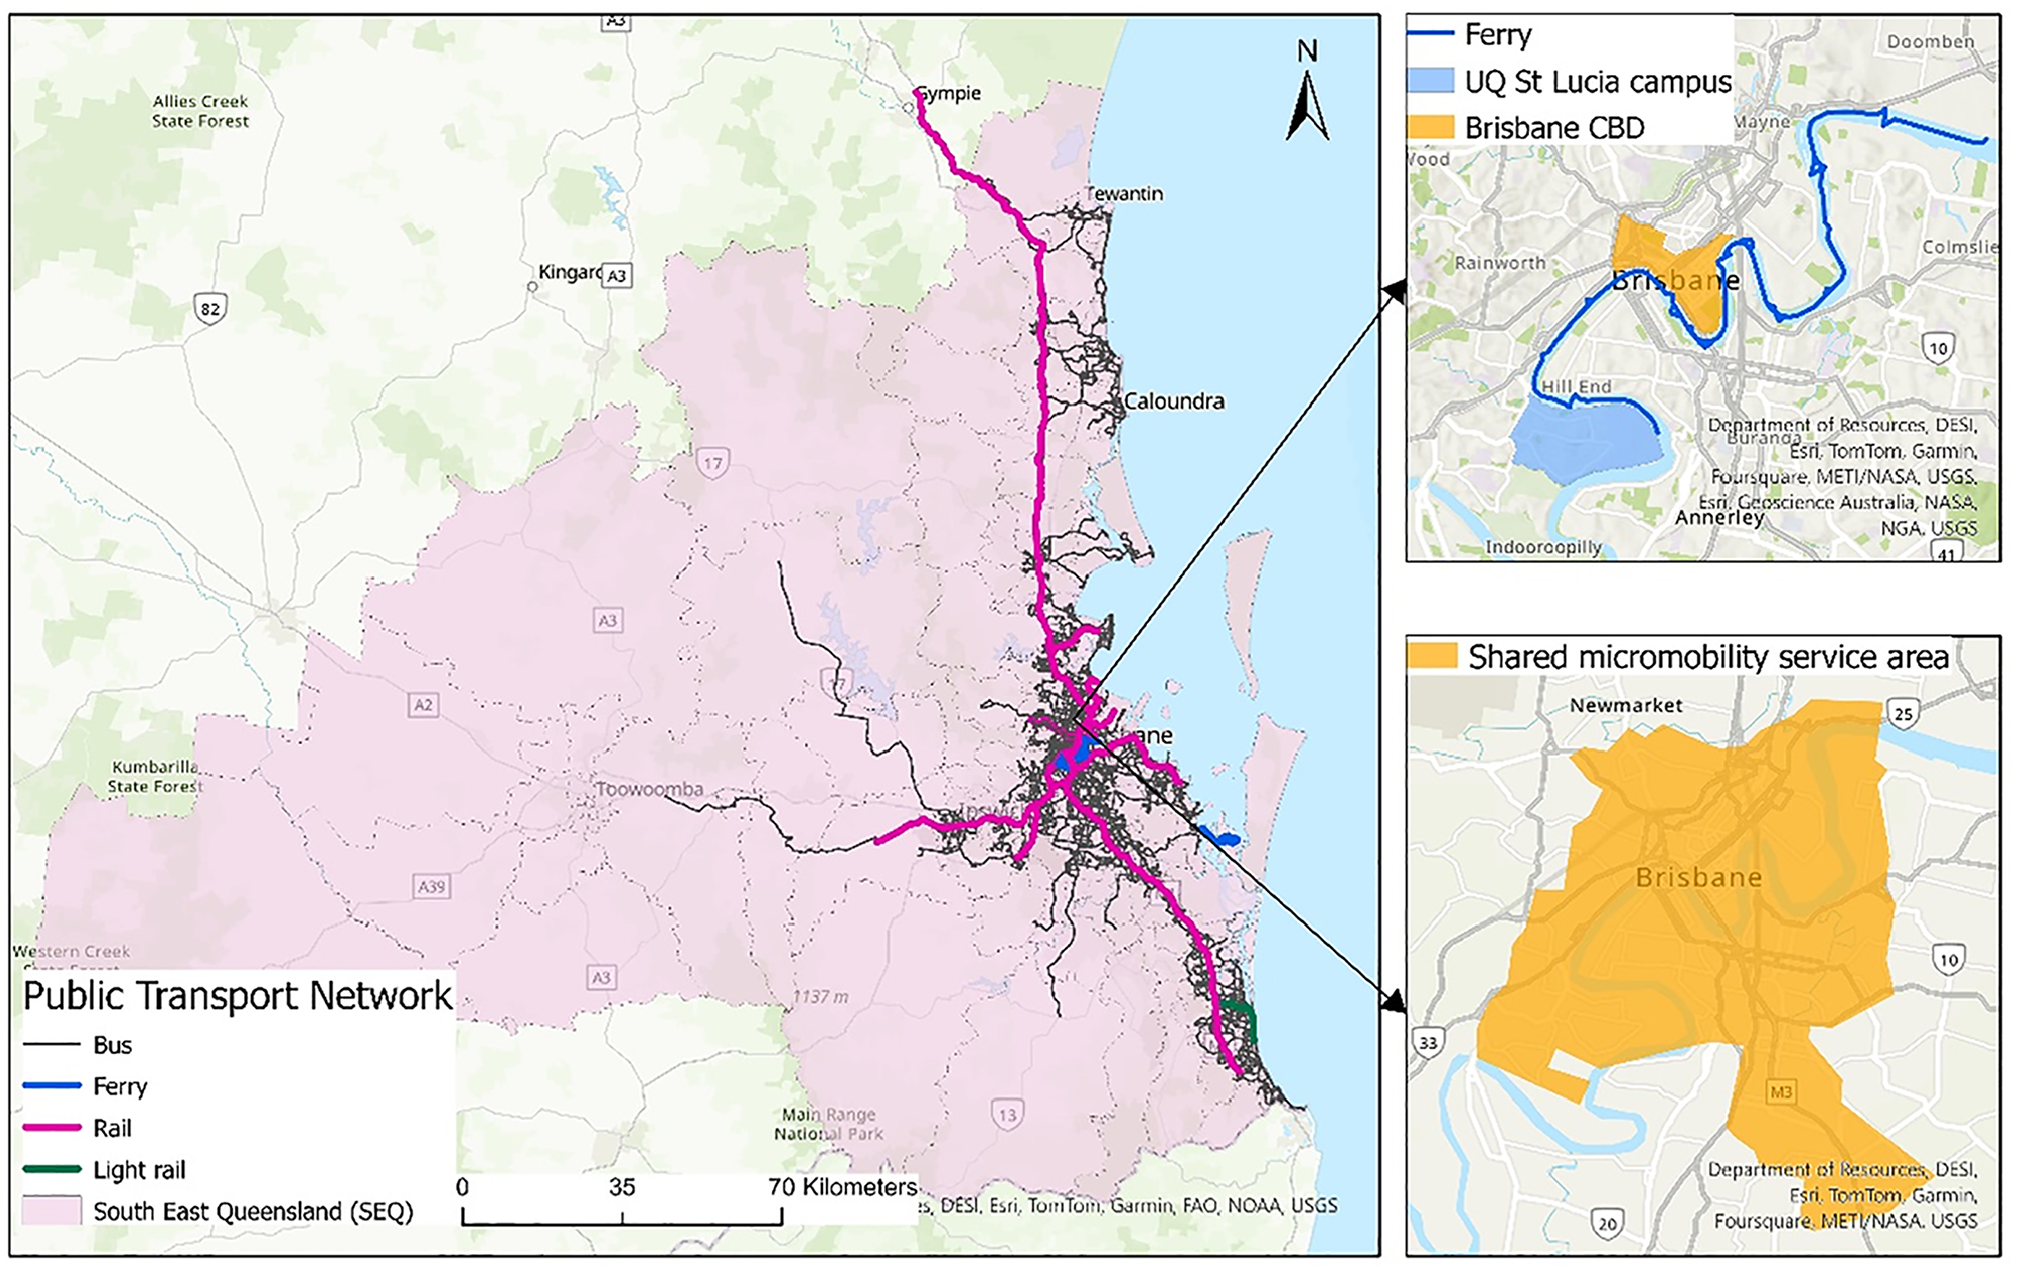
Map of South East Queensland, UQ, Brisbane CBD, and shared micro-mobility area.
MaaS embodies a shift away from personally owned modes of transportation, toward integrated mobility solutions that are consumed as a service. MaaS is the combination of public and private transportation services accessed via an application that provides personalized journey planning, booking, and payment. It enables individual mobility budgeting through single payment or subscription models, it offers choice and dynamic travel options, and it provides a platform through which to incentivize and influence behavior to better optimize the network.
Within this definition, the ODIN PASS trial has as a stated goal to move customers away from single-occupant vehicle travel and onto other shared modes. The ODIN PASS app provides customers with access to public transport services, shared e-bikes and e-scooters, and walking and cycling options in personalized journey plans. Booking is managed within the ODIN PASS app, and payment for services is managed through a subscription for public transport (PT) and PAYG for shared e-bikes and e-scooters, or a subscription to PT and shared e-bikes and e-scooters combined. This entire set of options is presented to the customer when they are ready to book a trip, and includes the current locations of PT stops, e-bikes, and e-scooters based on the customer’s location. A sample screen from the app is shown in Figure 2.
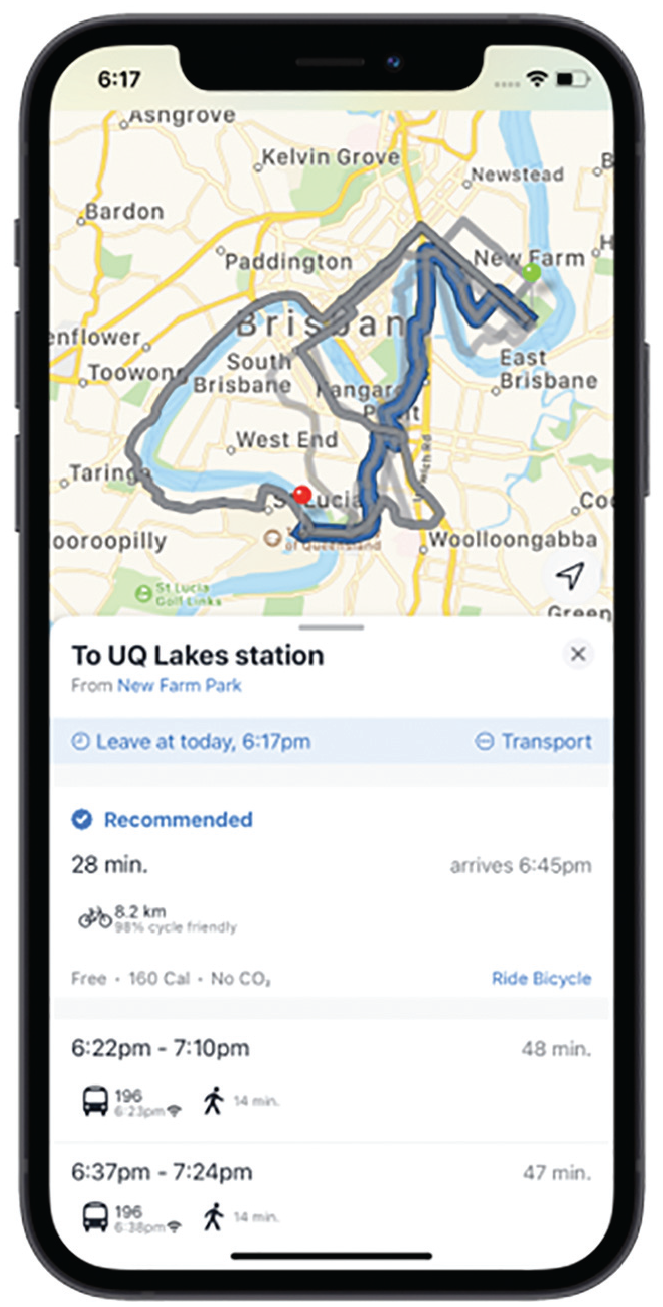
Screen shot of trip planning in the ODIN PASS app.
The goal of the ODIN PASS trial was to conduct a large-scale MaaS trial in the university community, specifically to explore how MaaS might be used to encourage shifts from single-occupant vehicle travel to more sustainable modes of travel. The objectives of the MaaS trial were as follows: 1) to investigate the potential impacts of MaaS on travel behavior at UQ; 2) to explore consumer willingness to pay for MaaS plans, and consumer preferences fordifferent mobility options; and 3) to determine whether MaaS could be introduced permanently at UQ. The initial trial was planned to run for 12 months to July 2022, however its success and popularity led to the trial’s extension to at least June 2024.
To operate the trial, a novel independent entity, ODIN PASS PTY LTD, was created to manage relationships with transport service providers, to determine prices and market offerings, and to manage bundle subscriptions under the ODIN PASS banner. The trial also made use of a custom MaaS smartphone application called ODIN PASS. This app, developed by SkedGo for both iOS and Android, allowed customers to book travel among all providers directly in the app. Participants in the trial could subscribe to various MaaS plans, which varied in price depending on the specific inclusions. Perhaps the greatest attraction of the MaaS bundles on offer was that all bundles included unlimited PT services within SEQ for the period of the subscription. As all PT services in SEQ are priced as PAYG and include peak/off-peak and zone-based fares, there appeared to be a large potential market for an unlimited PT subscription. Beyond the PT bundles, micro-mobility bundles also included a daily budget of 90 or 120 min of shared e-bike and e-scooter services, using one of two providers: Neuron or Beam, respectively. With both micro-mobility bundles, minutes of use beyond the daily budget were charged using PAYG rates. Finally, all bundles included modest discounts on taxi trips (13cabs) and car share (GoGet) using PAYG options ( 32 ). In our trial, on subscribing to MaaS, students and staff could travel across the whole SEQ transport network by booking trips in the MaaS app.
In this study, the research period was from January 24, 2022, to January 22, 2023. During this period, bundle prices were stable and thus we did not need to mitigate the impact of price changes on subscription patterns. However, to promote the MaaS trial at UQ, four promotion bundles were designed for new UQ students in their first subscription to ODIN PASS. The promotion bundles offered the same PT and micro-mobility inclusions as the normal bundles, but at an extremely discounted price, but only for the first month of their subscription. Table 1 provides an overview of the offered bundles, their duration (in days), and the price for the bundle. It may be noted that although the original ODIN PASS bundles were 30-day subscriptions, later innovations included a 7- and 90-day bundle.
MaaS Bundles Offered During the Observed Period
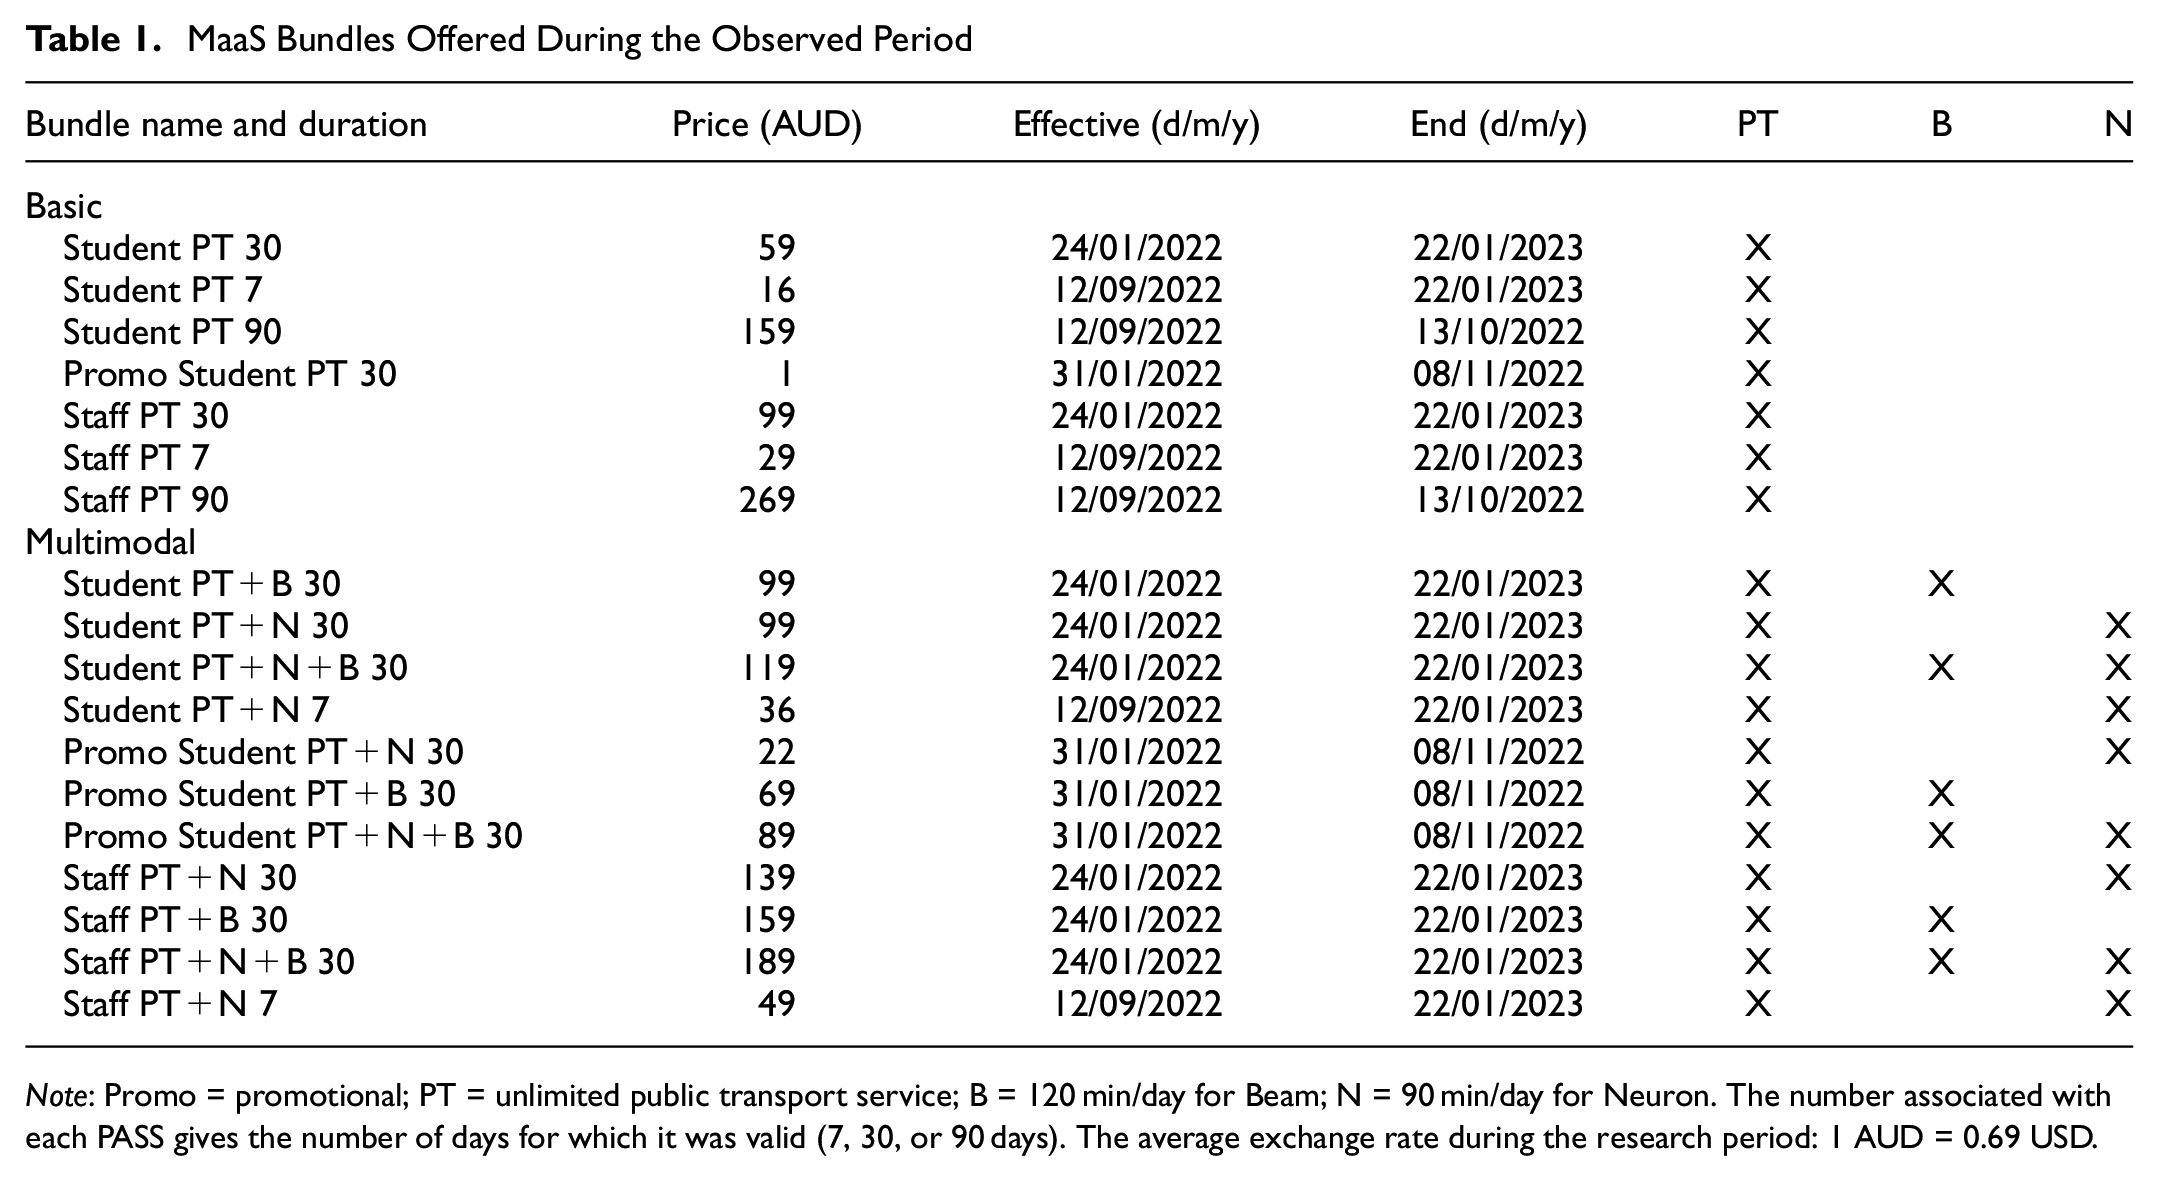
Note: Promo = promotional; PT = unlimited public transport service; B = 120 min/day for Beam; N = 90 min/day for Neuron. The number associated with each PASS gives the number of days for which it was valid (7, 30, or 90 days). The average exchange rate during the research period: 1 AUD = 0.69 USD.
As shown in Figure 3, the number of subscriptions increased at the beginning of 2022 and reached a peak of just over 2,000 subscriptions in August 2022, and then gradually dropped to around 1,500 subscriptions by December 2023. Also in this figure, it is apparent that the PT bundles were the most popular, accounting for a large majority of the bundle subscriptions over this time. During this 1-year period, a total of 5,027 participants signed up for the MaaS trial and purchased 15,720 bundles. Of the participants, 254 were staff, and 4,773 were students. Among the purchased bundles, 4,415 (nearly 28%) were promotion bundles that were heavily discounted (as shown in Table 1). Finally, it is important to note that basic bundle subscribers could also use shared micro-mobility services with Neuron and Beam separately using PAYG options, rather than including the shared micro-mobility services in their MaaS bundle.
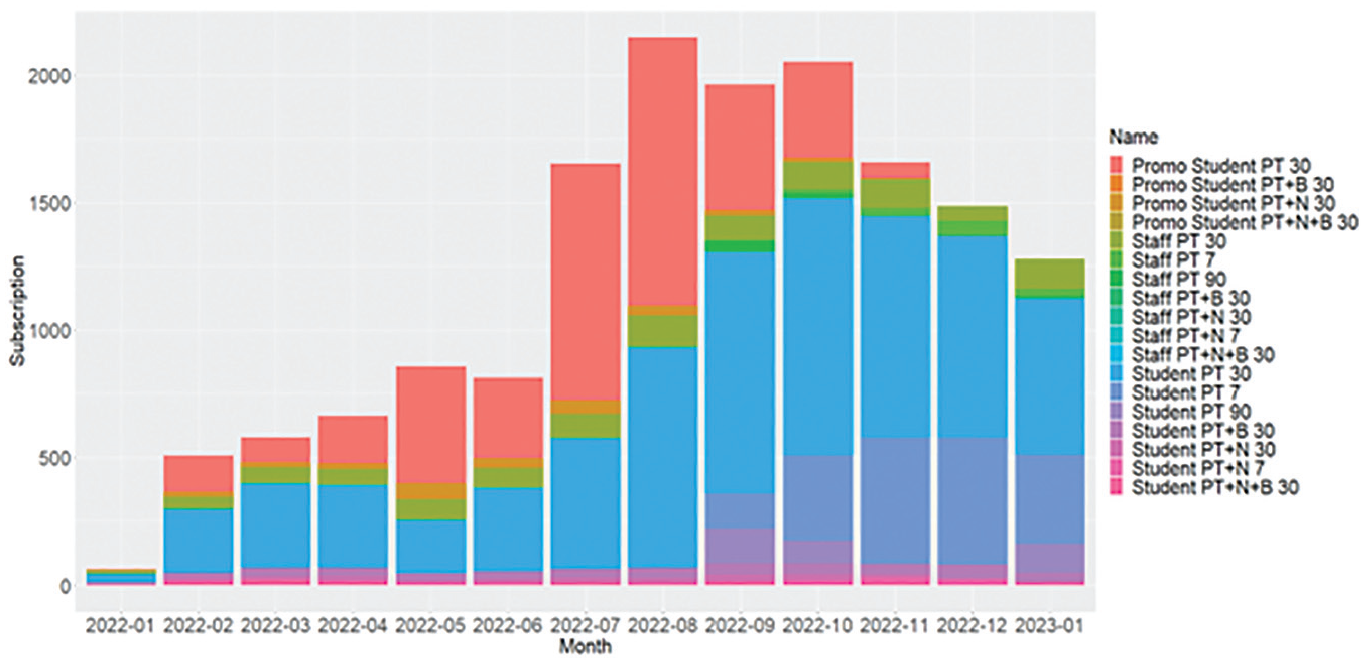
Number of bundle subscriptions over time.
Methodology and Data
Two datasets were collected for behavioral analysis in this research. Firstly, ODIN PASS PTY LTD provided details of the bundle subscribers, including user ID, user type, bundle ID, bundle type, and the effective and expiration date of each bundle subscription. Secondly, we received trip-level booking data from the shared micro-mobility operators (Neuron and Beam) for all trial participants. The micro-mobility record contained the user ID, start and end time of the trip, start and end location of the trip, vehicle type (e-scooter or e-bike), trip type (trip by PASS or by PAYG), as well as operator (Neuron or Beam). Booking records with trip durations of at least 1 min generated within the greater Brisbane area were selected for analysis. In addition, we collected daily weather characteristics for analysis. Note that because the mobility allowances in promotion bundles were consistent with those in normal bundles, we included usage records from promotion bundles in our analysis.
Daily Utilization Model of Shared Micro-Mobility Services
Participants in the MaaS trial had two options for traveling with shared micro-mobility services: PAYG for each trip or subscribe for a PASS with an allowance that was free of charge (e.g., 90 or 120 min, depending on the service provider). By exploring these options, the main objective was to examine whether there were differences in the daily utilization of micro-mobility services between PAYG and allowance subscriptions across service providers. We also aimed to investigate which factors (e.g., user type, trip type, day of week, public holiday, semester, and weather characteristics) significantly influenced their daily utilization. To assess participants’ daily utilization, considering the allowance form of mobility services included in the bundles, specifically, we aggregated the individual trip-level shared micro-mobility data by date, by trip type (PASS or PAYG), and by user ID. This allowed us to calculate the total minutes for each person using shared micro-mobility services on days when they made at least one trip. That means observations of days without micro-mobility trips for a given individual were removed from the analysis. Therefore, the dependent variable of interest was a numerical variable with positive values (minutes). The regression model was considered a simple and well-suited technique to examine the abovementioned relationships ( 6 ). However, given that our panel data (across users and dates) were unbalanced, a panel regression model was not deemed suitable to model the daily utilization of micro-mobility services ( 33 ). Therefore, we tested a set of general regression models with some log-transformed variables to uncover the influence of different variables on the participants’ utilization of micro-mobility services each day.
Daily Demand Model of Trips with Pass Options
Another objective here was to examine whether the presence of two shared micro-mobility service providers in the trial led to mutual support in increasing the daily number of booked trips through PASS options. We also aimed to investigate whether certain factors (e.g., day of week, public holiday, semester, and weather characteristics) significantly influenced the daily demand for trips using these PASS options. Therefore, the dependent variable was a count variable, with zeros representing days when there were no trips made. Specifically, we aggregated the trip-level shared micro-mobility data by date, trip type, and operator. Poisson and negative binomial regression models are usually employed to examine the abovementioned relationships ( 34 ). The Poisson model has a strict assumption that the mean should be equal to the variance. The negative binomial model is log-linked, and the linear predictors are exponentiated. The negative binomial model is usually chosen over the Poisson model if there is a statistically significant overdispersion in the research data. In this research, we tested both Poisson and negative binomial regression models before interpreting the impacts of the factors on the daily demand for trips in shared micro-mobility bundles. We determined the final models based on the results of the likelihood ratio (LR) test.
Before modeling, we also checked the collinear characteristics of variables and only kept noncollinear features (e.g., variance inflation factor <5) for model estimation. Table 2 presents the descriptive statistics of the explanatory variables.
Descriptive Statistics of Independent Variables
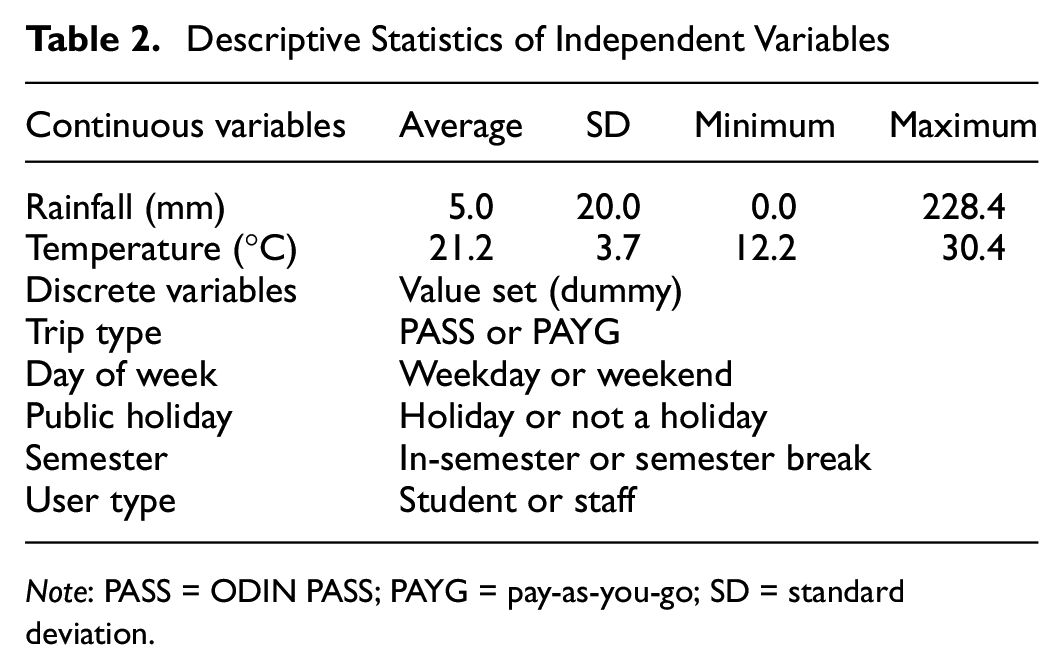
Note: PASS = ODIN PASS; PAYG = pay-as-you-go; SD = standard deviation.
Modeling Results
Descriptive Analysis
To answer the question, What are the subscription patterns and usage characteristics of shared micro-mobility services in the MaaS trial?, the analysis contained four main parts, including trip type, vehicle type, trip duration, and micro-mobility bundle subscriptions over time. Table 3 and Figure 4 summarize these subscription patterns and usage characteristics of shared micro-mobility services.
Trip Type, Vehicle Type, and Trip Duration
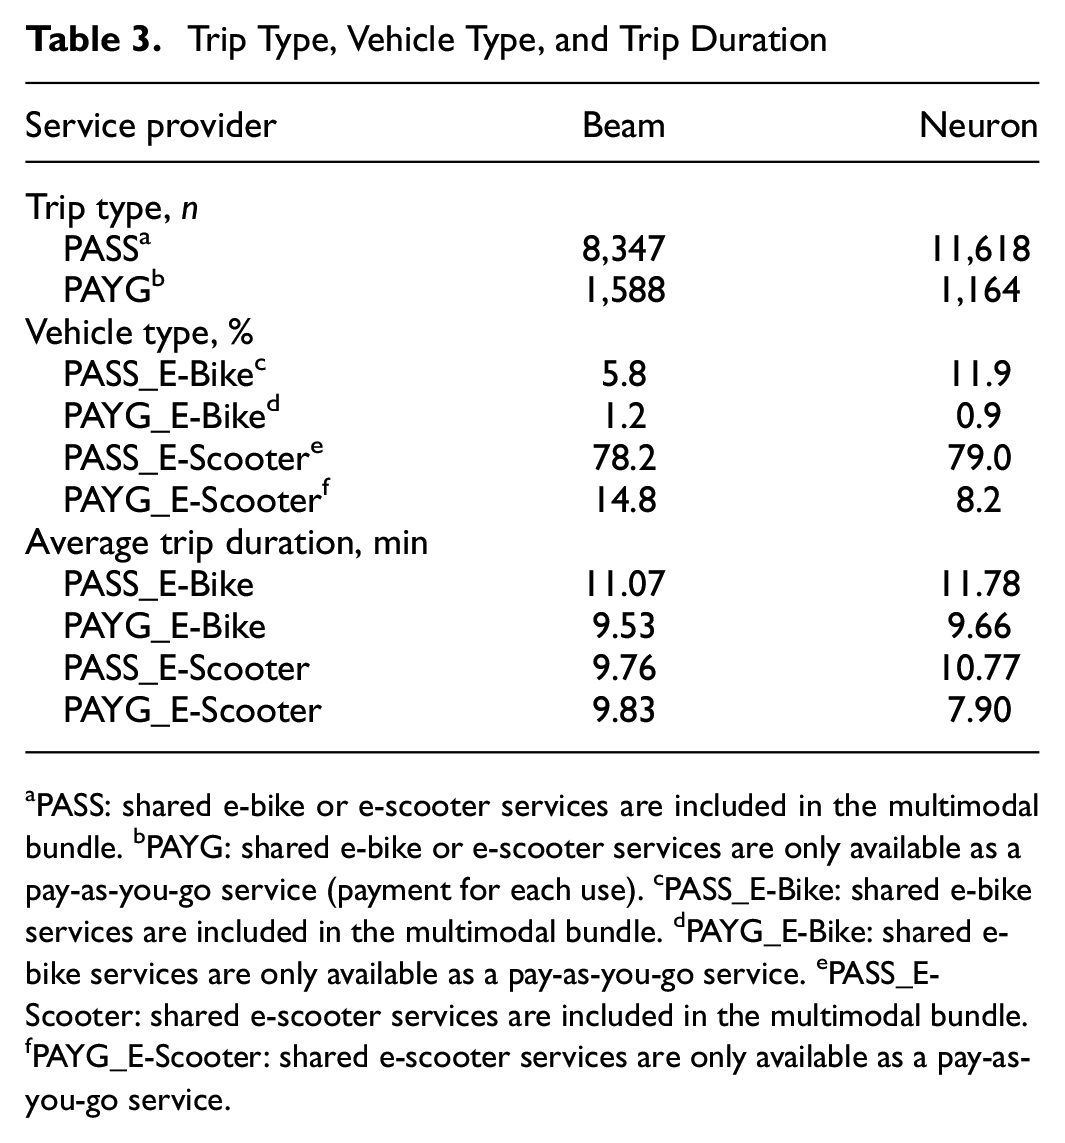
PASS: shared e-bike or e-scooter services are included in the multimodal bundle. bPAYG: shared e-bike or e-scooter services are only available as a pay-as-you-go service (payment for each use). cPASS_E-Bike: shared e-bike services are included in the multimodal bundle. dPAYG_E-Bike: shared e-bike services are only available as a pay-as-you-go service. ePASS_E-Scooter: shared e-scooter services are included in the multimodal bundle. fPAYG_E-Scooter: shared e-scooter services are only available as a pay-as-you-go service.
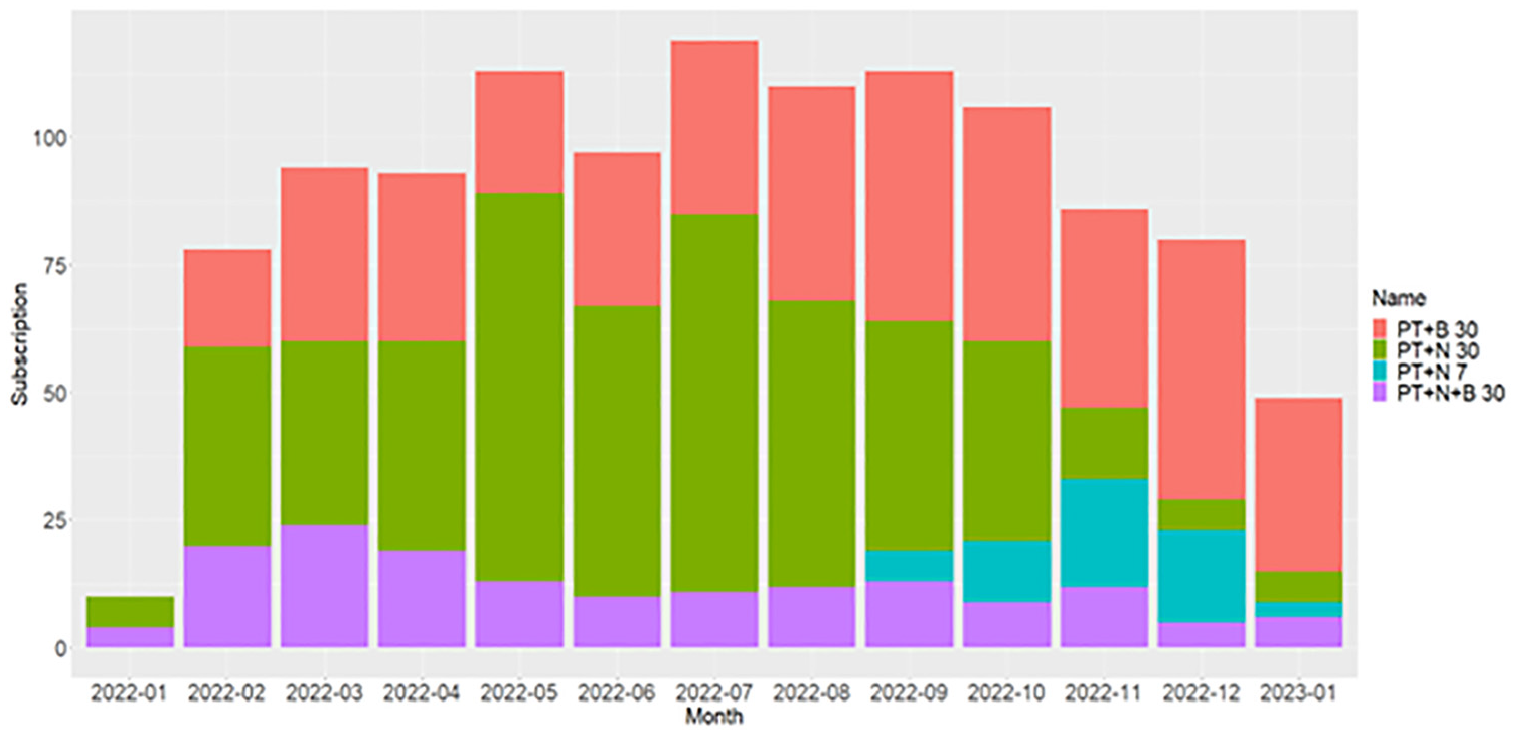
Number of multimodal bundle subscriptions over time.
For the distribution of trip type, compared with the PAYG option, users were more willing to adopt micro-mobility services with PASS (MaaS multimodal bundle inclusive) options. When considering the characteristic of vehicle type, either for Neuron or Beam, e-scooters were much more popular than e-bikes. For Neuron trips, most trips were generated by e-scooters with PASS options (79.0%), followed by e-bikes with PAYG options (11.9%), and e-scooters with PAYG options (8.2%). In addition, either for the PASS or PAYG option with Beam, e-scooters were more popular than e-bikes.
When looking into the distribution of trip duration grouped by trip type and vehicle type, either for Neuron or Beam, trips generated by e-bikes with PASS options had the longest trip durations. An interesting finding is that Neuron PASS subscribers made much longer trips than Beam PASS subscribers, although the mobility allowance in Beam bundles (120 min inclusive per day) was larger than that for Neuron bundles (90 min inclusive per day).
Figure 4 shows the distribution of customers’ multimodal bundle subscriptions by month. A total of 1,148 multimodal bundles were purchased during this period. The number of subscriptions increased in the beginning to a peak of 119 in July 2022 and then gradually dropped to around 81 in December 2022. The multimodal bundles can be divided into four groups: PT+B 30, PT+N 7, PT+N 30, PT+N+B 30. Among those bundle subscriptions, the most popular bundle was PT+N 30, followed by PT+B 30, and PT+N+B 30.
We used the subsample of 273 multimodal bundle subscribers’ subscription records and trip-level shared micro-mobility service data to understand how shared micro-mobility budgets were used. Table 4 presents the budget utilization of micro-mobility PASS subscribers. Firstly, we found that for Neuron PASS subscribers, the average percentage of active days during their total subscription period was 52.0%, and the same metric for Beam PASS subscribers was 54.1%. The findings indicate that customers who purchased multimodal bundles had days where they did not undertake any micro-mobility trips.
Characteristics of Budget Utilization of Micro-Mobility PASS Subscribers
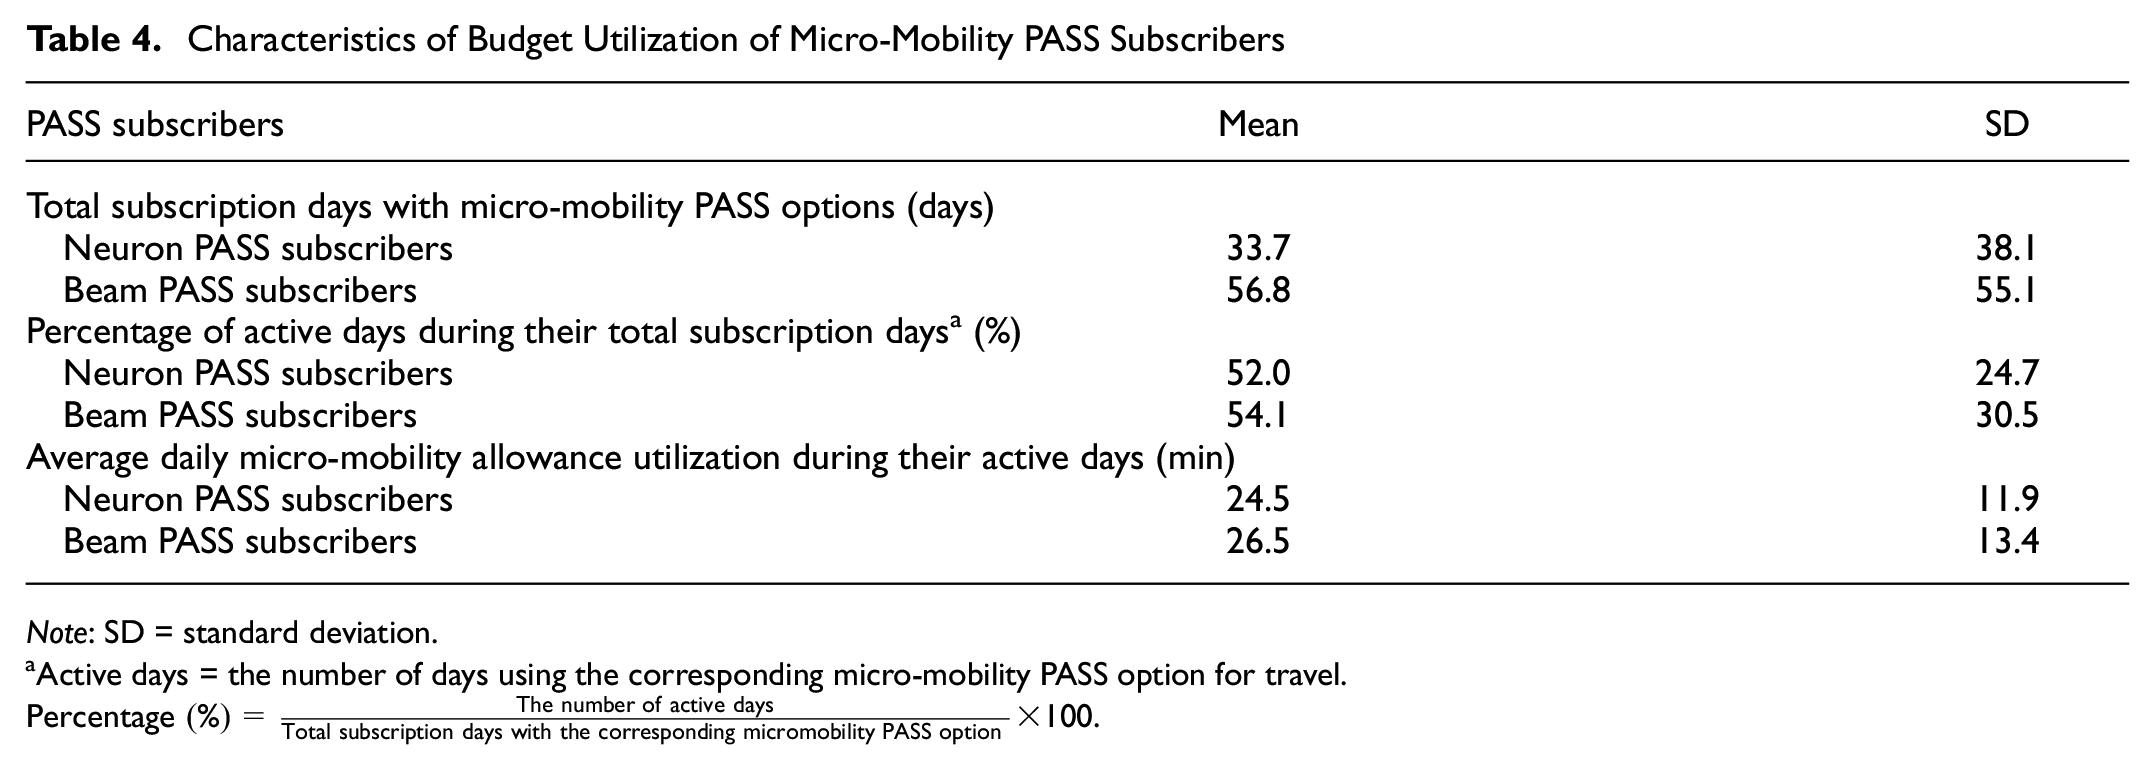
Note: SD = standard deviation.
Active days = the number of days using the corresponding micro-mobility PASS option for travel.
Since our multimodal bundles offered a daily allowance of free shared micro-mobility services, we also investigated customers’ minutes of use outside of their allowance, on the days they used micro-mobility. Specifically, we aggregated the trip-level data of shared micro-mobility service by date, trip type (Beam PASS or Neuron PASS), and user ID, among the micro-mobility PASS subscribers. As shown in Table 4, Beam PASS subscribers with a 120-min daily allowance on average only used 26.5 min on the days they used the e-bikes and e-scooters. Neuron PASS subscribers with a 90-min daily budget on average only used 24.5 min.
Overall, the findings indicated that there was a substantial underutilization of available micro-mobility budgets within existing multimodal bundles. However, since there were no data available to identify the specific characteristics of the vehicle fleet size on campus or in the cities, we should acknowledge that our findings may be subject to biases resulting from this unknown factor.
Regression Analysis of Daily Utilization of Shared Micro-Mobility Services
To answer the questions, “Which factors (e.g., user type, trip type, day of week, public holiday, semester, weather characteristics) affect daily utilization of shared micro-mobility services?” and “What are the differences in daily utilization of shared micro-mobility services between basic and multimodal bundle subscribers?,” two regression models were fitted on the Neuron and Beam trips, respectively. Specifically, the dependent variable (i.e., daily utilization) and the independent variable (i.e., temperature) were log-transformed.
The regression results are summarized in Table 5. The signs of the coefficients were generally in line with expectations. The results of the F-test in Table 5 also indicate that our models outperformed the null model or the constant model. However, note that the overall explanatory power of the model was relatively low, with R2 values in the range of 0.1078 to 0.1584, which could have been caused by the limited explanatory power of the available independent variables and the unpredictable dynamics in usage. Our goal here was to examine whether the selected explanatory variables significantly affected users’ daily utilization of shared micro-mobility services, and not to predict their usage behavior. Further, the corresponding research insights argue that a low R2 (i.e., at least 0.10) is acceptable if most explanatory variables are statistically significant ( 35 ). In our estimated models, the value of R2 was very close to 0.1 and most variables were statistically significant at the 90% level. Therefore, the estimated models were considered valid for differentiating customer usage.
Regression Results of Daily Utilization of Micro-Mobility Services
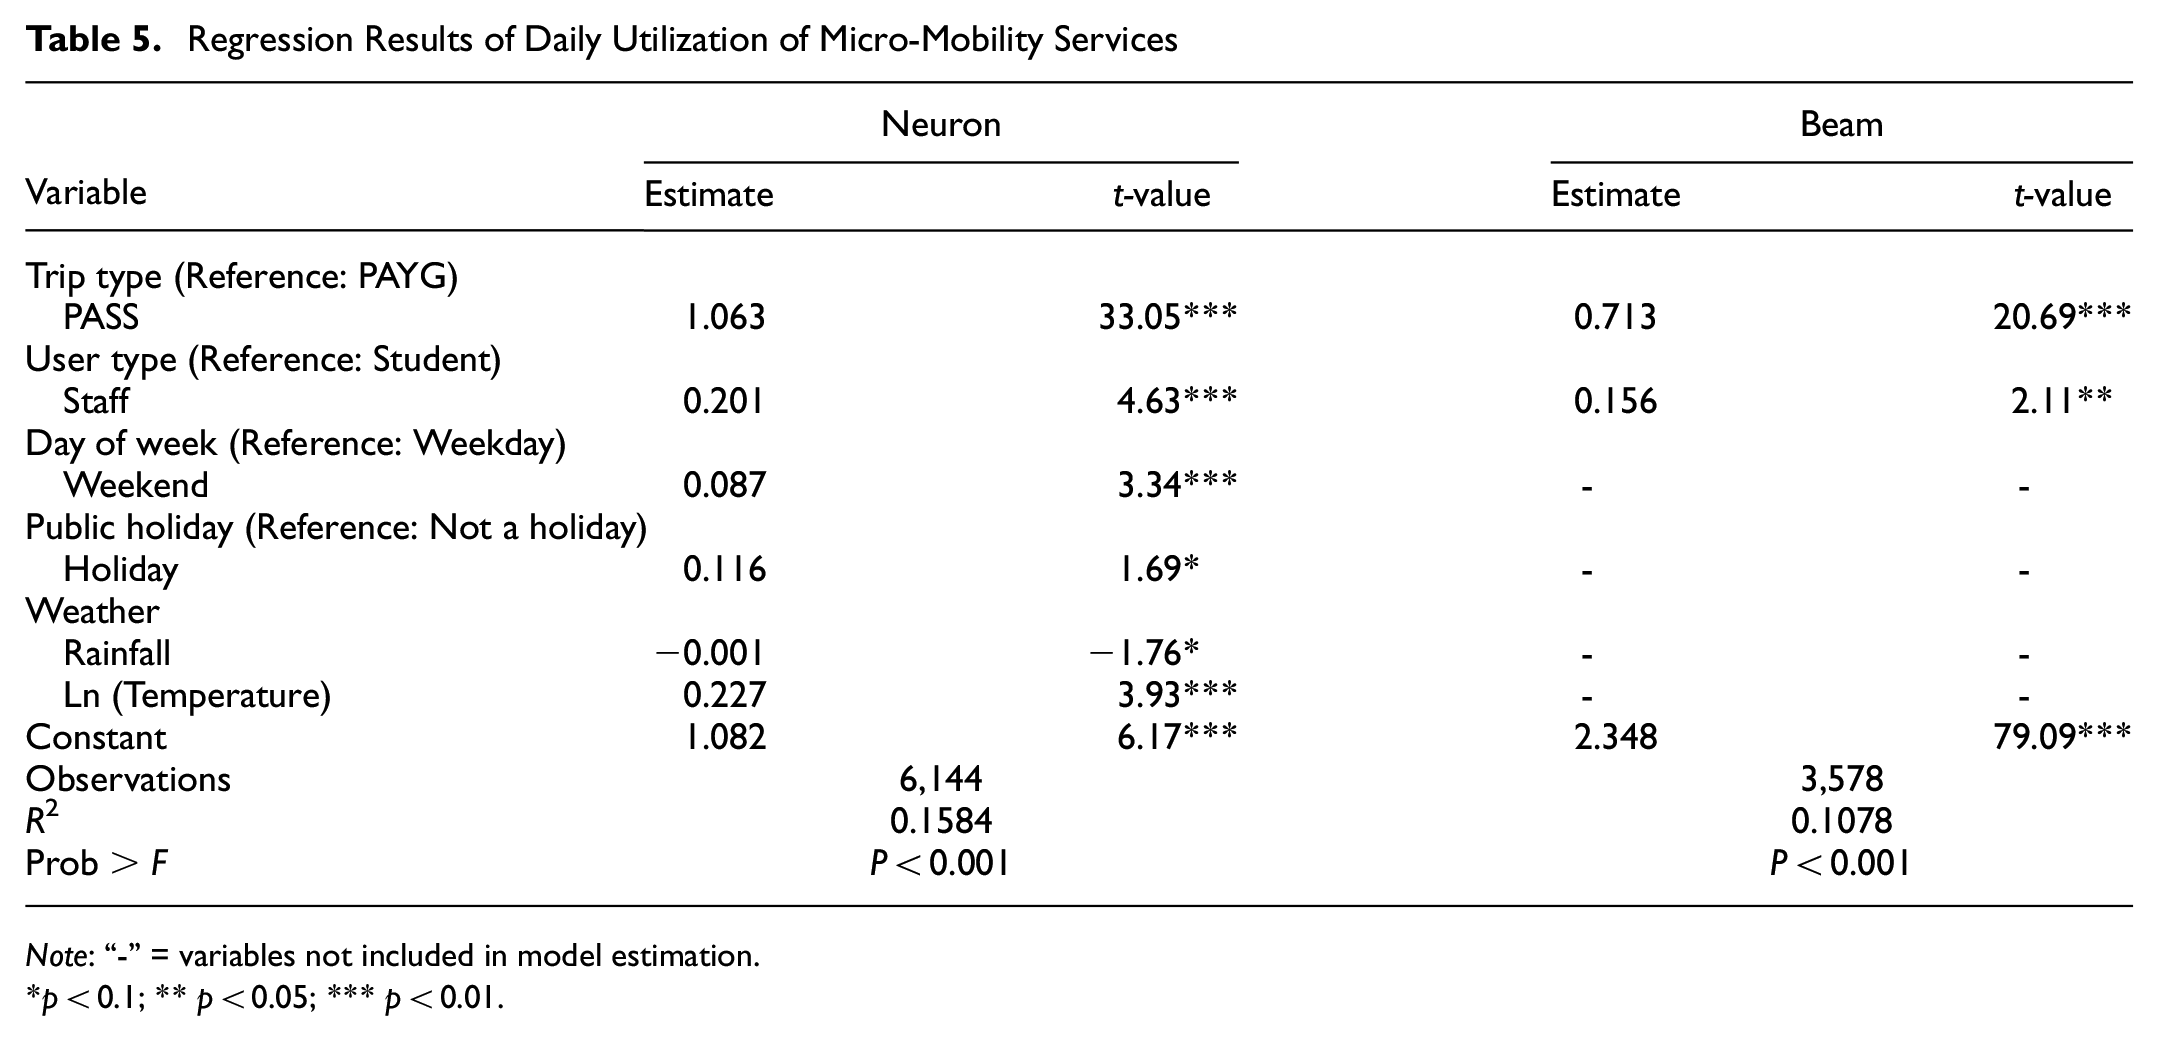
Note: “-” = variables not included in model estimation.
p < 0.1; ** p < 0.05; *** p < 0.01.
Neuron and Beam PASS subscribers used shared micro-mobility services 2.90 and 2.04 times longer on each participation day, compared with PAYG users. Staff utilized shared micro-mobility services about 1.2 times longer, compared with students. From the temporal perspective, weekends and holidays were associated with more utilization for Neuron users. The temperature appeared to have a positive impact on Neuron utilization. As expected, an increase in the amount of rainfall slightly decreased Neuron utilization.
Regression Analysis of Daily Demand for Trips with PASS Options
To answer, “Which factors (e.g., day of week, public holiday, semester, weather characteristics) affect the daily demand for trips with PASS options in shared micro-mobility services?” and “How do different service providers interact?,” three models were fitted on two different groups (e.g., Neuron and Beam PASS) for the number of trips per day of users with a PASS. The third model was added to examine the interaction between Neuron with Beam. The results are presented in Table 6. The results of the LR test indicated that the negative binomial regression models had a significantly better fit than the Poisson models. Also, the value of the estimated alpha was statistically significantly different from 0, which in our case meant the negative binomial regression model was more suitable for behavioral analysis ( 36 ). The p-value of the prob > chi2 test indicated that our final models outperformed the null model or the constant model. Note that, overall, a limited number of explanatory variables and unpredictable dynamic usage behaviors decreased the goodness fit of the regression models, but most selected variables were statistically significant.
Negative Binomial Regression Results of Daily Demand of PASS Trips
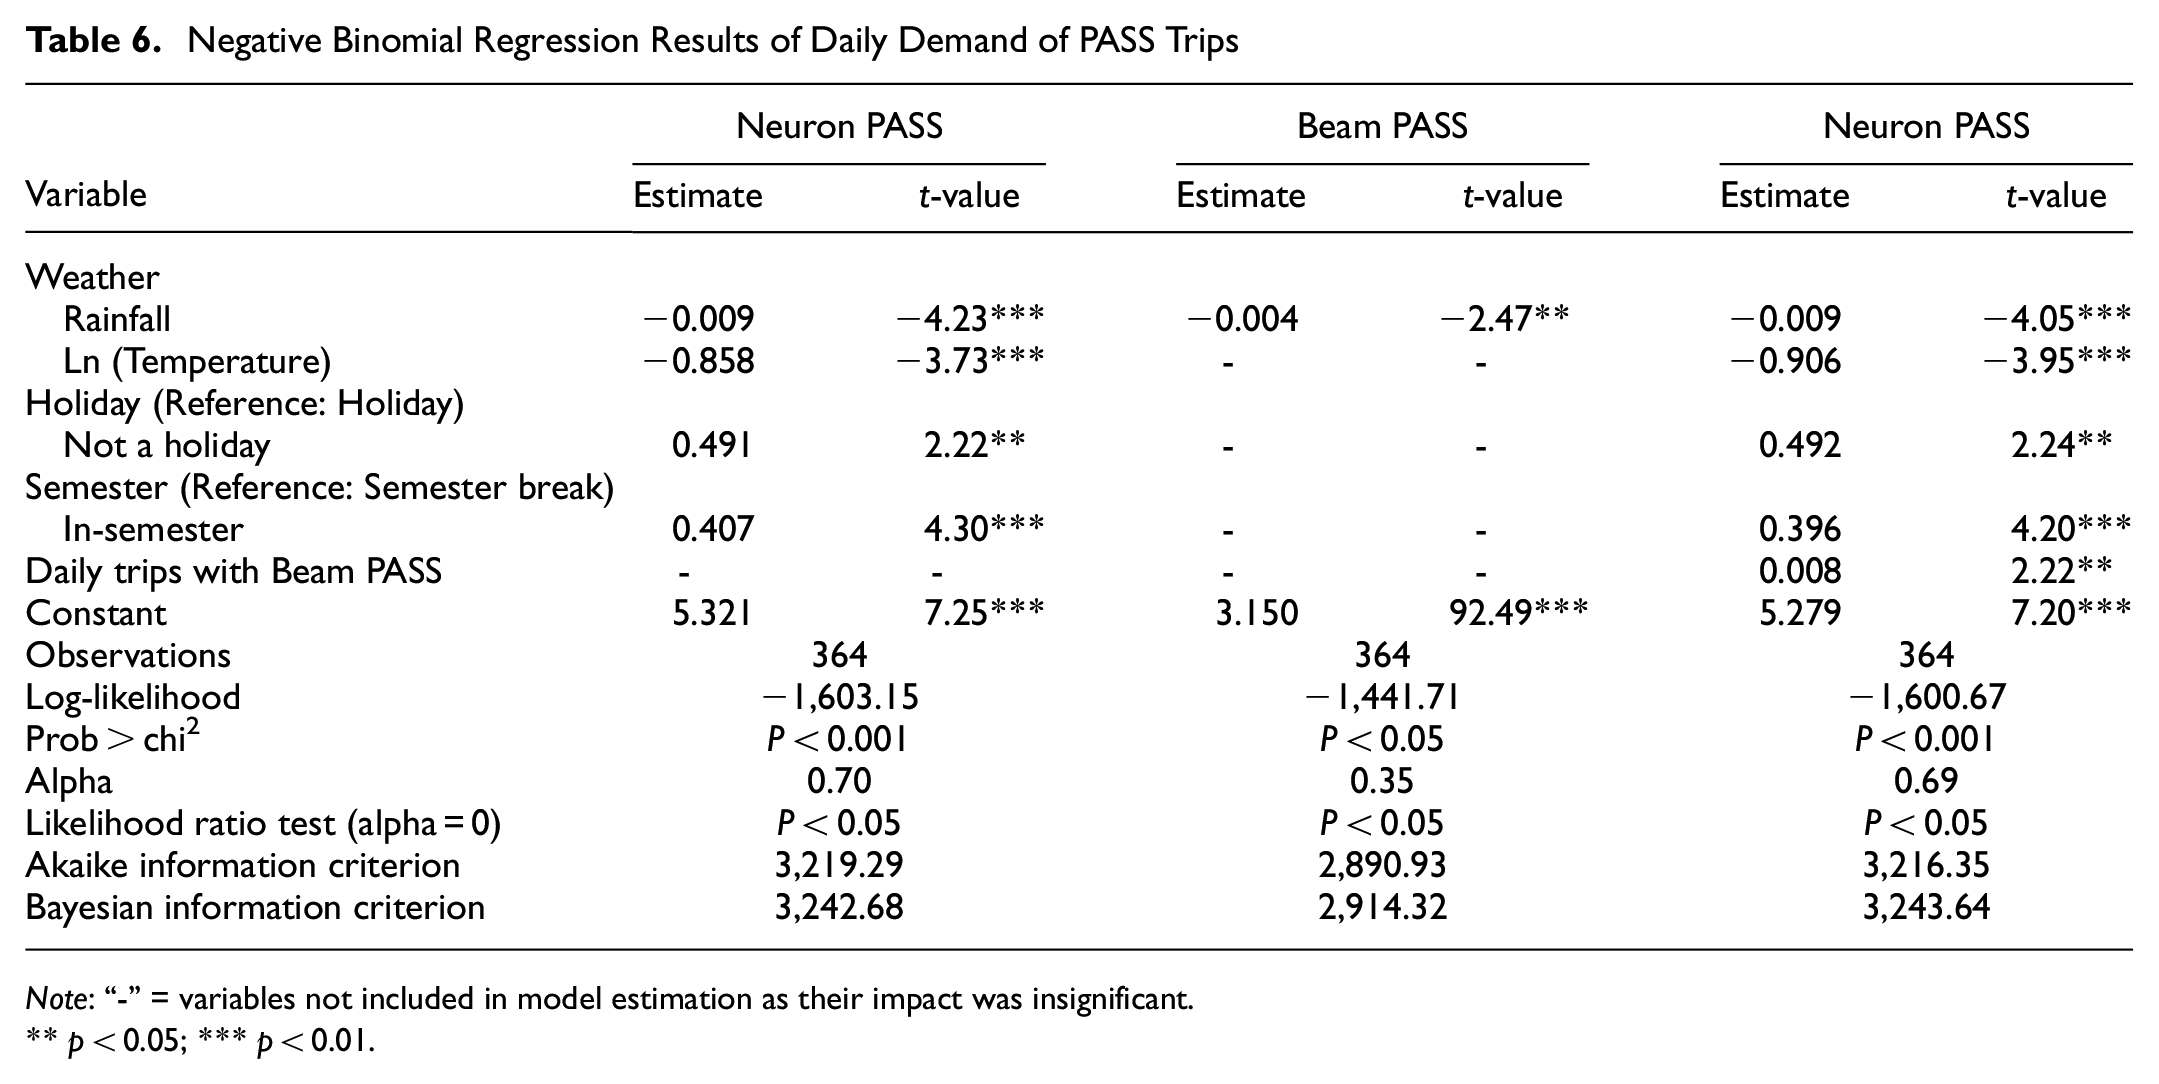
Note: “-” = variables not included in model estimation as their impact was insignificant.
** p < 0.05; *** p < 0.01.
The rainfall and temperature had negative impacts on the daily demand for trips with PASS options. Neuron subscribers showed higher sensitivity to changing weather, as their coefficient was well above that of Beam PASS subscribers. From a temporal perspective, Neuron PASS subscribers’ peak activity usually occurred during the semester and nonholiday periods; a likely reason is that some participants chose micro-mobility services for travel to and from university.
For the interaction, it was curious to observe that Beam PASS subscribers’ activity had a positive and significant coefficient on Neuron users’ trip-making. One possible interpretation of this result is that, in a MaaS trial, different micro-mobility service providers experience similar positive correlations. This suggests that rather than being competitors, different micro-mobility providers may receive positive externalities when offering competitive services in MaaS bundles.
Discussion and Conclusion
A comprehensive analysis of actual MaaS experience is important to promote more personalized and user-oriented travel plans for travelers and to foster the sustainable development of emerging mobility business models. This research explored a university population’s travel experience in MaaS trials and analyzed their usage of shared micro-mobility services in the trial. The trial datasets were collected from the UQ community. The main findings are as follows:
Basic mobility bundles, including unlimited PT services, were most popular in the MaaS trial, which aligns with the findings of previous pilot studies ( 37 ).
Compared with the PAYG option, trial participants were more willing to adopt shared micro-mobility services with PASS options.
There was a substantial underutilization of shared micro-mobility budgets within existing mobility bundles. For Neuron PASS subscribers, the average percentage of active days during their total subscription was 52.0% and the figure for Beam PASS subscribers was 54.1%. Beam PASS subscribers with a 120-min daily budget on average only used 26.5 min, whereas Neuron PASS subscribers with a 90-min daily budget on average only used 24.5 min.
The participants’ daily utilization of shared micro-mobility services was significantly related to user type, trip type, day of week, public holidays, as well as weather characteristics. On average, multimodal bundle subscribers used shared micro-mobility services about two to three times longer per day than basic bundle users.
The important factors affecting the daily demand for micro-mobility trips with PASS options in the MaaS trial included weather characteristics, public holiday or not, semester or not, as well as the interaction of service providers. Importantly, shared micro-mobility service providers seemed to create positive externalities that supported greater demand for micro-mobility.
This research contributes empirical evidence on MaaS trials by better understanding the MaaS experience of users in a university community, and by evaluating the effects of bundle uptake on shared micro-mobility services. Based on the research findings, this paper describes some of the potential positive impacts on optimizing MaaS implementation/operation and expanding the knowledge pool of actual MaaS experiences.
From the perspective of enhancing MaaS implementation and operation, these findings are insightful for pricing mobility bundles and for adjusting existing MaaS business models. Our analysis indicates that PT service played a key role in supporting MaaS trials, nonetheless, the role of shared micro-mobility services cannot be neglected. Future studies on MaaS trials could consider designing PT-oriented mobility packages and incorporating personalized allowances (budgets) of shared micro-mobility services into multimodal mobility plans. In addition, our results suggest that there is an underutilization of budgets within existing mobility bundles. One potential alternative would be to reduce the micro-mobility allowances within existing mobility bundles and change them from a daily base to a weekly or monthly base, thus accounting for customers’ day-to-day dynamic demands for shared micro-mobility services. Also, future practices/strategies could optimize bundle pricing by reducing allowances in each mobility bundle to make service offerings more tailored to travel needs, thus promoting bundle subscription/uptake. The strategy of “subscription sharing,” that is, allowing the sharing of purchased mobility packages with other travelers, seems to be highly favored by subscribers ( 14 ). Therefore, this strategy could also be considered as a promising solution to ease underutilization behaviors and encourage the use of shared micro-mobility services in MaaS trials. Finally, our results confirmed that the supportive externalities between different shared micro-mobility service operators could increase utilization of shared micro-mobility services.
From the perspective of expanding our understanding of MaaS trials, our analysis has also helped to generate first-hand knowledge of actual MaaS experiences in a university community, which has been underinvestigated in existing studies.
The main limitation of this research was the lack of in-depth behavioral analysis to answer why there was a low usage rate of micro-mobility services in the MaaS trial, and why there was a substantial underutilization of shared micro-mobility budgets within multimodal bundles. In addition, we analyzed MaaS trial data from only one university community. Therefore, the research findings are likely to be limited to the specific context of UQ and may not be easily generalized to the full population and/or to other cities or countries. Also, since we did not collect all customers’ detailed demographic characteristics, it would be difficult to evaluate the representativeness of our research sample for the whole university population, or to explore the impacts of car ownership on any kind of bundle subscription. Further, it is necessary to clarify whether these unknown factors may have caused biases in the above usage behavioral analysis. Finally, we acknowledge that the overall explanatory power of the models was relatively low; this was partly caused by the limited number of explanatory variables and unpredictable dynamics in usage behaviors. Overall, it is essential to acknowledge that our analysis uncovered participant behaviors only in relation to shared micro-mobility services in the trial and, as such, the related findings are limited in answering whether including shared micro-mobility services within a MaaS offer would be necessary and useful.
To overcome these limitations, it would be useful to set up a control group of participants who do not travel using MaaS bundles: by comparing the difference in usage of shared micro-mobility services between the control group participants and MaaS subscribers, it would be possible to accurately quantify the impacts of MaaS bundles. Future studies should also conduct surveys to collect participants’ detailed socio-demographics and providers’ vehicle offering information to better capture factors affecting usage behavior. Further, given that our current research focused on exploring subscribers’ daily utilization of micro-mobility services when they used these services, future studies could consider analyzing behaviors by assessing days of no usage versus days with usage. Finally, a comprehensive, in-depth evaluation of the impacts of MaaS trials on travel behavior could be interesting. For example, studies could focus on exploring their effects on participants’ attitudes toward car ownership/purchase, or on the long-term use of PT and micro-mobility options with a long-term MaaS deployment.
Footnotes
Acknowledgements
The authors thank the MaaS operator (ODIN PASS PTY LTD) for providing data for this research. The authors also thank the handling editor and reviewers for their constructive comments to improve the quality of this paper.
Author Contributions
The authors confirm contribution to the paper as follows: study conception and design: X. Chen, M. Hickman; data collection: X. Chen; analysis and interpretation of results: X. Chen, M. Hickman, Y. Lu; draft manuscript preparation: X. Chen, M. Hickman. All authors reviewed the results and approved the final version of the manuscript.
Declaration of Conflicting Interests
The authors declared no potential conflicts of interest with respect to the research, authorship, and/or publication of this article.
Funding
The authors disclosed receipt of the following financial support for the research, authorship, and/or publication of this article: This research was funded by iMOVE and supported by the Cooperative Research Centres Program, an Australian Government initiative. The research also received funding from the Queensland Department of Transport and Main Roads, and the University of Queensland.