
Abstract
Electric mobility transition has been gradually gaining momentum, driven by several considerations, including the urgency to combat climate change impacts attributed to private transport based on the internal combustion engine. The nature and impacts of such a transition will inevitably vary across countries because of differences in the mobility patterns and preferences in the societies, as well as the policy landscape. In Sub-Saharan Africa, paratransit is one of the dominant forms of transport. This motivates the need to assess its viability for electric mobility transition, focusing on electric motorcycles in particular. Using Kenya as case study, in conjunction with mobility data collected in several Sub-Saharan countries, this research provides insight on the potential adoption and impacts of electric motorcycles in the taxi industry, based on the observed trip characteristics and relative fuel and electricity costs. The economic benefits for taxi drivers as well as the capability of the electricity infrastructure to support such transition are considered. The paper concludes that the transition to electric mobility among motorcycle taxis is feasible in Kenya. The paper also discusses implications for the electricity grid, in relation to the possible increase in the electricity consumption and power needs under various electric two-wheeler proliferation scenarios.
Keywords
Electric mobility transition has seen a substantial growth over the past decade, driven by several considerations, including by the urgency to combat climate change impacts attributed to private transport using internal combustion engines. The impacts of the transition tend to be different in various countries because of differences in the mobility patterns and preferences in the societies, as well as the policy landscape. In Sub-Saharan Africa, paratransit is the dominant transport system and, therefore, its viability for electric mobility transition needs to be assessed. However, studies assessing the potential for electrification of road fleets remain comparatively rare, especially at a disaggregate level, despite the region experiencing amongst the most rapid rates of population growth, which leads to associated growth in mobility demand. At the same time, detailed understanding of the patterns in demand, such as trip frequency, trip length distributions, or payload (which is specific to taxis and freight carriers) is crucial for determining the extent to which electric two-wheelers (E2Ws) can meet the existing needs. Such insights are, in the context of Sub-Saharan Africa, comparatively rate. Equally, knowledge from other contexts may not be transferable because of the peculiar nature of the transport market, such as a large share of informal paratransit modes, or utilization of motorcycle vehicles—for example, multi-passenger use. The research presented in this paper focuses on motorcycles, locally (especially in East Africa) referred to as “boda boda,” and the feasibility of transition of motorcycle-based taxis toward electric motorcycles—E2Ws.
The performance and reliability of E2Ws is dependent on numerous factors such as weather, payload, driving style, and road conditions ( 1 ). The increase in total mass or payload of the vehicle results in increase in the electricity consumption of electric vehicles (EVs) because of the additional power required to move the additional mass ( 2 – 4 ). The slope of a road also affects the electricity consumption of EVs because of the need to overcome the additional gradient resistance caused by gravitational force ( 5 , 6 ).
As for empirical research, Bugaje et al. found that the electricity consumption rate of E2Ws in Kenya is between 5.7 kW-h/100 km to 7.3 kW-h/100 km, depending on road surface or speed, though the analysis did not include road slope as a factor ( 7 ). Tokple conducted research on the impacts of E2W transition of motorcycle taxis in a rural location in Talek, Kenya ( 8 ). Tokple found that a taxi driver would reduce his fuel cost by 47% based on an average daily travel distance of 50 km. This is based on an E2W with 4 kW-h battery capacity and charging on a mini-grid with electricity price rate of 80 Kenyan shilling (KES)/kW-h. Park et al. found that E2W drivers spend 32% less on fuel cost compared with ICE motorcycle drivers among taxi drivers in Uganda, resulting in savings of 1 U.S. dollar (USD) per day ( 9 ). This is based on an average daily travel distance of 70 km. They also found that monthly maintenance cost is lower by 45%, and that E2W drivers gain higher revenue by 20 USD per week because of the higher proportion of drivers using ride-hailing applications. Colett et al. estimated that E2W drivers in Kenya would experience cost savings of 0.05–0.075 USD/km ( 10 ). Elsewhere, Afraah et al. found that, in Indonesia, the repair cost per kilometer for E2Ws is 41.6% lower than internal combustion engine (ICE) motorcycles, while maintenance cost per session for E2Ws is 41% lower than ICE motorcycles ( 11 ). EPRA found that Kenya has enough power generation and power capacity to sustain 100% electric mobility transition of motorcycles in the country, estimated as 6,000 MW-h and 300 MW in relation to the consumption and power, respectively ( 12 ). The report also found that fuel costs would be lower for E2Ws than ICE motorcycles. However, this analysis did not consider the possibilities of varying E2W battery capacity nor other factors that may influence the range of E2Ws, such as actual trip attributes: distances, payload, or slope of the road. In addition, hardly any research takes into account rural conditions and mobility needs, which may differ from the urban areas.
Aim and Objectives of the Present Paper
The aim of this paper is to provide insights into the technical and commercial viability of E2Ws for the motorcycle taxi market and the consequent impacts on the national electricity load, using rural Kenya as a case study. Toward this end, the specific objectives are:
to develop a suitable understanding of the trip-making patterns among motorcycle taxis, using empirical data from Sub-Saharan Africa (including Kenya)
to perform scenario analyses based on possible E2W technologies that could be adopted, to understand the extent to which the present demand can be met
to analyze, under status quo in the electricity sector capabilities, the ability of Kenya’s electricity and power generation to meet the electricity demand generated by the scenarios modelled.
Outline of the Paper
This paper is structured in as follows. The next section presents the context of the present study, including empirical data used. The section after that describes the modelling approach, including data processing details and assumptions used in the scenario analysis. The penultimate section presents the findings, and the final section concludes the paper.
Empirical Context
Kenya as the Case Study
Kenya is a lower-middle-income country located in East Africa. As of 2020, Kenya was one of the largest economies in the region with a gross domestic product (GDP) $101.01 billion USD, a population of 53.77 million, and an area of 580.4 thousand square kilometers ( 13 ). The geography of Kenya is low south-east coastal and eastern regions, and a high western mountainous region.
A representation of the modal share of transport in Kenya is shown in Figure 1, which shows that the passenger car is not the main mode of travel in Kenya. (Note that the data is from 2013 and only represents the modal share of Nairobi.) However, the data provides a reasonable proxy for the state of ground transport in Kenya. This picture is complemented with information from the Sustainable Mobility for All report that identifies a total of 3.6 million registered vehicles in 2019, which was comprised of 1.7 million motorcycles and three-wheelers, 1.3 million cars, 340,000 utilities and van pickups, 172,000 trucks, and 112,000 buses and minibuses ( 15 ). Furthermore, there has been significant growth in motorcycles and three-wheelers (14.6%) and cars (7.5%) over the last 4 years ( 15 ). This rapid growth and popularity of motorcycles can be attributed to their low cost and ability to access rural areas with poor road infrastructure ( 12 ).
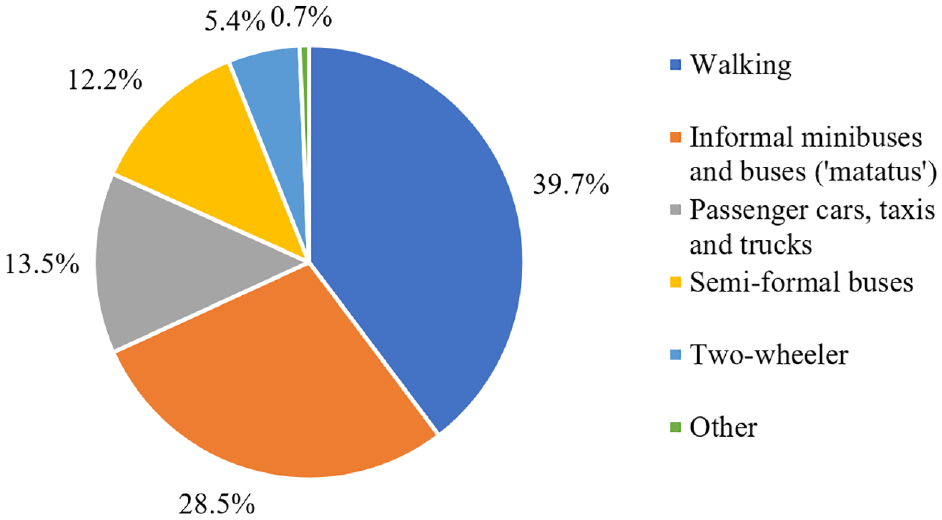
Modal share of transport in Nairobi, Kenya, in 2013.
However, despite planning efforts by the government, the road infrastructure in Kenya is often inadequate and poor of quality. This is because of the top-down approach taken by the government in its planning that may inadequately recognize and address local needs ( 14 ). At the same time, the Kenyan government is designing a policy agenda that is set to alter the trajectory of the country’s transport sector. For example, it seeks to address the problem of second-hand cars forming 95% of the imported vehicles in Kenya. Toward this challenge, the government has set a ban on the import of second-hand cars that are older than 7 years, which would limit the increase in greenhouse gas (GHG) emissions. The government has also announced several measures to facilitate the transition to electric mobility, by reducing excise duty from 20% to 10% for EVs, targeting 5% of imported EVs by 2025; they also introduced technical standards for EVs in 2019 ( 15 ).
As of 2019, the annual electricity consumption in Kenya is 8.76 TW-h and the annual electricity generation is 11.46 TW-h, with 90.9% from renewable energy sources ( 12 ). This indicates that there is an excess in electricity supply of approximately 7.416 GW-h per day, which might accommodate the increase in electricity demand from the electric mobility transition. Kenya also has one of the highest electricity access rates in the region with 85% in 2019 ( 16 ). This indicates that, although more work is required to ensure universal access to electricity, there is an opportunity for the country to directly prepare the electrical infrastructure to accommodate the electric mobility transition, benefitting additionally from the large share of renewables in the generation mix.
The favorable policy incentives and regulations, as well as adequate electricity supply, have resulted in several private and public-private pilots of EVs being conducted in Kenya ( 17 ). This has resulted in successful ventures, such as Roam (previously known as Opibus) releasing a locally developed electric bus and locally assembled electric motorcycles ( 18 , 19 ).
Data
The data used in this study is from a survey conducted by a consortium called Research for Community Access Partnership (ReCAP). The survey was conducted in four countries (Kenya, Uganda, Tanzania, and Ghana) between September 2017 and January 2019. The survey was designed to obtain information on the benefits and disbenefits of motorcycles and three-wheelers among riders and other users in rural areas, focusing on various aspects including the finances of owning and operating motorcycle taxis ( 20 ).
The two user groups surveyed, that are of interest to this study, are motorcycle taxi drivers and their respective passengers. In Kenya, the survey was conducted in eight settlements in four different counties in two distinct agro-ecological zones ( 20 ).
All the settlements are in rural areas with various degrees of accessibility (with data on distance to nearest city, distance to nearest towns, distance to sealed [e.g., tarmac] road and transport modes available), population size, and demographics.
The topography of the areas surrounding the surveyed settlements varies, as shown in Figure 2. The elevation maps of Kenya suggest that the roads are not necessarily flat and are sloped in places. The two counties (Nyeri and Nakuru) located in the mountainous region have a larger range of changes in elevation, while the two counties (Kilifi and Kwale) located at the coastal region have a smaller range of changes in elevation. The topography maps are then used as the basis for inferring the average slope of the region.
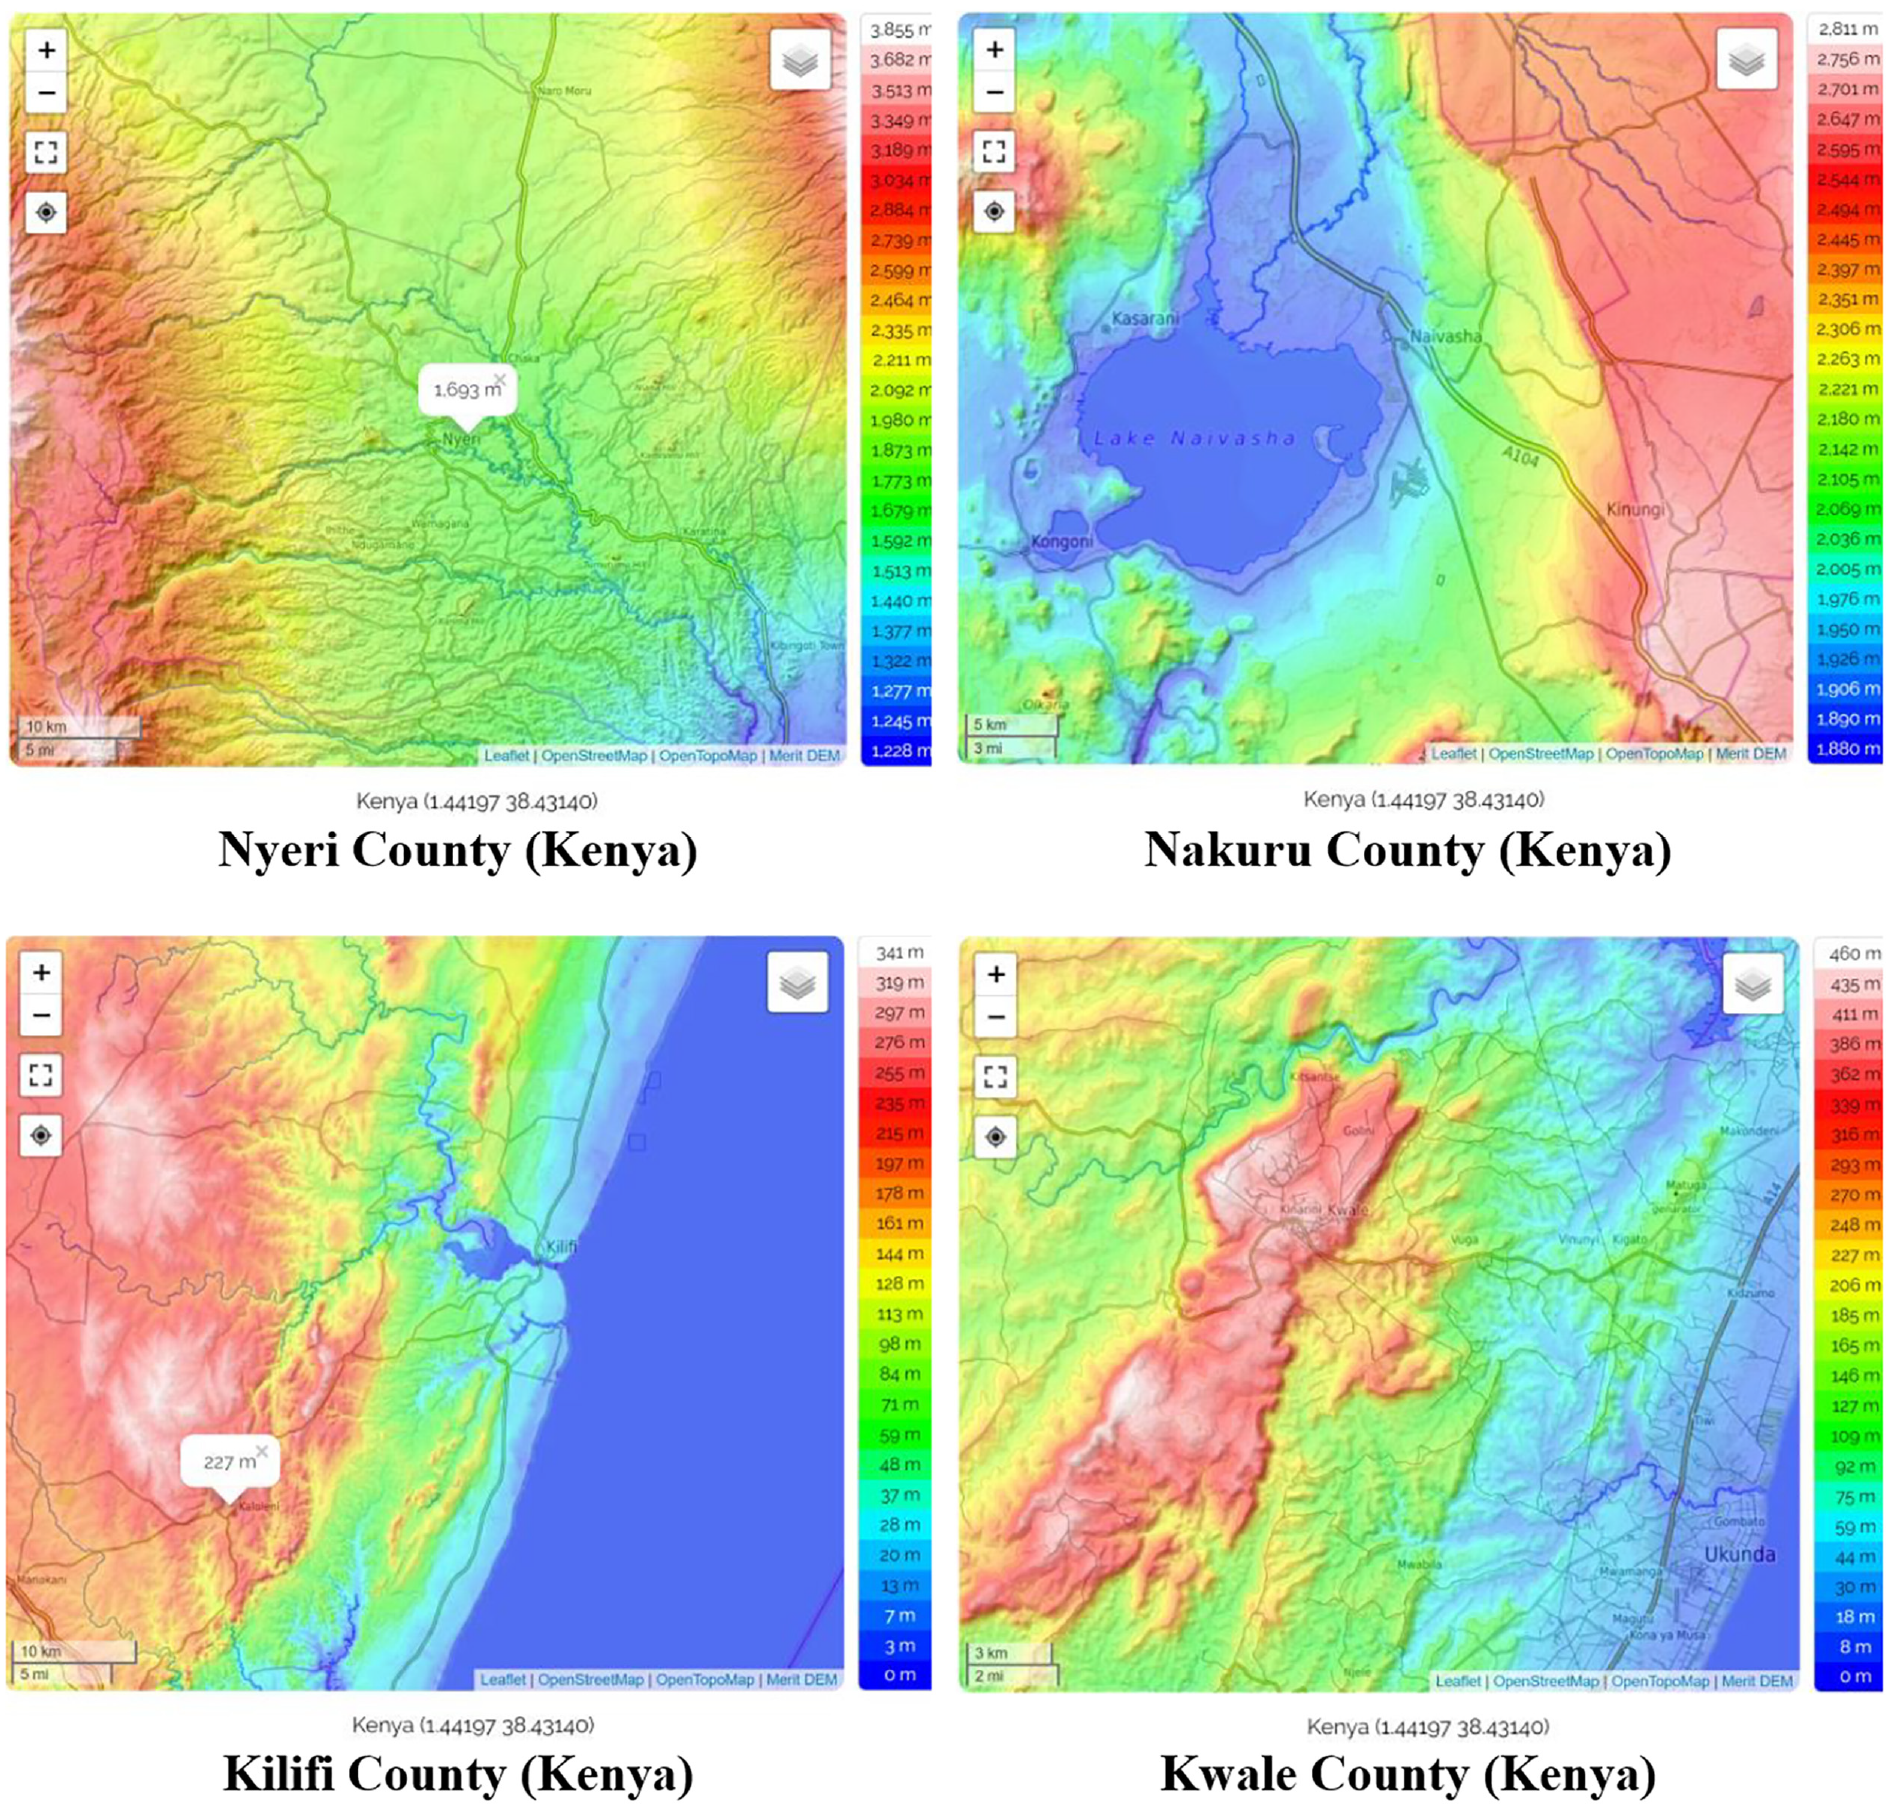
Topography of the surveyed locations in Kenya: Nyeri County (top left), Nakuru County (top right), Kilifi County (bottom left), Kwale County (bottom right).
The key information from the survey used in the current analysis includes ownership data (motorcycle type, engine size), trip data (trip distance, trip fare, trip cargo mass, number of passengers segmented by gender), daily travel patterns (distance traveled, revenue, fuel cost, repair and maintenance [R&M] cost) as well as sociodemographic information (gender and age) of the driver. The survey was conducted in a paper format in-person before being recoded into a database, though with certain datapoints clearly erroneous or missing. To facilitate the analysis, questions based on ranges of values such as the distance traveled on the last trip, were converted to assumed conservative values, for example, upper bound of the range. Such assumptions are motivated by the need to analyze the viability of E2Ws for motorcycle taxis, that is, to establish feasibility with credibility, even if at the cost of imposing a margin of tolerance in the analysis. If the interaval is open (“more than…”), the value is assumed at 150% of the lower bound, for the purpose of operationalizing the analysis. The trip length distribution in the sample is shown in Figure 3. It is noticeable that trips between 2 and 4.9 km are the most frequently occuring category, whilst overall trips below 10 km constitute around 75% of all trips reported. The overall distribution resembles the commonly observed log-normal or Weibull distributions of trip length ( 22 ).
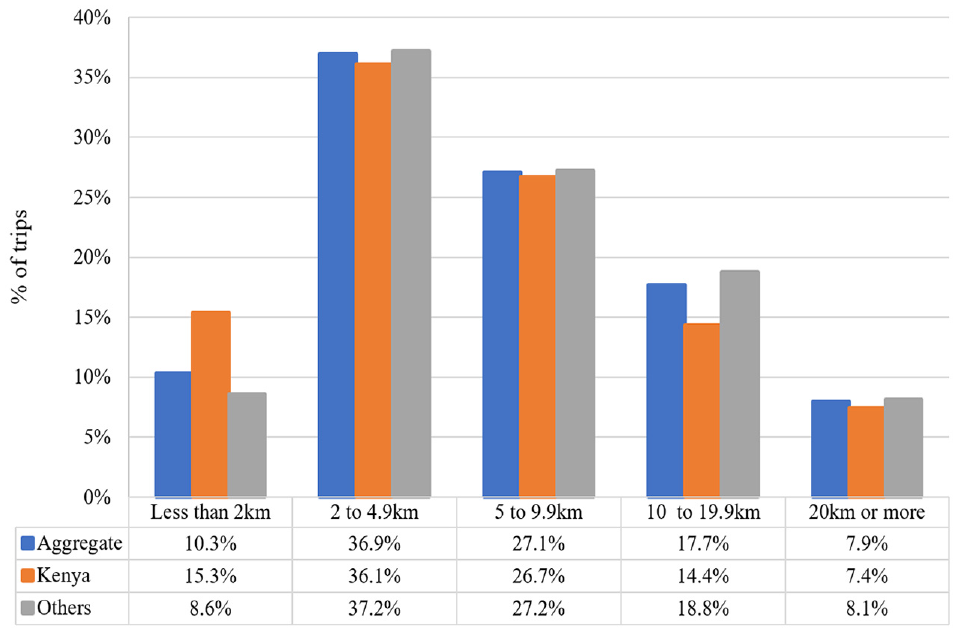
Distribution of the distance range of the surveyed last trip made.
Modelling Approach
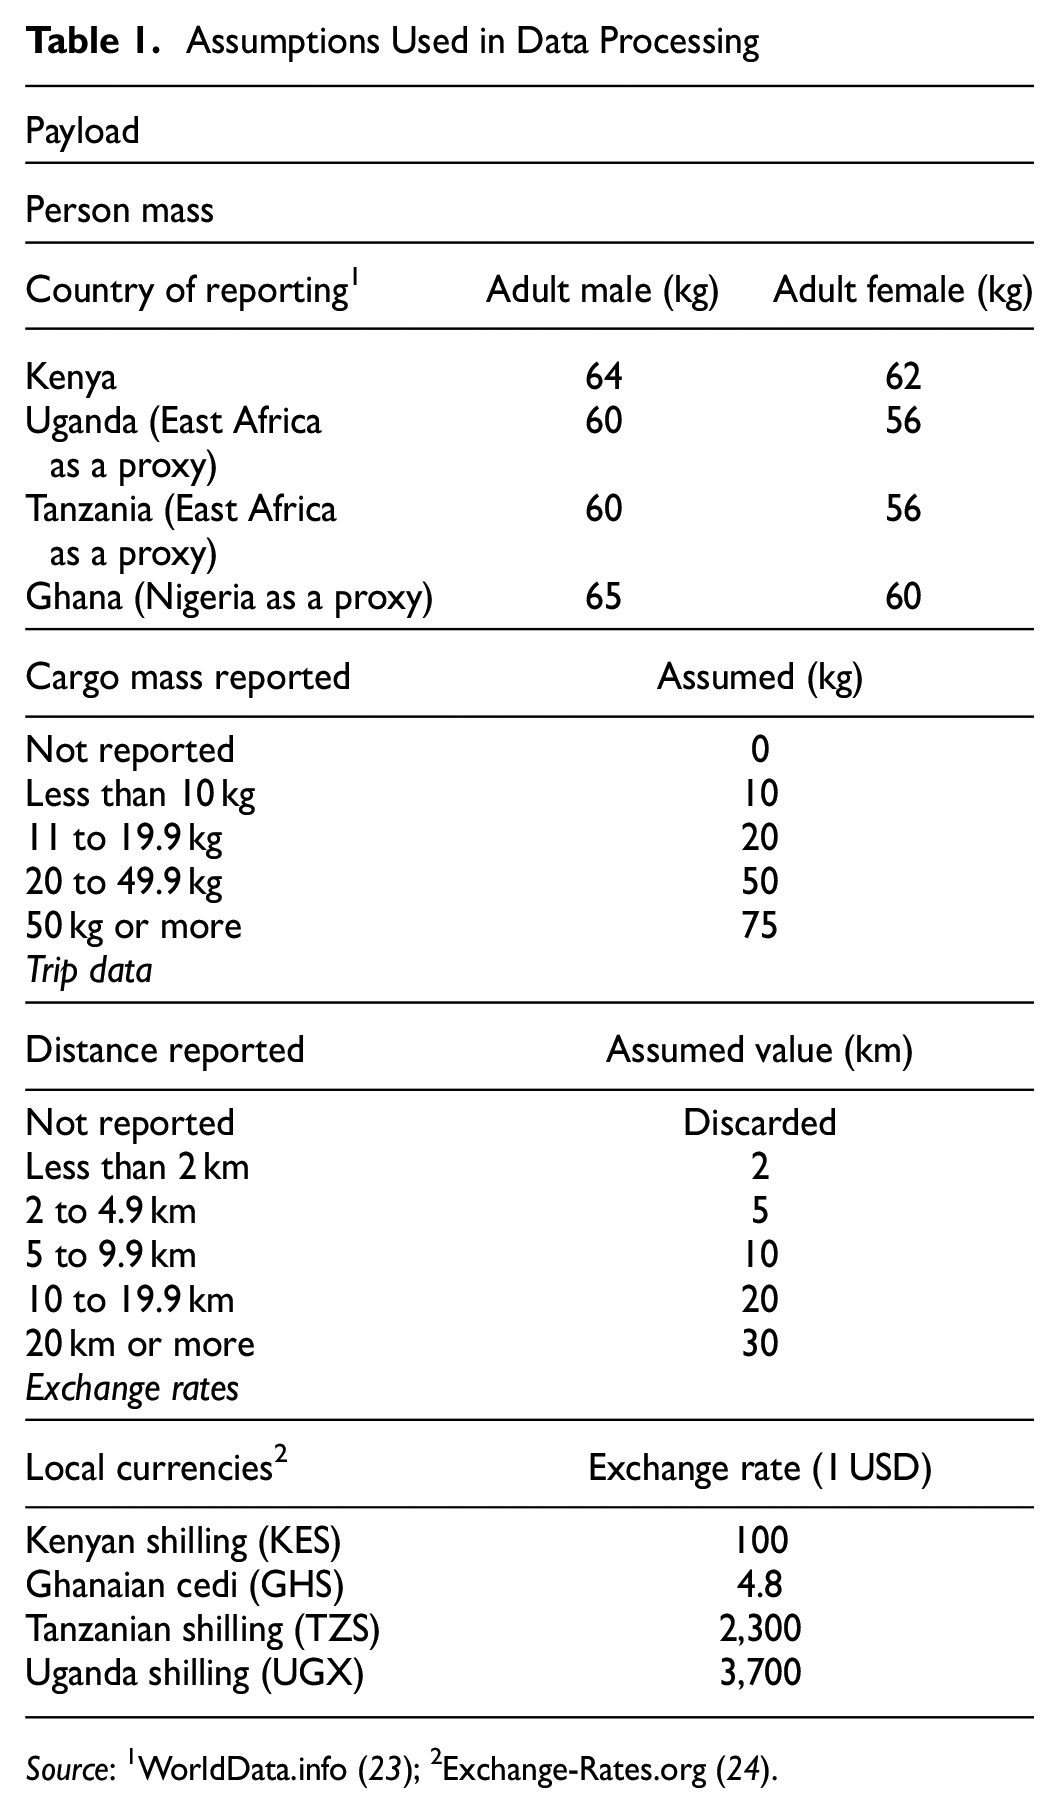
This section outlines how the available data was processed to provide suitable inputs to the subsequent modelling and analysis. Table 1 summarizes the key values used as assumptions throughout the section.
Assumptions Used in Data Processing
Payload Inference
The payload is the most important driver of energy consumption of E2Ws, regardless of the propulsion type. The total payload

Although the survey data does not report on the mass of the driver or passengers, the national average mass for each sociodemographic segment will be used for the calculation of the payload, as shown in Table 1 and Equation 1. As there is no information about average mass of youth in the surveyed countries, the average mass of youth is calculated by scaling the average mass of adults by a conservative factor of 0.6. This is justified on the grounds of the distribution not starting from 0 kg and the expectation of the average mass of youth being skewed toward that of adults, because of the concentration of heavier mass among teenagers in the group.
Trip Attributes and Costs
The conversion of trip distances was undertaken in line with Table 1, where trips with no distance reported were discarded. The data on full day revenue, last trip fare, daily fuel cost, and daily R&M cost are given in discrete values but in four different currencies. For this project, the currency will be standardized to USD to facilitate interpretation of the results, following the exchange rates assumed as reported in Table 1.
E2W Technology Options
The most-used motorcycle among the taxi drivers in Kenya is the Baja Boxer (28%) with a capacity between 125 cc and 150 cc (66%). As the Roam electric motorcycle has the most similar performance (maximum power, torque, and maximum speed), it will be used as the basis of analysis of E2W performance. Roam’s electric motorcycle has two models with different battery capacities: 2.9 kW-h and 5.8 kW-h. The latter differs in having an additional 2.9 kW-h battery with a mass of 18 kg. This additional mass will be added to the payload to better analyze the electricity consumption. The specifications of Roam’s electric motorcycles can be seen in Table 2.
Specifications of Roam Electric Motorcycles
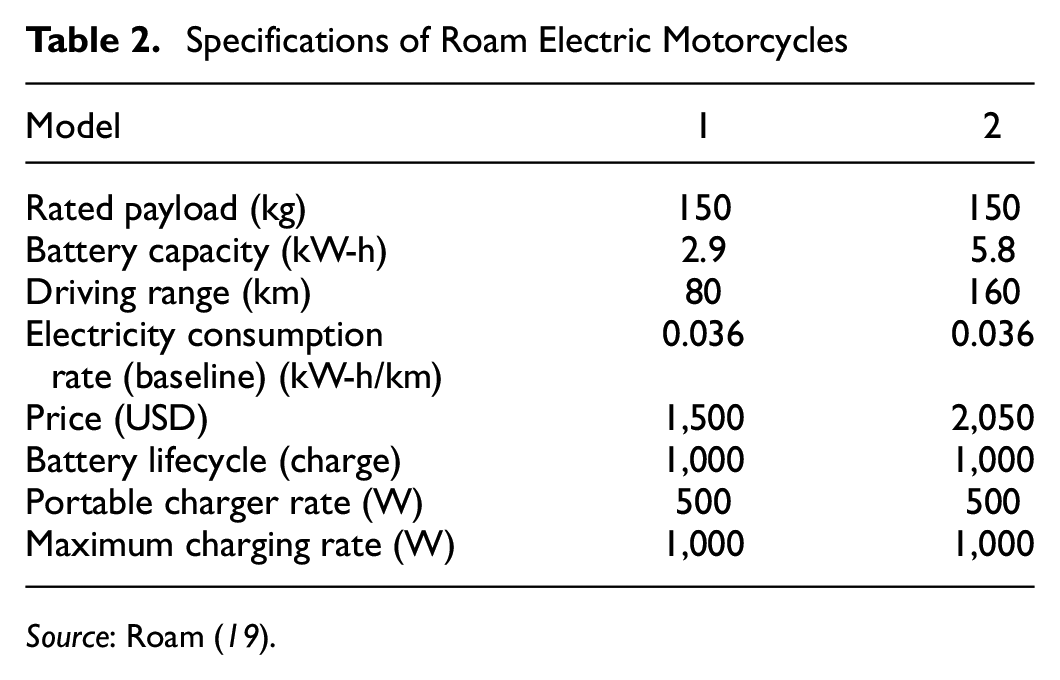
Source: Roam ( 19 ).
The daily electricity consumption of the E2W (


Both Baptista et al. and Weiss et al. and found that increase in vehicle mass by 100% causes average electricity consumption to increase by 50% (see Equation 4) ( 2 , 4 ):

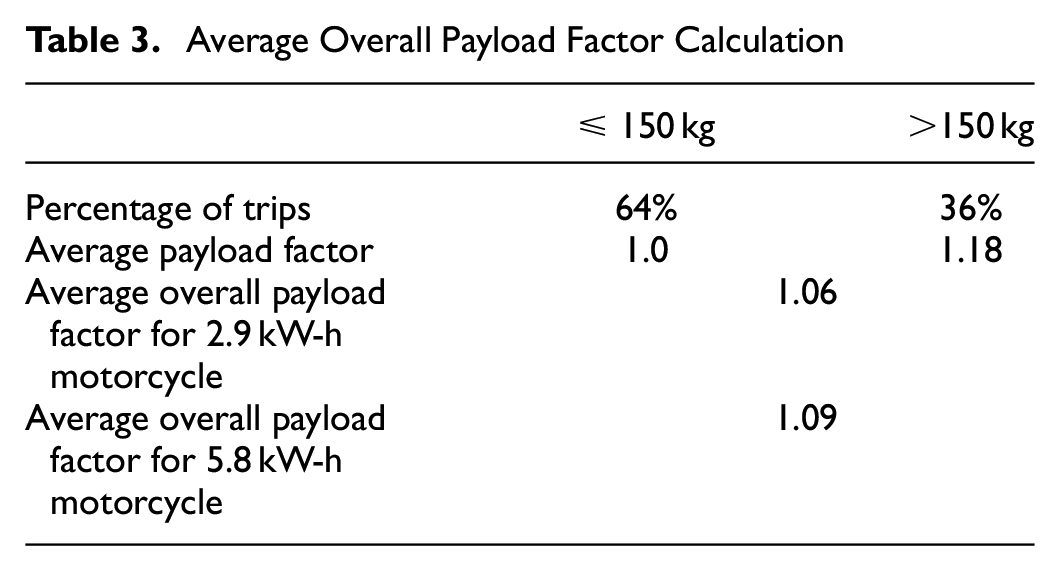
In calculating the average overall payload factor, the payload data is sorted to categorize those within the capacity and those exceeding the rated payload capacity of the E2W. Table 3 shows the proportion and the corresponding average payload factor for each category. For payload up to 150 kg, the average payload factor is set to 1.0, as the electricity consumption rate is assumed to be constant at the baseline electricity consumption rate. The average overall payload factor is calculated based on the sum of average payload factor of each category scaled according to the corresponding proportion. The average overall payload factor for a 5.8 kW-h motorcycle is higher because of the mass of the additional battery.
Average Overall Payload Factor Calculation
Sagaama et al. found that the average electricity consumption doubles for every 4% increase in road slope (
5
). This relationship is represented in Equation 5, which describes the slope factor

The analysis of the topography maps presented in Figure 2 reveals that the average slope generally ranges between 0° and 6° (observed in the topography map of Kwale county). In general, slope above 3° is infrequent in the map, though certainly this does not preclude such topography from existing locally. Based on the observed average slope, two scenarios are proposed to estimate the lower and upper limit of the daily electricity consumption:
Assume all trips are without slope (flat terrain)
Asssume the average slope of 3° and 10% of trips are undertaken on the extreme slope (6°)
It is worth noting that a negative slope usually results in less electricity consumption because of regenerative braking ( 5 ). However, partly because of the lack of detailed route data that represents the actual trip made, this factor will be ignored, thus establishing “conservative scenario” results.
Charging Options
The charging options considered for this analysis are only battery swapping (which does not rely on a public charging infrastructure) and overnight charging:
Battery swapping: charged at a maximum charging rate of 1,000 W. Only drivers who depleted their battery during their operational period go to the battery-swap stations. Charging time per battery (for demand implications): 3 h.
Charge at home overnight: charged at portable charger rate of 500 W. All drivers charge their E2Ws until full capacity overnight. Charging time: 6 h.
Daytime charging is not considered, because the length of time for charging would prevent taxi drivers from working and, thus, it is not a charging option that is likely to be attractive to taxi drivers.
Cost Savings and Aggregate Energy Demand
Fuel Savings
Fuel saving is calculated by finding the difference between daily fuel cost and electricity cost per day (via conversion of the currencies to USD) as per Table 1.
R&M Cost
Daily R&M cost for E2Ws is calculated by multiplying the daily travel distance by the estimated R&M cost per km of 0.035 USD/10 km ( 19 ). The daily R&M cost for an ICE motorcycle is equal to the sum of monthly R&M cost, derived from the data, factored by 12.
Cost Savings
The difference between the sum of the daily fuel or electricity cost and daily R&M cost for ICE motorcycles and E2Ws is used to analyze the relative benefits of using E2Ws and ICE motorcycles from a cost-savings perspective. Savings per kilometer is calculated by dividing the total saving by the daily travel distance. This analysis only applies to drivers of the motorcycle taxis who are expected to experience a reduction in total daily cost when switching to E2Ws.
Electricity Demand
As of 2018, there were an estimated 1.5 million two- and three-wheelers in Kenya ( 12 ). Although there is no official number of motorcycle taxis in Kenya, it is estimated that there could be up to 2.6 million boda boda operators the country, though the estimates vary substantially between sources which put it closer to 1 million (25,26). This number will be used to estimate the national electricity demand derived from transition to E2Ws for all motorcycle taxis.
Findings
Trip-Payload Distribution
As the E2W can carry payloads of up to 150 kg, the distribution of the payload is divided into two categories: within the capacity (≤150 kg) and exceeding the capacity (>150 kg). In addition, it is worth noting that the survey of taxi passengers did not ask for number of passengers and weight of cargo of their last trip. As such, the last trip data of taxi passengers is assumed to be made by only one passenger without any cargo. Although it would provide more data points to be analyzed, the data from taxi passengers is therefore not used for the analysis as it would skew the analysis toward trips within load capacity. Thus, the payload comparison was made using the survey data from taxi drivers only, to show a more accurate representation of the trips made.
When compared against Figure 3, it is possible to observe that around 64% of the trips are within capacity, whilst 36% exceed the capacity. The data is similar across the four surveyed countries. In addition, the distributions within and exceeding the payload are similar, though scaled: the exceeded trips are typically about half of those within the payload limits. This points toward absence of correlation between trip distance and excessive payload.
Trip-Level Electricity Consumption of E2Ws
The electricity consumption of E2Ws for a one-way trip based on the given distance range shows that E2Ws are able to fulfill most trip characteristics, as shown in Table 4. The results also suggest that long distance trips (30 km) with steeper average slope (≥3°) cannot be accommodated by E2Ws with a battery capacity of 2.9 kW-h and can only be undertaken using E2Ws with a battery capacity of 5.8 kW-h. Nonetheless, even such capacity is insufficient to meet the needs for very long trips over areas with very hilly topography.
Electricity Consumption (kW-h) for One-Way Trips under Various Distance, Slope, and Payload Assumptions
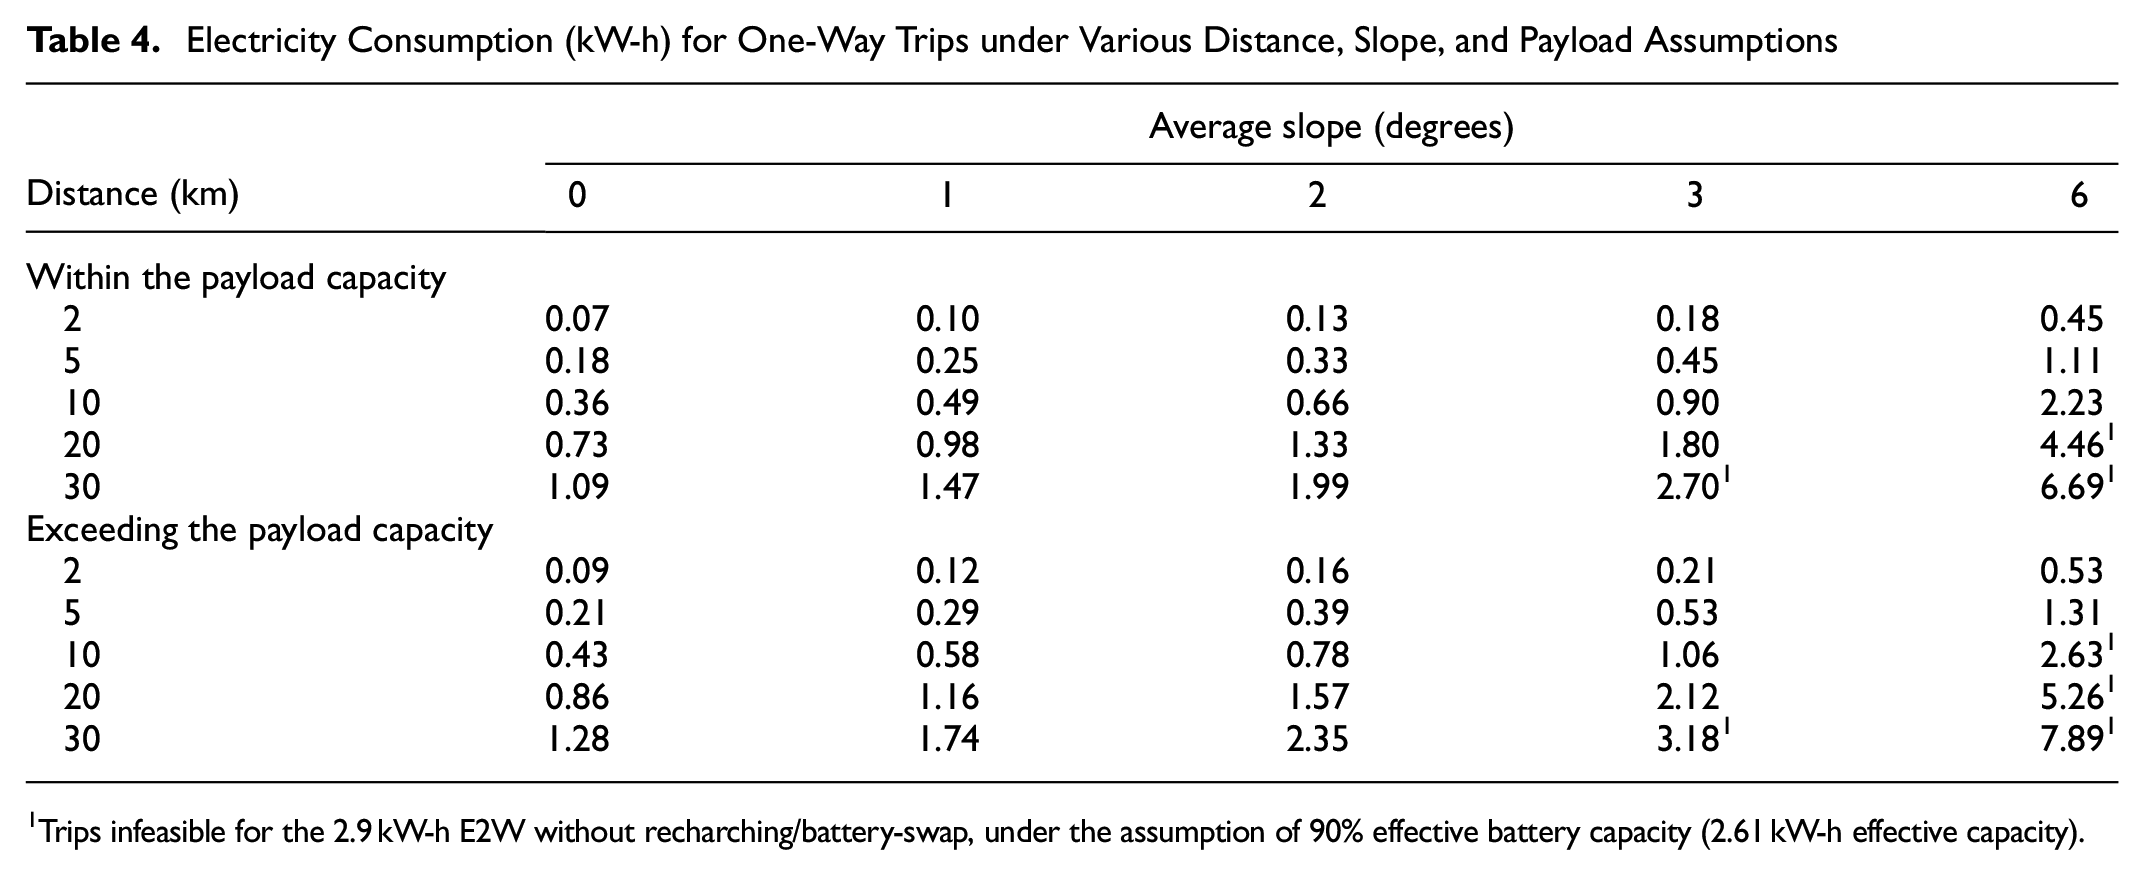
1Trips infeasible for the 2.9 kW-h E2W without recharching/battery-swap, under the assumption of 90% effective battery capacity (2.61 kW-h effective capacity).
Table 4 shows the electricity consumption for a one-way trip, which suggests that drivers on trips that are up to 10 km (∼76% of all trips) should be able to complete a two-way trip without replacing their batteries. Beyond that distance, drivers may need battery-swap stations, especially if trips take place over hilly topography. This finding could provide a rough indication for spacing swapping stations at around 20 km. This would permit operating from such stations to serve 10 km trips or traveling between stations, with a sufficient margin to account for local topography, heavier payload, or range anxiety. We observe that the trips do not vary with any particular socioeconomic groups. At the same time, areas with more hilly topography may be disadvantaged given the additional consumption caused by uphill driving. Naturally, this is only an indicative and illustrative analysis. More detailed analysis of these factors as well as the available infrastructure, expected demand, and prevalent trip patterns will be necessary for designing the charging infrastructure.
As for the fuel costs, we found that, across the entire sample, the drivers on average spend 3.38 USD daily on fuel cost, while drivers in Kenya spend on average 2.52 USD daily on fuel cost. This discrepancy is caused by a combination of differences in fuel prices and trip patterns observed for the other three countries. Despite the differences in the distribution of daily travel distances and daily fuel cost between Kenya and other countries, all survey data is used for the analysis and a specific analysis for Kenya is undertaken to identify any differences. Table 5 shows the estimated electricity cost per day for the given battery capacity of the motorcycle and the corresponding number of batteries swapped per day. The calculation assumed that drivers would charge their batteries fully overnight after working hours. The results show that the E2W remains the cheapter option for even three battery-swap options for 2.9 kW-h motorcycles, for a range of electricity prices. For larger capacity E2Ws, this is not the case for more than one swap. However, the battery capacities are larger for such E2Ws and only necessary for trips the presence of which would also drive the comparative fuel cost above the average.
Estimated Electricity Cost per Day (in USD)
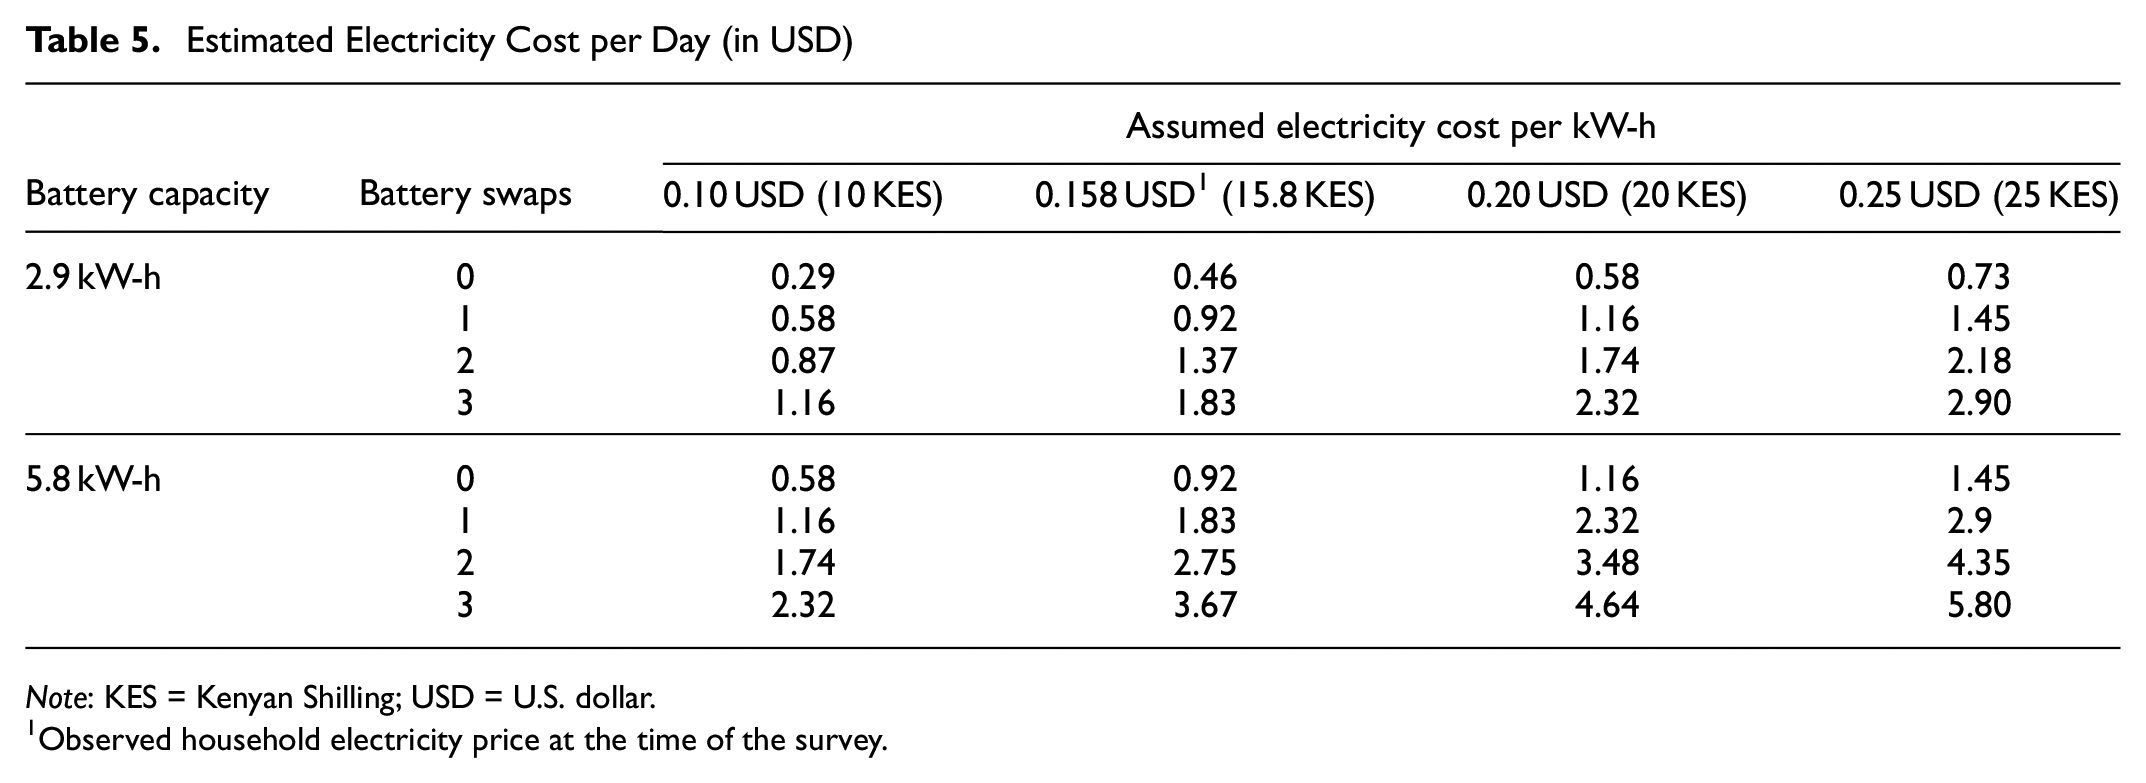
Note: KES = Kenyan Shilling; USD = U.S. dollar.
Observed household electricity price at the time of the survey.
In addition, given the previous results, it is possible to establish that around 85% of drivers in the sample would experience reduction in their daily fuel cost if using E2Ws. The average daily reduction in fuel cost is 2.56 USD, which is significantly higher than that found by Tokple, and Park et al. ( 8 , 9 ). As for the R&M costs, the average daily R&M cost is 0.54 USD, while the current average daily R&M cost for Kenyan drivers is lower at $ 0.38 per day. Based on the analysis, about 60% of drivers would experience reduced daily R&M cost with an average of around 71% reduction in daily R&M cost. About 16% may experience increases in R&M cost, with lack of sufficient data available for the remaining individuals in the sample.
A more general analysis of the penetration of E2Ws is shown in Figure 4, which plots the expected share against the fuel-electricity ratio (the higher the ratio, the more expensive it is to run the ICE motorcycle as compared with E2W) as well as the expected daily savings required to switch to E2W. Overall, it is possible to observe that substantial penetration is economically feasible even under conservative scenarios (electricity being expensive compared with fuel). This observation points toward the possible viability of schemes supporting the capital expenditure (of E2W acquisition), which could be subsequently financed from the saved fuel costs with still a margin available for the driver, to incentivize the transition.
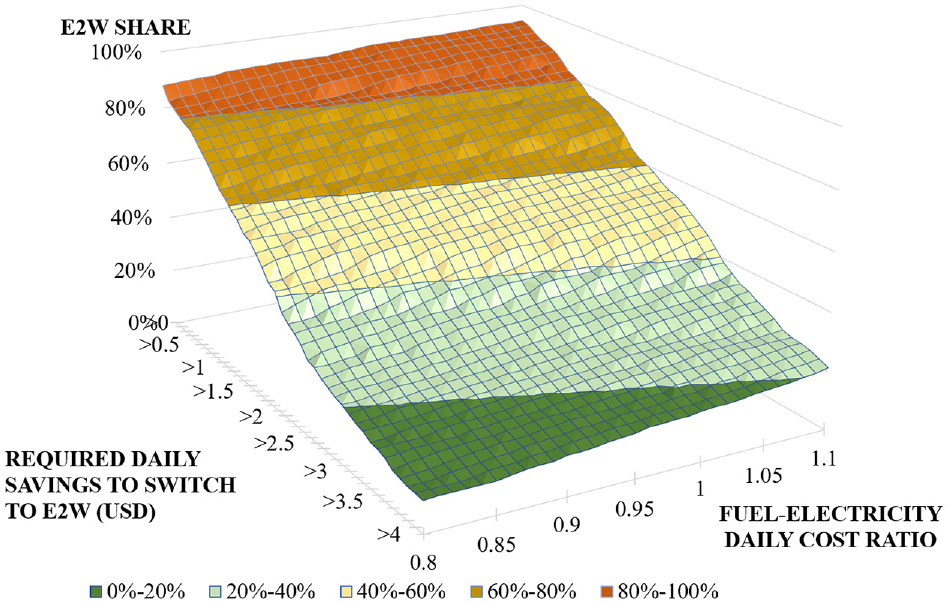
Expected electric two-wheeler (E2W) share as a function of fuel-to-electricity daily cost ratio and the desired daily savings.
Aggregate Impact of the E2W Transition on the Electricity Network
Figure 5 shows the estimated national electricity demand incurred by the transition to E2Ws by the whole motorcycle taxi industry in Kenya based on the scenarios of varying penetration of such vehicles in the assumed total fleet of around 1 million motorcycles, allowing for some margin of uncertainty in this estimate ( 27 ). The figure shows also how the consumption and power requirement would vary depending on the prevalence of 2.9 versus 5.8 kW-h E2Ws.
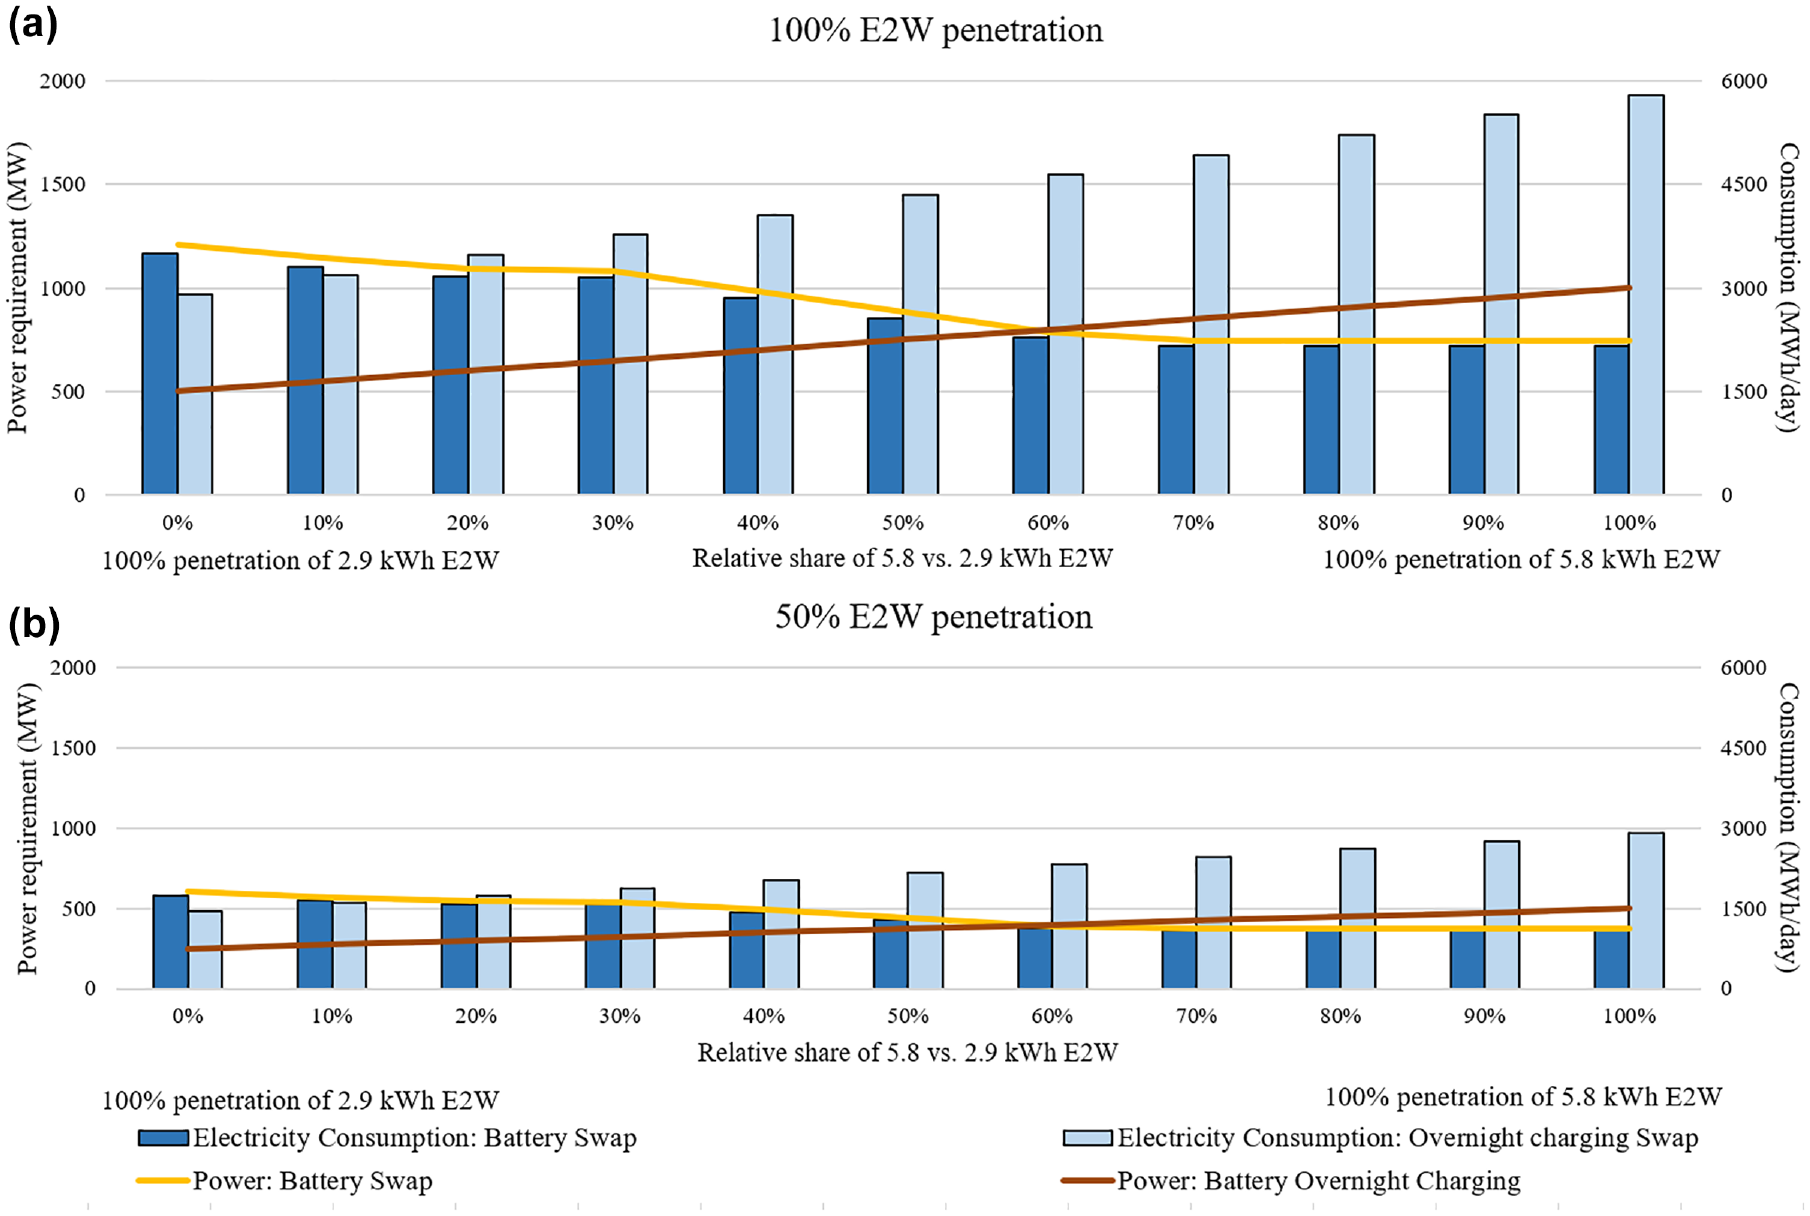
Electricity demand impacts (power and daily consumption) scenarios from the motorcycle taxi industrya under (a) 100% and (b) 50% of electric two-wheeler (E2W) penetration, with varying mix of vehicles (2.9 kW-h versus 5.8 kW-h capacity).
As mentioned before, there is an excess of daily electricity supply of 7,416 MW-h in Kenya. This capacity is not exceeded even under the extreme scenario of full E2W penetration. In particular, for the more likely (at least in the more immediate future) level of 50% penetration, the expected consumption from E2Ws is well within the available spare capacity.
As for the power, the installed capacity of electricity generation in Kenya in 2021 was 2,984 MW and historical peak demand is 1,994 MW ( 28 ). This points toward the existence of spare power capacity of up to 990 MW at peak demand periods, that is, approximately between 19:00 and 21:00. The load is less than 1,500 MW from 23:00 to 08:00 and is approximately 1,600 MW between 09:00 and 18:00. In light of the power needs observed in Figure 5, it is possible to observe that simultaneous charging of E2Ws under high penetration rates could, under certain scenarios, lead to network overload. Otherwise, it would be possible to manage the load. For example, note that for charging the maximum power requirement is around 1,200 MW and requires 2.9 h of charging time. As the maximum power requirement for battery-swap stations for most scenarios is above 990 MW, this suggests that charging at battery-swap stations cannot occur at the period of peak electricity demand between 19:00 and 21:00. Furthermore, since drivers would only need to swap their batteries after making several trips, they can be expected to go to battery-swap stations at any time after they start working on a given day. This points toward the need for management of loading, perhaps via suitable arrangements between the E2W operators and battery-swapping stations and/or electricity pricing incentives/disincentives that vary by time of day.
For overnight charging, the maximum power requirement is 1,000 MW and 5.8 h of charging time. Since it is overnight charging at home, charging can be expected to be completed in the morning by 07:00 before drivers start working.
Based on the aggregate analysis in this study, it can be concluded that the current electricity generation and supply in Kenya can accommodate the additional electricity demand from electric mobility transition of the motorcycle taxi industry under certain conditions. However, we would recommend that Kenya continues to improve and increase its electricity supply, given that the current load profile does not reflect the entire demand because of full electrification of the road transport system. The additional demand in this paper only reflects that from the motorcycle taxi industry and demand will also be generated as other transportation modes (electric bus, private cars, etc.) also shift to EVs.
Conclusions
This study shows that E2Ws can meet the demand of most motorcycle taxi trips in Kenya, with the exception of long-distance trips over substantially hilly terrain. Although this should not disbenefit any demographic group, three demographic groups (male youth, male elderly, and female elderly) could be negatively affected as they have a higher-than-average proportion of trips that are longer than 20 km. Based on assumptions concerning the battery capacity and average topography, the analysis suggests that battery-swap stations could be located at distances of the order of 20 km. This would serve almost 80% of the trips, with a margin in the available battery level to address range anxiety among taxi drivers. However, the figure is purely indicative, and the range anxiety would need to be analyzed explicitly, whilst specific station locations require a consideration of the specific, local topography as well as payload distributions among the vehicles.
The analysis in this paper also finds that the lower daily fuel cost of E2Ws can benefit taxi drivers in relation to increase in daily profit, increase in ownership rate of motorcycles, or both. The reduced daily cost could also lead to reduced fares for taxi passengers, which would mostly benefit those making short-distance trips (less than 5 km) because of the higher-than-average fare per kilometer.
The transition to E2Ws for the motorcycle taxi industry alone could potentially overwhelm the country’s electricity supply if it occurs suddenly and rapidly. As such, it is recommended that for the country to safely undergo transport electrificiation, it will need to increase its electric generation capacity to meet the potential increase in electricity demand from transition to electric mobility of motorcycle taxi industry and potentially other transport segments as well. Even more importantly, the power constraints suggest the need to carefully consider existing electricity supply and demand profiles to more optimally utilize the generation capacity. In the current study, we have sketch-modelled such a scenario, concluding that the battery-swap stations should charge the batteries only between 23:00 and 18:00, while overnight charging should charge only between 22:00 and 07:00. Importantly, the trajectory of vehicle fleet composition (E2Ws versus ICE vehicles) and their charging patterns, both temporal and spatial, needs to be taken into account when planning for generation and transmission capacity upgrades. In addition, there remains the consideration of the resilience of the infrastructure in the face of natural or human-created hazards. Reliance of transport on a grid that is not suitably resilient may mean lack of mobility for effective response during emergencies.
Another consideration requiring further analysis would be safety. In particular, the shift toward E2Ws could imply changes in vehicle weights and payloads with consequences for accident frequency and severity, in urban and rural conditions, and involving humans and animals alike.
In conclusion, this research finds that E2Ws appear to be a feasible alternative to most ICE motorcycles in the motorcycle taxi industry in Kenya. However, there are certain trips, passenger groups, and driver groups that may not benefit from the transition to electric mobility given the current technology or capital cost of E2Ws. The analysis presented in this paper is a step toward what is needed next, that is, more extensive analysis that considers electrification scenarios jointly for several transport modes and segments of travelers, that also takes into account the overall economic, social, and environmental benefits and costs associated with electrification. Such analysis will require consistent travel data covering all forms of transport—formal and informal—with sufficient trip-level spatial information (to account for topography) and payload data.
Footnotes
Acknowledgements
Author Contributions
The authors confirm contribution to the paper as follows: study conception and design: J. Pawlak, A. Sivakumar; data collection: A. Sivakumar, J. Pawlak; analysis and interpretation of results: all authors; draft manuscript preparation: all authors. All authors reviewed the results and approved the final version of the manuscript.
Declaration of Conflicting Interests
The author(s) declared no potential conflicts of interest with respect to the research, authorship, and/or publication of this article.
Funding
The author(s) disclosed receipt of the following financial support for the research, authorship, and/or publication of this article: The authors acknowledge funding obtained from UK Aid under grant no. 300125, as part of the Climate Compatible Growth programme.
Data Accessibility Statement
Data access requests can be made to the authors. The supporting codes and analytical files can be provided on request.
The conclusions drawn from the data are solely the view of the authors.