
Abstract
There is a growing market for crowd-shipping (CS), which hires people to transport parcels on their regular commutes. This paper considers a hybrid CS operation that hires crowd-shippers and regular drivers (RDs) in a physical internet environment. A city crowd logistics (CCL) network is designed to serve business-to-consumer logistics demand through solving a mixed-integer linear program of a parcel locker location assignment problem. The problem minimizes the total cost by optimizing the placement of parcel lockers and the movements of parcels. As an input to the program, the spatial distribution of potential crowd-shippers is analyzed by leveraging a behavior model and data that combines household travel survey data from the Greater Toronto Area (GTA), Canada, and Canadian census data. Parcel demand is simulated based on the proportions of retail employment and the population of the corresponding planning district in the GTA. The numerical results reveal that optimal parcel locker locations are more likely to be placed in Toronto while less likely to be installed in Durham and Halton regions. Concerning the service levels of the proposed network, it is found that a CCL network can provide more stable and cost-effective services when the parcel demand level is higher. The hiring of RDs is necessary to service some regions with low crowd-shipper supply. Insights from this study can help logistics companies to develop an effective business strategy for a hybrid CS operation system.
Canadian e-commerce has been growing rapidly in recent years. According to a study done in 2019, Canadian e-commerce sales were expected to grow at an annual rate of more than 10%, taking 14% of the market share in the retail sector by 2023 ( 1 ). During the COVID-19 outbreak, new measures, such as lockdowns and limiting store capacities, that aimed at slowing the spread of the virus, dramatically affected consumer shopping behavior. From February to May 2020, Canadian retail e-commerce sales experienced a 99.3% increase ( 2 ). Managing a responsive and cost-effective supply chain to handle the fast-growing door-to-door delivery volume has been challenging and expensive ( 3 ).
One solution to relieve pressure on the supply chain is to motivate independent delivery agents to deliver small parcels. Taking advantage of the rapid development of communication technology and GPS capabilities, a new concept emerges that crowdsources underutilized transportation capacity ( 4 ). Crowd-shipping (CS) is defined as “an information connectivity enabled marketplace concept that matches supply and demand for logistics services with an undefined and external crowd that has free capacity with regards to time, space, or both, participates on a voluntary basis and is compensated accordingly” ( 5 ). This CS system comprises three main stakeholders: CS app operator/provider, crowd-shippers, and customers of the app ( 4 ). The CS app operator/provider is the one who creates the app platform to connect crowd-shippers and customers. The CS app operator/provider determines its business model, such as how much its customers will be charged and how much the crowd-shippers will be compensated, perhaps depending on the time of the day or the day of the week. On the other hand, crowd-shippers are regular individuals who travel anyway, have free time, and want to be compensated for their work. Crowd-shippers would have the right to accept or decline the offer. Customers of the CS system can be anyone, from individuals to businesses or agencies. Customers place their request on the CS app and are matched with crowd-shippers by the app provider. More discussion about the CS system can be found in the work of Le et al. ( 4 ).
As the sharing economy has become increasingly popular in sectors such as mobility, retail, and consumer goods, several delivery firms have started to embrace crowdsourcing ( 6 ). CS is attracting attention because of the competitive advantages it can bring to logistics service providers (LSPs). For instance, the CS operation: 1) is possibly less costly than traditional couriers for providing similar delivery tasks, 2) provides a more flexible and customizable service, which does not need a critical mass of customers to arrange efficient truck deliveries, and 3) could potentially reduce environmental impacts by utilizing the spare capacity of commuter automobiles to deliver parcels that would otherwise require dedicated delivery vehicles ( 7 ). Using crowd-shippers can bring potential benefits for society, the economy, and the environment. Crowd-shippers commonly use their own vehicles and try to utilize them efficiently for CS deliveries, for example by accepting deliveries with origins and destinations near to where they would travel anyway. Such efficiencies are expected to make the expected compensation lower than that of the traditional delivery ( 8 – 10 ). Consequently, delivery cost, trip distance, and environmental impact are potentially reduced ( 7 , 11 , 12 ).
CS is not only a product of the sharing economy. It also relates to the concept of the physical internet (PI). The PI is “a global logistics system based on the interconnection of logistics networks by a standardized set of collaboration protocols, modular containers and smart interfaces for increased efficiency and sustainability” ( 13 ). CS contributes to the PI by enabling commuters to use the capacity of their vehicles more efficiently by carrying parcels that are traditionally distributed by dedicated commercial vehicles. However, compared with the global PI concept, CS is constrained in geographical scale, since the drivers are hired occasionally and would operate mostly during local commuter trips. In the literature, the CS concept is generally limited to city distribution and last-mile logistics ( 10 ).
The concept of CS is attracting the attention of the scientific community as well as start-up companies. A strategy for deployment of a CS system in the Greater Toronto Area (GTA) to serve local e-commerce logistics demands is presented in this paper. This study assesses the CS service as a form of PI by introducing parcel lockers to serve as transshipment nodes that connect multiple crowd-shippers to transport a parcel.
This paper is organized into six sections. The first section introduces the background and motivations of this study. The second section reviews the literature and reveals research gaps. The third section presents the mathematical model formulation. It is followed by a section that describes the study area and explains assumptions and supporting data toward the generation of crowd-shipper supply and parcel delivery demand. The fifth section summarizes findings and provides insights into optimal parcel locker location and the network performance under five different demand volumes. The last section concludes with a summary of contributions, limitations, and directions for future research.
Inter-Connected City Crowd-Logistics System
Montreuil published the first paper introducing the concept of PI by using the digital internet as a metaphor for a future logistics system ( 14 ). PI is defined as a connected logistics network that emphasizes physical, information, and operational interconnectivity, through encapsulation, an open global logistics system, standard smart interfaces, logistics centers for cross-docking and temporal storage, and standard coordination protocols ( 15 ). The foundation of PI is a horizontal collaboration by which decentralized public and private actors can share the capacity of the PI logistics network with standard technical protocols ( 16 ).
A parcel locker network could potentially enhance the performance of a CS system, considering the concept of PI, by consolidating parcels and passing them through one or more parcel lockers enroute from origin to destination. In this case, multiple drivers would participate in the delivery of one parcel. The journey of a parcel delivery can be broken into three sections, as shown in Figure 1. A first-mile driver picks up parcels from one or multiple retailers located in the origin district and stores the parcels at a parcel locker. If there is a parcel locker in the origin district, then the parcels are deposited in the local locker. If there is no local locker, the first-mile driver carries the parcels and store them in a parcel locker in another district. The parcels are consolidated at parcel lockers and transferred across the network by middle-mile drivers. Finally, a last-mile driver takes parcels from a locker and visits each receiver in the destination district to finish the deliveries. If there is a parcel locker in the destination district, then the last middle-mile driver directly deposits the parcels in the destination locker for last-mile drivers to pick up. Otherwise, the last-mile driver picks up the parcels from the locker and travels toward the destination district to finish the deliveries. The first level of the system includes middle-mile transportation, whereas the second level of the system includes the first- and last-mile transportation.
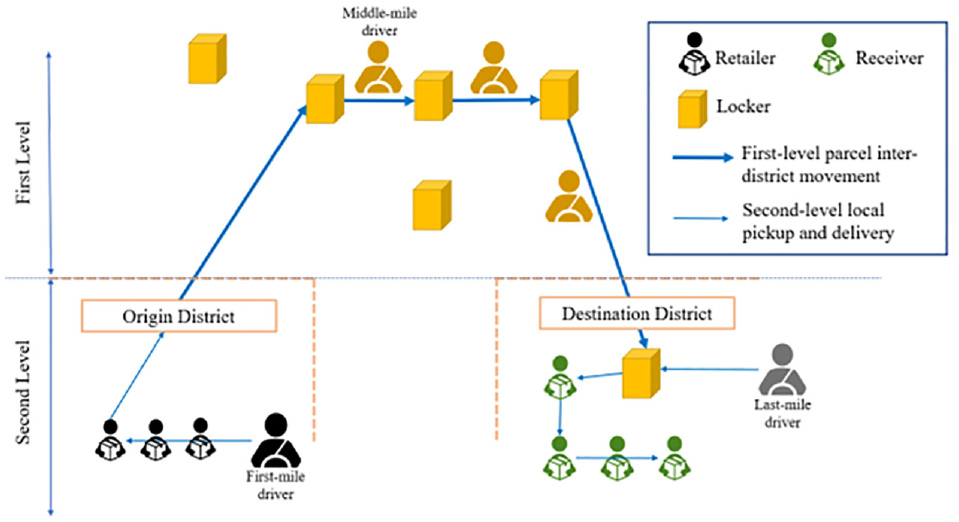
Roles of the drivers in parcel deliveries.
In recent years, the concept of PI has attracted various stakeholder groups to support the development of the PI logistics network. The stakeholder group, the European Technology Platform Alliance for Logistics Innovation through Collaboration in Europe (ETP-ALICE or ALICE) was formed to promote the collaboration among stakeholders by aligning their interests ( 17 ). ALICE has attracted the European Commission to support and fund the PI initiative for various benefits that PI can potentially bring.
The PI logistics network aims to transform freight transportation from end-to-end transportation of full load and hub-and-spoke transportation of partial loads to inter-connected freight transportation that can potentially provide economic, environmental, and societal benefits. Sarraj et al. ran a simulation-based experiment that incorporates a PI-enabled inter-connected logistics network and observed savings of 30% of total costs and a reduction of 60% in greenhouse gas (GHG) emissions while offering the same service level to consumers ( 18 ). Similarly, the CELDi research center collaborated with industry leaders such as CHEP and Walmart to investigate the benefits of embracing PI in the U.S. A recent attempt to compare a PI and a conventional logistics system on an eastern Canadian road network indicates that PI reduces driving distance, driving time, GHG emissions, and the social cost of truck driving ( 19 ).
Sternberg and Norrman reviewed recent analyses in the literature on PI and outlined a future research agenda ( 20 ). They identified many papers that used simulation and/or mathematical modelling to assess the potential inherent in the interconnection of logistics networks ( 20 ). For example, Pan et al. formulated an optimization model that consolidates freight from different supply chains to compute CO2 emissions from two transport modes—road and rail—using real-life data from two French retail chains ( 21 ). Their experiment proved that a consolidated supply network can reduce CO2 emission ( 21 ). Sarraj et al. demonstrated that the PI can significantly improve the flow of travel and reduce the number of trips needed ( 22 ). However, they made some simplifying assumptions, such as the absence of containerization, and a routing protocol that is limited to specific aspects of the merchandise. Yang et al. found that a PI inventory model that facilities an inter-connected logistics network could potentially reduce logistics costs by as much as 73% in some cases ( 23 ).
The concept of a PI-enabled logistics network is usually considered at the global scale. CS can be interpreted as an instance of PI in the urban logistics market ( 24 ). A city crowd logistics (CCL) system is a PI network-like structure that is implemented within a city that utilizes the transport potential of the crowd ( 25 ). The network consists of nodes, which are the origins and destinations of parcel deliveries and routing/transfer points (e.g., automated parcel lockers the compartments of which can temporarily store parcels). The routes are traveled by drivers recruited from the crowd to form the arcs of the network. Compared with a typical PI logistics system, the parcel lockers in a CCL network do not need to have a high capacity or be standardized.
The CCL network inherits many benefits from the concept of PI. The advantages of deploying a CS system in the urban logistics environment are to fulfill goods movement demands in a more personalized, cost-effective, and environmentally friendly way by utilizing the existing transportation capacity of the crowd ( 26 ). More specifically, Ding et al. point out that CCL networks can aid business-to-consumer (B2C) e-commerce companies to reduce operational costs ( 27 ). Despite the various benefits that the CCL network can provide, there are some problems and potential factors that can lead to failure. A CCL network needs to attract a sufficient supply of crowd-shippers to participate. However, there may be origin-destination (OD) pairs that lack crowd-shippers available to connect. One way to overcome this challenge is to establish a network of parcel lockers that contribute to the CCL network. The parcel locker network offers an opportunity for a multi-hand-over process that provides a more robust service ( 24 ). Another key issue for a CCL network is the lack of service-level guarantee. Our study aims to propose optimal parcel locker locations and estimate the service levels to address this challenge.
Herrmann and Kunze presented a facility location problem in CCL that focused on the transit network in Munich ( 25 ). Our study focuses on the planning of a CCL system that consists of automobile commuters in the GTA. Automobile drivers are the focus because automobile commuting is pervasive in the GTA, and other modes are less flexible or less practical for traveling directly between parcel origins and destinations. Therefore, our CS network is better described as a CCL system, the OD pairs of which are linked by occasional crowdsourced drivers and regular drivers (RDs).
Mathematical Model Formulation
The facility location problem is a logistics transportation network design problem. Here, we define a parcel locker location assignment problem (PLLAP) to describe the CCL system. The model consists of nodes and links which are centroids of zones in a study area and potential crowd-shippers and hired RDs who travel between nodes, respectively. Each link can be assigned to either crowd-shippers when they are available or, when crowd-shippers are not available, an RD. The parcel lockers are placed at the selected nodes to facilitate the transfer of parcels.
There are several assumptions to this problem:
The origins and destinations of parcels are assumed to be located at the centroids of corresponding planning districts (PDs).
Parcels can only be transferred at locations with parcel lockers.
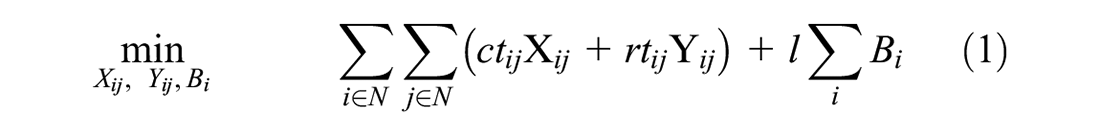
The objective is to select locations (i.e., PD centroids) for parcel locker placement and assign crowd-shippers and RDs to cover the links that can optimize the operation cost of the CCL network, given the simulated demand instances. A mathematical formulation is presented in this section describing the corresponding PLLAP.
The PLLAP considers a CS system that accepts delivery tasks one day in advance, and crowd-shippers who declare their next-day availability to transport the parcels assigned to them. This prior information about demand and supply allows us to assume a static model, which is suitable for the tactical purpose of assessing parcel locker locations.
Let
Let
Let
s.t.


Equation 1 aims to minimize the overall costs. The first term is the summation of transportation costs of crowd-shippers and RDs. Each crowd-shipper is paid based on the distance they transport parcels. The second term is the summation of the parcel lockers’ rental cost.
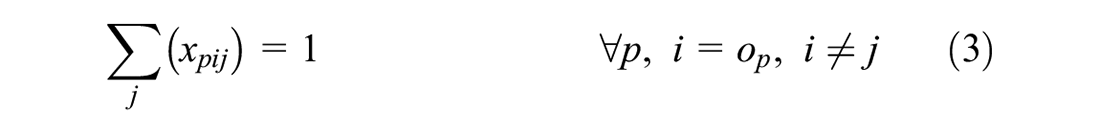
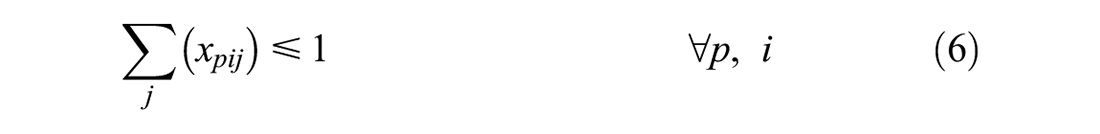
Equation 2 restricts the number of crowd-shippers assigned on
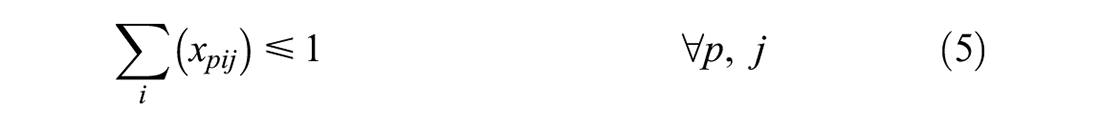
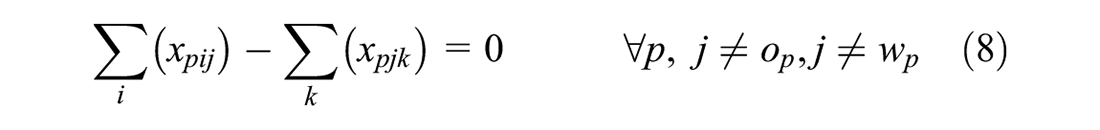
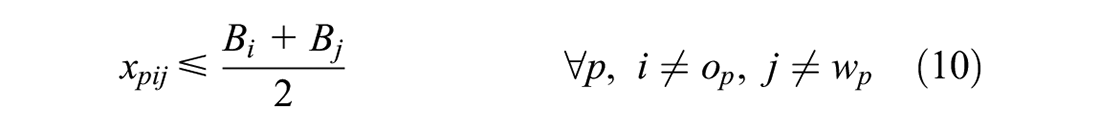
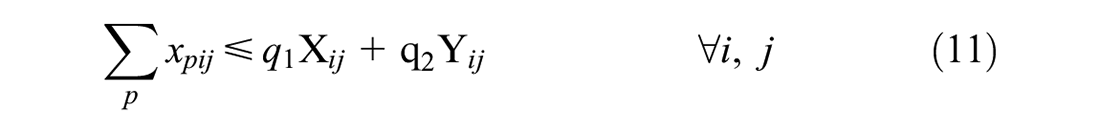
The parcels that are transferred must be stored at a location that has a parcel locker. Equation 9 eliminates the possibility of a parcel being picked up and transported to a location that is not its destination and does not have a parcel locker. In this case, the parcel would have no place to be stored for another driver to pick up. Once the parcel is picked up from its origin, it can only be transported to another parcel locker if a trip to its destination is not possible because of the lack of crowd-shipper availability. Equation 10 describes this constraint. Equation 11 makes sure that the crowd-shippers and RDs assigned to link
Network and Data
Study Area
The study area is the GTA which includes the City of Toronto, and regions of Peel, York, Durham, and Halton. There are 40 PDs in the GTA, and their centroids are presented as 40 candidate locations in this study.
Potential Crowd-Shippers
To identify potential crowd-shippers from the population of commuters, the binary logit model presented by Le and Ukkusuri is applied ( 28 ). Their model is built on a recent online survey that assesses willingness to work as a crowd-shipper in the U.S. Respondents to that online survey are assumed to share similar travel behavior and willingness-to-work with the residents in the GTA.
We assess the willingness-to-work of individual commuters, based on demographic and commuting information available in the 2016 Transportation Tomorrow Survey (TTS). TTS is a cross-sectional household travel survey conducted in the GTA every 5 years since 1986 ( 29 ). The survey collects the demographics of household members and their travel information, such as trip purpose and mode of transportation on a typical workday. The survey sample collected is weighted with expansion factors that expand the households surveyed to match the 2016 Census household counts by geography. There are 40 PDs, forming 1,600 OD pairs in the GTA.
We assess willingness-to-work for commuters that made home-based work and home-based school trips because these trips are made regularly. Noting that the 2016 TTS exhibits an automobile-heavy travel pattern with 63.7% of the trips’ primary mode being auto driver, we consider auto-driver trips to be potential CS trips ( 29 ).
Le and Ukkusuri’s model is applied to potential CS trips to predict the probability they are CS trips. The probability that each trip is a CS trip is summed and grouped by origin and destination to produce a CS OD matrix. There are 2,333,682 daily CS trips in the GTA.
Some PDs in the outer regions of the GTA (e.g., Halton and Durham regions) are not well connected with other PDs by crowd-shippers directly. However, they can be inter-connected in a regional network. The commuter distribution pattern suggests that an inter-connected CCL network is potentially a solution to satisfy the parcel demand within the study area.
In this study, a hybrid supply of RDs and crowd-shippers is considered. For the crowd-shippers, who are the occasional drivers, the challenge for the CS company is to understand crowd-shippers’ geographical distribution at different times of the day. This information can guide the CS company to publish delivery tasks that are likely to be acceptable by crowd-shippers. To plan the schedules and delivery task assignments of the RDs, the CS company needs to know what portion of delivery tasks is not likely to be accepted by crowd-shippers and where to allocate the RDs to maximize the tasks they can serve in a shift.
Parcel Demand Assumptions and Simulation
Since the concept of CS has emerged recently, little customer demand information is available. Assumptions about customer demand are made for simulating demand instances for optimizing the parcel locker locations and evaluating the expected service level of the CS system. A demand instance for parcel delivery should consist of two components: 1) origin and destination of the parcels, and 2) pick-up and delivery time windows. The origins and destinations of the parcels and the candidate locations of the parcel lockers are approximated at the centroids of the PDs.
An interview with an Ontario-based CS company indicated an average total daily parcel delivery demand of approximately 300. In collaboration with the company, five demand volumes of 50, 100, 200, 400, and 700 delivery orders were selected for simulation to represent possible variations of daily demand volume. The demand volume may be affected by factors such as seasonality of the ordering rate and variability of customers’ willingness to use the CS service ( 30 ). The five demand volumes are used to determine the optimal locations of parcel lockers under different possible demand volumes.
Parcel origin and destination are determined based on the following assumptions: 1) The probability of a parcel’s origin being in a PD is correlated with the retail employment in that PD, and 2) The probability of a parcel’s destination being in a PD is correlated with the total population in that PD. Population and retail employment in each PD are extracted from the TTS 2016 data. The natural logarithms of the retail employment and total population in the GTA by PDs have a similar pattern and are shown in Figure 2.
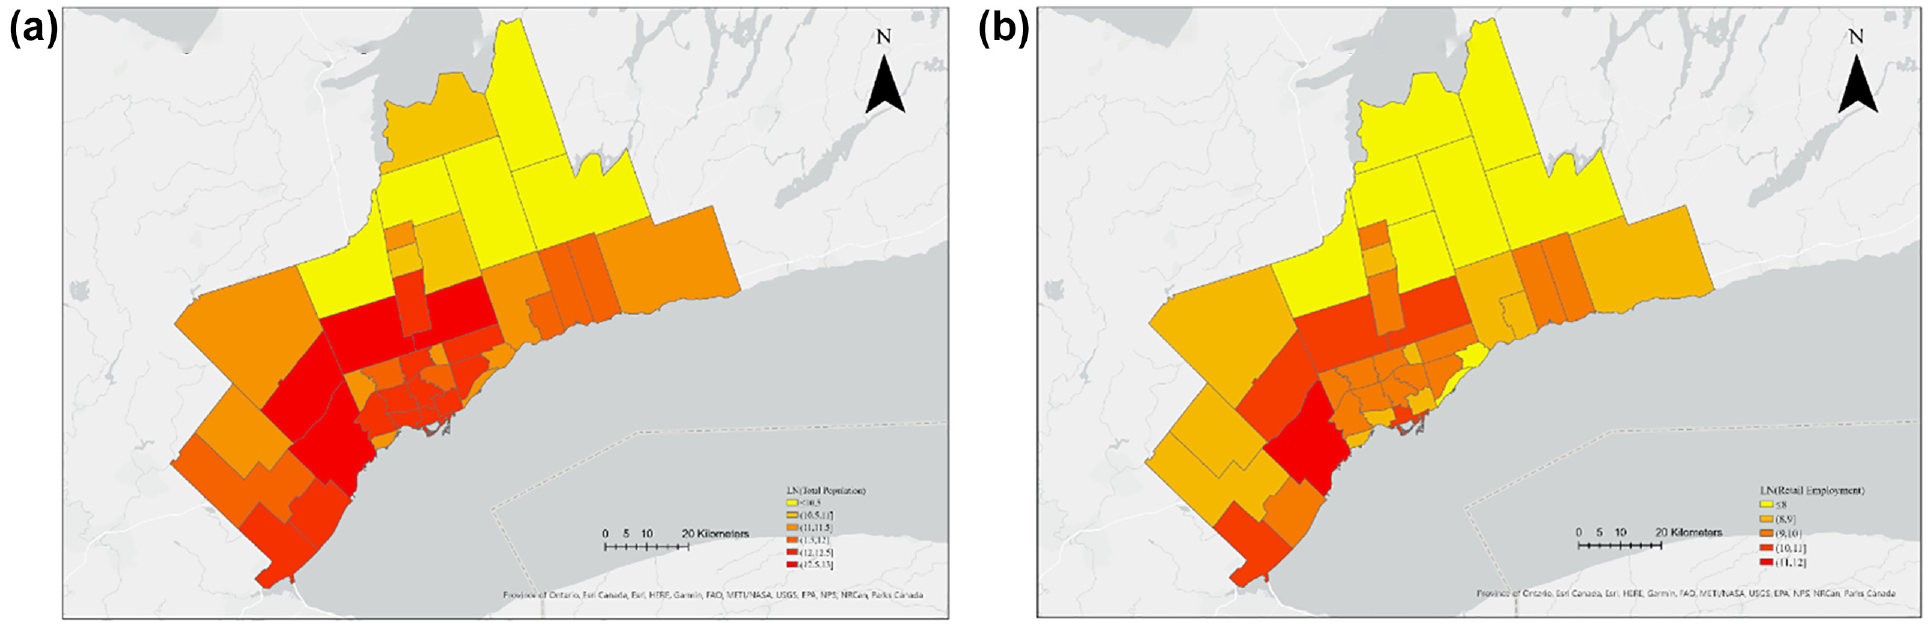
(a) Natural logarithm of the total population of PDs in the GTA and (b) natural logarithm of retail employment of PDs in the GTA.
Other Data
According to the professional LSPs servicing Toronto, the on-demand same-day pickup and delivery service charges a flat rate of $20 per delivery and $1.11 for each extra 1 km above 20 km ( 31 ). In our study, $1.11/km is assumed to be the compensation rate for the distance between the parcel’s origin and destination. An average speed is assumed to be 50 km/h. Therefore, the hourly rate for the RD to conduct a pickup and delivery is $56/h (which is equal to 50 km/h × $1.11/km). As such, each RD in this study is assumed to be paid $56/h to cover the cost of relocation to any location in the network and servicing a designated link.
The compensation for crowd-shippers is set to be $24/h ( 32 ). For a parcel locker, according to a parcel locker study done in the Toronto area, depending on the real-estate prices in Toronto, the fixed setup cost and daily rental cost are amortized to be $40/day in Toronto ( 30 ).
Results
The methodology is programmed in Python using the Gurobi Solver to solve the mixed-integer linear programming problem. The computer runs on a Microsoft Windows 10 system and Intel (
Experiment Design
The numerical experiment considers the parcel locker location problem for five possible daily demand volumes. Figure 3 shows the procedures used to assess the optimal placement of parcel lockers and estimate the service level and reliability of the corresponding parcel locker network. For each demand volume, a training phase is executed to obtain the optimal locations of parcel lockers by solving the PLLAP for 30 possible demand scenarios with the given demand volume. The candidate locations with top frequency for the 30 scenarios are proposed as the optimal locations for the parcel lockers. The optimal number of parcel lockers to be installed is the average number of parcel lockers for the 30 scenarios.
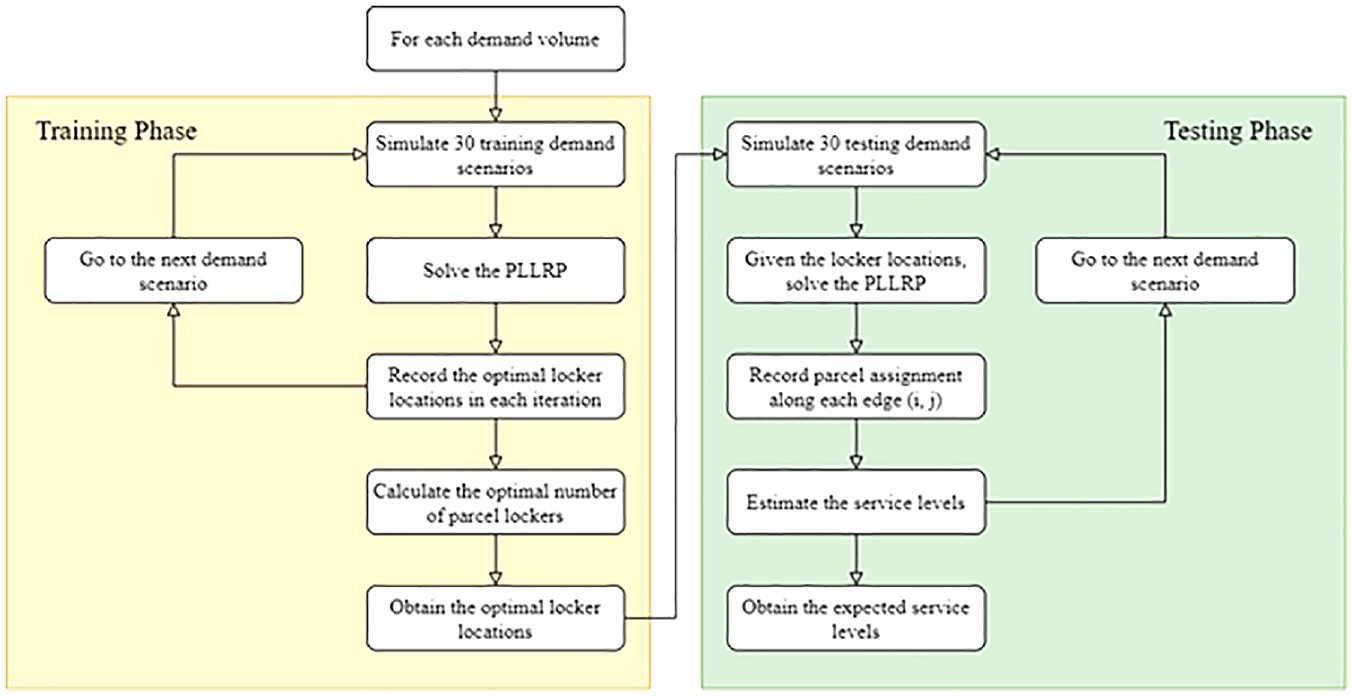
Procedure for selecting parcel locker locations and estimating the expected service levels.
The training phase is followed by a testing phase in which key performance indicators (KPIs) are estimated based on another 30 simulated daily demand scenarios. In the testing phase, the locations of the parcel lockers are fixed and only the parcel assignments along each link of the network are optimized. In other words, the testing phase is to evaluate the performance of the proposed parcel locker locations.
Optimal Parcel Locker Locations
Table 1 summarizes the optimal numbers of parcel lockers proposed in the training phase under different demand volumes. As expected, the greater the demand, the more parcel lockers are needed. The coefficients of variation (CV) for the five demand volumes are between 15% and 20%, which is relatively low.
Statistics of the Number of Parcel Lockers Proposed in the Training Phase for Each Daily Demand Volume
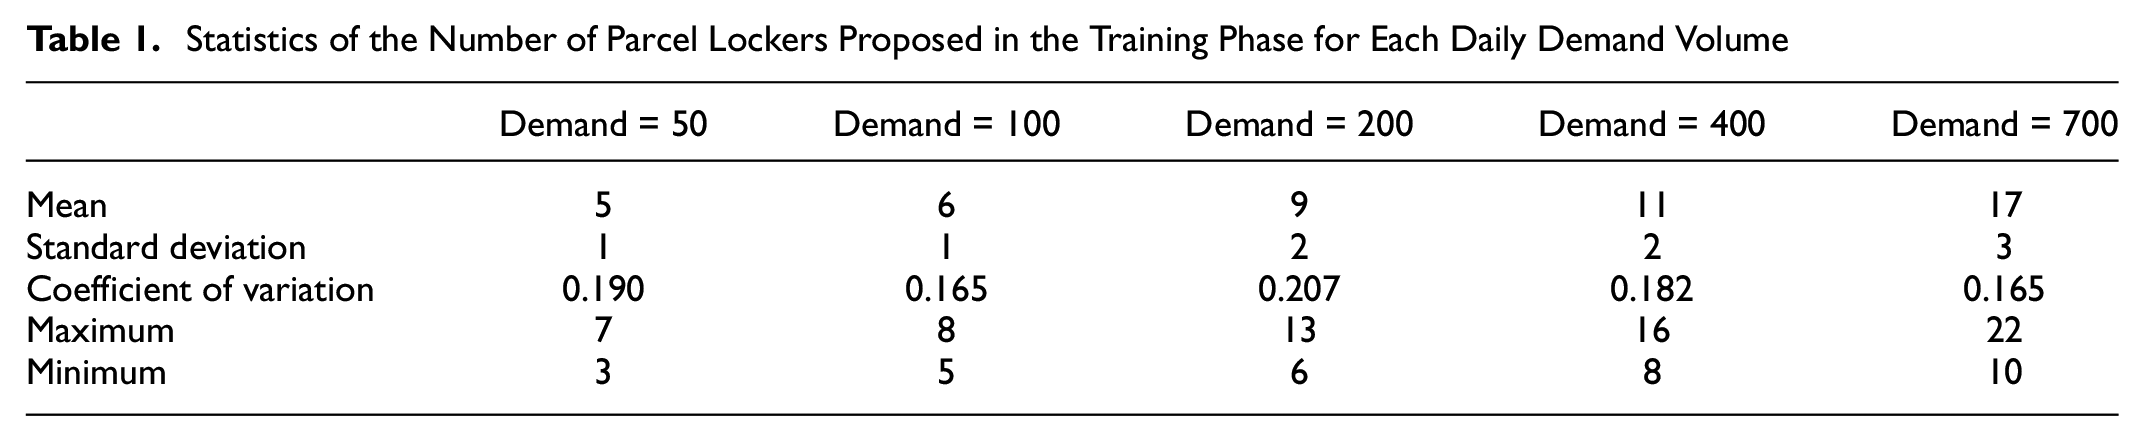
Figure 4 shows the parcel locker locations (using red pins) under the five demand volumes. The placement of parcel lockers follows a similar pattern as the retail employment and population patterns shown in Figure 2. When the parcel demand volume is low, the parcel lockers spread out to cover as much service area or as many potential CS trips as possible. If the number of daily parcels is 50, PDs within Mississauga, eastern Toronto, and southern York region are the selected locations for parcel lockers. As the daily demand volume increases, parcel lockers are placed in other regions that have high retail employment and population.
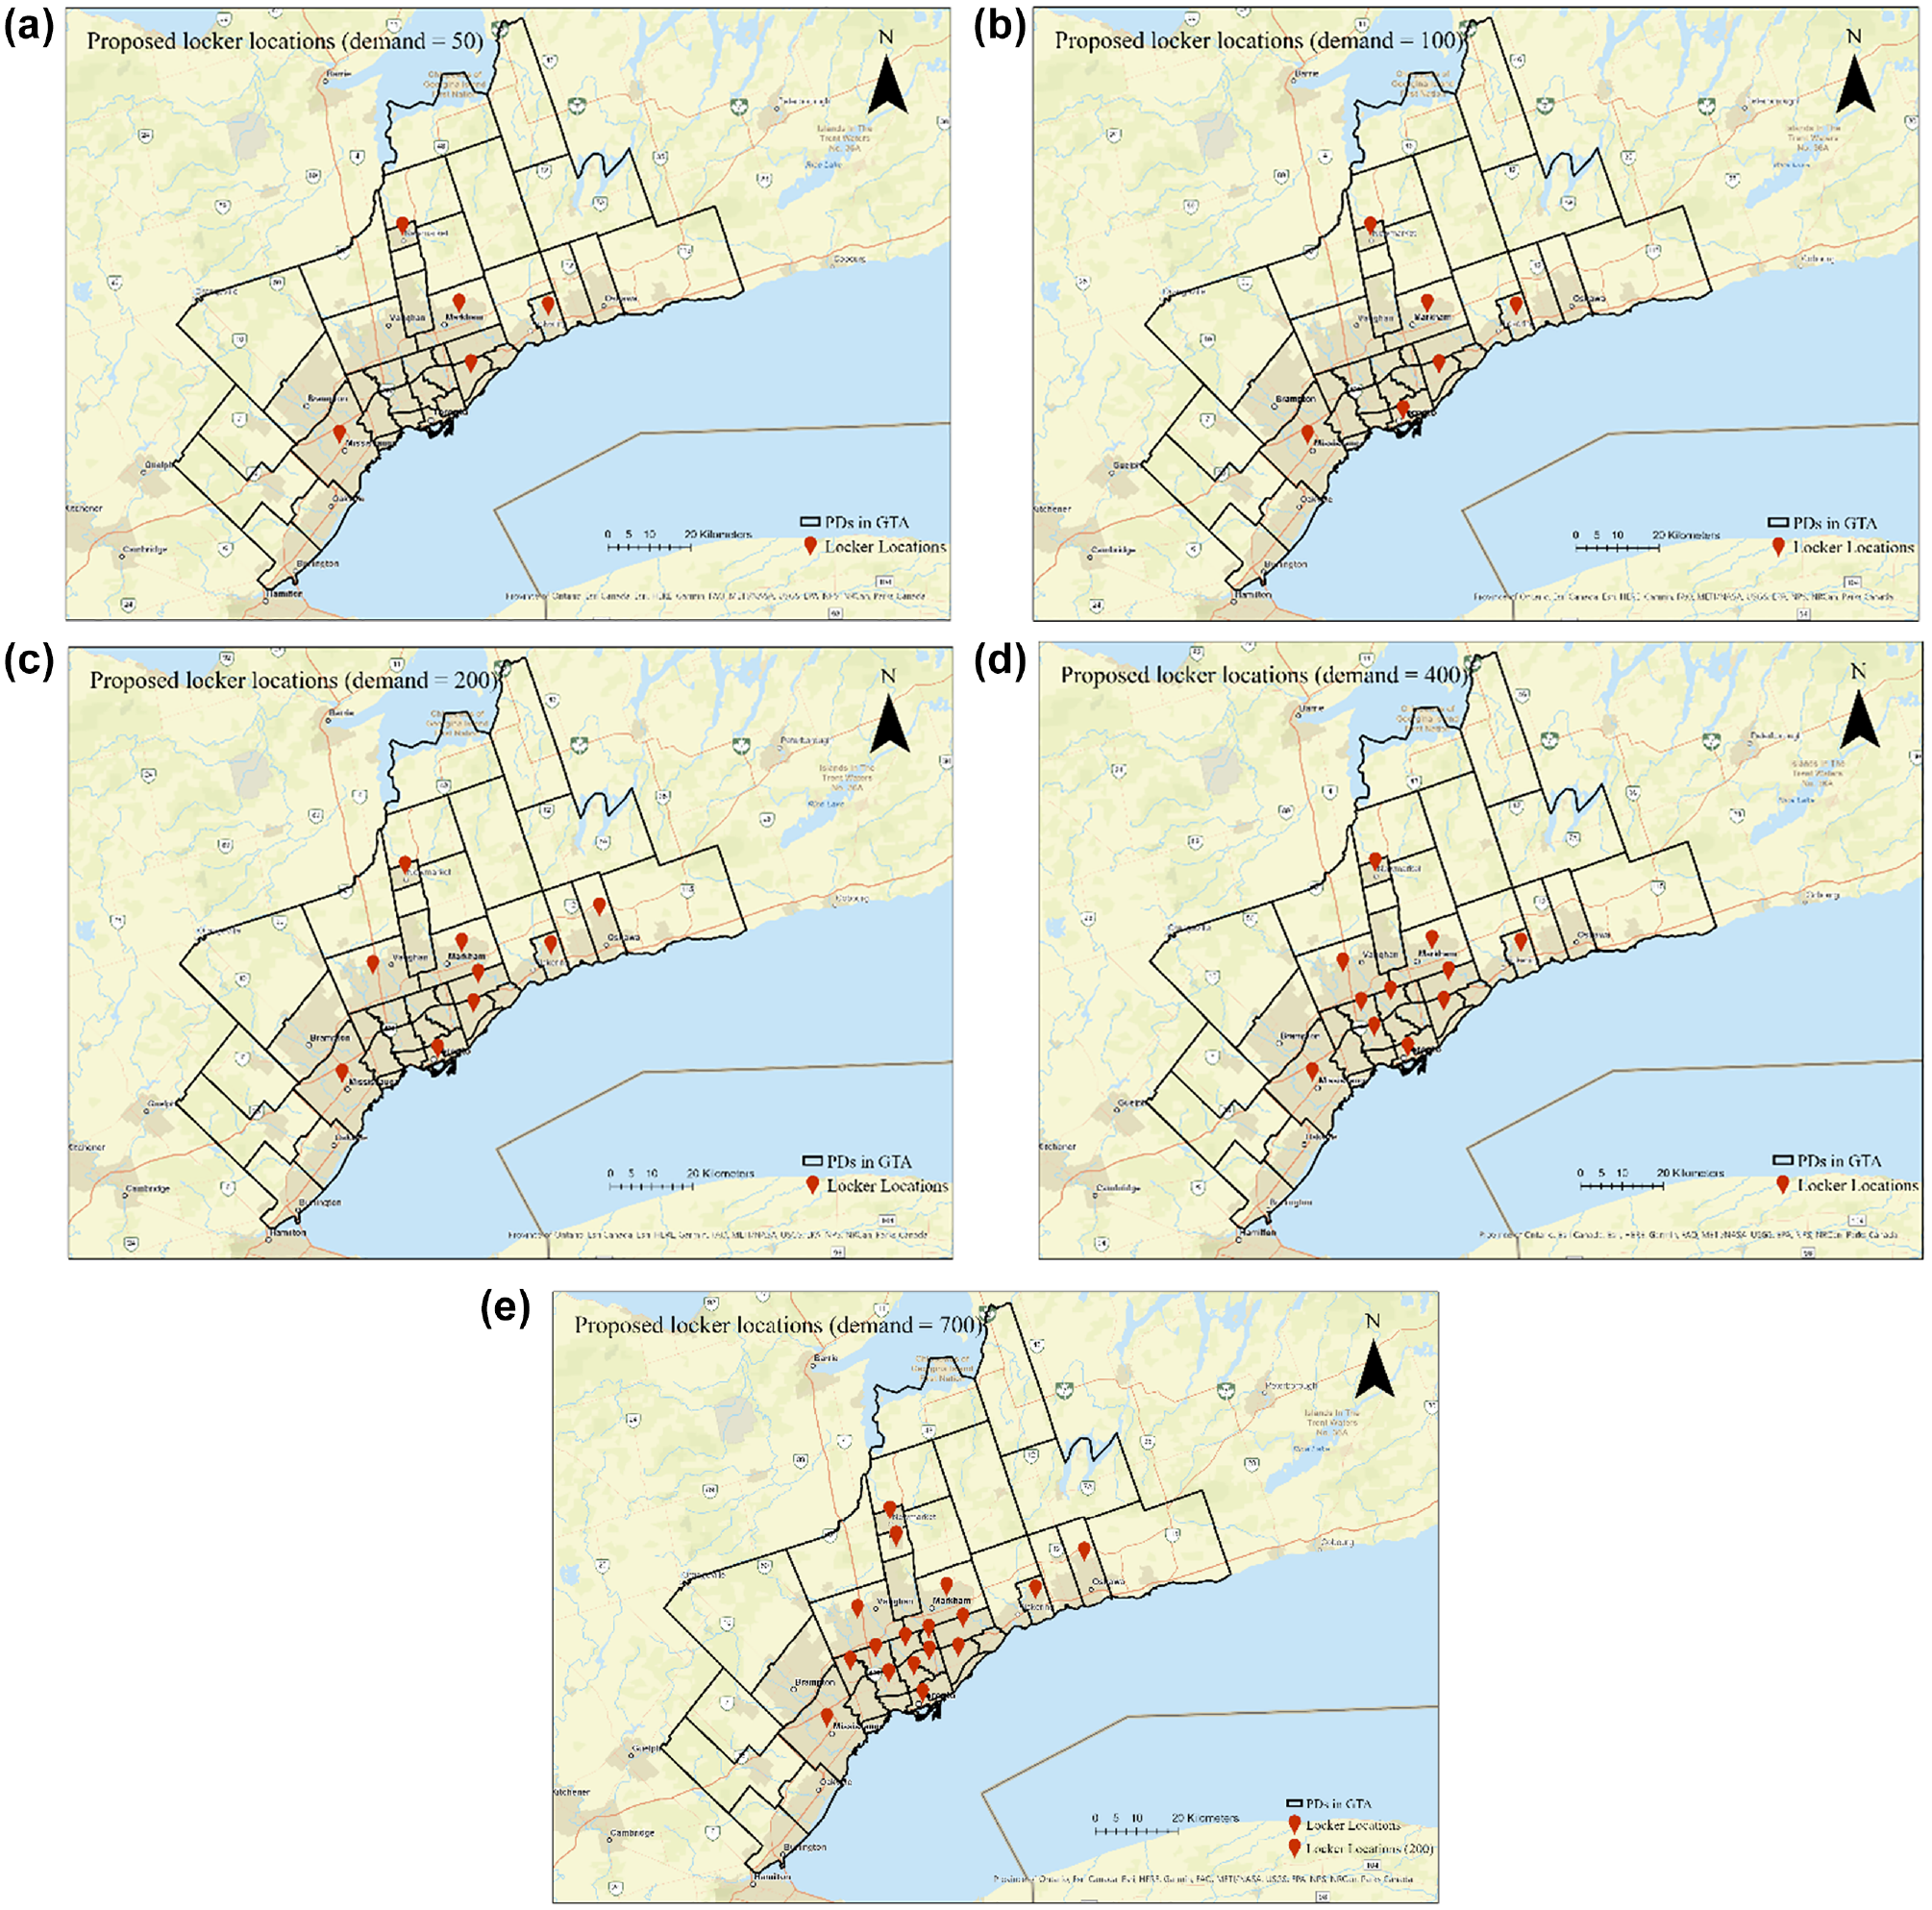
Proposed parcel locker locations under different demand volumes: (a) 5 locker locations under the demand of 50 parcels, (b) 6 locker locations under the demand of 100 parcels, (c) 9 locker locations under the demand of 200 parcels, (d) 11 locker locations under the demand of 400 parcels, and (e) 17 locker locations under the demand of 700 parcels.
As demand increases, the parcel locker network intensifies in PDs within the City of Toronto. Toronto has the highest CS commute production and attraction, and relatively high retail employment and population, compared with other regions.
While the parcel locker network intensifies in the City of Toronto, almost no new parcel lockers need to be installed in the outer regions, other than a new parcel locker in central Durham and one in the western York region when the demand volume exceeds 100 parcels per day. This shows that, unlike a traditional parcel locker solution where the parcel lockers are placed close to the customers to serve the corresponding population, the parcel lockers in the context of CS can serve farther areas as long as there are crowd-shippers who can reach the destinations.
Network Performance Evaluation
Cost Estimates
The average estimated costs of the five proposed parcel locker networks to handle different demand volumes are presented in Figure 5. In addition, the ranges of average costs ($/parcel) in the 30 scenarios in the testing phase of the five proposed network configurations are also visualized in the same figure.
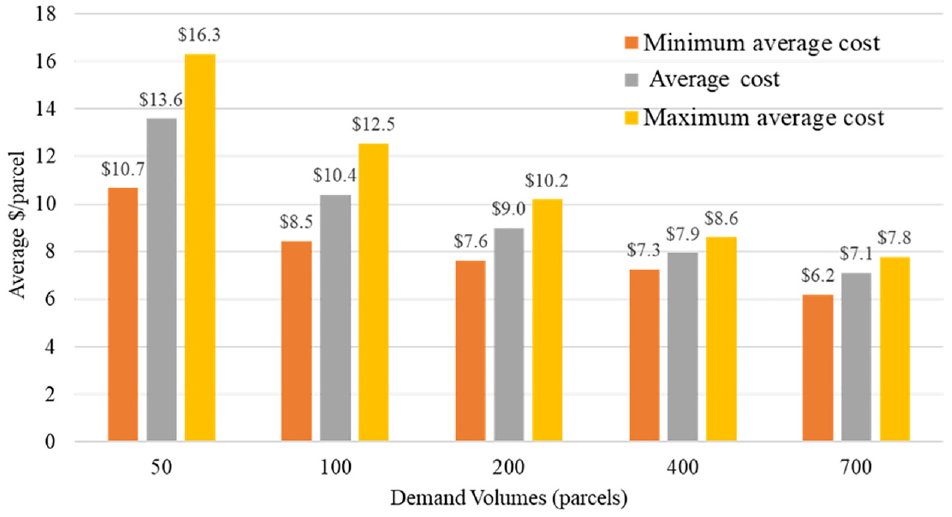
Ranges of average costs ($/parcel) in the testing phase.
Several patterns can be observed in Figure 5. First, as the parcel volume increases, the estimated costs are reduced, despite that a greater number of parcel lockers are installed. This is because parcel lockers are more efficiently used when the demand level is high, leading to economies of scale. Second, the volatility of the cost is reduced as the parcel volume increases. When the demand volume is 50, on average, the minimum average cost and the maximum average cost over 30 scenarios are approximately 34.5% lower and 20.0% higher than the overall average cost, respectively. When the demand volume is 700, the minimum average cost and the maximum average cost over 30 iterations are approximately 20.3% lower and 9.1% higher than the overall average cost, respectively.
The estimated costs of the five proposed network configurations under different demand volumes reflect that the proposed parcel locker network for serving the middle-mile deliveries can achieve lower cost per parcel delivery and lower volatility of the average cost when the demand volume is higher.
Transportation Time
The middle-mile transportation time in each iteration varies under different demand volumes. Figure 6 shows the distribution of the middle-mile transportation time estimated per parcel in the testing phase of each demand volume.
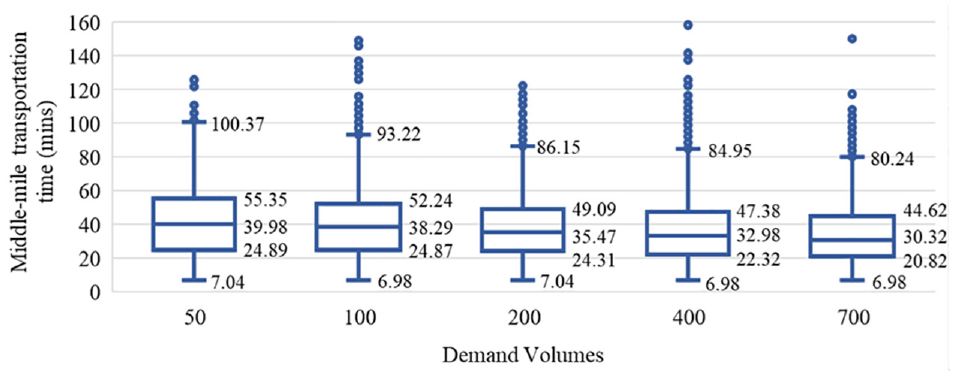
Middle-mile transportation time (minutes) in the testing phase under different demand volumes.
Figure 6 shows that the median middle-mile transportation time is reduced marginally as the demand volume increases. The variation in the middle-mile transportation time for higher demand scenarios also reduces as the third quartile reduces. This is because, as demand volume increases, more parcel lockers are installed to reduce distance that the crowd-shippers have to travel. In other words, it reduces the number of packages taking indirect routes. However, as can be seen from Figure 6, several higher outliers happen in some of the large demand scenarios. These outliers occur more often in large demand scenarios because more parcel demands are simulated, leading to some demands that have origins from distant PDs. Transporting these parcels to the destination PD can be time-consuming. These longer middle-mile deliveries may also cause delays to the last-mile deliveries downstream.
The distribution of first- or last-mile travel time required to carry packages to lockers is depicted in Figure 7. The median first- and last-mile delivery distance decreases for scenarios with larger demand volume and a larger number of parcel lockers. This shows that a locker network with higher locker density brings efficiencies at the first- or last-mile journey of the package. However, under the highest demand scenario, outliers with much longer first- or last-mile travel emerge. This occurs because no crowd-shippers are available to carry the package to the nearest locker but, rather than assigning the package to a RD, the package is routed to a farther locker where crowd-shippers are available, thus saving cost.
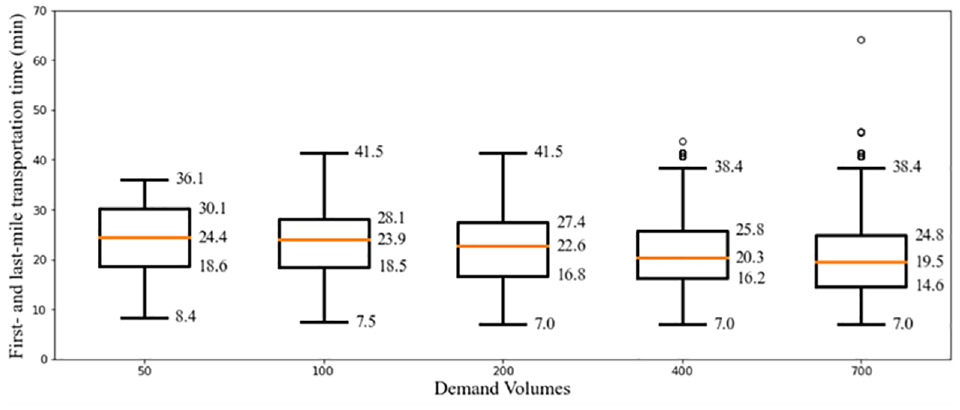
First- or last-mile transportation time (minutes) in the testing phase under different demand volumes.
Number of transfers
The number of transfers is another KPI for evaluating the utility of the installed parcel lockers. In the testing phase, the number of transfers associated with each parcel delivery is recorded. The average and maximum numbers of transfers per parcel and the average number of transfers per parcel locker in the testing phase, under each demand volume, are shown in Table 2.
Numbers of Transfers in the Testing Phase of Each Daily Demand Volume
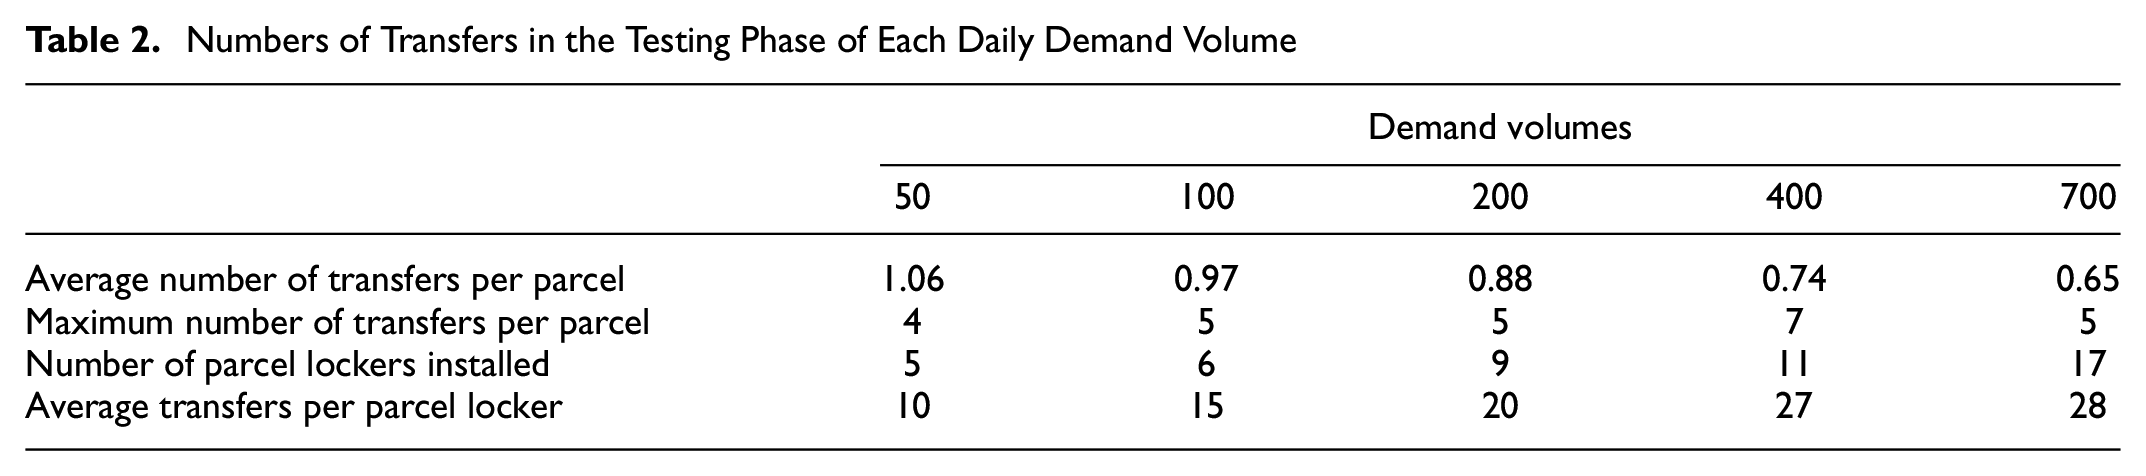
Table 2 shows that the average number of transfers involved in a parcel’s middle-mile delivery reduces as the parcel demand increases. The explanation is that the parcels are more frequently consolidated when more parcel deliveries share the same origins and destinations. On the other hand, the average number of transfers per parcel locker increases under the higher demand levels, even though there are more parcel lockers installed in the network. As the demand increases, some OD PD pairs that are served by crowd-shippers reach capacity, and the extra parcels must be routed to parcel lockers for transferring.
Hiring of Crowd-Shippers and Regular Drivers (RDs)
The hiring of RDs to complement crowd-shippers is an important activity of the CS system. Figure 8 illustrates crowd-shippers hired under five demand volumes. Figure 9 visualizes the numbers of links that need to be covered by RDs under each demand volume. A link that needs to be covered by an RD is named an “RD task.”Figures 6 and 7 show that the number of crowd-shippers and RD tasks increase as the demand volume increases. Interestingly, the number of crowd-shippers to be hired to serve a specific demand volume does not vary as significantly as the number of RD tasks to serve the corresponding demand volume. Furthermore, as the demand volume increases, the average number of crowd-shippers needed for each parcel delivery reduces. This is likely because parcels are consolidated for crowd-shippers to carry.
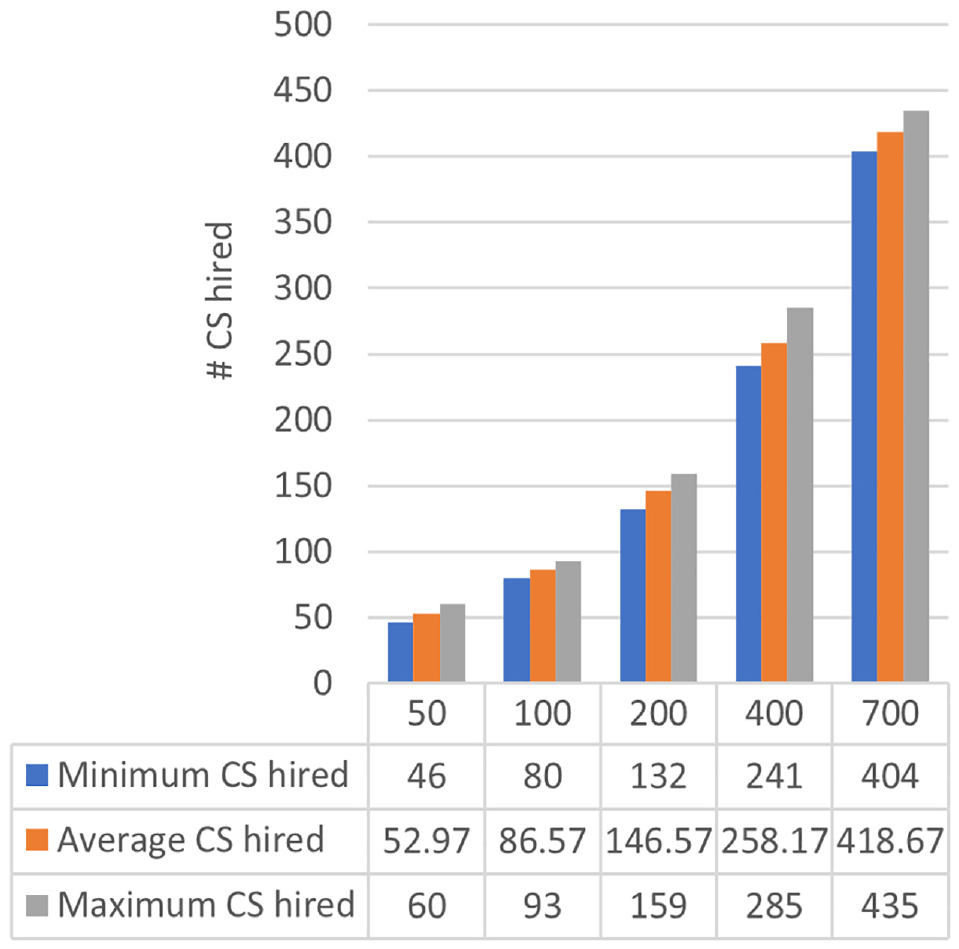
Crowd-shippers (CSs) hired under five demand volumes (x-axis).
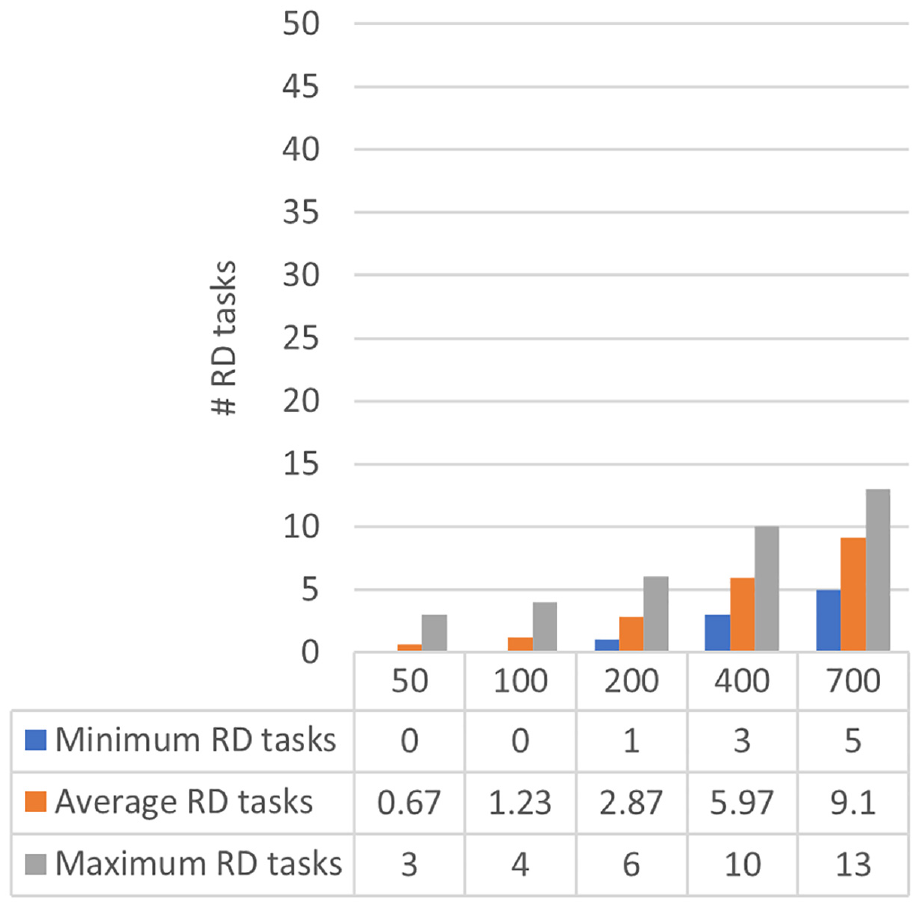
Regular driver (RD) tasks under five demand volumes (x-axis).
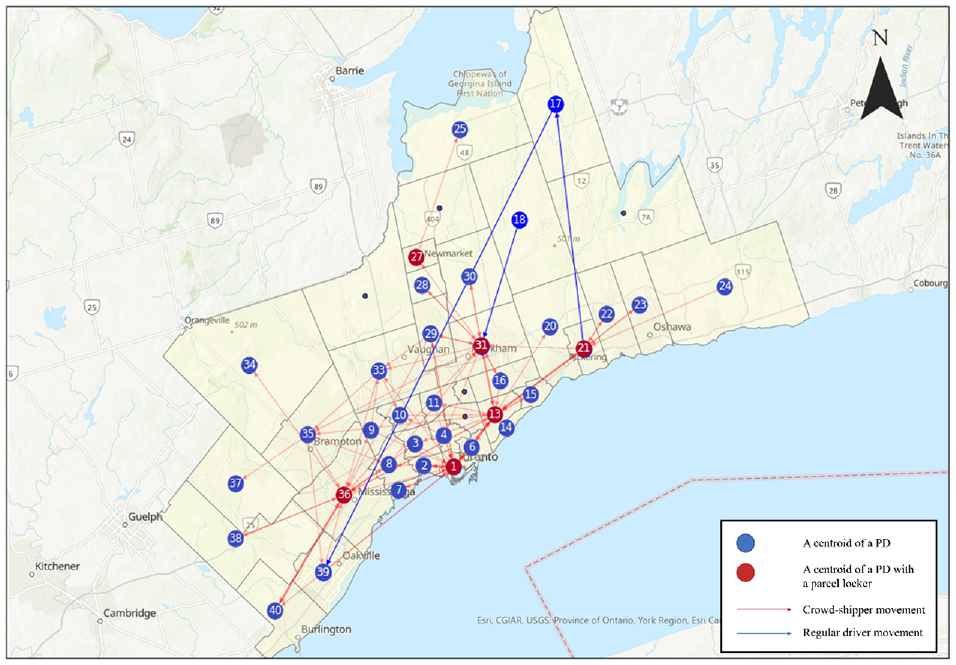
Figures 10 to 14 show the assigned driver movements in a sample scenario for each demand volume. The blue lines are the RD tasks. The red lines indicate the movements of the crowd-shippers. The thickness and opacity of the red lines and blue lines indicate the number of crowd-shippers hired and RD tasks, respectively.
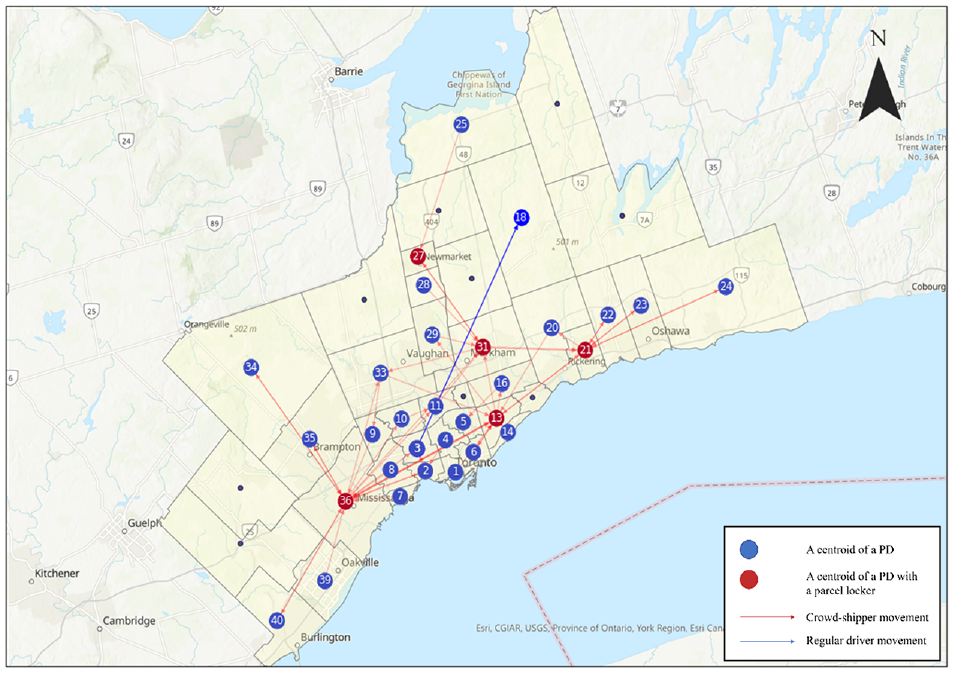
Example scenario of assigned driver movements to serve a 50-demand volume.
Example scenario of assigned driver movements to serve a 100-demand volume.
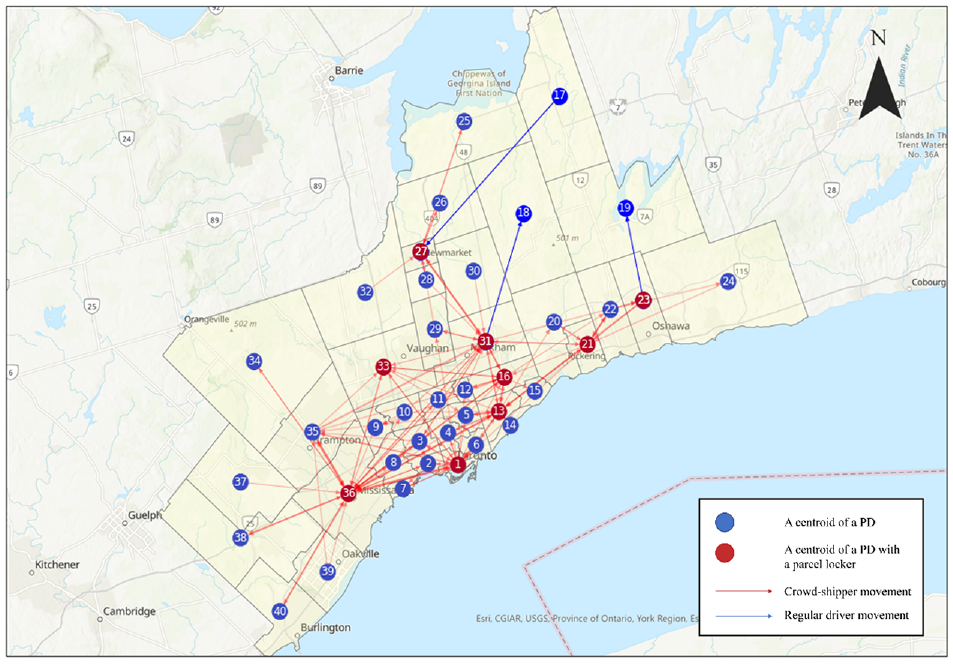
Example scenario of assigned driver movements to serve a 200-demand volume.
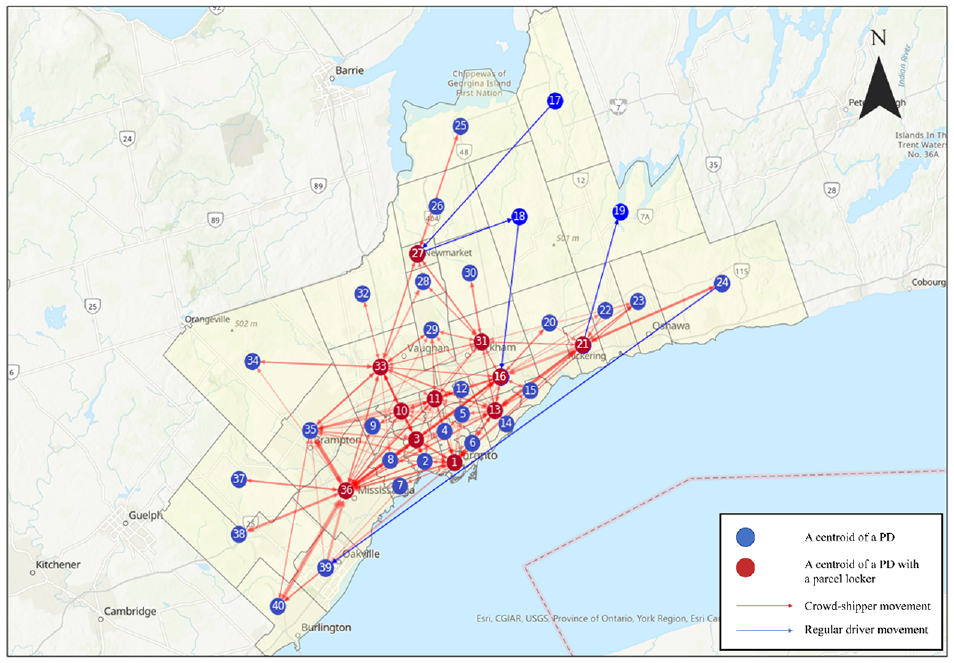
Example scenario of assigned driver movements to serve a 400-demand volume.
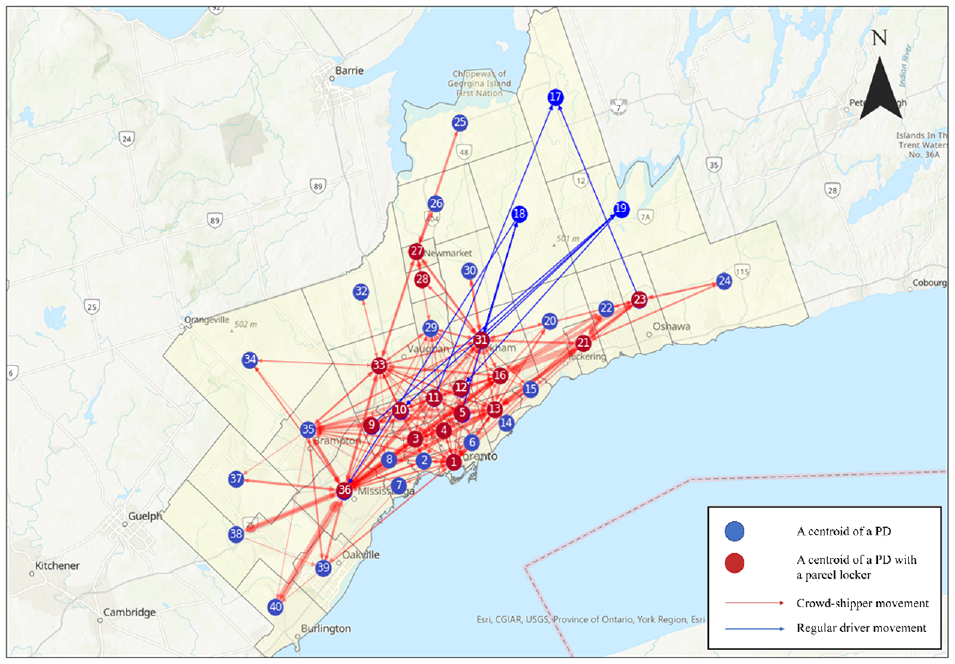
Example scenario of assigned driver movements to serve a 700-demand volume.
RD tasks are most often assigned to serve isolated rural PDs in the northern Durham region (PDs 17, 18, and 19). Although the population and retail employment are low in those PDs, there are a few parcel demands generated the origin or destination of which is in those isolated PDs. No crowd-shippers are available to serve these OD PD pairs. As can be seen from the maps, RDs are hired to cover the demands serving the northern Durham region.
Sensitivity Analysis
This section presents a sensitivity analysis to explore how the inter-connected CCL network’s performance changes with changes in the cost parameters. Network performance measures include the average delivery cost per parcel ($/parcel) and the average number of RDs and crowd-shippers hired. Three cost parameters include compensation rate c for crowd-shippers, compensation rate r for RDs, and locker renting cost l.
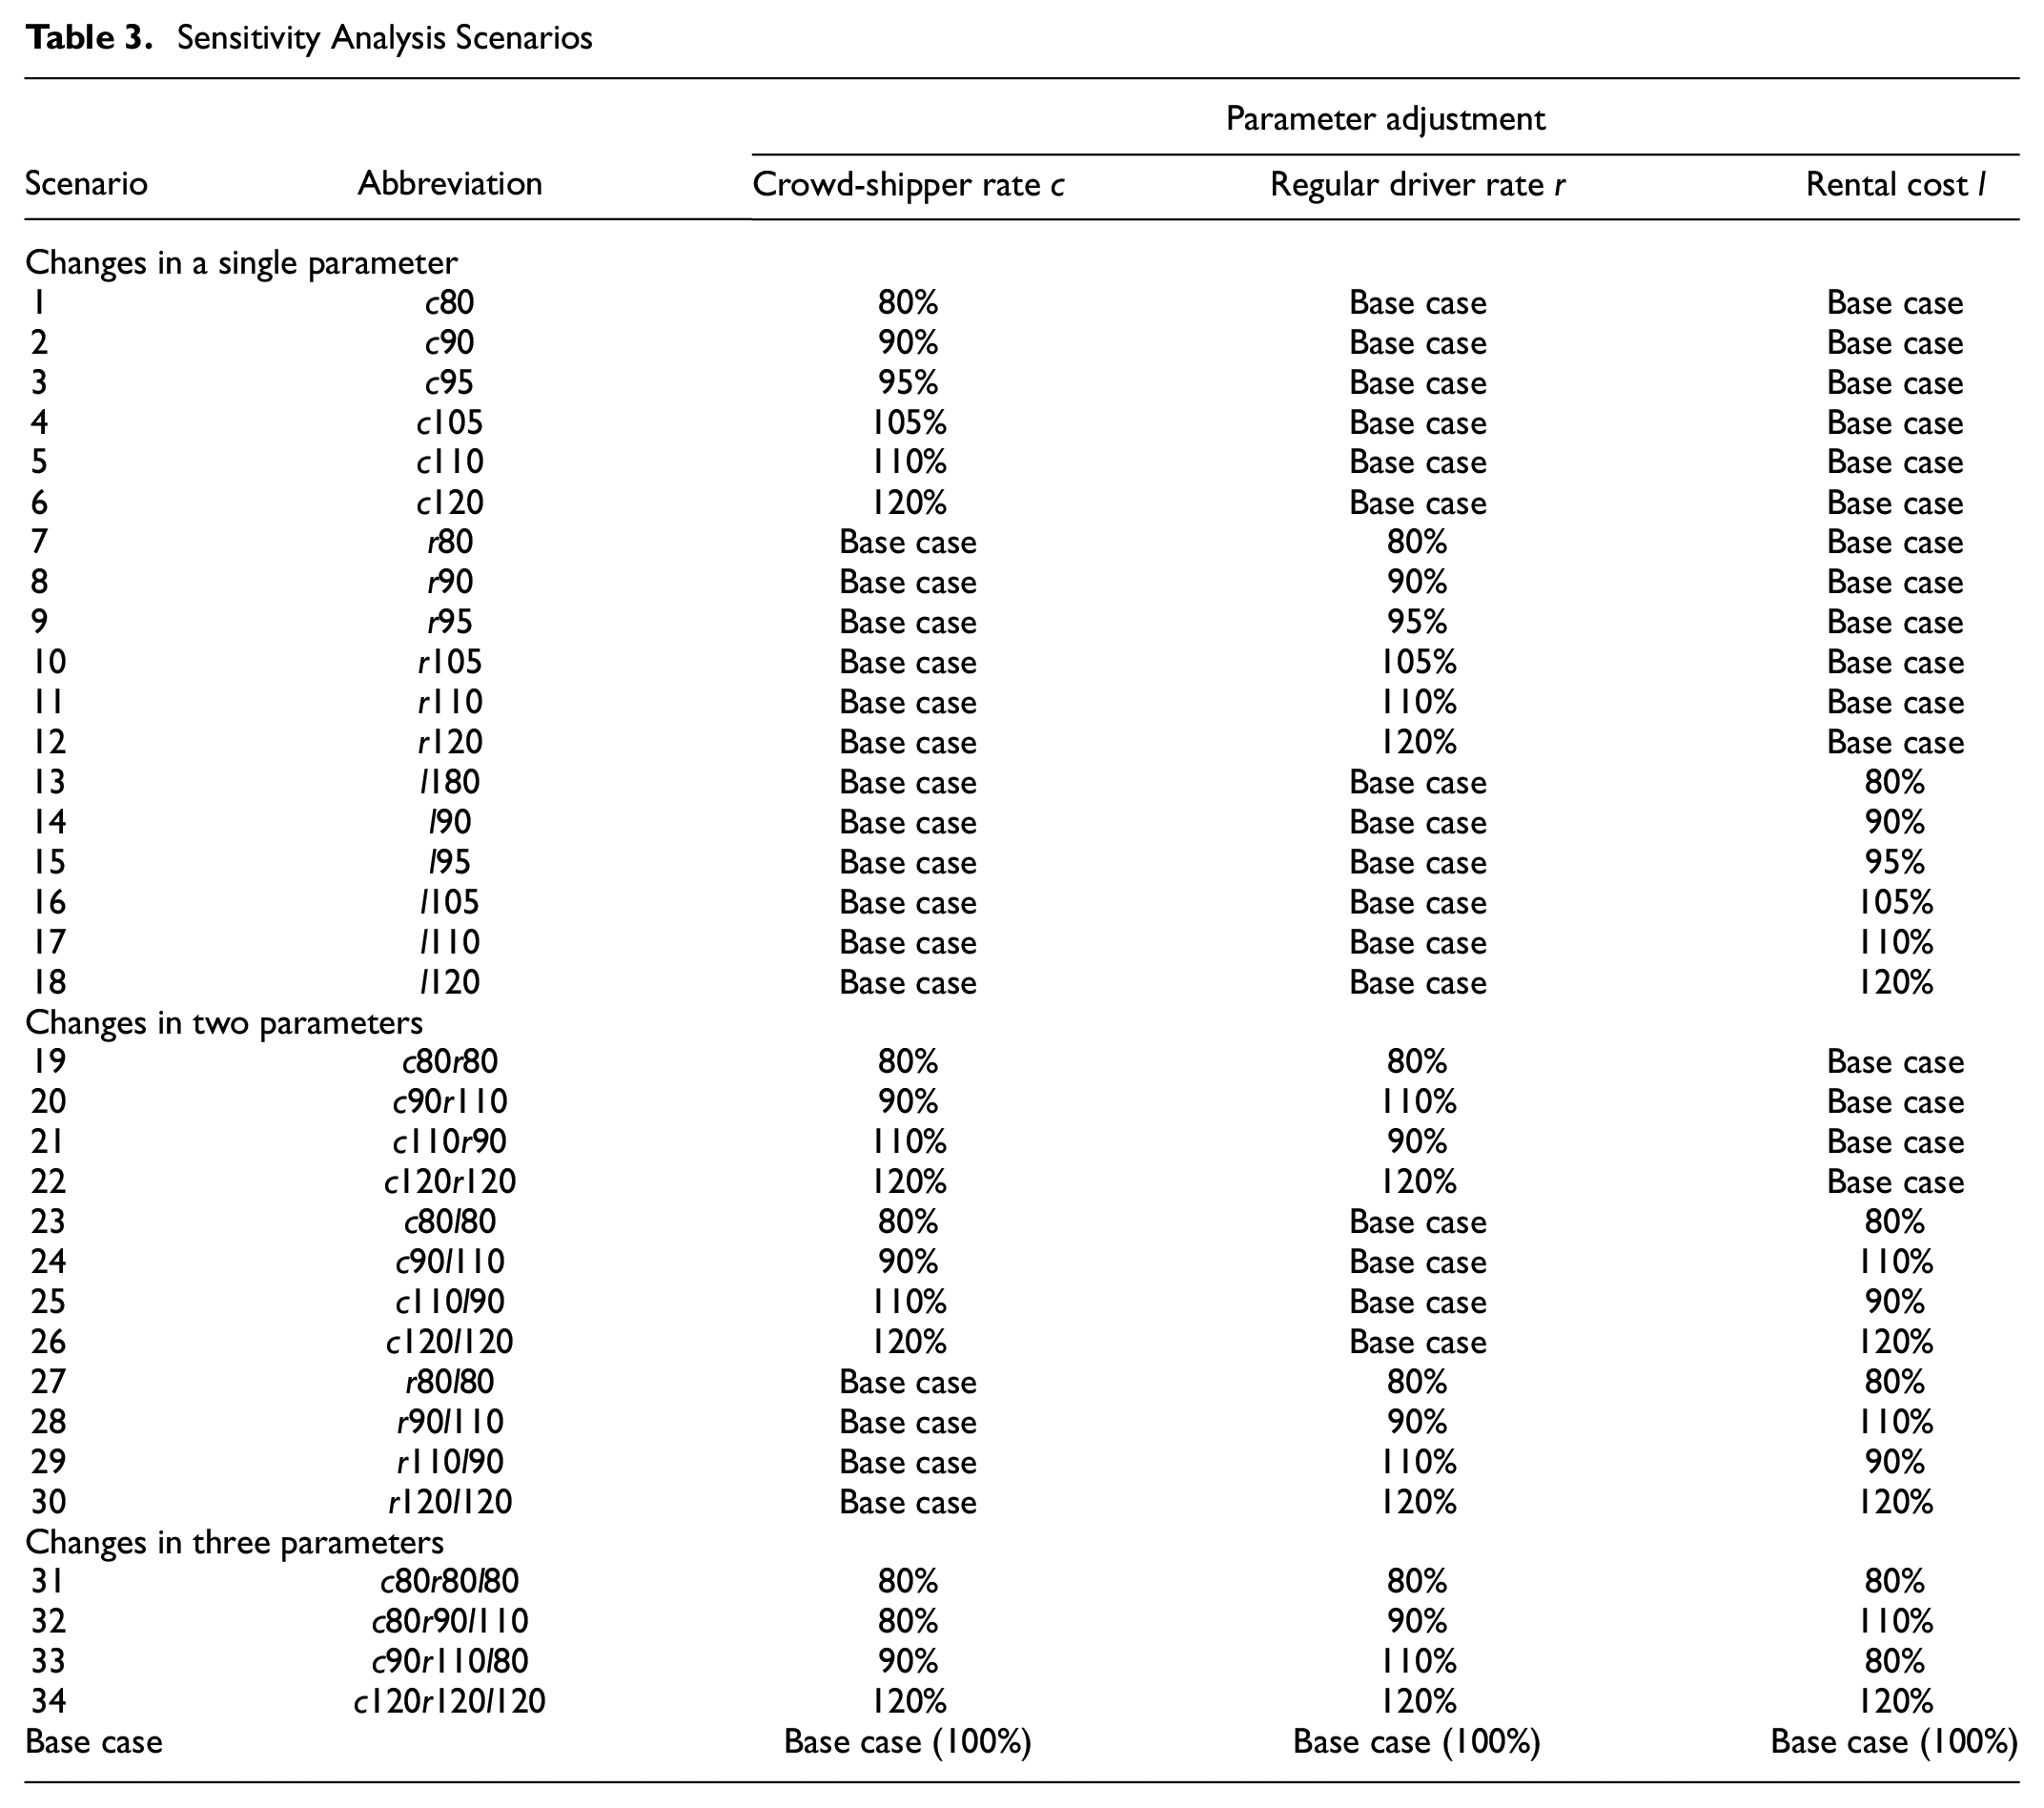
We conduct sensitivity analysis for each of the three cost parameters (scenarios 1–18), for combinations of two cost parameters (scenarios 19–30), and for combinations of all three cost parameters (scenarios 31–34). Those cost parameters are set in the range of 80%–120% of the cost parameters (i.e., base case) used in the previous analysis. The base cases of c, r, and l are $24/h, $56/h, and $40/day, respectively. The purpose of those scenario analyses is to determine both individual and combined effects of the cost parameters on the network performances. The details of the scenarios are presented in Table 3.
Sensitivity Analysis Scenarios
As an example, Figure 15 shows the sensitivity of the average delivery cost for the 34 scenarios, assuming a demand volume of 100. For scenarios 1–6, average delivery costs ($/parcel) linearly correlate to the changes in c. The changes in average delivery cost range from 83% to 115%. Average costs of parcel delivery are fairly stable in response to the changes in r and l in scenarios 7–18. The combinatorial effects of the two parameters show the positive and significant impacts of the compensation rate c for crowd-shippers, in combination with either r or l, on the average costs in scenarios 19–26. While the trends of scenarios 19–22 and those of scenarios 23–26 are similar, the magnitude of impacts is larger for the combinatorial changes of the (c, r) than those of the (c, l). Finally, the combined changes of the three costs (c, r, l) lead to positively increasing trends in the costs of parcel delivery. The percentages increase from 80% to 120%. This result is expected, since if all costs are reduced to 80% of the base case (scenario 31), then an identical solution is expected to the base case, but with 80% of the cost. Similarly, if all costs are increased to 120% of the base case (scenario 34), the solution is expected to be identical to the base case but with 120% of the cost.
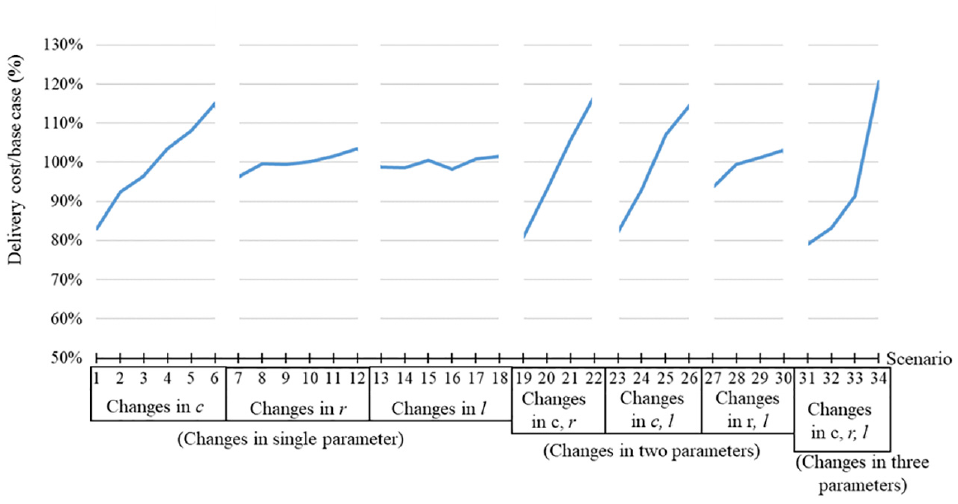
Percentage of the average delivery costs over base case delivery cost in the testing phase for the demand volume of 100.
The average RDs and crowd-shippers over 34 scenarios, which are color-coded based on their corresponding base case, are shown in Table 4. There are high negative correlations between the average number of RDs and crowd-shippers hired (e.g., green versus red colors in the same scenario). The negative correlation occurs because the RDs are the substitutes for delivering parcels where crowd-shippers are not available. In other words, if there are enough crowd-shippers to deliver parcels for a given link, then there is not a need for RDs.
The Average Number of Regular Drivers (RDs) and Crowd-Shippers and its Corresponding Percentage to the Base Case over 34 Scenarios.
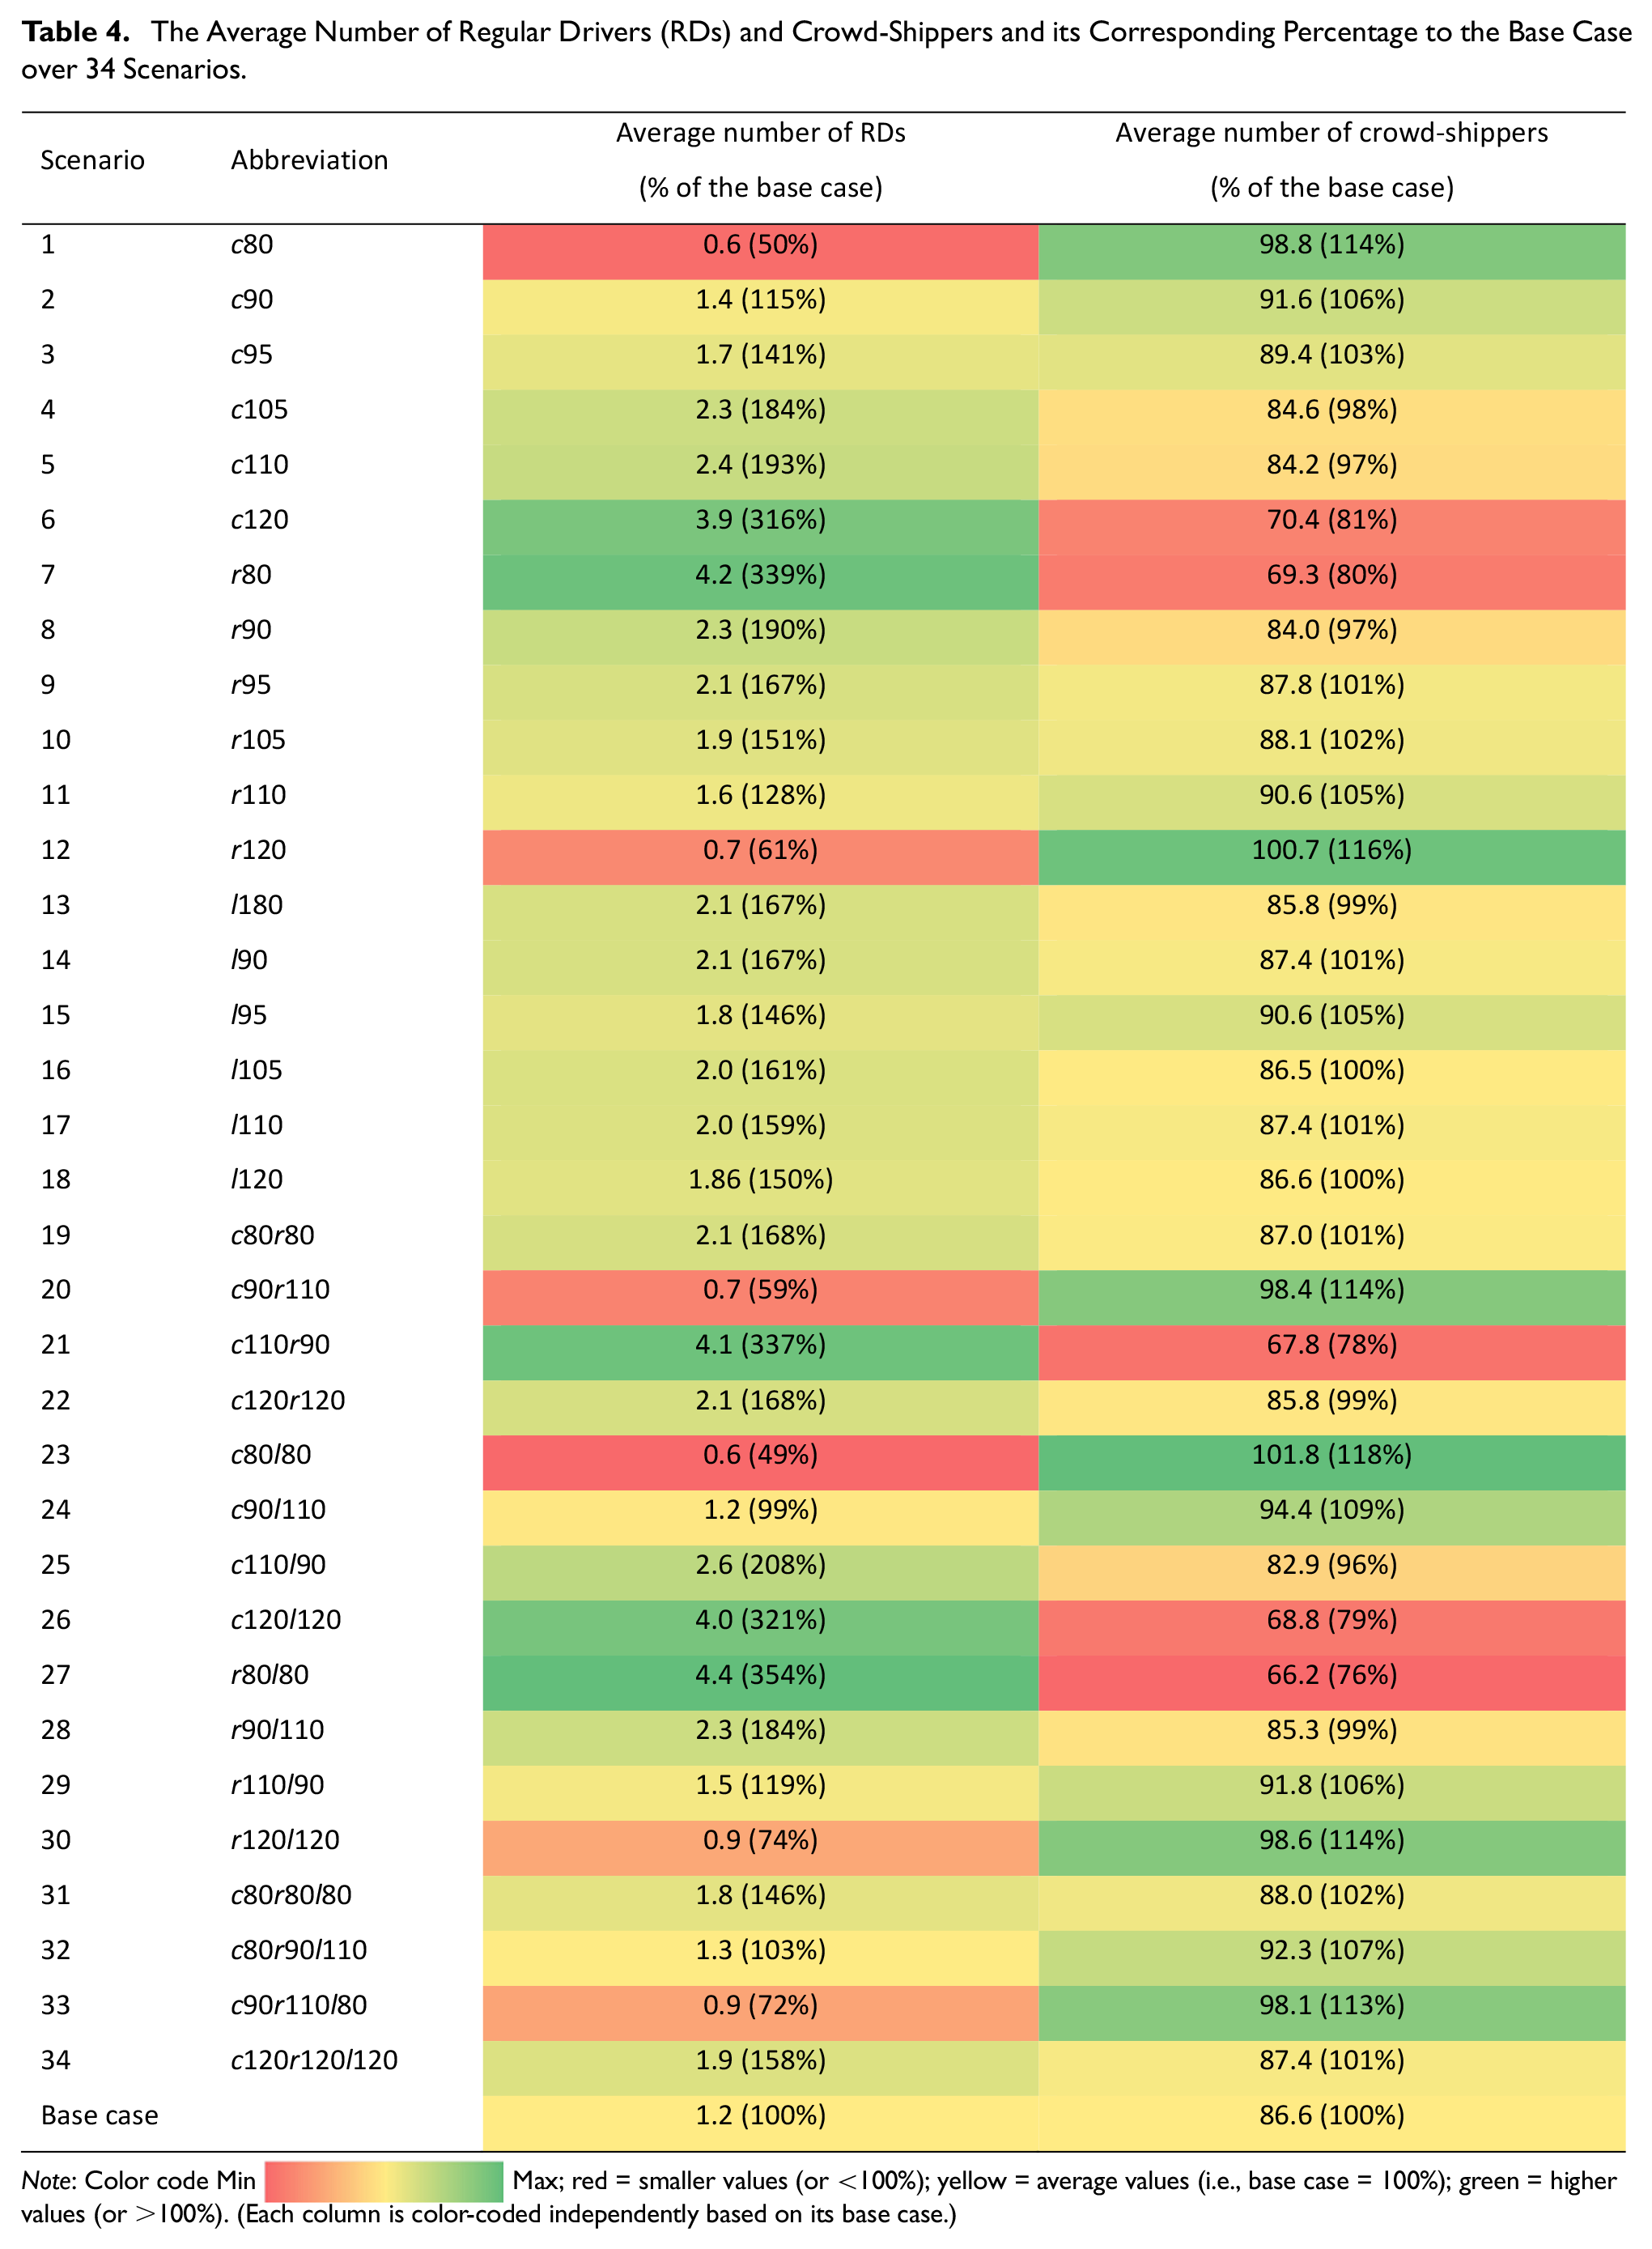
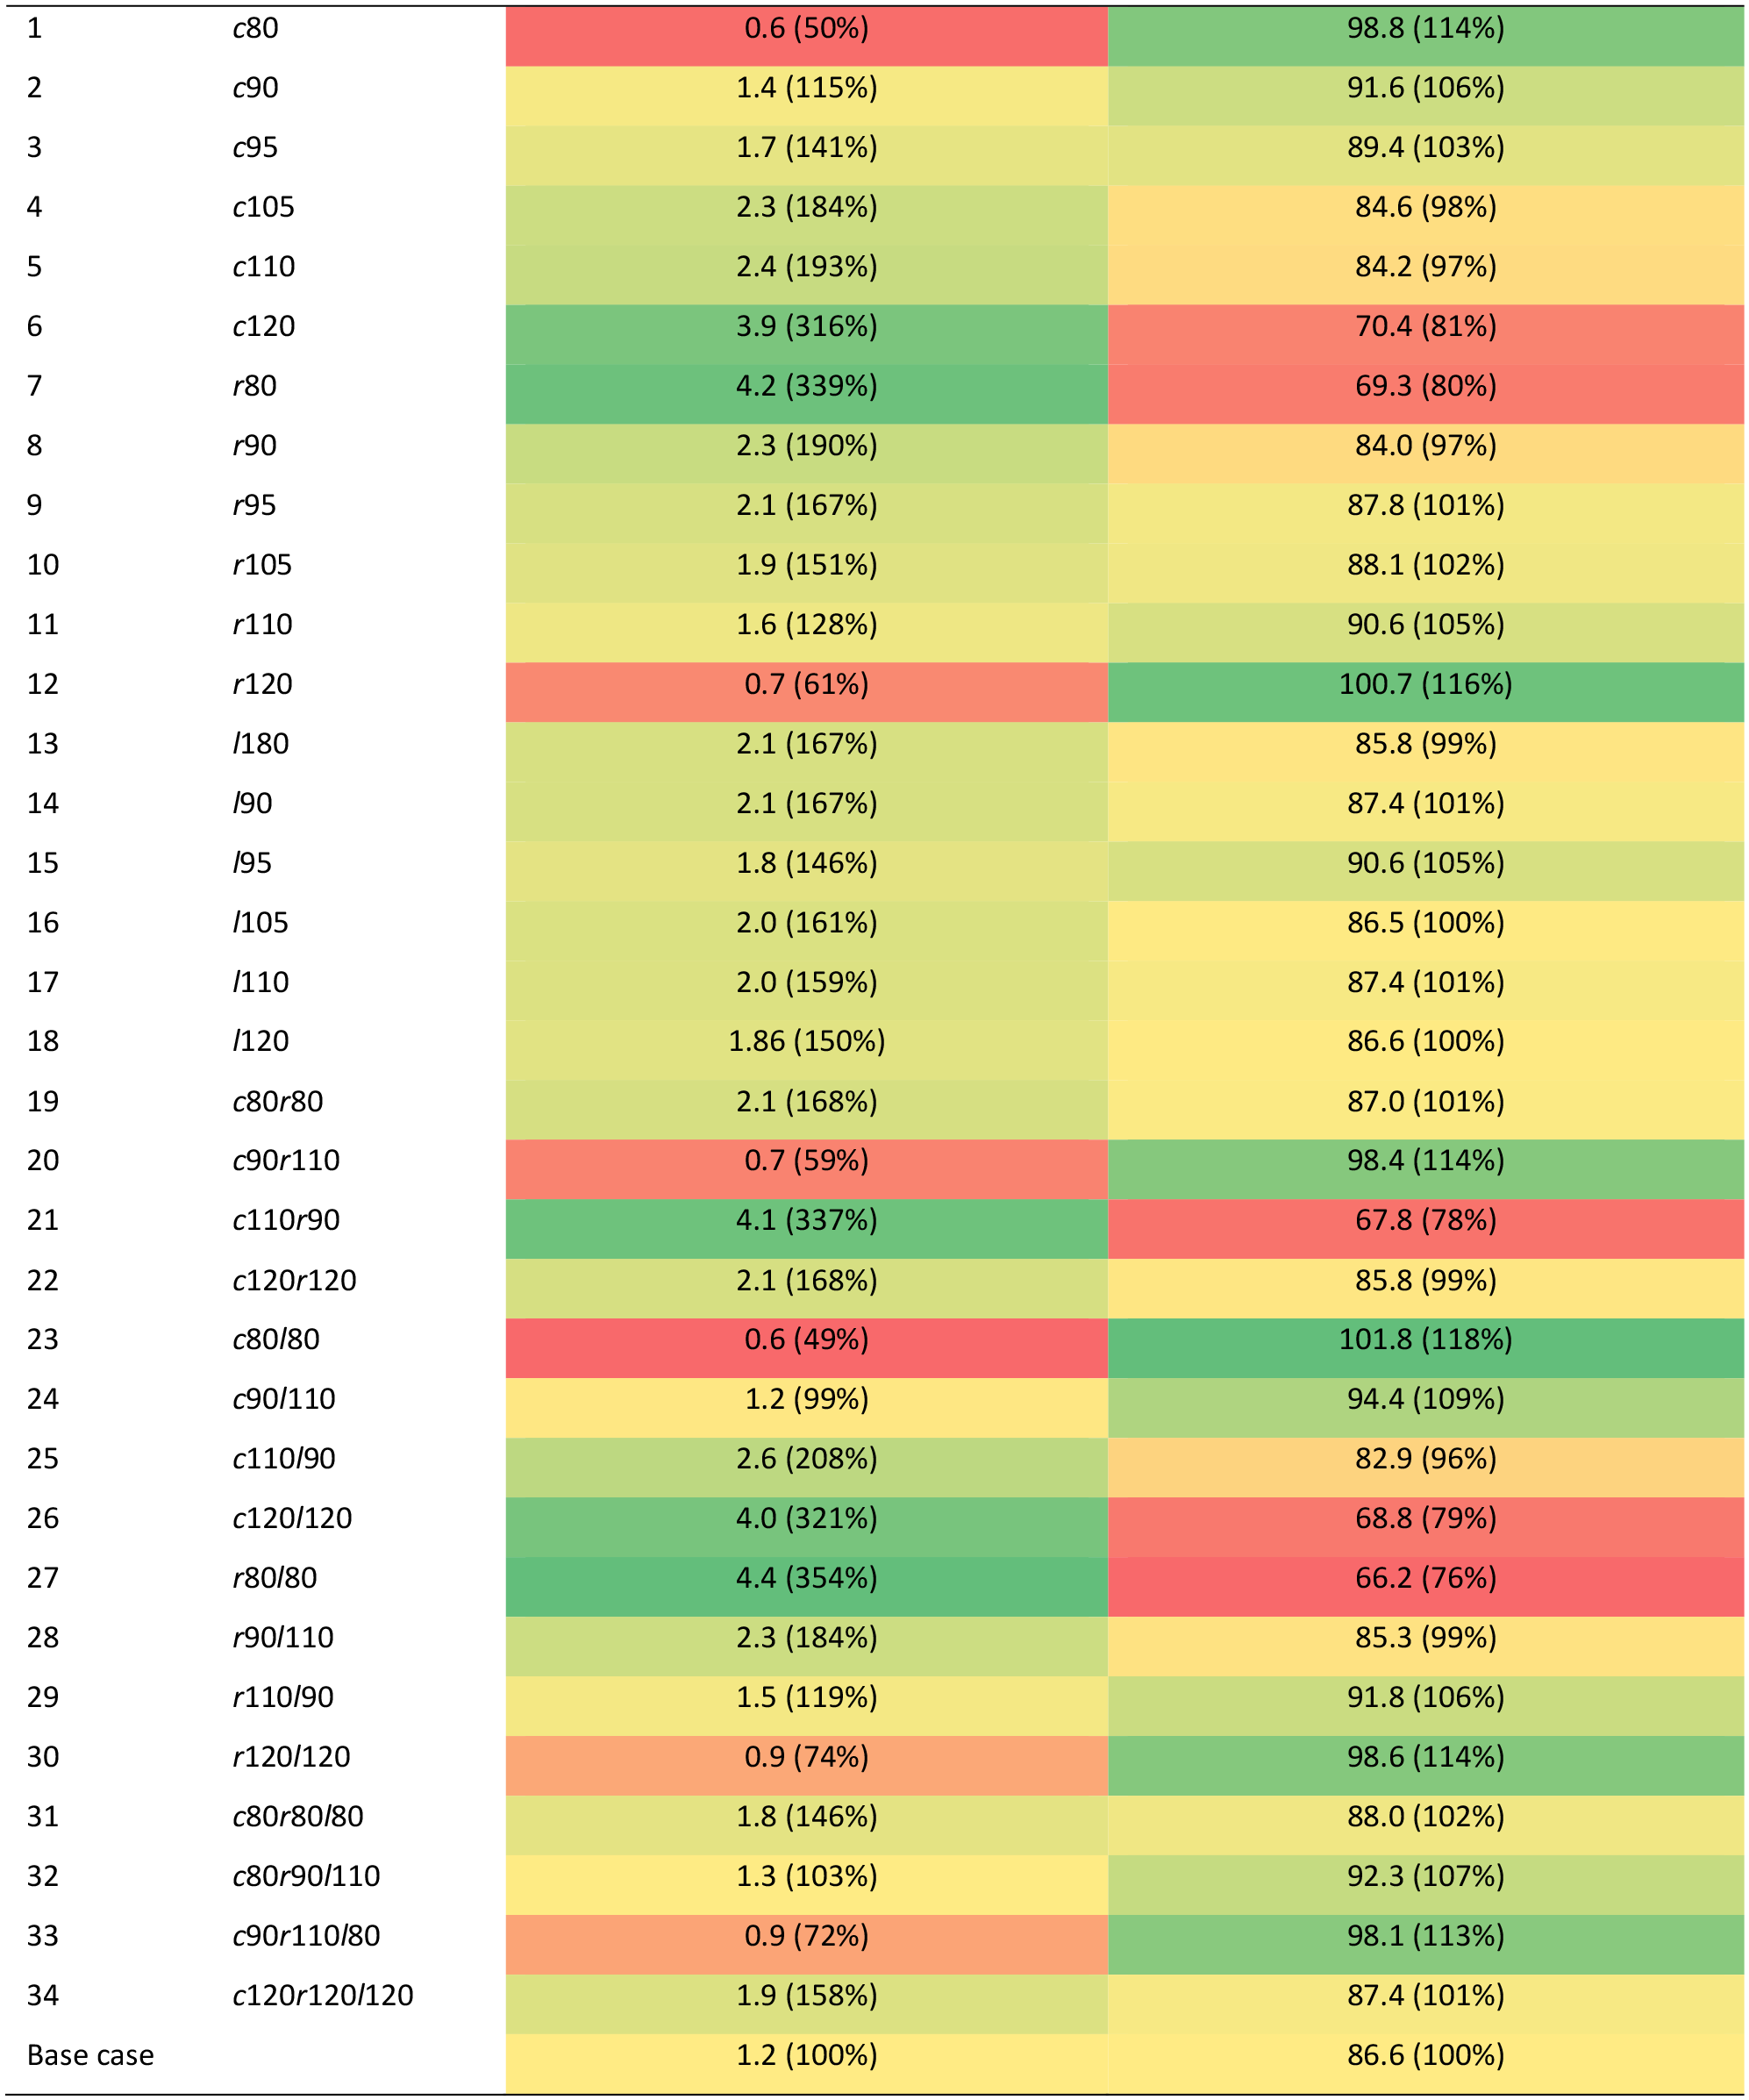
Note: Color code Min  Max; red = smaller values (or <100%); yellow = average values (i.e., base case = 100%); green = higher values (or >100%). (Each column is color-coded independently based on its base case.)
Findings from the sensitivity analysis provide insights into CS operations. For instance, the crowd-shippers’ compensation rate c has a greater impact on delivery costs than the compensation rate r paying for RDs or the locker renting cost l. The average number of RDs and crowd-shippers hired are negatively correlated.
Discussion and Conclusions
This study contributes to the field of location assignment problems, by developing a parcel locker network design to serve B2C logistics demand. Three contributions have been made. The first contribution is the incorporation of crowdsourcing transportation capacity with RDs in which crowd-shippers carry middle-mile deliveries that connect parcel lockers in the second level of the system. A PLLAP is formulated and solved to minimize the total cost of the system. A series of numerical experiments is conducted to test the performance of the network and the corresponding service levels. The second contribution is the modelling and estimation of potential crowd-shipper patterns in the GTA using a household travel survey. Leveraging the trip information, the corresponding commuter demographics from the TTS data, and the binary logit model developed by Le and Ukkusuri, we predict the probability that a commuter is willing to pick up and drop off a parcel along their commute ( 28 ). We observe that most of the potential crowd-shippers commute between a few OD PD pairs and some links require RDs for the deliveries. The third contribution is the parcel demand generation for each PD in the study area. Each PD has a probability to become either the origin or the destination of the parcel. The probability is measured by the percentage of the PD’s total retail employment or population, respectively.
This study provides optimal parcel locker locations and assesses network performance under five demand volumes. The optimal parcel locker locations tend to be where people work and/or live, or retail establishments. The numerical experiment for the demand volume exceeding 100 parcels per day shows the parcel locker network intensifies in the City of Toronto, while almost no new parcel lockers need to be installed in the outer regions, other than a new parcel locker in central Durham and one in the western York region.
The numerical experiments also indicate that a parcel locker network that is served by crowd-shippers becomes more stable and cost-effective as more parcel deliveries are requested. The median middle-mile transportation time is reduced marginally as the demand volume increases. As demand volume increases, more parcel lockers are installed to reduce the distance that the crowd-shippers have to travel through the locker network. In a scenario where the demand volume is low, a longer travel time/distance is expected to be necessary to reach one of a few parcel lockers. In addition, as the parcel demand raises, the average number of transfers involved in a parcel’s middle-mile delivery decreases while the utility of the parcel locker increases. Furthermore, crowd-shippers are hired about 50 times more often than RDs, which is partially because crowd-shippers are offered lower compensation. Furthermore, the sensitivity analysis reveals that the compensation cost c for crowd-shippers outweighs the compensation rate r for RDs and locker renting cost l for the average cost ($)/parcel delivery. The delivery cost has a linear correlation with crowd-shippers’ compensation rate c. There are high negative correlations between the average number of RDs and crowd-shippers hired. As such, the findings support CS companies to conduct a cost-benefit analysis for this service to build business strategies and implement related policies.
In addition to the costs on the supply side, the willingness to pay for this CS service needs to be investigated. In the literature, there are a few studies on this topic. For instance, in the recent study by Le and Ukkusuri, perishable products, such as foods, beverages, and groceries, were found more likely to be sent by CS services with a higher willingness to pay than other products ( 33 ). Moreover, the authors also pointed out factors that influence the willingness to pay, such as speed, driver partners’ past performance, online tracking and tracing, notification of delivery status, and personalized delivery time and location. On the other hand, Punel and Stathopoulos found different preferences for different shipping distances ( 34 ). They found that driver reputation and delivery speed were important for the short-distance delivery, while driver training and experience were important for long-distance delivery. The willingness to pay for the CS delivery services was found to be sensitive to the driver partners’ performance.
Research Implications
This study provides insights into the implementation of parcel lockers within the GTA, Ontario, Canada. The findings and insights can also be transferred and applied to another area, if input data for the models is available. Overall, the performance of the parcel locker network is high. As demand increases, the delivery cost per parcel decreases, the median middle-mile and first- and last- mile transportation time reduces marginally, the number of transfers per parcel decreases, and the average number of crowd-shippers needed for each parcel delivery reduces.
The optimal parcel locker locations are in commuting hubs that have high employment and population, since the daily demand volume at those locations is high, as is the number of available crowd-shippers. The numerical experiment suggests that CS companies should aim to intensify parcel locker density in the City of Toronto to facilitate parcel transfers crossing the GTA. The demand simulation reveals that parcels are more likely to be generated from the PDs within Mississauga, Vaughan, Brampton, and Markham where there is a high concentration of retail employment and population. Unlike a traditional parcel locker solution in which the parcel lockers are placed close to the customers to serve the corresponding population, the parcel lockers in the context of CS can serve farther areas as long as crowd-shippers are available to reach the destinations.
Limitations and Future Directions
There are some limitations associated with this research that provide opportunities for future research. First, a survey to assess the willingness-to-work as a crowd-shipper in the Toronto area can better identify crowd-shipper supply. This survey could consider not only demography and commuting pattern influences, but also land-use influences, such as accessibility and parking availability, and commuting opportunities by different modes of transportation. Second, demand assumptions are made because of the lack of historical information or demand projections. Further research on people’s willingness to accept parcels that are transferred by multiple crowd-shippers, as well as businesses’ interests to participate in the system, is needed to estimate the expected demand level. Third, the CCL system in this paper is modelled through a static approach. Future research should consider a dynamic optimization problem that formulates the assignment of parcels to drivers to occur after all the parcels arrive and are consolidated at a locker. A dynamic problem, that incorporates day-to-day variation in crowd-shipper supply and parcel demand, would be suitable and feasible for making operational decisions once the parcel locker locations are established. Fourth, the capacity of the parcel lockers is not considered here because the optimal mix of different-sized parcel lockers adds another element to the CS system that is already difficult to solve.
Footnotes
Acknowledgements
The authors thank the staff of Shipperbee, who provided useful insights at the outset of this project, and Kianoush Mousavi and Merve Bodur who provided helpful comments toward the completion of this project.
Author Contributions
The authors confirm contribution to the paper as follows: study conception and design: S. Zhang, T. Le, M. Roorda; data collection: S. Zhang, M. Roorda; analysis and interpretation of results: S. Zhang, T. Le, M. Roorda; draft manuscript preparation: S. Zhang, T. Le, M. Roorda. All authors reviewed the results and approved the final version of the manuscript.
Declaration of Conflicting Interests
The author(s) declared no potential conflicts of interest with respect to the research, authorship, and/or publication of this article.
Funding
The author(s) disclosed receipt of the following financial support for the research, authorship, and/or publication of this article: Funding for this research was provided by the Natural Science and Engineering Research Council of Canada (NSERC). Grant number: ALLRP 555620 - 20