
Abstract
Common-carrier parcel lockers present a solution for decreasing delivery times, traffic congestion, and emissions in dense urban areas through consolidation of deliveries. Multi-story residential buildings with large number of residents, and thus a high volume of online package orders, are one of the best venues for installing parcel lockers. But what is the right size for a residential building locker that would suit the residents’ and building managers’ needs? Because of the novelty of parcel lockers, there is no clear guideline for determining the right locker size and configuration for a residential building given the resident population. A small locker would result in packages exceeding capacity and being left in the lobby, increasing the building manager’s workload and confusing and inconveniencing users. On the other hand, a large locker is more expensive, more difficult to install, and unappealing to residents. To answer this question, we installed a common-carrier parcel locker in a residential building in downtown Seattle, WA, U.S.A. Through collecting detailed data on locker usage from the locker provider company, we studied and quantified carriers’ delivery patterns and residents’ online shopping and package pickup behaviors. We then used this information to model the locker delivery and pickup process, and simulated several locker configurations to find the one that best suits the delivery needs of the building. These findings could aid urban planners and building managers in choosing the right size for residential building lockers that meet delivery demand while minimizing costs and contributing to environmental benefits.
Keywords
Amid the popularity of online shopping and just-in-time delivery, the e-commerce market is seeing exponential growth. Between 2015 and 2020, the e-commerce sales ratio nearly tripled, and the World Economic Forum has predicted that online sales will account for 20% of the retail market share by 2023 ( 1 ). The COVID-19 pandemic catalyzed this trend through many people staying at home and performing the majority of their personal, family, and even business-related shopping online. The World Economic Forum has further predicted a 78% increase in urban last-mile deliveries between 2020 and 2030, threatening a 30% increase in last-mile emissions and traffic congestion in the world’s 100 most populous cities ( 1 ). Urbanization, rapid technological advances, increasing demand for next-day and same-day delivery, and extended work-from-home trends (even as the pandemic subsides) will continue to drive e-commerce growth and increase urban deliveries.
The last mile of delivery, denoting the final link of the delivery journey from retailer to consumer, is the most time-consuming and most expensive link in the delivery process for urban areas. Major cities are characterized by scarce street parking and frequent congestion, and delivery drivers spend up to 80% of their tour time parked ( 2 ). Moreover, up to 15% of delivery attempts fail because the consumer is not home to receive the package ( 3 ), requiring an additional delivery trip. Rising consumer expectations around speed and convenience of home deliveries pressure urban residential streets that are not equipped to handle large volumes of delivery vehicles. Therefore, improving the last mile and especially the “final 50 feet” of delivery—which comprises parking in a spot, entering and navigating a building, and reaching the consumer—holds the greatest potential for efficiency gains ( 4 ).
Common-carrier parcel lockers offer a promising solution to the “final 50 feet” challenges by creating delivery density and eliminating failed delivery attempts. They provide a secure, automated, self-service central hub where any carrier can deposit packages and consumers can retrieve them at their convenience using a temporary access code. By splitting the link between carriers and consumers in the last mile, lockers consolidate deliveries to distributed addresses at one location, resulting in reduced delivery times ( 3 ). By providing a secure storage system, they also eliminate failed delivery attempts and the need for an additional trip. Furthermore, lockers do not require couriers and consumers to meet at the same time and place, promising greater convenience for both parties. In the process, however, lockers shift some delivery costs, such as travel time, from carrier to consumer ( 5 ). For lockers to become commonplace, users must come to view them as sustainable, convenient, and secure alternatives to home delivery. Therefore, it is critical to understand the e-commerce behavior of users and provide services that satisfy those needs in an efficient way.
Parcel lockers may be placed in residential buildings, commercial buildings, stores, or neighborhood hubs, attracting users with different behaviors and needs. Previous studies examined consumer views toward the adoption and use of parcel lockers through surveys, focus groups, or interviews. A survey of 15-64 years old online shopping consumers in Jakarta, Indonesia, found that most users still preferred traditional home delivery over the public parcel lockers, citing timeliness and convenience as main factors ( 6 ). However, some favored lockers for their lower delivery costs and more up-to-date package information. Researchers in Brazil conducted a stated preference survey to understand demand for public parcel lockers ( 7 ). 63% of respondents said they would use the system, naming safety, security and easy access as primary motivations. Respondents also stated their preferred locations for public lockers as supermarkets (26%), followed by stores (22%), and shopping malls (21%). An intercept survey of light rail riders in three stations in Seattle, WA, found that the majority of riders preferred to receive their online orders via home delivery rather than in lockers, but 63% of respondents at one station and more than 40% at the other two stations said they would consider switching to a common-carrier locker if there was one in the light rail station ( 8 ). With a focus group of 26 Swedish online shopping consumers, all of whom had interacted with a parcel locker before the conversation, researchers found that if participants had one positive experience with a parcel locker, they were likely to continue using it, generating a cycle of positive interactions ( 9 , 10 ). In another study, Polish millennials were asked if they would switch to locker delivery for environmental reasons ( 11 ). The researchers found that lockers' contribution to the emissions reduction is not a strong enough incentive for young people; however, they cited lower delivery costs and the ability to pick up orders at any time of day as the primary perceived advantages of lockers to respondents.
Among the most common types of lockers are those in urban residential buildings, where large numbers of residents create high volumes of package deliveries ( 12 ). Building owners and managers are increasingly perceiving lockers as a solution to reducing their workload while avoiding delivery couriers going to various floors. Carriers and policy makers are also pushing for lockers as a sustainable and more efficient solution to the last-mile delivery challenges. However, because of the novelty of lockers, there is no clear guideline for the right locker size for a residential building with a certain resident population. A small locker would result in packages exceeding capacity and being left outside the locker, increasing the building manager’s workload and inconveniencing users. It is therefore in the interests of both building managers and residents to make sure the locker has enough capacity to accommodate the delivery demand, especially during the holiday season when online deliveries peak. However, a locker also takes up space that could be used for other purposes, and a larger locker is more expensive, more difficult to install, and unappealing to residents.
While finding the right size for a locker is paramount, most locker providers and building managers do not know what the right size and configuration for a residential building locker is. Not only is residential delivery demand often not well understood, but also there are other behavioral aspects, such as users’ time-to-pickup, that influence the performance of a locker. As demand for last-mile delivery continues to grow, emerging solutions like parcel lockers could play an important role in alleviating the congestion while meeting the delivery demand. Therefore, providing data and tools to right-size urban residential lockers is important to guarantee their successful and long-term adoption.
The objective of this study is to establish a method for finding the right size and configuration for a residential building locker that suits the needs of residents and building managers and accounts for locker users’ behaviors. We partnered with a locker provider company to install a common-carrier parcel locker in a residential building in downtown Seattle, WA, U.S.A. Through collecting detailed locker usage data, we studied and quantified carriers’ delivery patterns and residents’ online shopping and package pickup behaviors. We then used this information to model the locker delivery and pickup process, through a discrete event simulation, and tested several locker configurations to find the one that best suits the delivery needs of the building.
Existing research has studied consumer preferences for using parcel lockers; however, no study has looked into right-sizing lockers. Parcel lockers have not been widely adopted in the U.S., and companies often keep their usage data private. Consequently, little data exists on the daily and seasonal online shopping patterns and locker users’ behaviors. Through a unique dataset of locker usage patterns, this study fills those gaps to a good extent. Moreover, the simulation results offer insights on how to configure a parcel locker for a residential building given its resident population. These insights could aid urban planners and building managers in choosing the right size and configuration for residential building lockers that meet delivery demand while minimizing costs and contributing to environmental benefits.
Study Approach
We partnered with a locker provider company and the management of a residential building in downtown Seattle, WA, to install and pilot test a parcel locker in the building. We obtained locker usage data from the locker provider company, and analyzed it to understand the online package delivery demand and pickup behavior of locker users. We then used this information to model the locker delivery and pickup process, and simulated several locker configurations to find the one that best suits the delivery needs of the building.
Figure 1 presents the overview of the study approach, and the main steps are described in the following subsections.
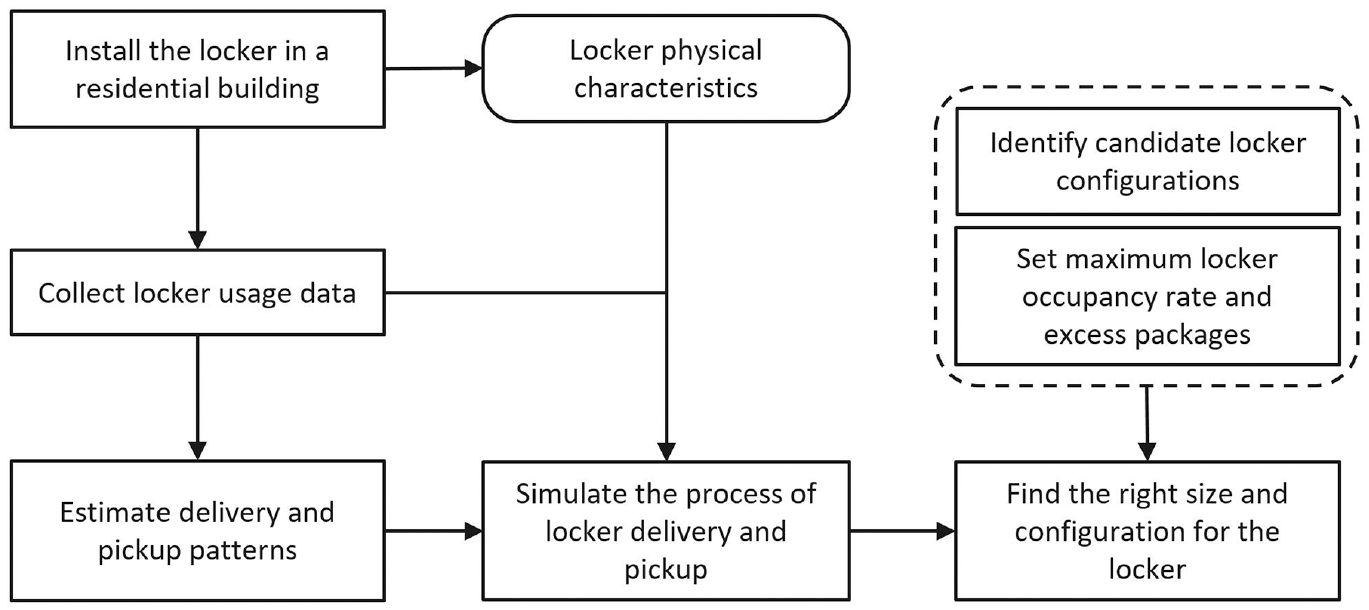
Overview of the study approach.
Locker Installation
The residential building selected for this study is a 26-story condominium, with 133 units, in the Belltown neighborhood of Seattle, WA. The 220-acre mixed-use Belltown neighborhood is adjacent to Seattle’s central business district, and as of the 2010 census, it was the most densely populated neighborhood in Seattle, with about 12,000 people living in a 0.3 square-mile area ( 13 ).
The building had a mailbox area in the lobby and a storage space on the fourth floor. Before the locker installation, delivery couriers usually left packages in the building lobby and/or walked throughout the building and went to different floors to make doorstep deliveries. The resident manager then picked up the packages left in the lobby and either took them to residents’ doorsteps or placed them in the fourth-floor storage space, if a resident were not home to receive their packages.
In early June 2020, we installed a four-tower parcel locker with eight large, 28 medium, and 19 small cells (Figure 2) in the building lobby, which started operating immediately. When installation was complete, residents were automatically registered in the locker operator’s system by the building management. Every time a resident received a package in the locker, they received a notification on their phone or by email, along with a temporary access code to enter on the locker’s digital keypad to retrieve their package.
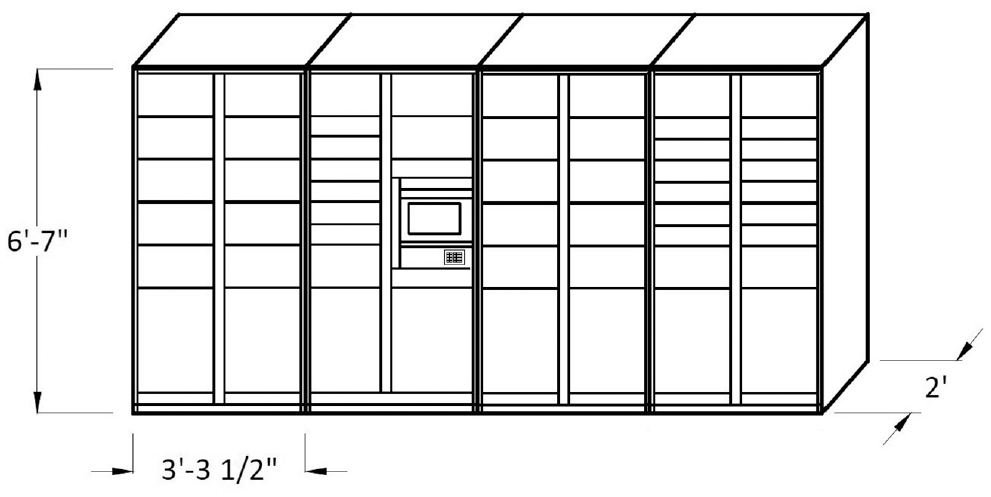
Schematic of the locker installed in the study building.
Carriers were also provided with a code to access the locker, which was communicated to them through the locker company’s carrier relations team. Instructions for carriers were also posted in the building lobby. Upon scanning the package and entering the carrier access code on the locker digital keypad, the locker would show the available cells, and the delivery courier could choose a cell with an appropriate size to open and place the package inside it. Couriers were instructed not to place a package that could fit into a small or medium cell into a large cell to keep the few large cells available for bigger packages. Cells were about 1.5 ft wide and 2 ft deep, and the heights of the small, medium, and large cells were respectively about 5, 10, and 25 in.
Data Collection
The data for this study were provided by the locker operator company. For every package received in the locker, the locker recorded unique identifiers and timestamps for the carrier that dropped it off and for the user who picked it up. We received 7 months of anonymized locker usage data, from June to December 2020. For each individual package delivery, the data consisted of the carrier, the anonymized user identifier, the locker cell in which the package was placed, and two timestamps for when the package was placed in the locker by the carrier and when the package was picked up by the user.
We cleaned the dataset to remove test deliveries from the locker setup process and duplicate entries. We derived the package size from the cell number and calculated time-to-pickup (the amount of time the package was left in the locker) from the pickup and delivery timestamps. The final dataset used for the analysis consisted of deliveries from June 5 to December 31, 2020. Packages were also grouped into delivery batches by considering all packages that arrived from the same carrier within 5 min of one another in the locker as one delivery batch. The first week of deliveries was not included, to give residents and carriers some time to adapt to the locker system.
Estimation of Delivery and Pickup Patterns
Key information for modeling the process of locker delivery and pickup (and eventually for finding the right locker size) is the number and frequency of packages that are delivered to the building. However, most urban planners or building managers begin their planning knowing only the number of users, not the distribution of package deliveries.
We performed an empirical analysis on the locker usage dataset, which is presented in the next section, “Package Delivery and Pickup Patterns,” to understand the online shopping delivery and pickup patterns and to determine input values for the simulation model.
Simulation Framework
We used discrete event simulation with the queuing theory concept to model the process of locker delivery and pickup. Queuing theory can be applied to model random arrival processes, such as customer requests to a call center or help desk ( 14 ). Servers can accommodate one request at a time, or more if they have additional capacity. After arriving, each customer waits in a queue until a server becomes available. Once a server becomes available, customers are served for a random length of time before exiting the system. In this study, package deliveries represent request arrivals, servers are defined as individual cells in the locker, and service time is set based on the users’ time-to-pickup.
A key assumption behind the queuing theory concept is the “forgetfulness property,” stating that customers arrive randomly, and each arrival is not affected by previous arrivals. The forgetfulness property applies to locker operation because the probability of a package arriving in the locker does not depend on the time that the last package arrived. Similarly, the service time (the amount of time the package was inside the locker) is determined by the behavior of individual residents and does not depend on previous states of the locker.
Locker performance can be measured by two metrics: locker occupancy rate and number of excess packages. Locker occupancy rate is the percentage of locker cells that are occupied and is averaged across hours of simulation. Excess (or rejected) packages represents the number of delivered packages that exceeded the locker capacity and had to be left in the lobby.
High locker occupancy rates increase the chances of a package being rejected, and packages left outside the locker substantially increase the building manager’s workload and confuse and inconvenience users. Building managers, therefore, would like to maintain a low locker occupancy rate and limit the excess packages to keep the lobby from overflowing with packages as much as possible. However, the locker also takes up space in the lobby, and a larger locker is more expensive, more difficult to install, and unappealing to residents. To find the right size and configuration for the locker, we aimed at minimizing the locker size while capping the locker occupancy rate and the number of excess packages. The simulation setting and inputs are described in the fourth section.
Package Delivery and Pickup Patterns
The data for this study were provided by the locker operator company. We assumed that no package was left outside the locker, and therefore, in the following, the number of packages delivered to the locker is considered equal to the number of packages delivered to the building.
Deliveries to the Building
Table 1 shows summary statistics on deliveries to the building during weekdays and weekends for the study period. On average, couriers dropped off 3.5 packages every time they visited the building. Weekend deliveries accounted for a small percentage (19%) of all deliveries.
Summary Statistics on Package Deliveries to the Building During the Study Period
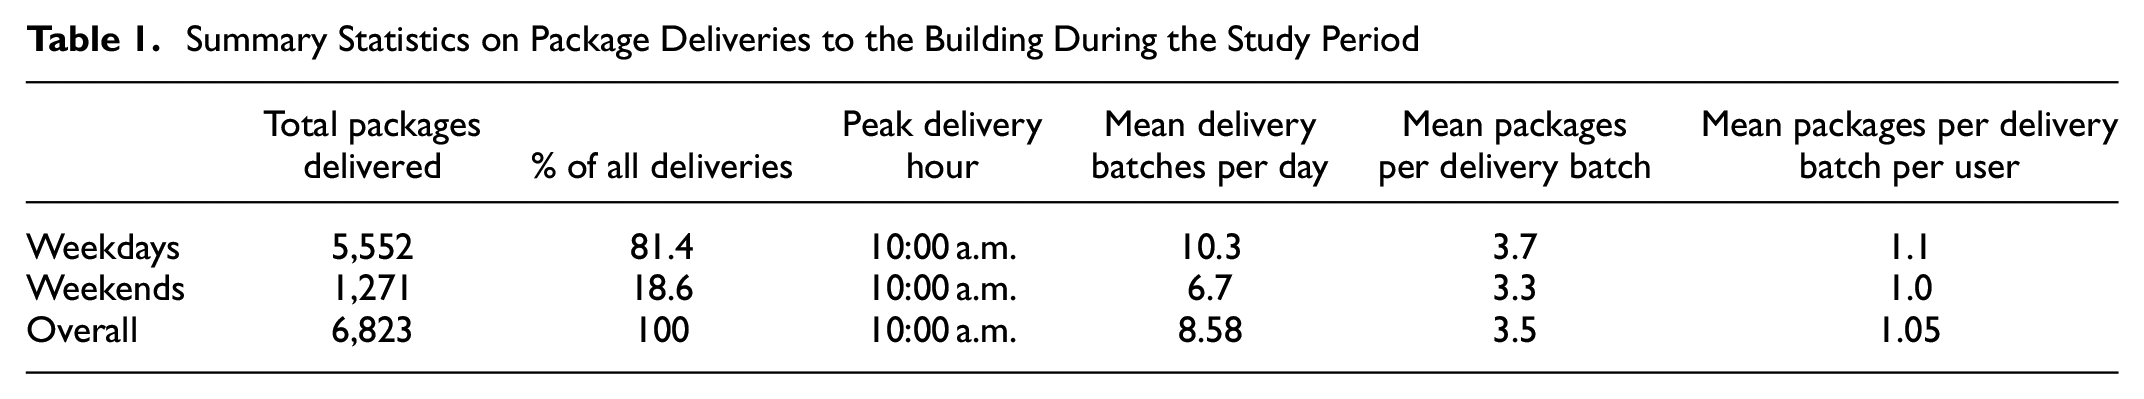
Figure 3 shows the average number of packages delivered and picked up during the day for each month of the study. Package deliveries increased considerably during the fall and winter seasons: the average number of packages delivered per day almost doubled between June and December (increased from 23.9 in June to 46.1 in December). The peak delivery hours for the building were between 9:00 and 11:00 a.m., although this window widened when moving into the busy holiday season.
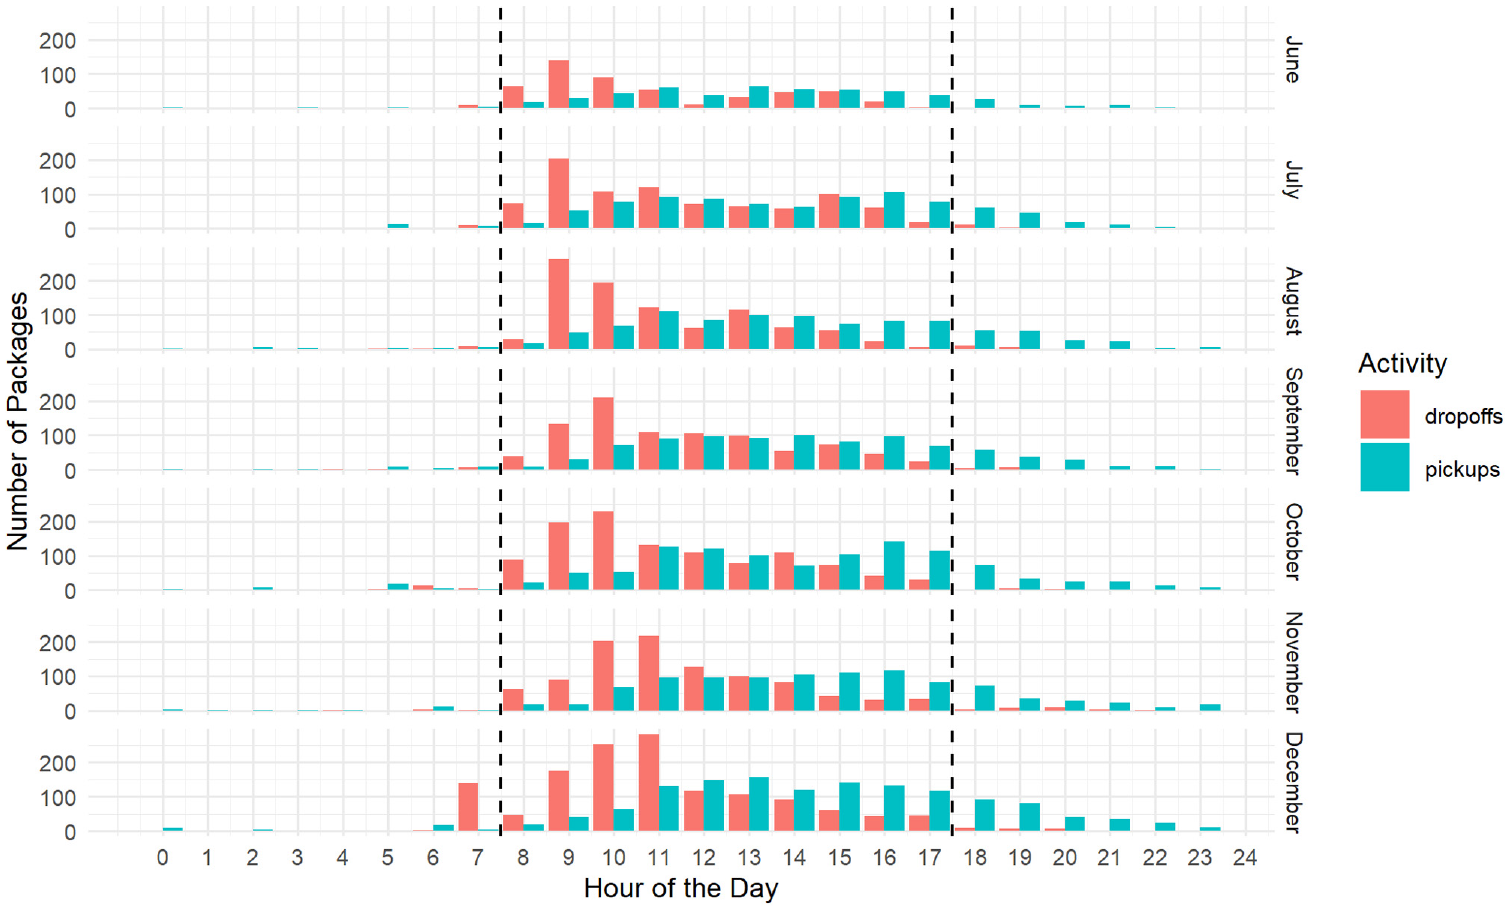
Average number of packages delivered and picked up during the day for each month of the study.
Volume and Frequency of Online Orders
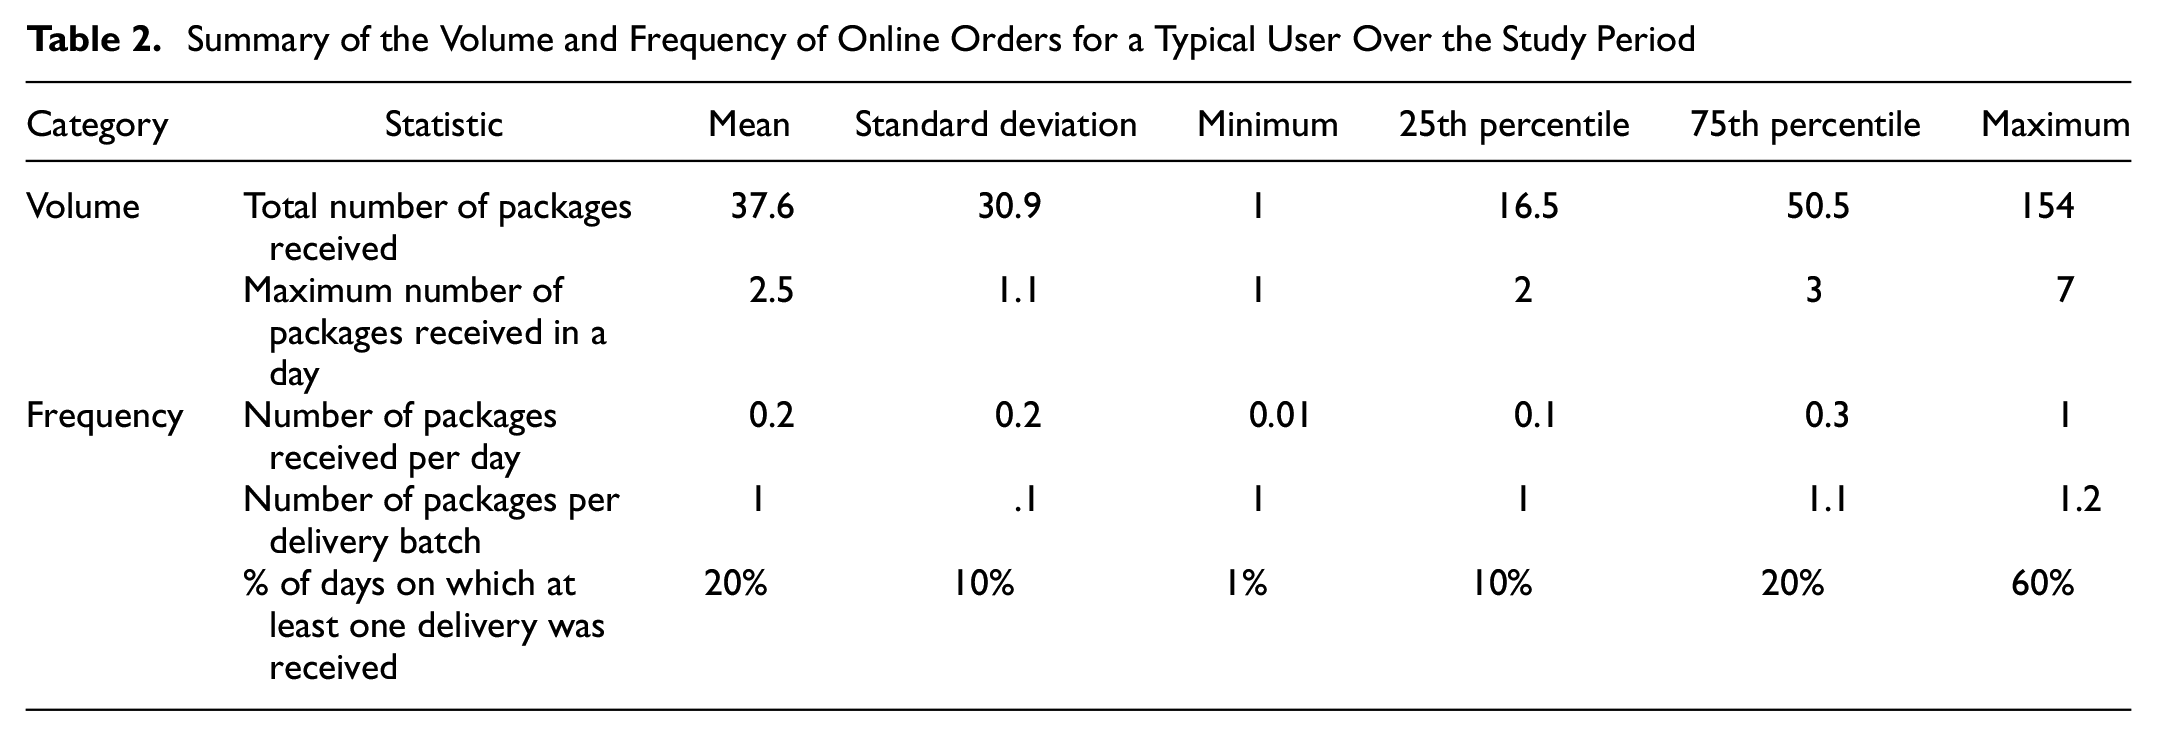
Over the 7 months of the study, residents received a total of 6,823 packages. Table 2 summarizes the volume and frequency of orders for a typical user. A typical user received 38 packages throughout the 209 days observed, one package every 5.5 days. On average, users ordered 47% small, 38% medium, and 13% large packages. Nearly all users received only a single package per delivery batch.
Summary of the Volume and Frequency of Online Orders for a Typical User Over the Study Period
We also modeled the time series of deliveries as the sum of a trend component, cyclical seasonal component, and random noise. Daily package delivery trends separated into trend and weekly seasonal components are shown in Figure 4. We observed a steady positive trend in the overall number of deliveries from summer to winter, consistent with seasonal e-commerce shopping patterns, which peak sharply in late November to mid December (the U.S. holiday season). Deliveries also followed a weekly cycle—consistent throughout weekdays, but with a sharp drop on weekends.
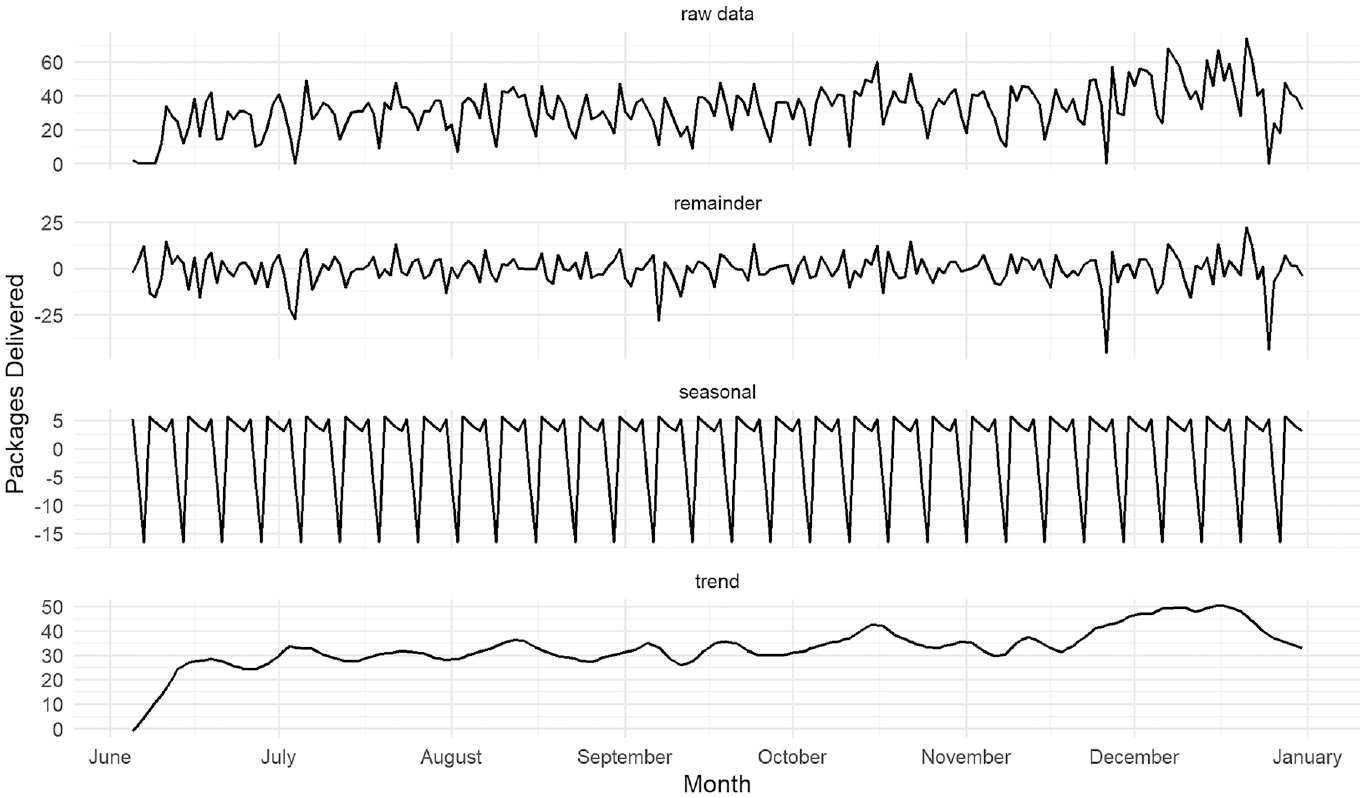
Trends in daily package deliveries to the building.
Time-to-Pickup
Users picked up packages throughout the day until late evening. Figure 5 shows the cumulative distribution function for time-to-pickup. The median time-to-pickup was 4.2 h, but the mean was 12.5 h, reflecting a right-skewed distribution; 84% of pickups happened within 24 h of delivery. The increased work-from-home behavior during the COVID-19 pandemic might have reduced time-to-pickup, as more people were likely at home during business hours to pick up their packages from the locker.
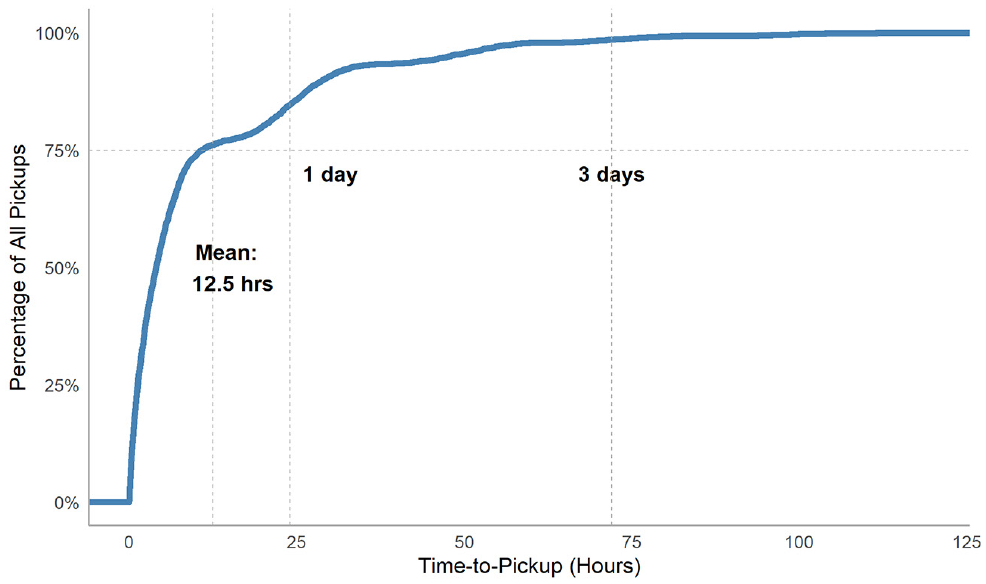
Empirical cumulative distribution function for time-to-pickup.
There was no limit for how long packages can stay in the locker, nor a late-pickup penalty for residents. However, nearly all (99%) orders were picked up within one week of delivery. Residents took longer to pick up orders on weekends and during the fall and winter seasons: the average time-to-pickup increased by 19% from June to December. We also observed a few instances of very long time-to-pickup (up to 54 days) in fall that likely occurred because of vacations or other absences.
Locker Occupancy
Figure 6 shows the time series plot for the locker occupancy rate (average percentage of locker cells that are occupied). The occupancy rate increased in the fall holidays (Halloween, Thanksgiving, and Christmas) with a peak on December 12 at 51%, which is more than four times the average occupancy rate in June (12%). The increased occupancy rate was mostly the result of increased deliveries, but also in part due to longer time-to-pickup (perhaps as a result of residents being away for the holidays). Although occupancy rate varied dramatically from week to week, it did not change much on different days within the same week—we observed only 2% to 4% variation in occupancy rate between weekdays.
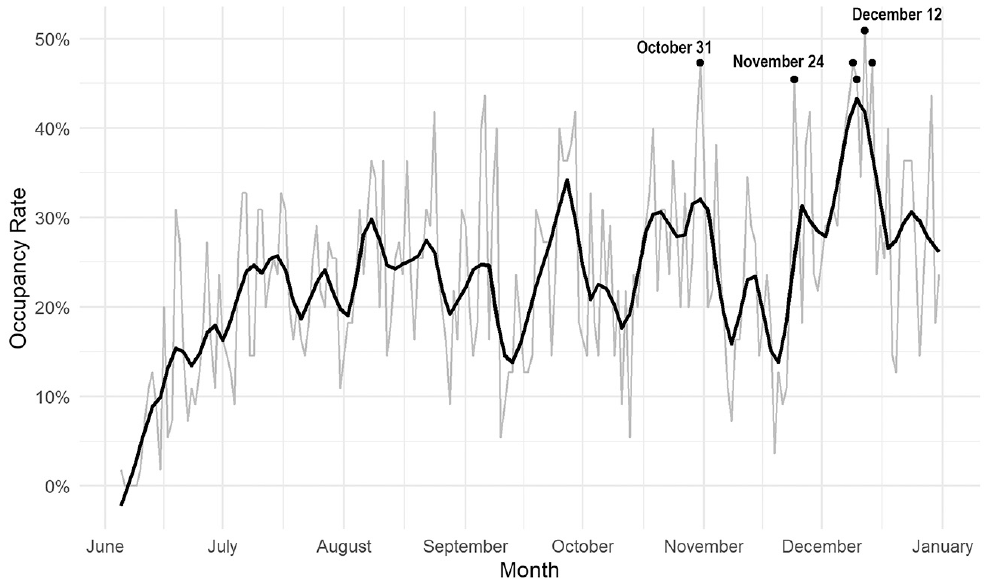
Trends in the locker occupancy rate during the study period.
Package Order Demand Estimation
To find the mean number of packages per delivery batch at the building, we developed the following equation using the locker usage data. As noted in Table 2, the mean number of packages (pckg) received per day for a typical user is 0.2, and Table 1 presented the mean number of delivery batches per day as 8.58.
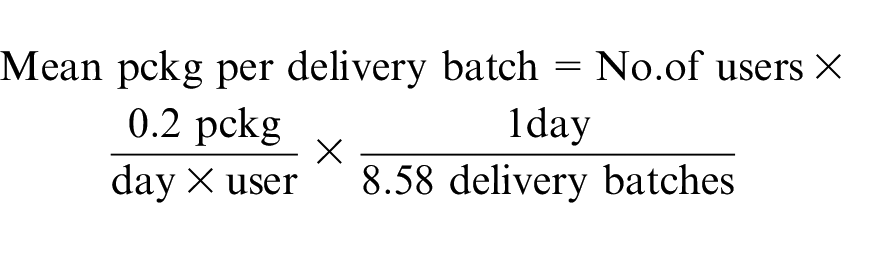
This equation can be used for urban residential buildings with a population similar to that of the study building. It assumes that as population increases, the relative demand for different package sizes would remain the same, and that the delivery rate would not change; i.e. large carriers have fixed routes and would economize on fuel and labor costs by bundling more packages within each delivery batch.
Simulation Setting and Inputs
We used discrete event simulation and applied the queuing theory concept to model the process of locker delivery and pickup. The simulation is implemented in the R programming language using the Simmer package ( 15 ). The setting and inputs of the simulation model are described in the following subsections.
Timeframe and Simulation Length
Delivery demand at the building fluctuated significantly throughout the study period because of seasonal ordering patterns. For this reason, we narrowed the simulation time period to September 1 through November 30, during which time the locker experienced relatively consistent and high demand.
To allow for packages that remained in the locker at the end of a day and affected the locker occupancy on the following day, we modeled an entire business week (5 days). Weekends were excluded from the simulation because of their much lower demand. Deliveries were set to arrive randomly from 8:00 a.m. to 6:00 p.m. After 6:00 p.m., deliveries stopped, but pickups continued according to the distribution of time-to-pickup. The following day, deliveries resumed.
Simulation Inputs
The key input parameters in a queuing model are: number of servers, server capacity, service time, arrival rate, and allowed queue length.
The locker delivery process for each day is modeled with three servers, representing the three locker cell sizes (small, medium, and large). The capacity of each server is set equal to the number of cells of that size (large = 8, medium = 28, and small = 19). Based on the instructions given to couriers about placing packages in cells with appropriate sizes (see “Locker Installation” subsection above), we assumed that small packages are allowed in small and medium cells, medium-sized packages may be placed in medium or large cells, and large packages could only be placed in large cells. The allowed queue length is set to zero, indicating that if a package encountered a server at full capacity (i.e., no locker cell with an appropriate size was available at the time of delivery), the package would be rejected by the locker and left in the lobby.
The package arrival rate is defined as a combination of delivery batch arrival rate and number of packages per delivery batch. Packages arrive in delivery batches according to a zero-truncated Poisson distribution (mean = 3.8 package and standard deviation = 3.2 package). The distribution of package sizes is considered to be: 50% small, 40% medium, and 10% large, following the distribution observed in the locker usage data. The delivery batch interarrival time distribution is defined as an exponential distribution (mean = 43.7 min and standard deviation = 53.1 min), which is derived from the average number of packages arriving per minute at the study building. Time-to-pickup also has an exponential distribution (mean = 10.96 h and standard deviation = 16.37 h), and the rate for the service time is set to the inverse of time-to-pickup. Delivery interarrival time and time-to-pickup distributions are determined using empirical distributions from the locker usage data for the selected time period (September–November).
Decision Framework
Our two performance criteria for accepting a locker system are the locker occupancy rate and the number of excess packages. Based on the discussion with the building managers, we set the maximum average locker occupancy rate to 60%, and the maximum number of excess packages in a week to five.
The smallest locker size (the one with the least number of towers) that satisfies these requirements would be a suitable locker for the building. Among the same-size lockers that meet the requirements, the one with lower occupancy rate and fewer excess packages is preferred.
Results
Candidate Locker Configurations
Locker companies usually offer a modular system of towers. The locker system can be modified to achieve the desired configuration by (i) changing the overall size through adding or removing towers, and/or (ii) swapping towers for others with a different combination of small, medium, and large cells.
Not every configuration is possible though. The locker provider companies have a set of fixed tower configurations, and every locker system needs to have a tower with a control unit in it. Having consulted with the locker provider company to our study building, we identified six configurations with three, four, and five towers that are commonly used in residential buildings as candidate configurations to be tested. The six candidate configurations are presented in the following subsection.
Simulation Results
Table 3 presents the results of simulation runs for the six tested configurations. Each simulation scenario was run 10 times and the results are averaged across the runs.
Simulation Results for Candidate Locker Configurations
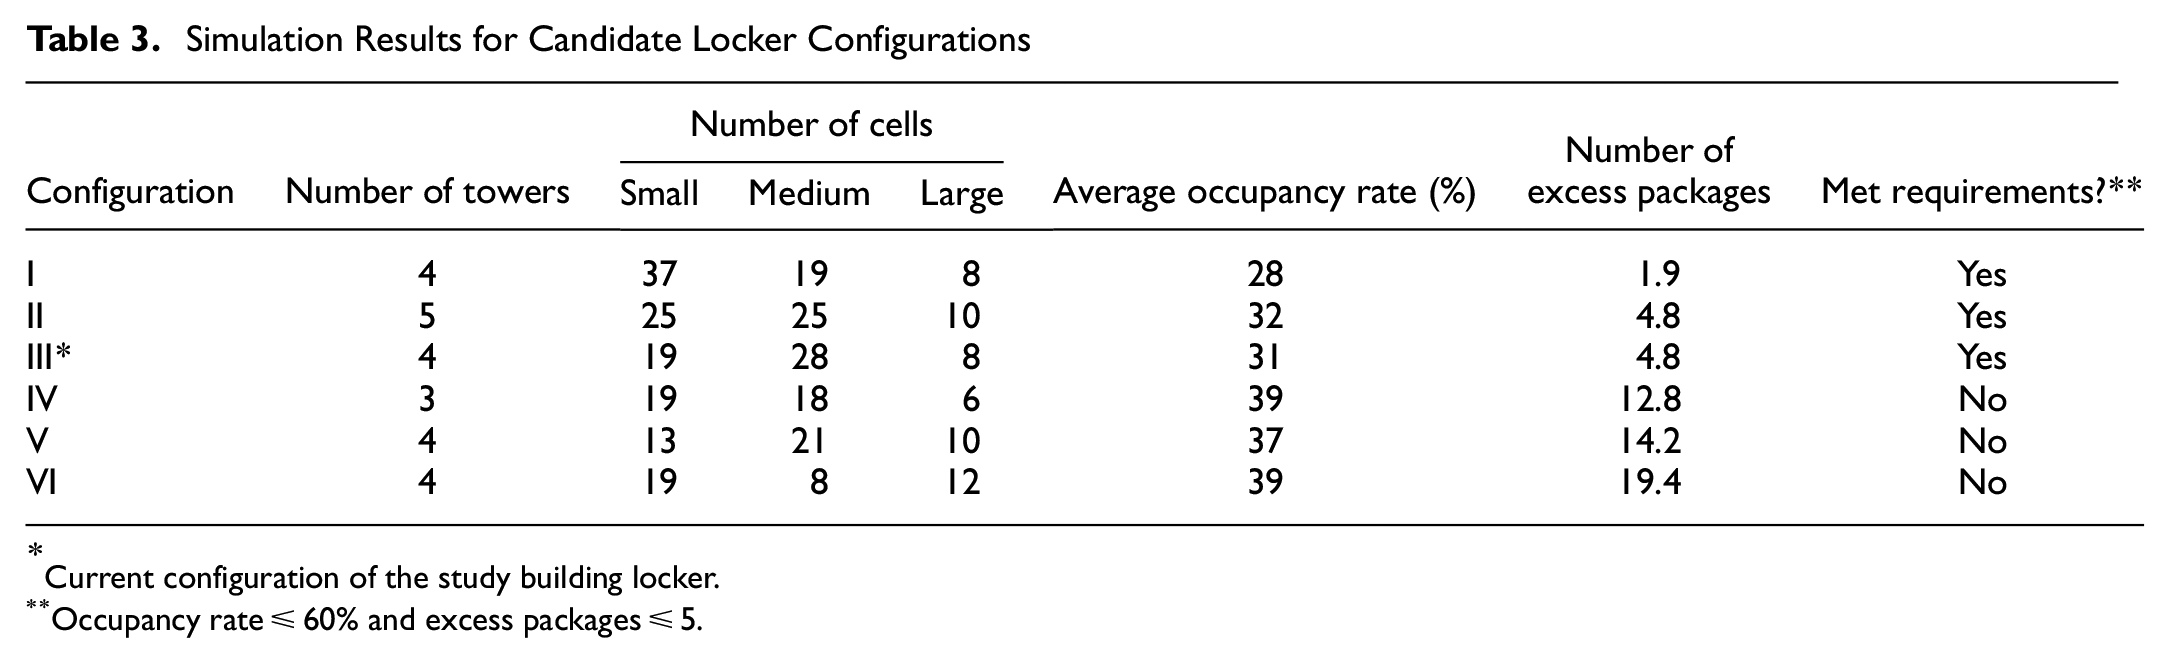
Current configuration of the study building locker.
Occupancy rate ≤ 60% and excess packages ≤ 5.
All lockers met the occupancy rate requirement, but only four- and five-tower lockers with more small and medium cells (Configurations I, II, and III) kept the number of excess packages below the set threshold. Those that did not meet the excess package requirement, were either too small (Configuration IV with three towers), or allocated too much space to large cells (Configurations V and VI).
Among the three configurations that met both requirements, the current configuration (Configuration III) and Configuration I, which have four towers, are preferred over the five-tower Configuration II, because they are smaller and thus have a lower cost and require less space in the building. The current configuration proved to be well suited to the building demand; however, Configuration I is slightly preferred because it would result in a lower occupancy rate and fewer excess packages.
Sensitivity Analysis
To test the impacts of changing the simulation parameter values on the results, we performed a sensitivity analysis on the locker occupancy rate with respect to three key input parameters: packages per delivery batch, delivery batch interarrival time, and time-to-pickup. Changes in the number of packages per delivery batch happen because of changes in the number of users or changes in the number of packages per user; changes in delivery batch interarrival times reflect changes in delivery batch frequency; and changes in the average time-to-pickup are an indication of how long packages remain in the locker. Each parameter was varied in steps of 20%, between −40% and +40% of its set value. For each parameter change, all other parameters were held constant, and the corresponding locker occupancy rate was recorded.
The sensitivity analysis results are shown in Figure 7. The slope of each line indicates the change in the occupancy rate given a corresponding change in a parameter value, and represents the relative sensitivity of the locker occupancy rate to that parameter. The results show that increased time between delivery arrivals (i.e., reduced delivery frequency) has a similar effect on the locker occupancy rate as reduced number of packages per delivery batch (fewer users or fewer packages per user) or reduced time-to-pickup, by the same proportion.
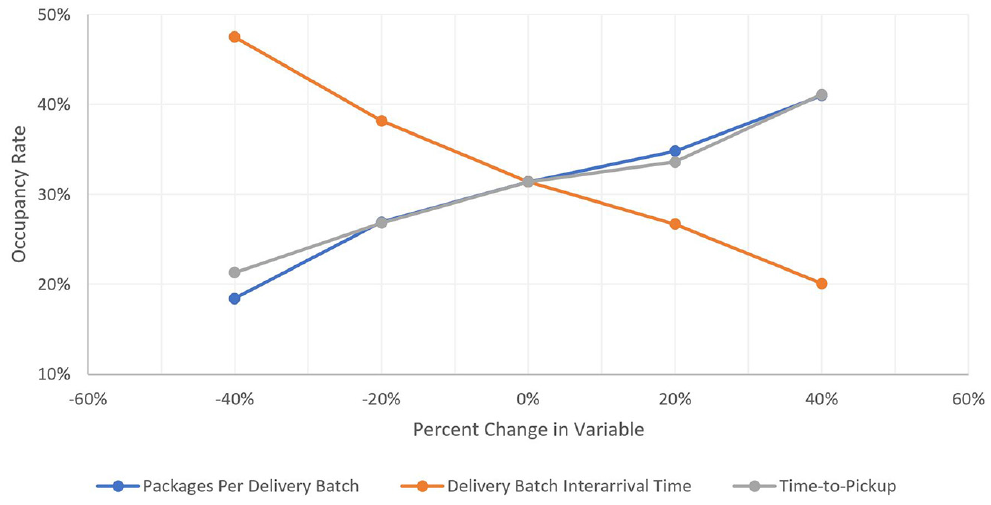
Sensitivity analysis results for the locker occupancy rate for the key simulation input parameters.
Figure 8 shows a direct sensitivity analysis for the number of users, and provides a more detailed view of how the resident population affects the locker occupancy. Since we kept the package delivery rate the same across simulation runs, the daily patterns are roughly the same, with occupancy rate peaking during peak delivery hours in the day and dropping at night as residents pick up their packages. The locker does not approach occupancy rates of higher than 80% until there are 250 users (about double the current number of users). This suggests the current locker can accommodate some additional demand during the peak delivery season.
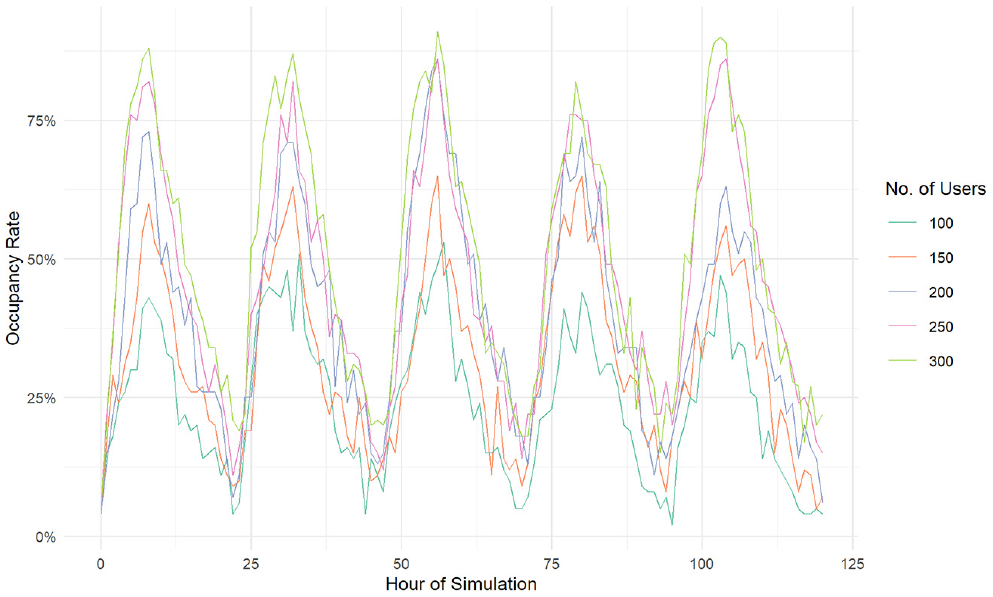
Variations in the locker occupancy rate during one week of simulation, given different numbers of users. Occupancy peaks during the day and declines at night when deliveries cease.
Discussion and Conclusions
This study aimed at finding the right size and configuration for a residential building locker that suits the needs of residents and building managers. We installed a common-carrier parcel locker in a residential building in downtown Seattle, WA, U.S.A. Through collecting locker usage data from the locker provider company, we studied and quantified carriers’ delivery patterns and residents’ online shopping and package pickup behaviors.
Carriers' patterns of delivery to the building and residents’ online shopping behaviors were used to model the locker’s delivery and pickup process in the building. We tested several locker configurations through simulation to find the best option, which we defined as the smallest locker size that satisfies the occupancy rate and excess package requirements. In the simulation, the current locker configuration performed well, turning out to be the second best option, with the best configuration showing only a slightly better performance (a 3% lower occupancy rate and three fewer excess packages). The calculated occupancy rate and excess packages for the current configuration in the simulation model align with the feedback received from the building managers and the locker usage data. The building managers stated that, outside the holiday season when the building receives many deliveries, packages almost never overflowed into the lobby and the locker easily handled the demand. The locker usage data also showed average occupancy rates of 15% to 35%, which matches those found in the simulation runs.
It should be noted that we did not test every possible locker configuration in this study and limited our testing to the six predefined configurations that were commonly used by the locker provider company in residential buildings. Future studies can look into finding the optimal locker configuration by developing those configurations from scratch.
The satisfactory performance of the current locker shows that the building management picked the right configuration to suit the residents’ needs. This is perhaps because the resident manager used to handle most of the residents’ package deliveries before the locker installation, and had a correct understanding of the number and size of the packages residents usually ordered online. Initially, the locker company suggested a three-tower locker with a few large cells and an even distribution of medium and small cells for the building; but the building management deemed that insufficient and asked for a four-tower locker with more medium cells than small cells. The simulation showed that the number of excess packages can dramatically increase with only a minor alteration in the distribution of locker cell sizes, demonstrating the importance of choosing the right locker configuration.
It is critical for building managers and locker provider companies to collect information on residents’ online shopping behaviors before deciding on a locker size and configuration for a building. An interesting future research project could be to build models that estimate residents’ time-to-pickup and the number and frequency of online package orders based on their socio-economic characteristics. In this way, simulation inputs could be derived directly from information about the number and mix of the resident population, which can potentially be collected through a resident survey. This would make it easier for building managers and locker providers to find the right size and configuration for a prospective locker system in a building.
The sensitivity analysis showed that delivery consolidation (fewer deliveries to the building per day) and applying limits on time-to-pickup appear to be effective strategies for ensuring there is enough available space in the locker to meet online shopping demand at the building. While delivery consolidation is outside the control of building managers, they can influence time-to-pickup to maintain a successful locker performance. Strategies such as sending additional notifications during busy delivery periods to nudge residents to pick up their packages and/or applying a late-pickup penalty could result in a lower occupancy rate and higher turnover for the locker.
There is also a myriad of other factors that could influence the locker size. Technology and/or business innovations (e.g., devising a strategy to reduce package sizes, or developing a new delivery solution), public policies (e.g., applying a carbon tax), economic situations (e.g., pandemics or rising gas prices) or available resources (e.g., the space for placing the locker in the building), could all directly or indirectly affect the size of a locker.
Several assumptions were made to simplify the simulation model in this study, but future studies could relax those for more precise estimates. First, deliveries were assumed to arrive randomly, while in reality, delivery arrivals are in part systematically determined by carrier routes, which often follow similar patterns each day. Second, no attempt was made to distinguish between carriers, each of which drops off a different number of packages and arrives at different times in a day. Finally, the delivery batch arrival rate was assumed to remain constant as the number of residents increased, and only the number of packages per delivery batch varied with a change in the number of residents. However, in reality, the delivery batch arrival rate would also change, especially for services such as Amazon Prime that promise delivery in tight time windows. Future studies can look further into modeling interactions between the number of packages per delivery batch and delivery batch arrival rate.
Finally, it should be noted that this study was carried out during the COVID-19 pandemic. During this time, residential areas saw dramatic spikes in package deliveries, and times-to-pickup were likely shorter as more people were at home during business hours to pick up their packages. For this reason, some of the statistics and findings, such as the number of package deliveries per day or average time-to-pickup, should not be generalized to typical situations.
Footnotes
Acknowledgements
The authors would like to thank the management of the study building for participating in this study by allowing for and helping with the installation of the locker, as well as onboarding and training residents for using the locker. The authors also extend their thanks to the locker provider company for installing, operating, and maintaining the locker over the course of this study and for sharing the anonymized locker usage data with the research team.
Author Contributions
The authors confirm contribution to the paper as follows: study conception and design: A. Ranjbari, G. Dalla Chiara, A. Goodchild; data collection: C. Diehl, A. Ranjbari; analysis and interpretation of results: C. Diehl, A. Ranjbari, G. Dalla Chiara; draft manuscript preparation: A. Ranjbari, C. Diehl, G. Dalla Chiara. All authors reviewed the results and approved the final version of the manuscript.
Declaration of Conflicting Interests
The author(s) declared no potential conflicts of interest with respect to the research, authorship, and/or publication of this article.
Funding
The author(s) disclosed receipt of the following financial support for the research, authorship, and/or publication of this article: This material is based on work supported by the U.S. Department of Energy’s Office of Energy Efficiency and Renewable Energy (EERE) under the Award Number DE-EE0008462.
The views expressed in this paper do not necessarily represent the views of the U.S. Department of Energy or the United States Government.