
Abstract
This study analyzed New York Subway incident cases from 2019 to expand on the current understanding of subway train to human collisions. From the 263 incident cases available, 185 (70%) involved train to pedestrian contact. The fatality data were compared with published literature covering 1990 to 2007, showing reasonable agreement in age-, gender-, and borough distributions. The location of incidents was typically the station platform (84%). Four primary behaviors were exhibited by pedestrians before impact with the train. Jumping from the platform was the most common, followed by falling from the platform, walking along the tracks, and standing too close to the edge of the platform. A higher fatality rate was found for collisions that occurred at elevated stations (40%) compared with below-ground stations (27%). The two primary collision types were frontal- and side impact (on the train). The most common impact velocity was 40 to 48 km/h (25 to 30 mph). The most likely outcome of these interactions was a fatality (31%) with only 9% of subway–human interactions resulting in mild injuries. The data suggested that policies based on proactive countermeasures could reduce a significant portion of subway train–human collisions as the majority of preimpact activity occurred on the station platform. Further investigation into the difference in elevated and below-ground collisions may yield useful information, especially relating to the potential protection offered by the drainage trough. When simulating subway–human collisions for countermeasure design, equal consideration should be given to the three impact position types: standing, lying, and jumping.
Keywords
Large metropolitan cities have invested in urban subway systems to help tackle the challenges of high carbon emissions, high road traffic, and urban sprawl ( 1 ). The number of cities with operational subway systems increased from 50 in the 1970s to over 219 in 2019, with a global subway track length in excess of 15,000 km ( 2 ). With this increase in subway stock usage, ridership, and track length, an increase in subway-related injuries would be expected. Although there were a small number of assault cases in which pedestrians were pushed in front of a subway train, most incidents resulted from voluntary trespassing. This is reflected in the literature reporting on the increase in subway trespassing-related fatalities. Trespassing-related cases include both intentional (suicide/suicide attempts) and unintentional (accidental) subway train–human collisions. The mean annual number of suicidal acts on the London Underground system increased from 36 (1940 to 1949) to 94 (1980 to 1989) ( 3 ). The Toronto subway system reported a statistically significant increase in its subway suicides since 2013, with an average of 23 suicide incidents per year as of 2018 ( 4 ), but no details on impact velocity, impact position, final resting position, or train contact surfaces were presented.
One location with a relatively high number of such incidents is New York City (NYC). The NYC Subway system is one of the oldest and largest in the world, with 5.5 million daily passengers in 2019. There are 472 stations operating 24 h a day. Two primary papers offer insights into the nature of these incidents. The first ( 5 ) collected medical examiner records for all 668 NYC Subway-related fatalities from 1990 to 2003 (see Table 1). Between 1990 and 2003, the borough with the most frequent occurrence of NYC Subway-related fatalities was Manhattan (43.1%) and most cases involved males (84%), often in their late thirties or early forties (25.3%). For males, there are more cases of accidental fatalities whereas for females there are more cases of suicide. In total, suicide accounted for about half of NYC Subway train–human fatalities (51.4%) between 1990 and 2003.
1990 to 2003 New York City Fatality Data, N = 668
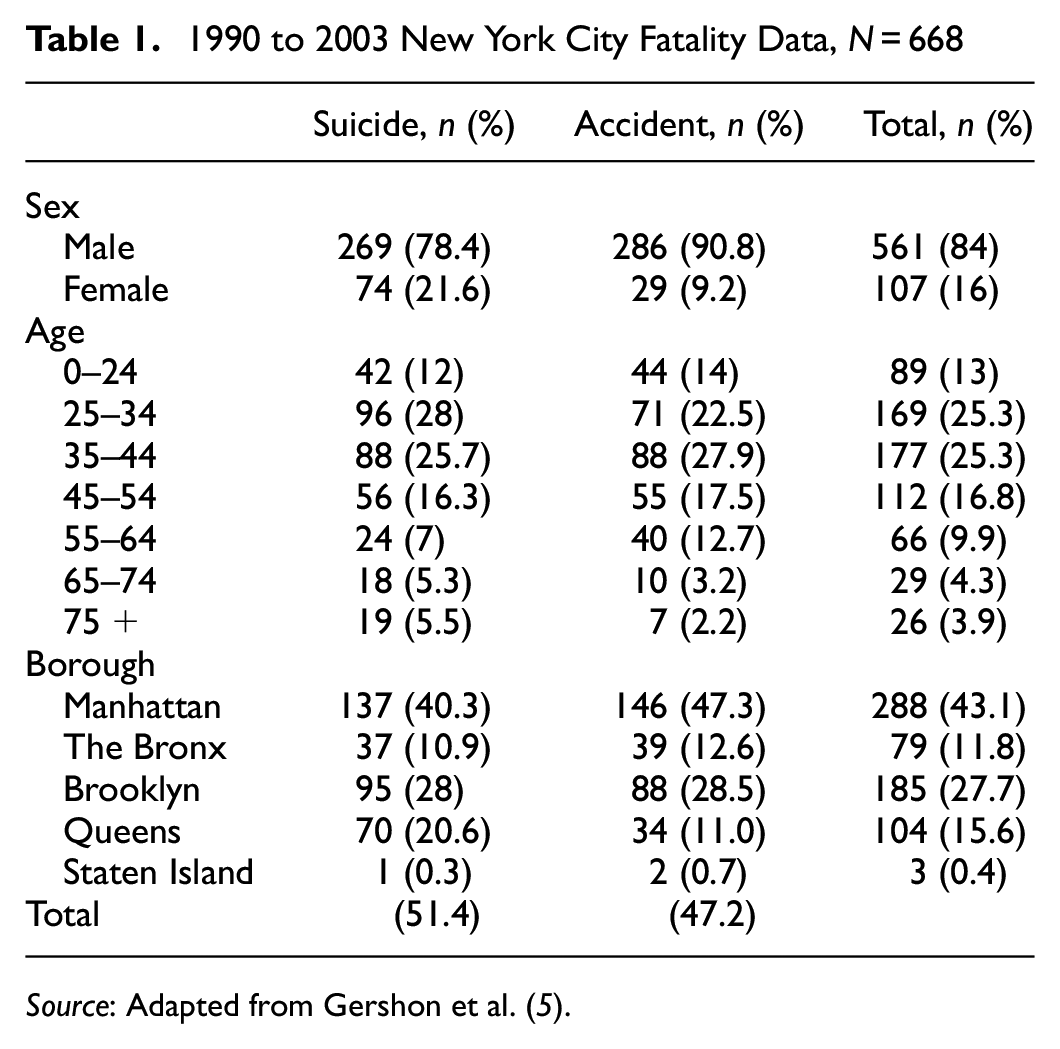
Source: Adapted from Gershon et al. ( 5 ).
The second paper ( 6 ), examined medical records for 211 NYC Subway-related fatalities between 2003 and 2007. Table 2 shows that between 2003 and 2007 the majority of both NYC Subway accidental (86%) and intentional (81%) fatalities involved males with an average age between 43 and 45. The authors distinguished between suicides and accidents using toxicology reports, witness statements, police reports, and autopsy reports for each case. The results showed very close agreement with the aforementioned paper ( 5 ), with suicide accounting for 52% of fatalities and accidents accounting for 36%. The remaining 12% of fatalities were categorized as “other” (not included in Table 2). Temporal data were collected, however no noticeable trends for month and day were observed. Incident rates do show a peak in accidental fatalities at 4:00 a.m., corresponding to the closing time of bars/nightclubs and reinforcing the conclusions of another study on rail-related deaths ( 7 ), which called for greater effort on the education of alcohol abuse to reduce rail-related deaths.
2003 to 2007 New York City Fatality Data, N = 211
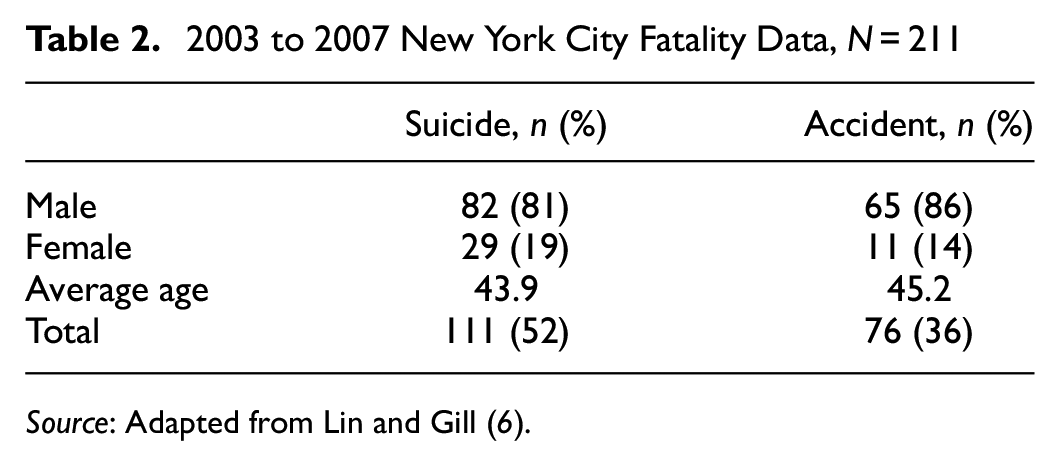
Source: Adapted from Lin and Gill ( 6 ).
It is thus clear that more effective safety measures are needed to combat the rising number of subway incidents. However, to effectively design such countermeasures, a more detailed understanding of the nature of subway collisions is required. The two aforementioned papers present the most up-to-date understanding of NYC Subway’s fatal incidents from 1990 to 2007. Since then, there has been a lack of published literature on NYC Subway incidents, and our understanding of existing subway collision configurations is therefore poor. Most importantly, little is known about the configuration of pedestrian subway collisions in any subway system. Previously published literature is limited only to fatal subway–human interactions.
As part of a collaborative research effort funded by the Federal Transit Administration and research team members, this study aimed to provide a current evaluation of NYC Subway incidents by updating the statistics in the literature and identifying details relevant to biomechanical modelling, such as train speed and pedestrian pre- and postcollision data. The aim is for the data presented in this paper to be suitable as a basis for future fatality-prevention policies and for the development of human–subway collision countermeasures.
Methodology and Data Collection
This study focused on the collection and evaluation of Public Transportation Safety Board case reports for 263 NYC Subway incidents for the year 2019. The NYC Subway system saw a 95% reduction in ridership in 2020 because of the COVID-19 pandemic. Since then, subway ridership has been slowly increasing, however, by June 2021 ridership had risen to only 30% of pre-COVID-19 levels ( 8 ). We considered 2019 data to be representative of an average year of NYC Subway incidents. This conclusion was supported by a review of 2018 NYC Subway incident data, which had a similar number of incidents and fatalities. In addition, the number of 2019 fatalities was similar to the average number of annual fatalities reported Gershon et al. ( 5 ) and Lin and Gill ( 6 ). Therefore the 2019 data were considered the most up-to-date NYC Subway data for a “typical” year. These case reports were supplied directly from the New York Metropolitan Transportation Authority. A total of 526 case reports detailing 263 incidents (i.e., two separate reports per incident) were collected and reviewed manually. Of these 263 incidents, 185 involved subway–human interactions, which were analyzed as part of this study. Ethical approval was granted by both Trinity College Dublin and The University of Virginia for the analysis of these data.
Two of the authors reviewed a sample of 10 cases and together selected 50 categories for data collection and evaluation based on the available comparable data recorded from the investigators in the case reports. As the purpose of this study was to aid in the design of safety equipment, these categories were chosen with consideration of biomechanical modeling for future countermeasure design evaluation. For example, it was decided that track elevation (elevated or below ground) was to be recorded. This information can be used to evaluate the effectiveness of equipment in different environments. Further examples of desired information categories include station name, train model, impact position, impact speed, and injury outcome. A full list of categories is shown in Appendix A. No medical examiner records were available for this study, owing to recent data protection restrictions.
Impact velocity was estimated using an event recorder, which was installed in 65 of the incident trains. This event recorder gives the velocity at the time the emergency brakes are activated. In most cases involving emergency brake activation, the train operator witnessed a pedestrian on the track in front of the train or in the act of jumping in front of the train, prompting brake activation. Owing to limited deceleration, the train generally slowed but did not stop before making contact with the pedestrian. This slow deceleration is to protect the occupants during emergency braking. The exact velocity at time of impact is unobtainable in many cases and therefore the event recorder speed at the time of emergency brake activation can be considered as an upper bound speed estimate.
Train surface contact region was reported based on evidence of human tissue or bodily fluids found on contact surfaces or from the subway train operator’s or other witness accounts. The final recorded rest position of the pedestrian was based on where the pedestrian was first found. A body found on the tracks by an oncoming train was coded “behind train.” The categorization of suicide or accident was determined using the train operator’s witness statement. The category “jumping in front of train” refers only to preimpact behavior and not the actual position of the pedestrian at the instant of impact. It is common for pedestrians to jump onto the tracks and change position before coming into contact with the train.
The cases contained a wide range of injuries from no-injury to fatality. The five-point injury scale known as KABCO, which is used by police to assign an injury metric in road traffic accidents, was applied ( 9 ). KABCO categorizes injuries as fatal (K), severe (A), moderate (B), minor (C), and none (O). A simplified injury categorization was also used for graphical purposes: fatalities were equated to K, injuries were equated to A and B, and no-injury was equated to C and O in reference to the KABCO scale.
The database was stored on an Excel spreadsheet. Two coders analyzed the case reports, which each coder assigned a subset of cases. Both coders then read each of their cases individually and extracted the desired information, inputting this into the Excel spreadsheet. Lists and drop-down menus were used when appropriate to reduce entry error. Two intercoder reliability tests showed above 98% agreement between the two coders.
Results
Literature Comparison
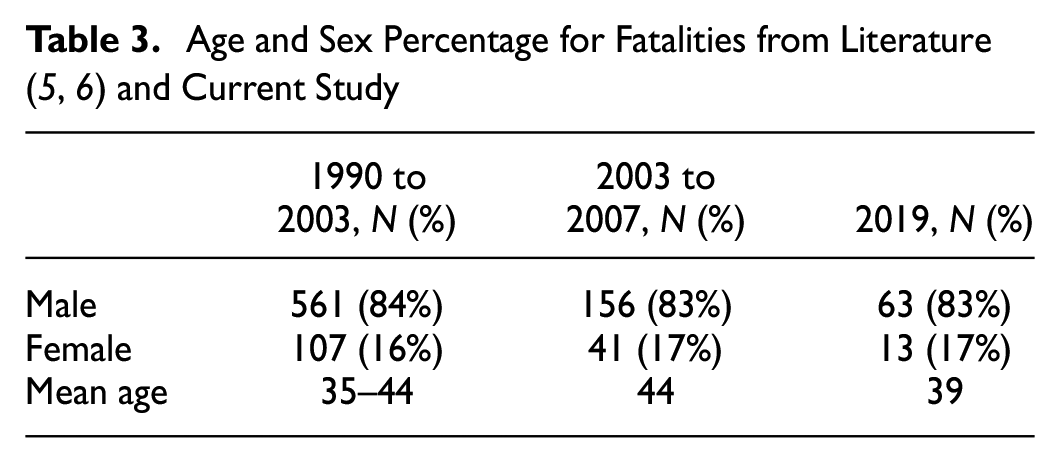
A total of 263 NYC Subway incident cases were made available for 2019. We first assessed whether the 2019 data showed similar trends to published findings. Figure 1 compares distributions of age and location for the 2019 data using the 1990 to 2003 data from Gershon et al. ( 5 ). Table 3 shows age and sex comparisons of the 2019 data to the 1990 to 2007 data ( 5 , 6 ). Both Figure 1 and Table 3 contain only fatal cases.
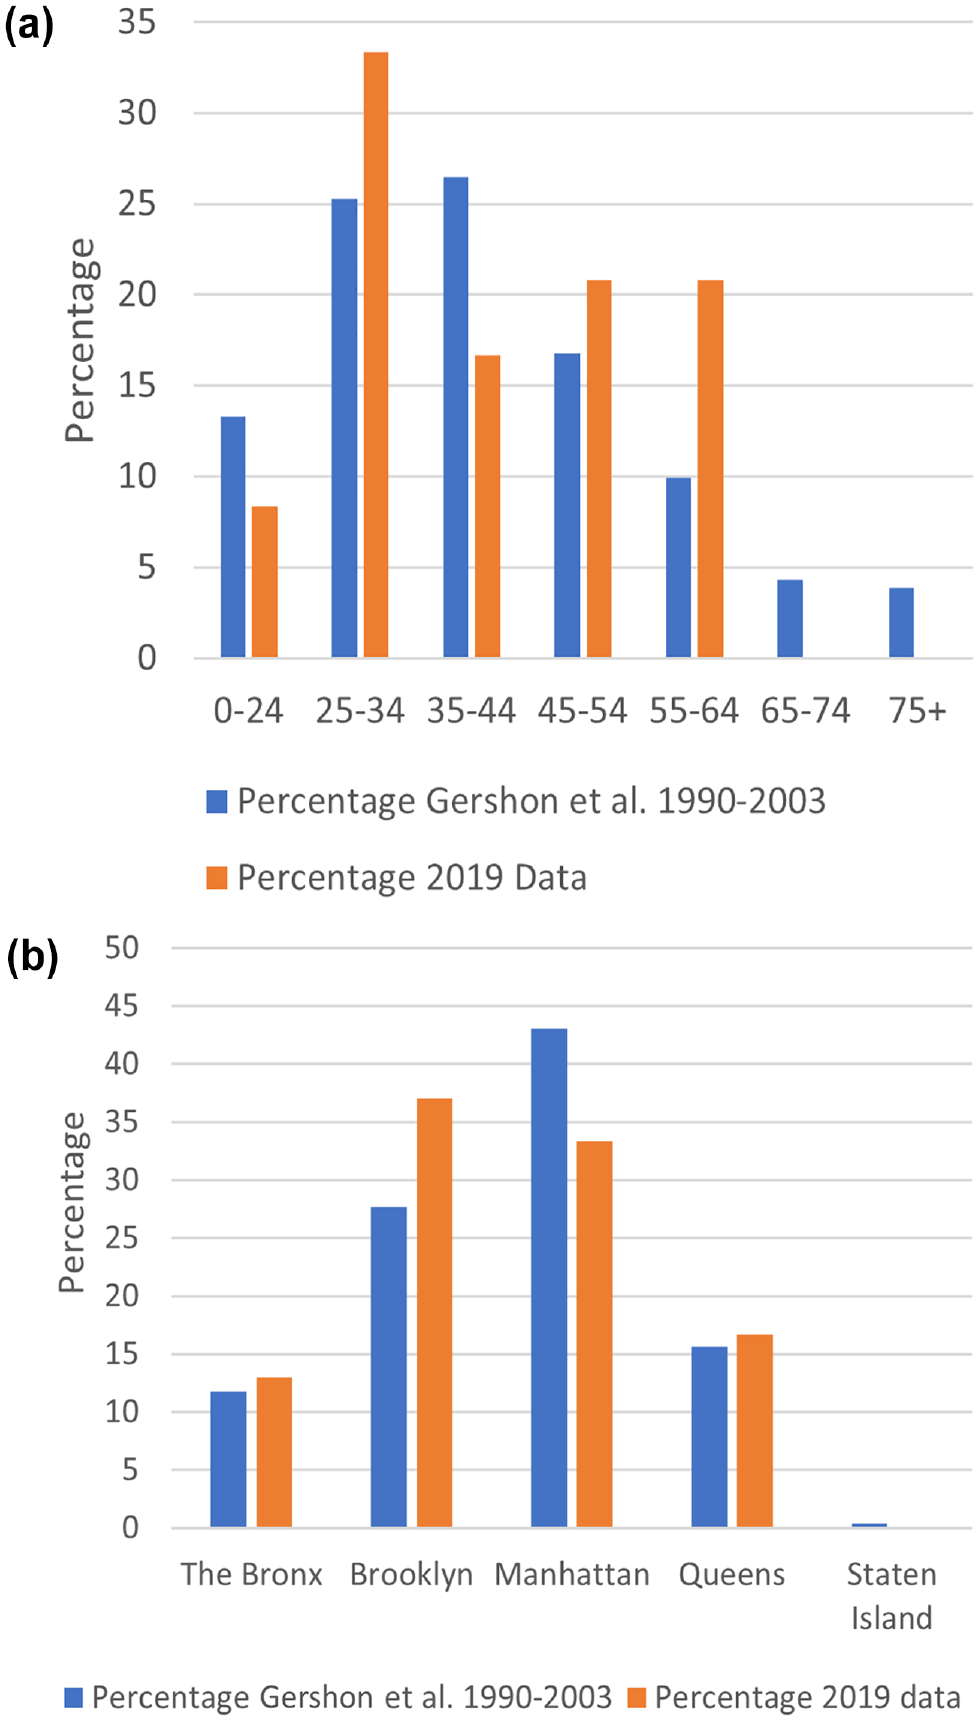
Fatality Data Comparison between [1] (N=668) and 2019 Data (N =54).
Event Type and Location
Of the 263 NYC Subway incident cases from 2019, 185 (70%) involved train to human contact. The remaining 30% related to falls (with no train contact), assaults, derailments, and other unrelated categories. Figure 2 shows the breakdown of accidental impacts (n = 106) and intentional impacts (suicide/suicide attempts n = 53) using the KABCO scale. A small number of cases were excluded from this comparison (n = 26) because the incidents did not fit within either category. Examples of the cases removed include homicides, undetermined, and assaults. The overall fatality rate was 29% with a further 41% of pedestrians presenting at the nearest hospital alive. Since medical records were not available it is unknown how many of those pedestrians recovered. The 2021 study by Ho et al. ( 4 ) found a mortality rate of 29% for patients who presented to the emergency department after a subway–human collision with a survival rate of 88% for those who survived the initial presentation. Thus, an overall estimated fatality rate of 31% is presented with the assumption that 12% of the severely injured (i.e., A on the KABCO scale) resulted in a fatality.
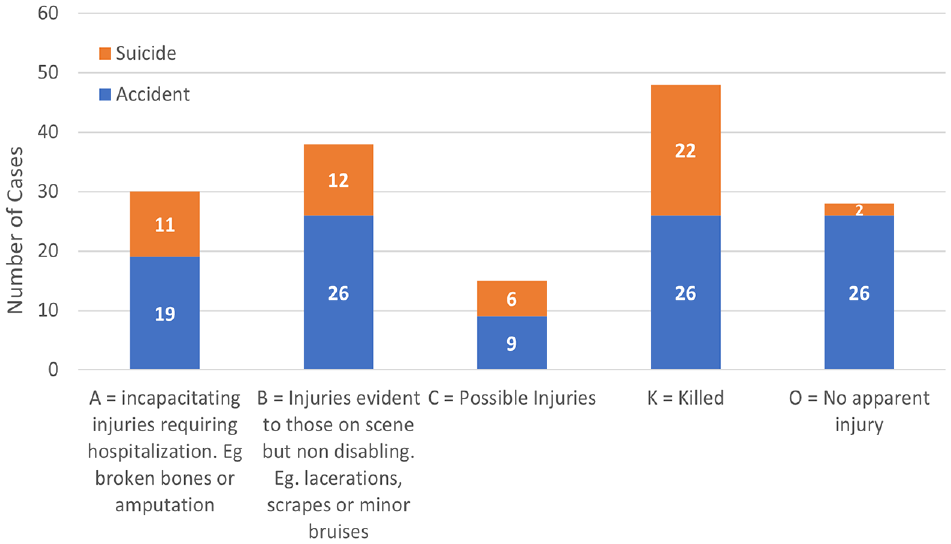
KABCO accident versus suicide for New York City Subway 2019, N = 159.
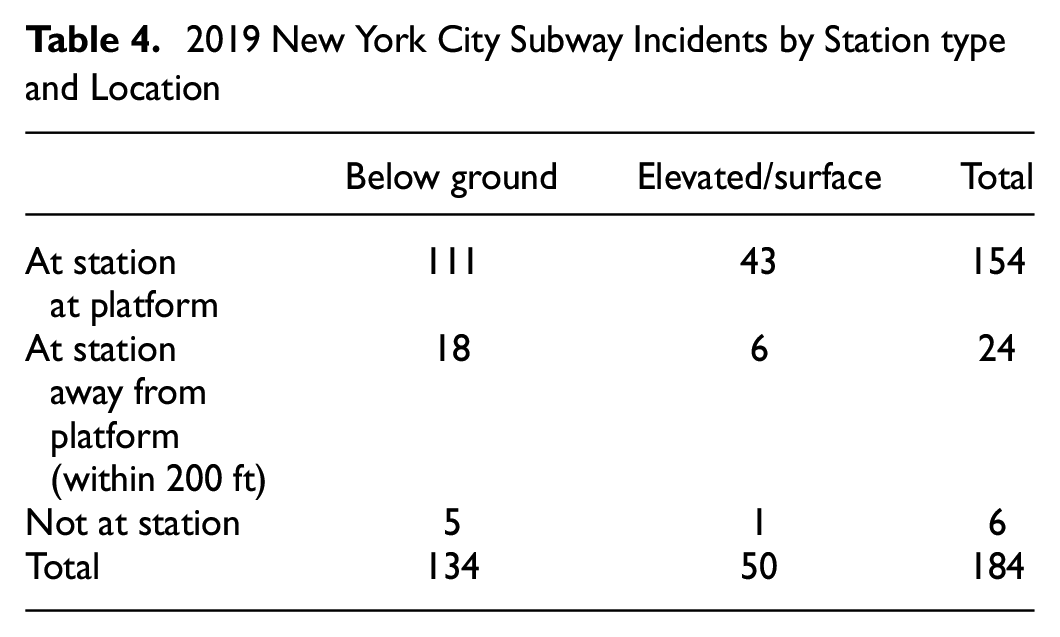
The NYC Subway has 472 stations, of which 283 (60%) are below ground, 149 (32%) are elevated, and the remaining 8% are a mix of surface/at-grade and embankments. Table 4 shows the breakdown of the NYC 2019 subway incident data in relation to track type (e.g., elevated/surface and below ground) and incident location relative to the station. Figure 3 shows a stacked representation of the KABCO categories with track type, showing a 40% fatality rate (19/48) for above-ground stations compared with a 27% fatality rate (35/130) for below-ground stations.
2019 New York City Subway Incidents by Station type and Location
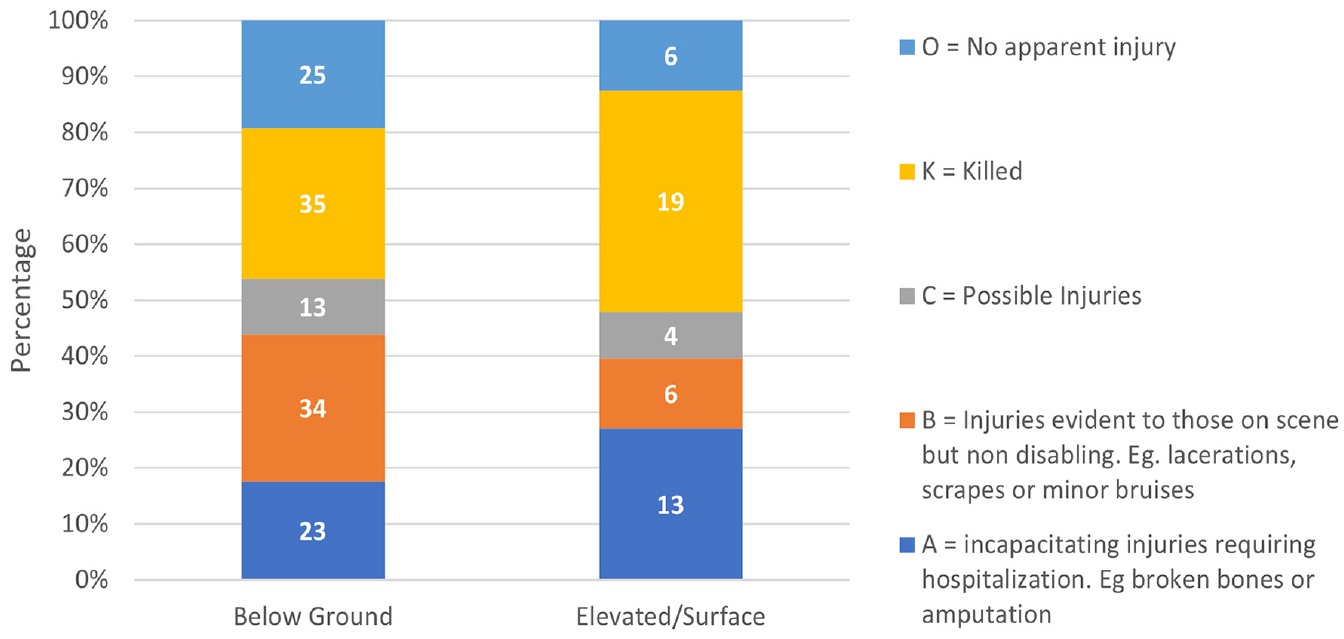
KABCO proportions versus track type for New York City Subway incidents 2019, N = 178.
Figure 3 shows that the fatality rate was 50% higher in an elevated station (40%) than in a below-ground station (27%). The train geometry and entry velocity were similar in both station types, however there was a significant difference in track geometry.
Impact Data
Figure 4 shows the most common types of preimpact behavior reported by the train operator and eyewitnesses.
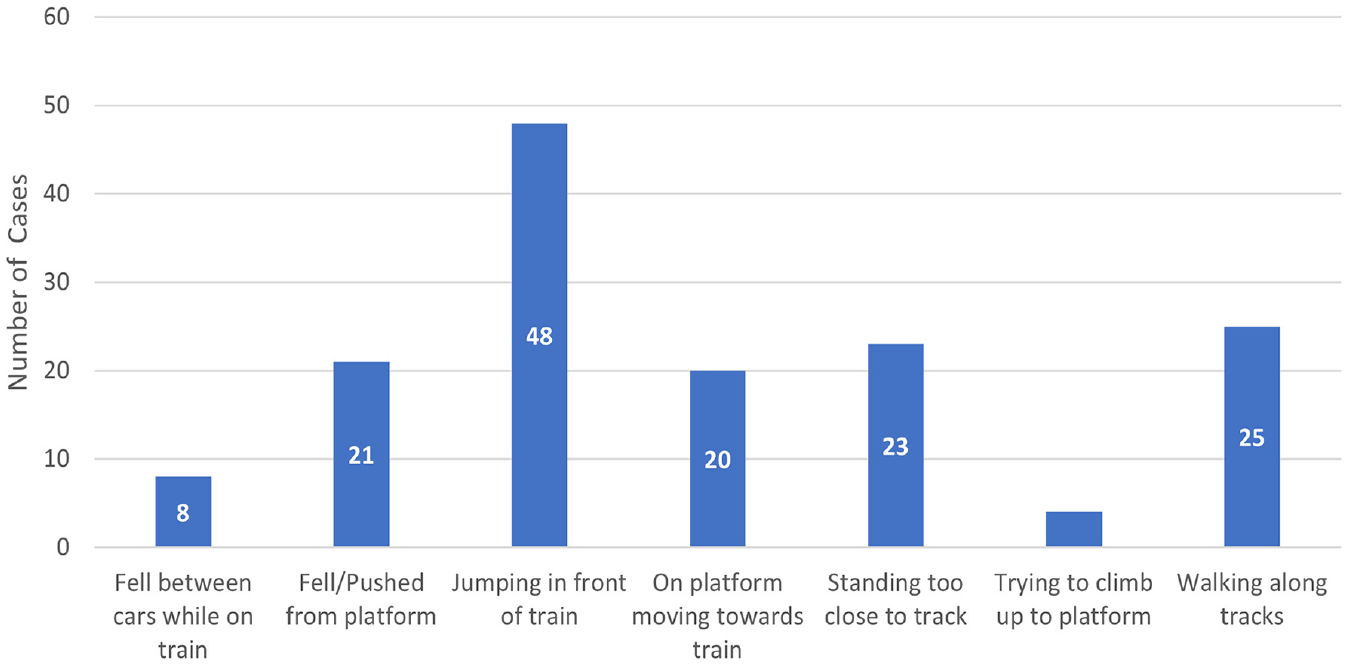
Preimpact behavior for New York City Subway incidents 2019, N = 159.
Figure 5 shows the impact positions of the pedestrians using the simplified injury categorization. Figure 6a shows the estimated impact velocity using the same simplified injury scale. Figure 6b shows the proportion of fatality/injury/no-injury outcomes as a function of estimated impact velocity (mph). Figure 7 shows the train surface contact area for primary impacts categorized according to the KABCO scale. Figure 8 shows the final position of the pedestrian in relation to the KABCO scale.
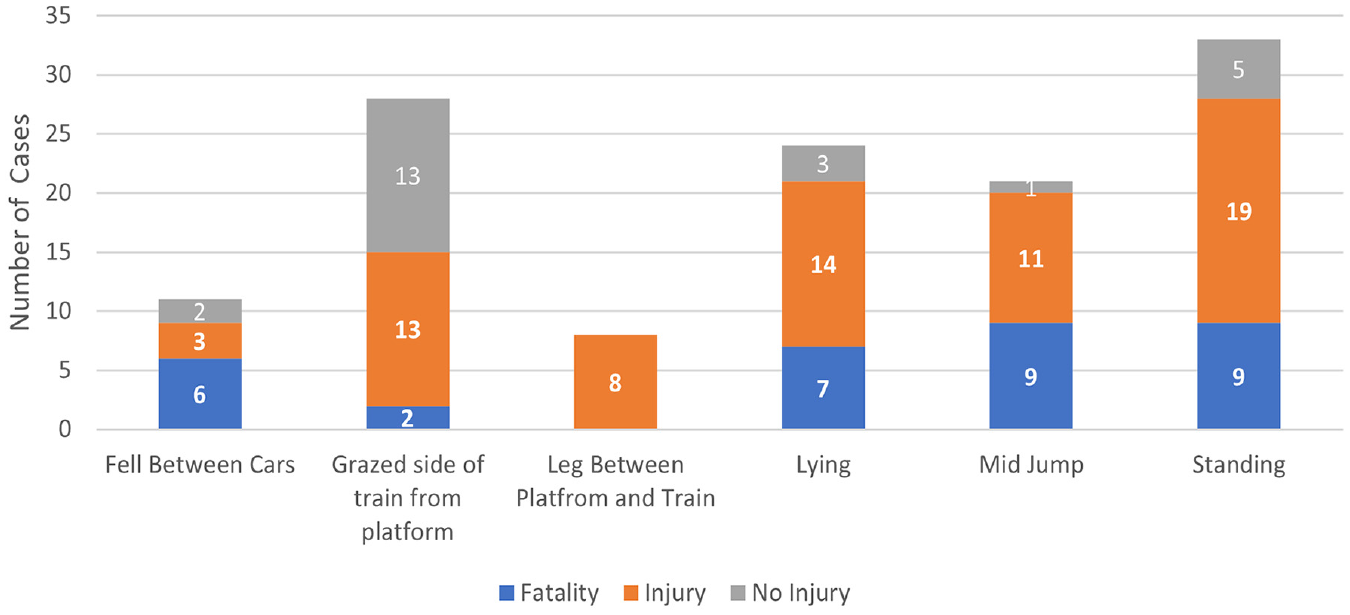
Impact position for New York City Subway incidents 2019, N = 125.
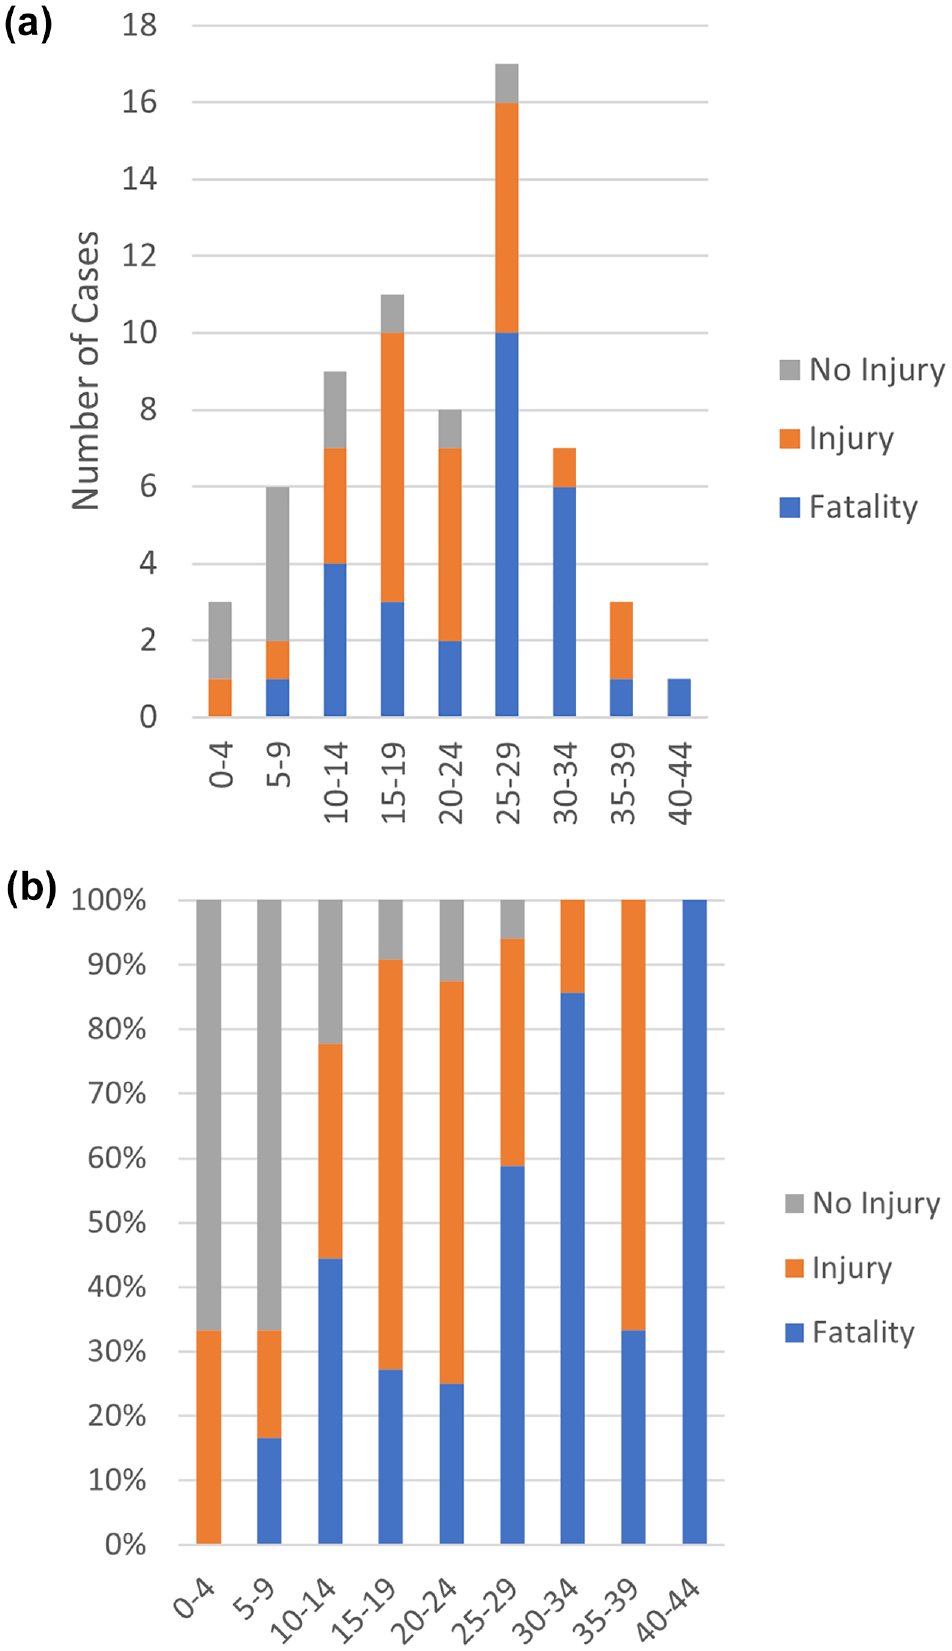
2019 New York City Subway data: (a) estimated impact velocity using the simplified injury scale, and (b) the proportion of fatality, injury, and no-injury outcomes as a function of estimated impact velocity, N = 65.
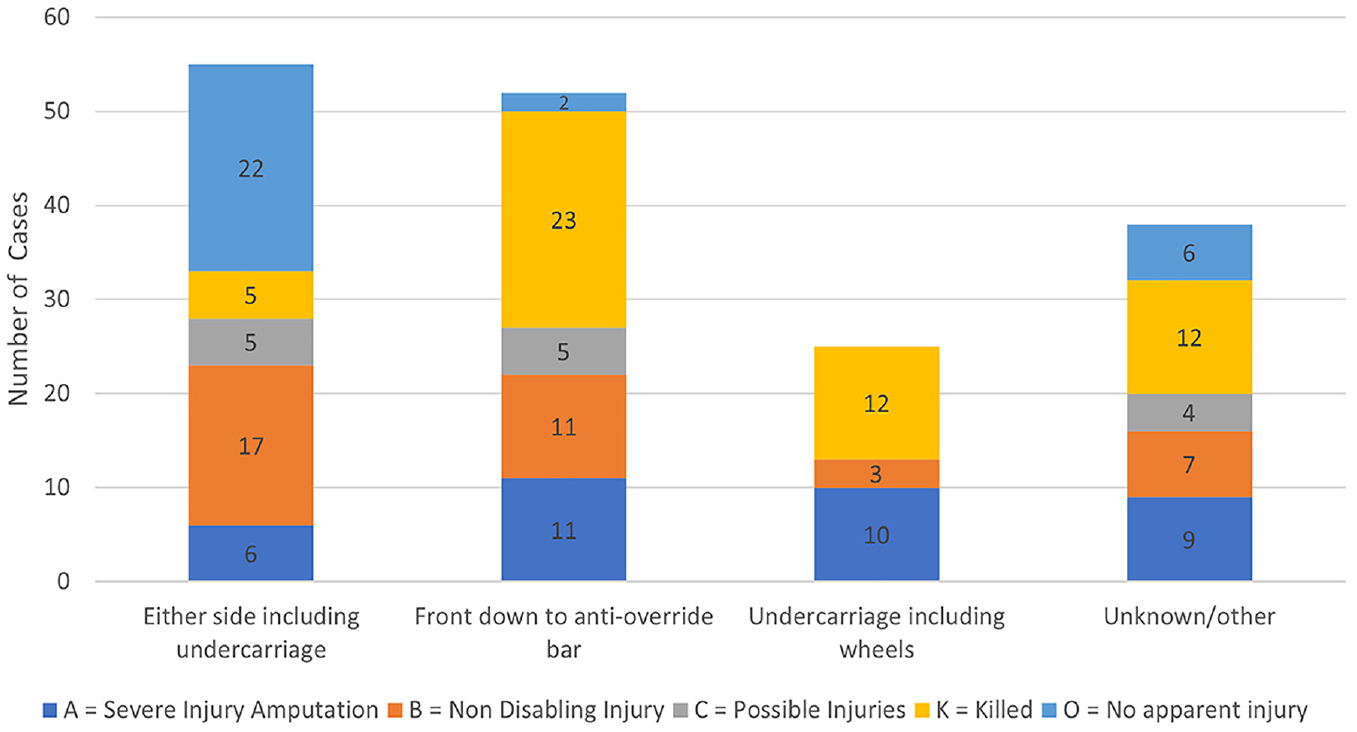
2019 New York City Subway KABCO data with primary contact area, N = 170.
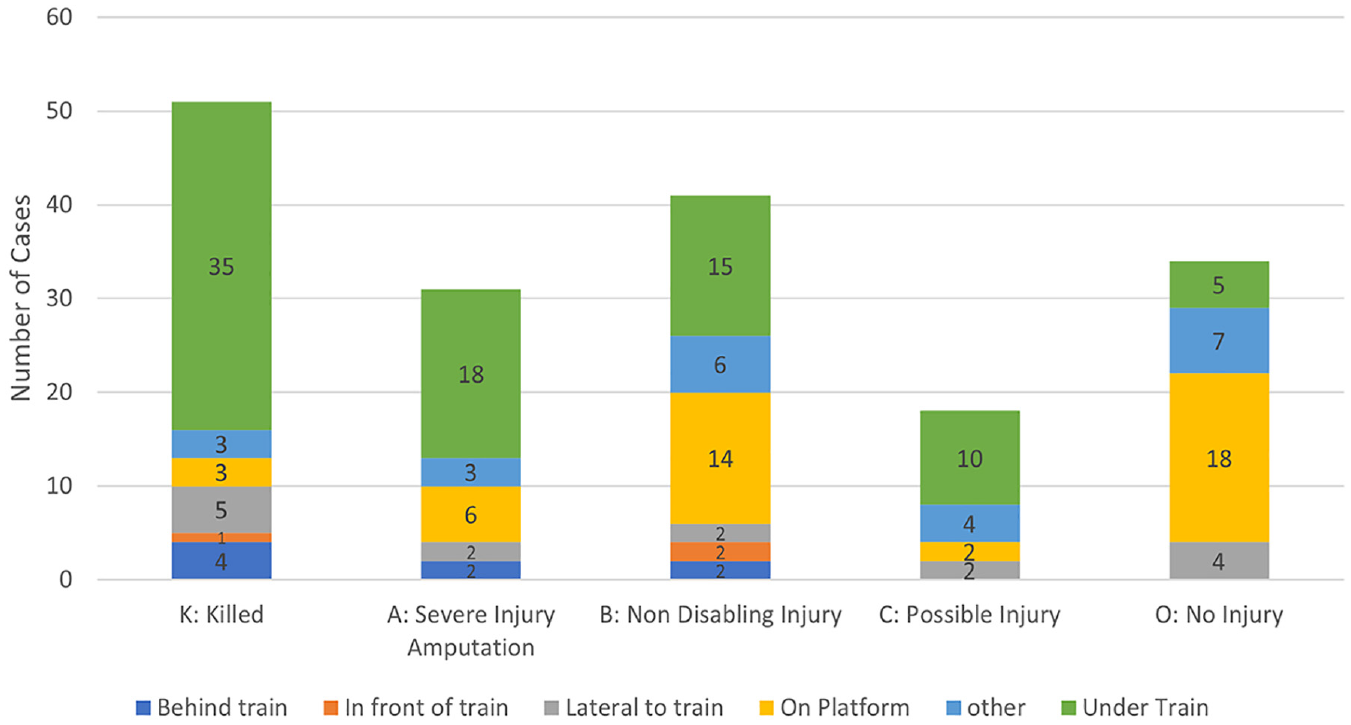
2019 New York City Subway KABCO data with pedestrian final position, N = 175.
Discussion
Table 3 compares published literature (1990 to 2007) on NYC Subway incidences with our 2019 fatal data. The former covers a 17-year time span, whereas this study presents data for 1 year only. The percentage distributions showed reasonable alignment despite slight differences in peak values. Thus, the age, sex, and geographical distribution of subway collisions in the NYC transit system have not changed substantially over the 30-year period, further justifying the conclusion that 2019 can be considered a typical year for more detailed analysis. Moreover, this analysis of NYC Subway pedestrian incident cases has presented significant new insights into the nature of subway–pedestrian collisions, and these are considered in detail below.
Event Type and Location
The breakdown of suicide and accidental train–human collisions (Figure 2) differed slightly to previous literature (see Tables 1 and 2). The reliance on eyewitness accounts only may account for this.
The fatality rate for suicidal train to human impacts was 42%, whereas accidental impacts had a 25% fatality rate. Suicidal acts tended to be on the roadbed and thus have a much more violent impact, with a high risk of rollover by the train wheels. A large portion of accidental impacts were side impacts with the pedestrian standing too close to the edge of the platform.
Figure 9 presents photographs of both an elevated and a below-ground NYC Subway station. One possible reason for the higher fatality and amputation rate in above-ground and elevated stations compared with below-ground stations could be the drainage trough (often referred to as a suicide pit) (Figure 9b), which is not present in elevated stations (Figure 9a). However, track geometry differs between platforms and a below-ground station may contain both one track with a deeper drainage trough with crossties and another track with a shallower drainage trough without crossties. Further study on the effects of track geometry on secondary impacts (i.e., impact with rails/platform and so forth after contact with the train) is needed to better understand pedestrian injury outcomes.
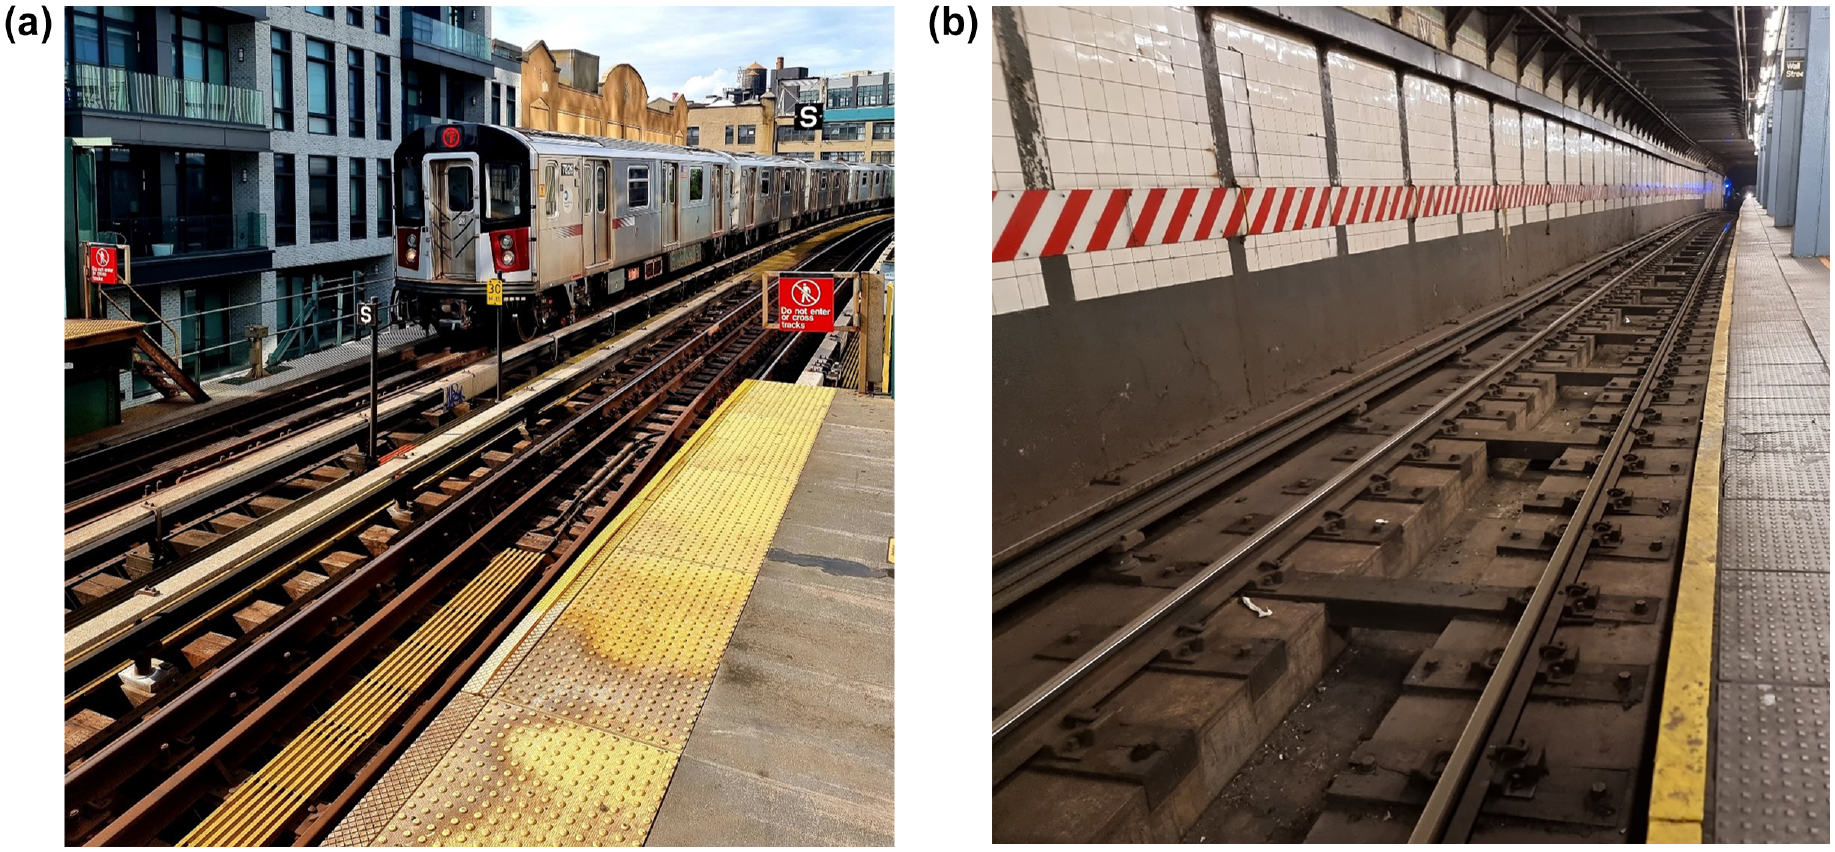
Elevated and below-ground New York City (NYC) Subway stations: (a) R142 train entering an elevated NYC Subway station, and (b) NYC below-ground subway station tracks.
Impact Data
A significant proportion (15%) of NYC Subway train to human collisions occurred owing to the pedestrian standing too close to the platform edge (Figure 4). Further, the most common preimpact maneuver was a pedestrian jumping from the platform to the roadbed, followed by the pedestrian walking along the tracks. Accordingly, limiting access to the platform edge (e.g., via platform edge doors) would most likely be an effective countermeasure in many cases. However, the space available on existing platforms may limit the viability of platform edge doors.
In relation to biomechanical modeling for countermeasure development and assessment, the initial position of the pedestrian model was of great importance (see Figure 5). The conditions coded as “Grazed the side of the train from platform” and “Leg between platform and train” had the highest survival rates. Of the three frontal impact positions, mid-jump had the highest fatality rate (43%). Mid-jump incidents often occurred at the highest train velocity as the train operator had not initiated the emergency brakes, however, they occurred less frequently. When considering fatalities only, then standing, jumping, and lying should be given equal consideration for safety countermeasure design. Future policies aimed at injury/fatality mitigation and associated computational modeling efforts would therefore benefit from a comprehensive impact position comparison involving the above-mentioned postures.
The most common estimated impact velocity was 40 to 47 km/h (25 to 29 mph; see Figure 6a), and there was unsurprisingly a positive correlation between impact velocity and fatality rate (Figure 6b). However, owing to rollover and the risk of electrocution, even low-velocity impacts in the 8 to 15 km/h (5 to 9 mph) range can result in a fatality. Secondary impact can be fatal at any speed, especially in the presence of the third rail, which carries a lethal electrical current. Secondary contact can also result in serious injuries because of track stiffness and geometry.
Figure 7 shows the primary impact location, with side impacts presenting the lowest fatality rate (9%) and wheel/undercarriage presenting the highest (40%). Not surprisingly therefore, policies aimed at reducing the capacity of pedestrians to be run over by the subway should be the main safety consideration.
Countermeasure Summary
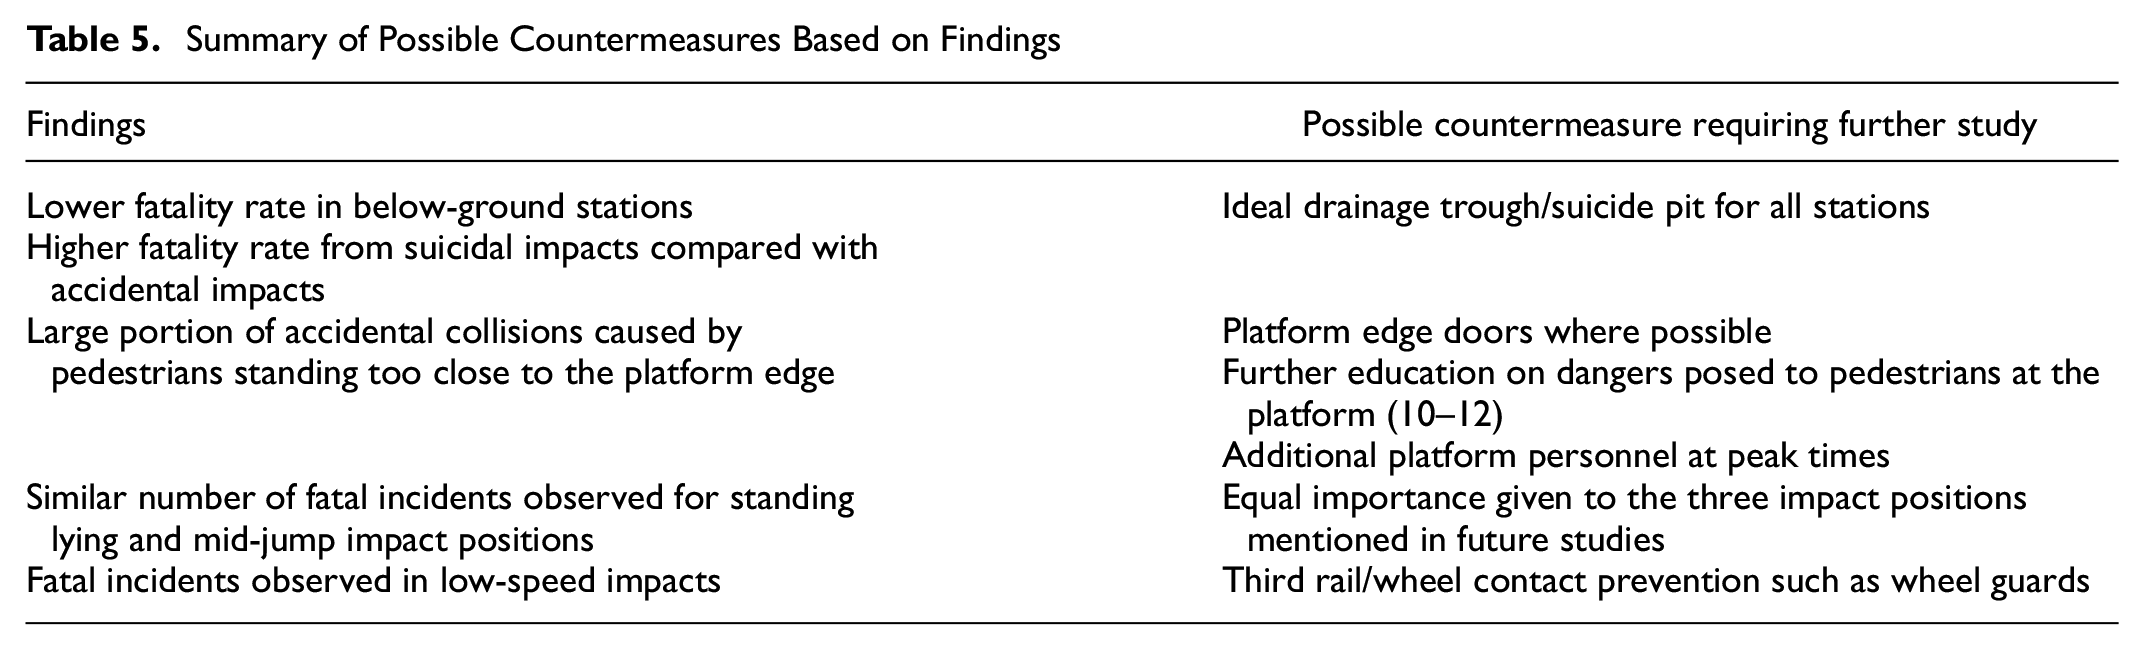
Most train to human impacts occurred at a platform or within the station area (i.e., 200 ft either side of the platform), reflecting the limited access to the subway track (Table 5). Thus, the following suggested countermeasure designs should focus on the station area.
Summary of Possible Countermeasures Based on Findings
Limitations
There are several limitations to this work. The analysis in this paper was based on the data available in the NYC Transit Authority’s incident reports. These were completed based on the accounts of the train operators and other eyewitnesses, and the level of detail available in the incident reports was variable. The reliance on eyewitness accounts only may have accounted for the slight differences to the published literature of suicide and accident fatality numbers (shown in Figure 2), because medical records, toxicology data, patient history, and medication history were not available for this study. A follow-up study making use of medical/autopsy reports comparing the results to those found in this study may prove beneficial. The speed estimates should be considered as an upper bound. The precise position of the pedestrian at the instant of contact with the subway could not be established with certainty. Owing to the variability in the available data between incident reports, direct comparison was difficult. For example, impact velocity was only reported for trains that had an event recorder installed, whereas the train model was recorded for all cases. If a direct comparison was made between impact velocity and train type, there would be many missing datapoints, which could influence the readers’ interpretation. It is for this reason that the total number of cases (N) was different for Figures 2 to 8. Notwithstanding all these limitations, the information presented in this paper provides the most detailed available analysis of the configurations of subway to pedestrian collisions.
Conclusion
This analysis of 2019 NYC Subway incidents showed little has changed in relation to borough-, age-, and gender-related distributions of NYC Subway fatalities since 1990. Further, the data showed that most cases (97%) occurred at or close to the station area, emphasizing that policies aimed at limiting track access would inhibit most collision cases. The fatality rate appeared to be substantially influenced by track geometry, with the presence of a drainage trough reducing fatality rates, suggesting secondary impacts play a major role. Grazing the side of the train from the platform was the second highest impact position. This type of impact could be prevented with additional policies focused on ensuring passengers stand clear of the platform edge while the train is approaching. For example, additional passenger education and employing personnel during peak times to ensure the platform edge remains clear may yield benefits (10–12). In relation to biomechanical modeling for future intervention design, scenarios involving pedestrians standing, lying, and jumping will all be important. The fatality rate increased with impact speed, as expected, but impacts of 56 to 64 km/h (35 to 40 mph) can be survivable, whereas some very low speed events can be fatal. An effective countermeasure at a 56-km/h (35-mph) impact speed would mitigate injuries for the vast majority of cases. The most common final resting position for pedestrians was under the train, which was associated with the highest fatality rate. This suggests that future policies promoting countermeasures should protect against contact with the underside of the train, the wheels, and the track bed.
Supplemental Material
sj-docx-1-trr-10.1177_03611981231166692 – Supplemental material for Detailed Analysis of New York City Subway Pedestrian Incidents From 2019
Supplemental material, sj-docx-1-trr-10.1177_03611981231166692 for Detailed Analysis of New York City Subway Pedestrian Incidents From 2019 by Daniel Hall, Joe Linogao, Logan Zentz, Greg Shaw, Tom Lamb and Ciaran Simms in Transportation Research Record
Footnotes
Author Contributions
The authors confirm contribution to the paper as follows: study conception and design: D. Hall, L. Zentz, G. Shaw, T. Lamb, C. Simms; data collection: D. Hall, L. Zentz, T. Lamb; analysis and interpretation of results: D. Hall, L. Zentz, J. Linogao; draft manuscript preparation: D. Hall, C. Simms, G. Shaw. All authors reviewed the results and approved the final version of the manuscript.
Declaration of Conflicting Interests
The authors declared no potential conflicts of interest with respect to the research, authorship, and/or publication of this article.
Funding
The authors received no financial support for the research, authorship, and/or publication of this article.
Supplemental Material
Supplemental material for this article is available online.
References
Supplementary Material
Please find the following supplemental material available below.
For Open Access articles published under a Creative Commons License, all supplemental material carries the same license as the article it is associated with.
For non-Open Access articles published, all supplemental material carries a non-exclusive license, and permission requests for re-use of supplemental material or any part of supplemental material shall be sent directly to the copyright owner as specified in the copyright notice associated with the article.