
Abstract
Throughout the COVID-19 pandemic, people’s online and in-store shopping behaviors changed significantly. As the pandemic subsides, key questions are why those changes happened, whether they are expected to stay, and, if so, to what extent. We answered those questions by analyzing a quasi-longitudinal survey dataset of the Puget Sound residents (Washington, U.S.). We deployed structural equation modeling (SEM) to build separate models for food, grocery, and other items shopping to explore the factors affecting such changes. The results revealed that people’s online and in-store shopping frequencies during the pandemic were affected by their perceived health risk, attitudes toward shopping, and pre-pandemic shopping frequencies. Similarly, it was shown that how frequently people expect to shop post pandemic is influenced by their attitudes toward shopping, changes during the pandemic, and their pre-pandemic frequencies. We also classified respondents into five groups, based on their current and expected future shopping behavior changes, and performed a descriptive analysis. The five groups—Increasers, Decreasers, Steady Users, Returnees, and Future Changers—exhibited different trends across online and in-store activities for shopping different goods. The analysis results showed that, while 25% of the respondents increased their online shopping, only 8% to 13% decreased their in-store activities, implying that online shopping did not completely substitute in-store shopping. Moreover, we found that online shopping is a substitution for in-store shopping for groceries, while it complements in-store shopping for food and other items. Additionally, more than 75% of new online shoppers expect to keep purchasing online, while 63%–85% of in-store Decreasers plan to return to their pre-pandemic frequencies.
Keywords
The rise of e-commerce, busy lifestyles, and the convenience of next- and same-day home deliveries have resulted in exponential growth of online shopping in the U.S., rising from 5% of the total retail in 2011 to 15% in 2020, and it is expected to grow even further in the future ( 1 , 2 ). Worldwide, spending on e-commerce passed $4.9 trillion in 2021 and it is projected to surge to $7 trillion by 2025 ( 3 ).
In the past few years, there has been ongoing research on how this growth would change people’s travel patterns and whether its effect on in-person activities would be substitution, complementing, or modification. However, there is no single answer to this question, given different product types, regions, demographics, and primary travel modes ( 4 – 7 ).
While online purchasing had already been experiencing a growth every year before 2020, the pandemic accelerated this trend. In 2020, online shopping constituted more than 20% of total spending on consumer goods worldwide in comparison to 16.4% in 2019 and 14.4% in 2018 ( 8 ). Before COVID-19, it was predicted that total e-commerce sales in the U.S. would grow up to $674.88 billion, yet the actual number turned out to be $799.18 billion ( 9 ). With a 15.9% growth, the U.S. is among the top 10 countries with the highest growth rate in online retail shopping in 2022 ( 10 ).
Embracing digital technologies and bringing shops into homes are among the immediate impacts of the pandemic restrictions and lockdowns, with the majority of people reducing their frequency of going to stores and adopting alternative shopping approaches such as curbside pick-up and home delivery ( 11 – 13 ). Based on the reports by the U.S. Bureau of Transportation Statistics (BTS), in Nov–Dec 2020, when the penetration of the coronavirus reached its first peak in the U.S., the percentage of people who decided to shop online instead of going to stores increased by up to 10% ( 14 , 15 ). During the early pandemic, about 35% of U.S. workers switched to remote working, and from March to April 2020, the average daily number of people staying home increased by 32 million and the total number of trips decreased by 2.5B ( 16 , 17 ). Dining-in restaurants were also banned in half of the U.S. states for several months in 2020, which resulted in a significant drop in the restaurant dine-in demand and shifted people toward online food delivery services, and buying groceries online rather than going to store ( 18 , 19 ).
These changes were also influenced by socio-demographic characteristics. For instance, according to the BTS, the percentage of people with an annual income close to $125,000 who replaced their in-store shopping by online shopping in Nov–Dec 2020 was twice those with an annual income of $25,000 ( 20 ). People in the neighborhoods with higher number of positive COVID-19 cases or higher spread rate of positive new cases were more likely to change their in-store shopping to online-shopping ( 19 , 21 ). Senior people were also shown to have higher tendency to shop online compared with younger generations, perhaps because of health and safety concerns ( 22 ). It is worth noting that these changes were not the same across all products; for example, online sales of food and beverage in the U.S. doubled in 2020, while home furniture online sales only increased by about 50% ( 23 , 24 ).
Another factor that is proved to have a major effect on people’s shopping behaviors and travel patterns during the pandemic is their risk perception and fears for their health ( 13 , 25 ). Irawan et al. found that perceiving COVID-19 as a severe disease decreased people’s tendency to do in-store grocery shopping ( 26 ). Similarly, Moon et al. found out that, during the pandemic, people who considered themselves less vulnerable to the infection were less likely to use online channels for shopping ( 27 ). Several studies have mentioned that the perceived health risk varies among different groups of population and depends on region, age, gender, education, race, and marital status ( 28 – 32 ).
Moreover, people’s online and in-store shopping behaviors are affected by their socio-demographic factors and their attitudes toward the activity ( 33 – 39 ). The advantages and disadvantages of online shopping over in-store shopping play a role in attitudes toward the activity ( 40 , 41 ). The advantages, such as receiving goods without leaving home, having access to a wider variety of products and information, and being able to compare them easily and efficiently, result in a positive attitude toward online shopping, especially during the pandemic given high perceived health risk, formal penalties, or both ( 42 ). On the other hand, online shopping has some disadvantages, such as transaction security concerns and long delivery times, and in-store shopping offers specific benefits, such as the ability to see, touch, feel, and try the products, ensuring the store’s environment quality, immediate possession of the product, social interaction, and entertainment ( 5 , 41 , 43 , 44 ). Therefore, even during the pandemic, some people maintained frequent in-store shopping trips ( 41 ).
Whether the pandemic-induced changes in online and in-store shopping are permanent is still debatable. Sheth discussed that people may find the new routine more convenient, affordable, and accessible, and therefore stick to it even after the pandemic is over ( 11 ). On the contrary, Dannenberg et al. argued that people’s motives to shop online only hold for the time of crisis, and online retailing will decline when circumstances change ( 45 ). Watanabe and Omori showed that most people used to shop online long before the pandemic, and they merely increased their frequency because of infection risk ( 46 ). So, the reasons behind the surge in online shopping might dissipate as COVID-19 recedes.
In this paper, we study how online and in-store shopping behaviors for different goods were affected during COVID-19, and whether those changes are expected to stay post pandemic. We analyze a quasi-longitudinal survey dataset from the Puget Sound region in Washington State, U.S., that includes data on people’s shopping behavior before and during pandemic, as well as their expected shopping behavior after pandemic. The dataset also contains information on socio-demographic characteristics, as well as psychometric questions about COVID-19 risk perception and attitudes toward shopping. Through descriptive analysis and structural equation modeling (SEM), we explore the factors that directly or indirectly affected people’s three shopping activities (online and in-store), for food, grocery, and other items (clothing, home goods, etc.), and investigate the similarities and differences amongst them.
This study is distinguished in several ways from the previous ones that investigated the impacts of COVID-19 on people’s shopping behavior: (1) it applies a unique descriptive analysis by classifying respondents based on their current and expected future shopping trends and studies how socio-demographic characteristics (directly and indirectly) influence people’s shopping behaviors by analyzing the similarities and differences between those groups; (2) it models online and in-store shopping jointly, considering covariations and dependencies between those two modes; (3) it applies the same methodology and set of variables to three different shopping activities (for food, grocery, and other items) and compares and contrasts their observed/expected trends and influencing factors; and (4) in addition to socio-demographic and attitudinal variables, it considers people’s baseline shopping behaviors (how frequently they shopped online and in-store before the pandemic) as factors affecting their expected post-pandemic shopping behaviors.
Data
Data for this research came from a quasi-longitudinal survey of the Puget Sound region residents conducted by researchers at the University of Washington during 2020 to 2021 ( 47 ). The data was collected in three waves during the early, mid, and late COVID-19 pandemic: Wave 1 in June–July 2020, Wave 2 in March–May 2021, and Wave 3 in October 2021. The original dataset contained 3,810 observations. We reviewed and cleaned the data by removing duplicate responses and responses with contradictory or impossible information (e.g., noted “no use of the private vehicle” in one section and “driving twice a week to the supermarket” in another section; or noted “using shared ride-hailing service during pandemic” while the service was not available at the time). After cleaning the dataset, we ended up with a total of 3,559 valid responses across the three waves, with Waves 1, 2, and 3 representing 36.6%, 34.8%, and 28.6% of the observations, respectively.
In Waves 2 and 3, prior respondents who provided their contact information were contacted and invited to participate again, but new respondents were also recruited to make up for attrition. Therefore, the 3,559 observations correspond to 2,548 unique respondents who participated in one or more waves of the survey: 187 (7%) participated in all three waves, 637 (25%) responded to two waves, and 1,724 (68%) answered the survey only once. Since the two- and three-wave survey respondents constitute about a third of the total sample, the dataset will not be analyzed as a panel; rather we will focus on the total responses in each wave.
The survey had three sections. The first section collected data on respondents’ socio-demographics (including age, education, gender, marital status, occupation category, annual income, race, and household composition) and the frequency of three pre-pandemic online and in-store shopping activities (for food, grocery, and other items). Other items includes clothing, home goods, and so forth. In-store food shopping refers to dining in a restaurant, and meal delivery and pickup are considered online food shopping.
The second section of the survey asked questions about online and in-store shopping frequency during and post pandemic for all three activities. The during-pandemic questions asked about the shopping frequency “in the past month,” and post-pandemic questions asked about the expected shopping frequency for “when COVID-19 is no longer a threat.”
The third section included psychometric questions in a six-point Likert Scale, ranging from strongly disagree (1) to strongly agree (6). These questions asked the level of agreement with a set of statements about the pandemic, and in-store and online shopping. The statements and the short variable names picked for them are as follow: “Wearing face-covering should be mandatory” (Mask Mandate), “Physical distancing is an efficient approach for controlling the coronavirus” (Physical Distancing), “Everyone should stay at home as much as possible until the coronavirus has subsided” (Stay at Home), “Shutting down businesses to prevent the spread of the coronavirus is not worth the economic damage that it causes” (Business Shutdown), “My friends and family expect me to stay at home until the coronavirus subsides” (Family Expectations), “I am concerned that my friends and family will experience serious health issues if they catch the coronavirus” (Family Risk), “Media is exaggerating the spread of the coronavirus” (Media Exaggeration), “Even if I don’t end up buying anything, I still enjoy going to stores and browsing” (Enjoy Browsing), “It is important to me to physically check out items before buying them” (Like Seeing Items), “In-store shopping is fun” (In-store Fun), “Eating in restaurants is a fun leisure activity” (Restaurant Fun), “I prefer buying groceries online rather than going to store” (Prefer Online), and “Shopping online is convenient” (Online Convenience).
Table 1 and Figures 1 and 2 show the distribution of variables across the sample. Table 1 summarizes the distribution of socio-demographic characteristics, which are also presented for the entire Puget Sound region population for comparison ( 48 ). As seen in the table, the sample and Puget Sound population have similar incomes, employment rates, and gender distribution. However, the sample is a bit younger, more educated, and wealthier than the Puget Sound average population. The Latino and African-American populations are underrepresented in the sample, and the White population is overrepresented. The three waves have almost similar socio-demographic distributions. However, females are more represented in Wave 3, and the percentages of students and unemployed people dropped from Wave 1 to Wave 3. Also, as vaccines rolled out in early 2021, the percentage of vaccinated people increased in the survey, rising from zero in Wave 1 to 97% in Wave 3.
Distribution of Socio-Demographic Characteristics Across the Sample
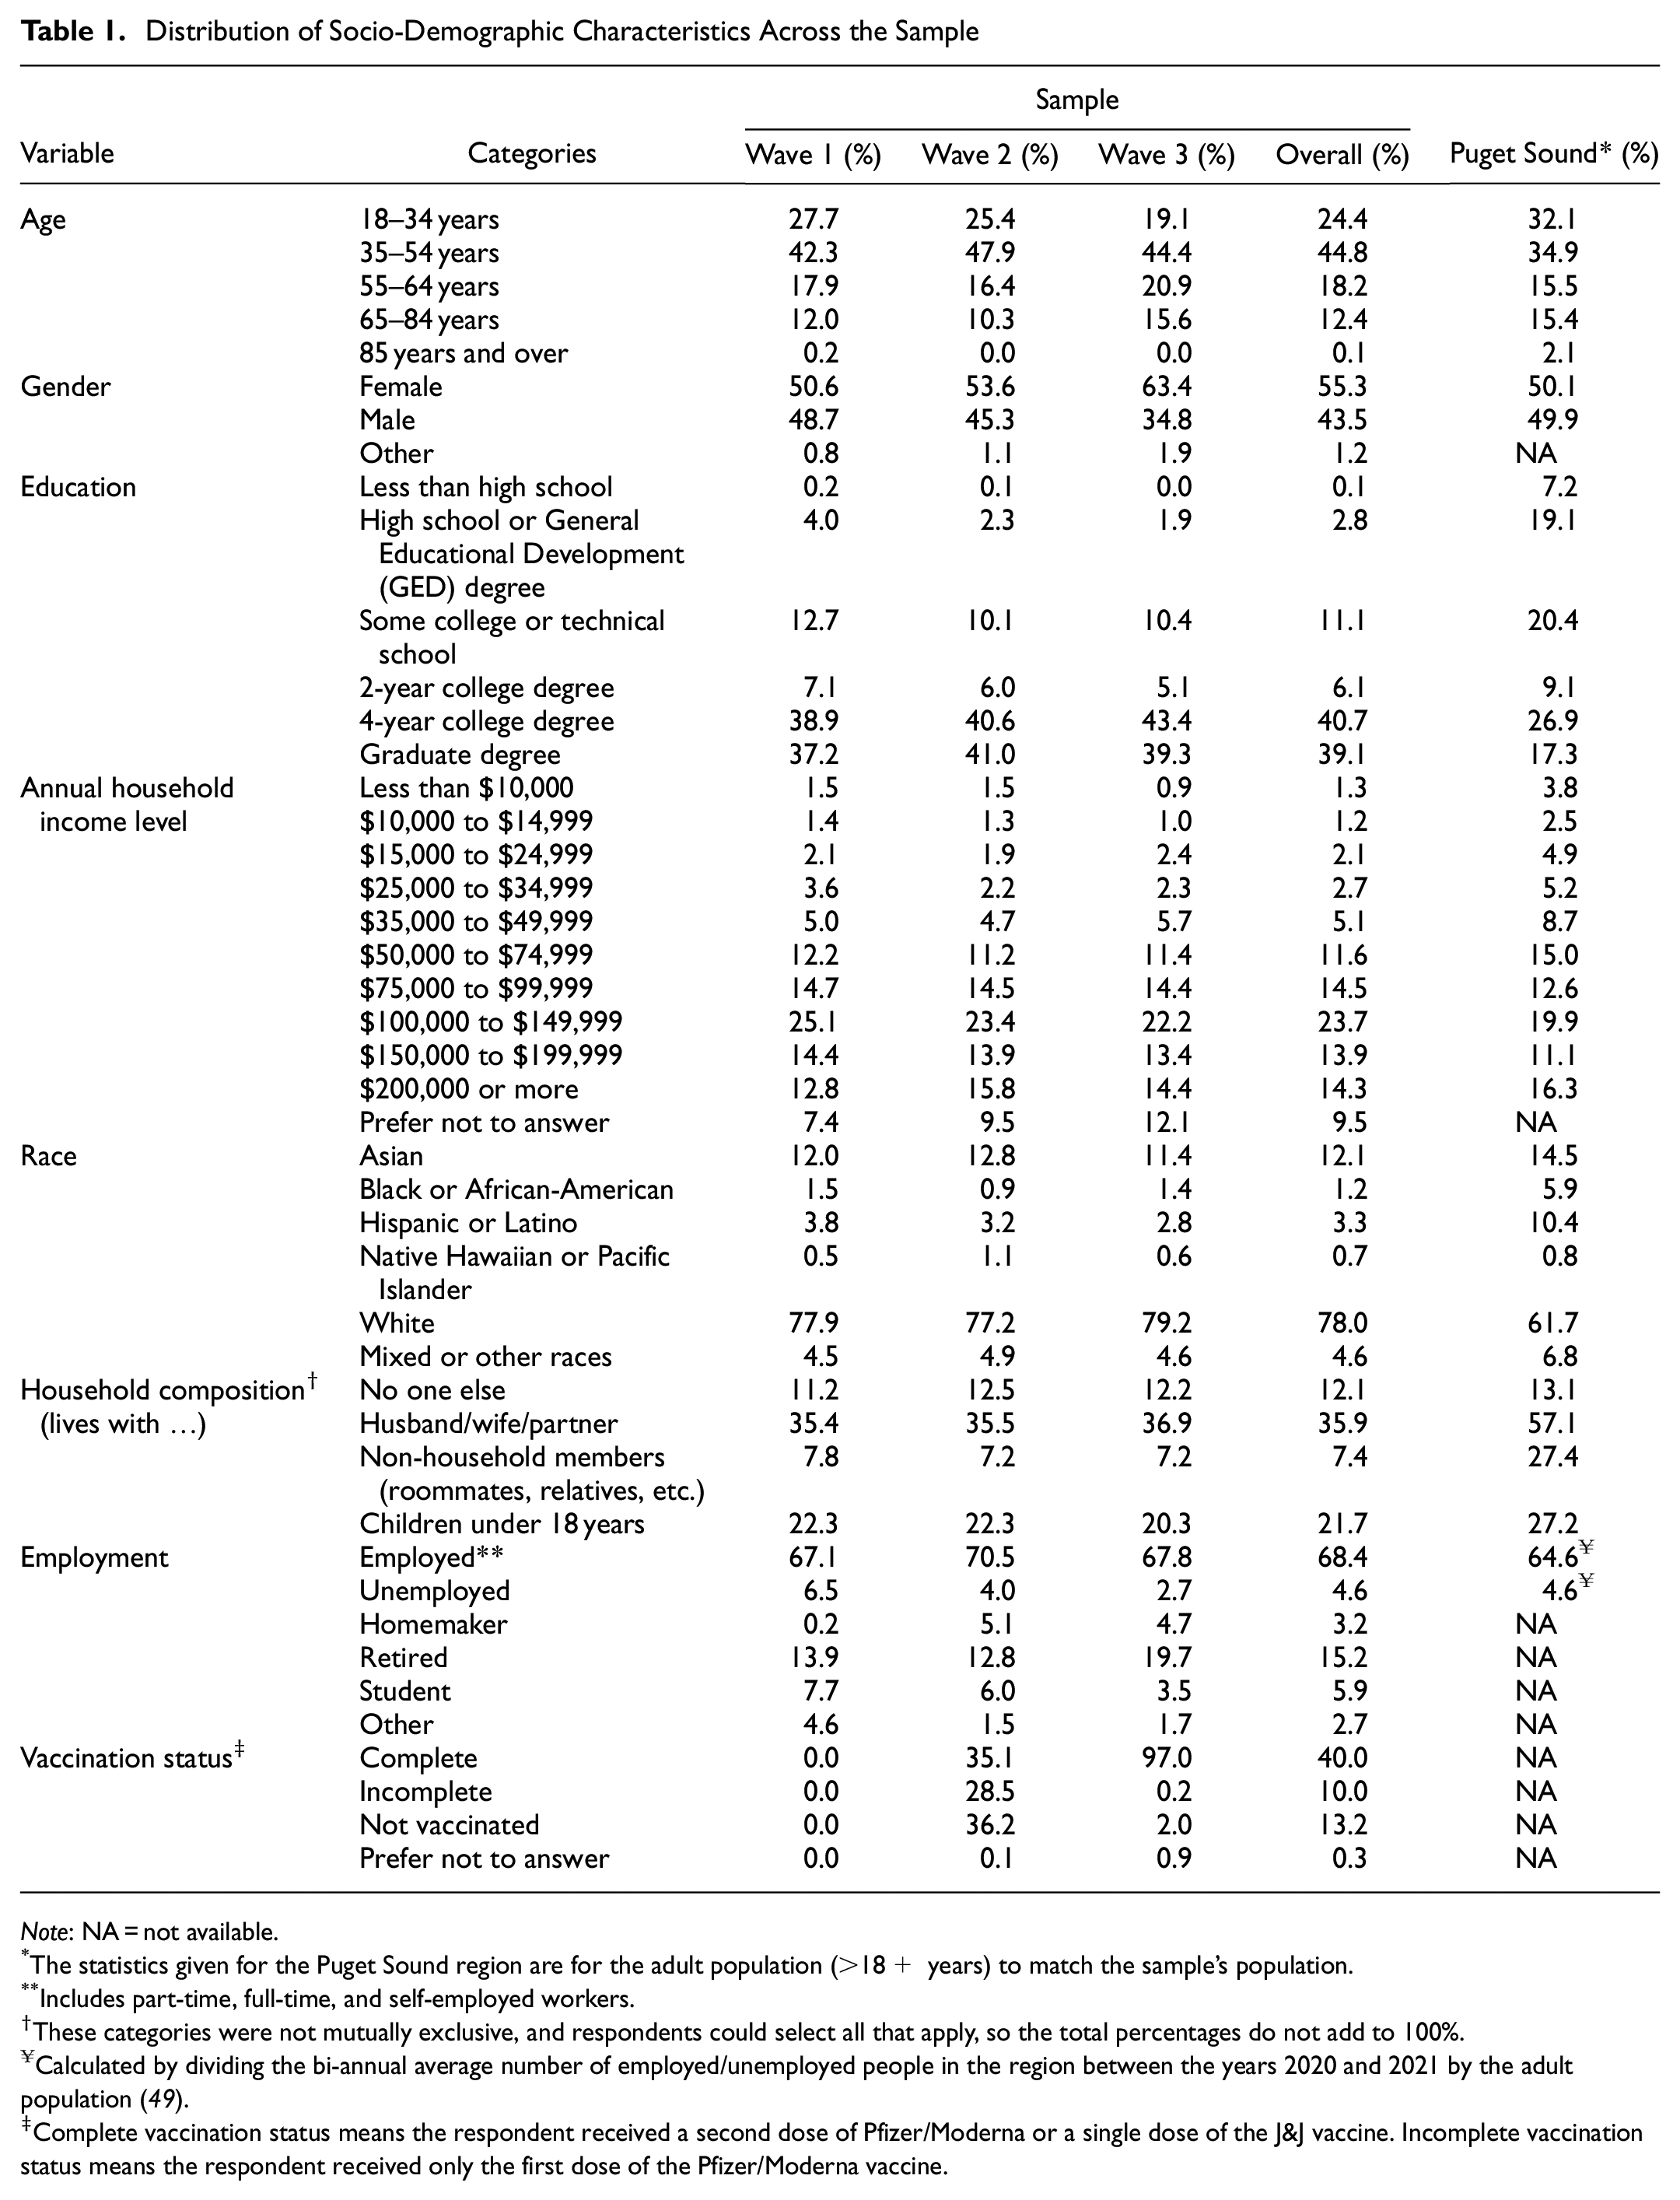
Note: NA = not available.
The statistics given for the Puget Sound region are for the adult population (>18+ years) to match the sample’s population.
Includes part-time, full-time, and self-employed workers.
These categories were not mutually exclusive, and respondents could select all that apply, so the total percentages do not add to 100%.
Calculated by dividing the bi-annual average number of employed/unemployed people in the region between the years 2020 and 2021 by the adult population ( 49 ).
Complete vaccination status means the respondent received a second dose of Pfizer/Moderna or a single dose of the J&J vaccine. Incomplete vaccination status means the respondent received only the first dose of the Pfizer/Moderna vaccine.
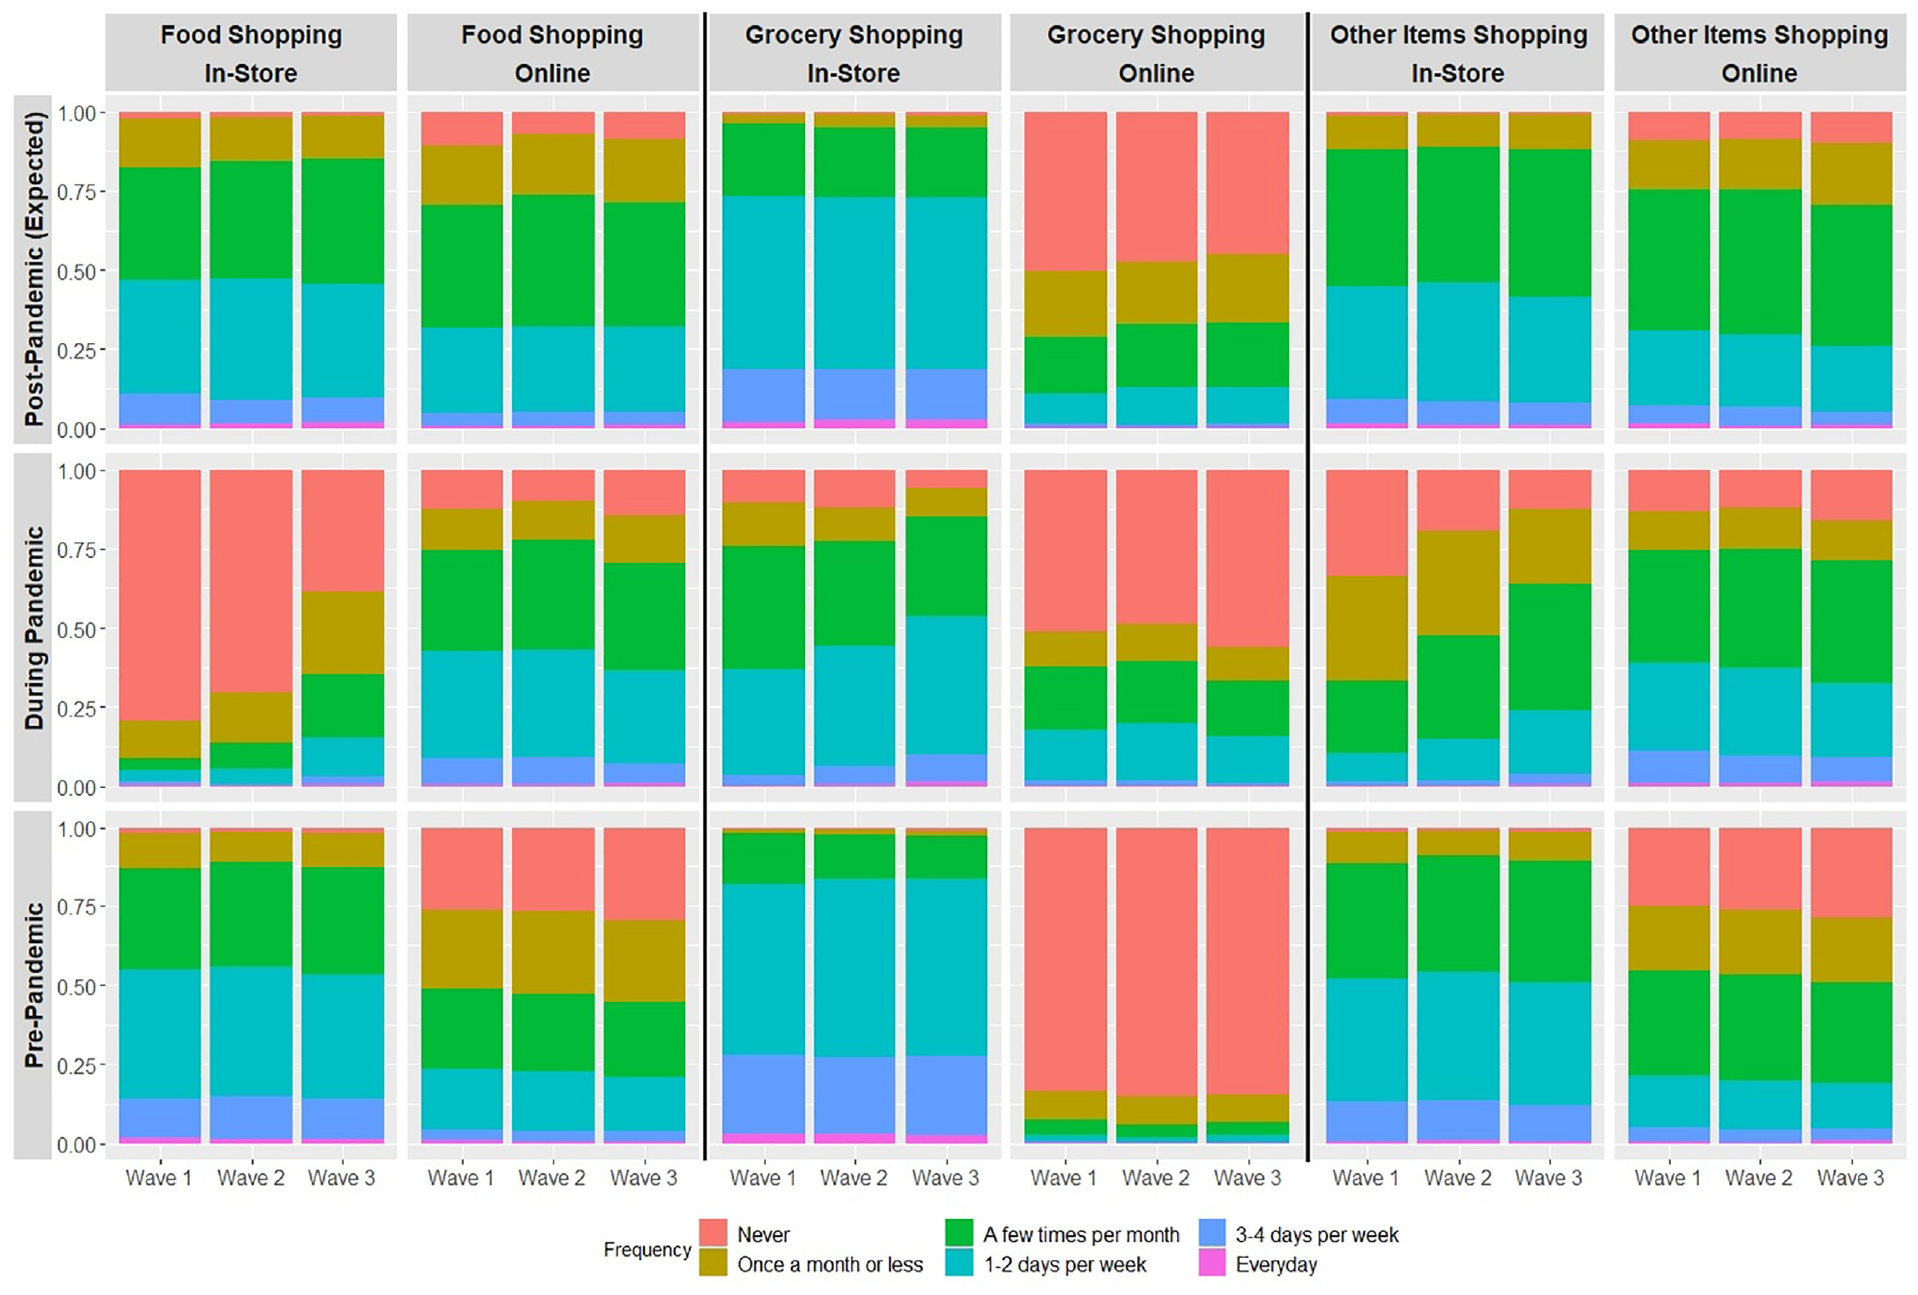
Distribution of online and in-store shopping frequency across the sample for the three activities.
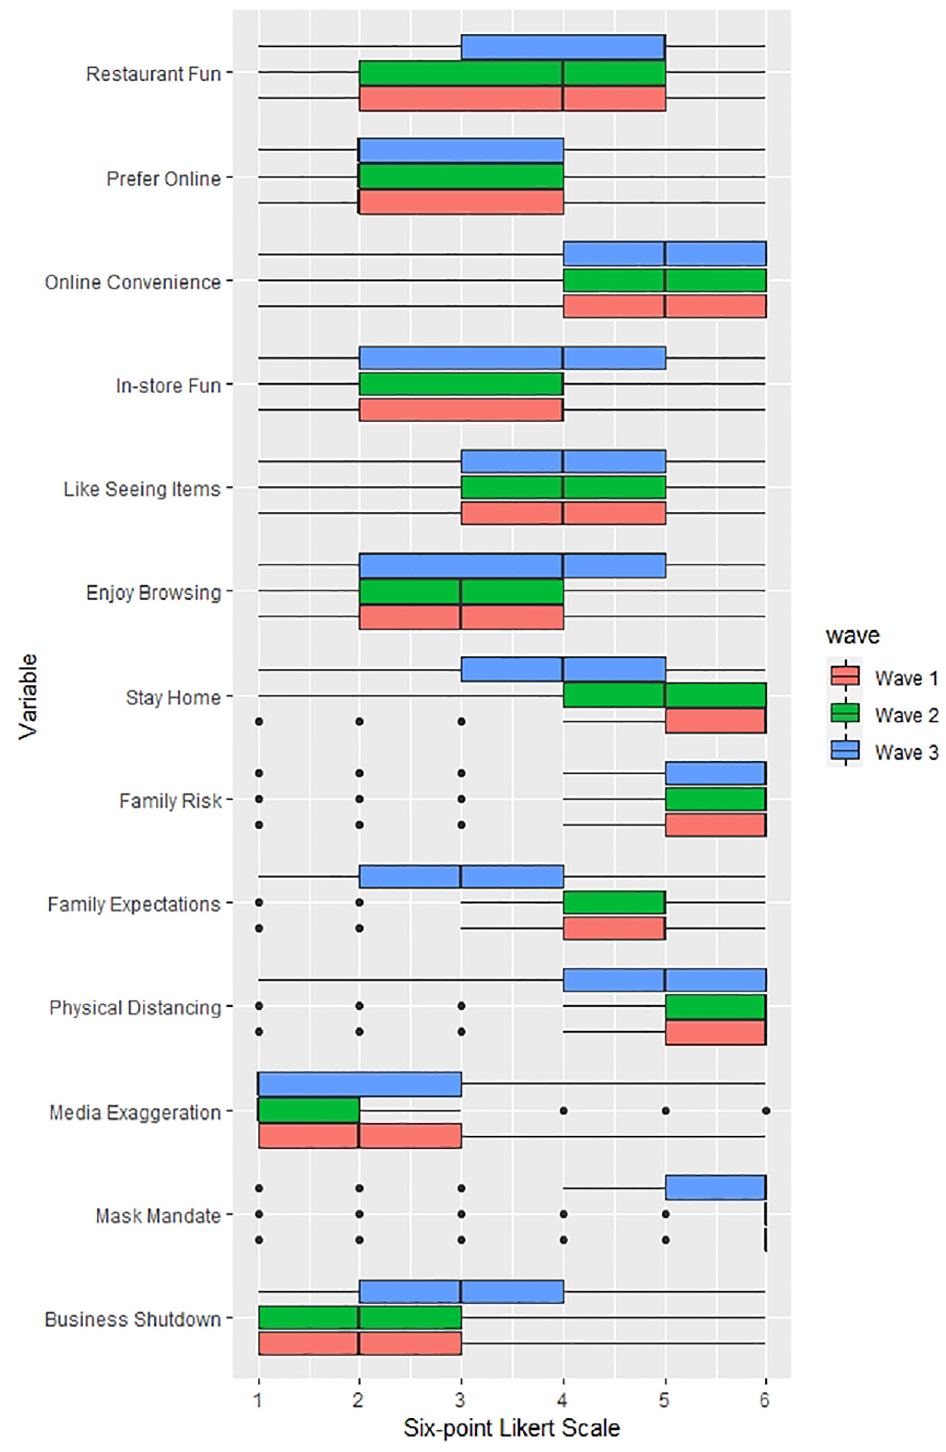
Distribution of the psychometric variables across the sample.
Figure 1 shows shopping frequency for the three activities across the survey waves. The pre-pandemic and post-pandemic (expected) distributions are consistent across Waves 1, 2, and 3 for all the activities. Moreover, for in-store activities, the pre-pandemic and the expected post-pandemic frequency distributions are similar, implying that people expect to return to their pre-pandemic in-store behaviors. The same cannot be said for online activities, as the statistics show that people expect to shop online more frequently after the pandemic than before it. It is also shown that the majority of respondents (∼80%) used to shop for groceries in-store a few times a week, while about the same percentage (∼85%) never did online grocery shopping before the pandemic. During the pandemic, in-store grocery shopping decreased, and online grocery shopping increased. Another notable observation is that in-store shopping frequency for food and other items experienced a significant drop during the pandemic (compared with pre-pandemic); however, both activities started to increase gradually (Waves 2 and 3 compared with Wave 1). Interestingly, this gradual increase (between the waves) in in-store shopping for food and other items did not translate into a decrease in the corresponding online activities.
The distribution of the psychometric variables is presented in Figure 2. In most part, the distributions are similar for the three waves. However, the Stay Home, Mask Mandate, Physical Distancing, and Family Expectations variables exhibit lower agreement rates as the pandemic subsides. Similarly, the sample is less likely to support business closures to prevent the spread of the virus in the Wave 3 compared with Waves 1 and 2.
Methods
To achieve the study’s objectives, we used descriptive analysis and SEM. SEM is a technique that considers the mediation effect and incorporates direct and indirect effects in a single model, allowing each variable to be the cause and effect simultaneously ( 50 ). The exogenous and endogenous variables can be continuous or discrete, observed, or latent ( 51 ). Observed variables can be measured directly, while latent variables are determined using scaled indicators.
SEM has been used extensively in transportation research for various applications ( 52 ). In the context of online shopping, Gould et al. used SEM to find how the travel time saved by online shopping would be allocated to other activities, and Irawan and Wirza applied SEM to understand the relationship between online searching, online shopping, and shopping trips ( 53 , 54 ). In a similar approach to that taken in the present study for analyzing shopping frequencies, SEM has been used in Chen and Chen, Ning et al., and Zeballos Rivas et al. to investigate how exogenous variables, risk perception, attitudes, and subjective norms affected preventive behaviors during the COVID-19 pandemic ( 55 – 57 ).
We have applied SEM to identify the factors affecting online and in-store shopping behaviors for different goods, and to measure their impacts on shopping behavior changes during the pandemic and in the future. Moreover, to understand how people changed and expect to change their shopping behaviors throughout the pandemic, we performed a descriptive analysis by first estimating the changes in shopping frequency between the three phases of the pandemic (pre-, during-, and post-pandemic), and then classifying the respondents based on the observed change trends. The details of the SEM methodology are presented in the remainder of this section, and the descriptive analysis is further explained in the Results and Discusson – Behavior Change Groups section.
Variables
We defined eight endogenous variables for the SEM model, including two latent variables. The endogenous variables are the frequency of online and in-store shopping before, during, and after the pandemic (six variables in total), COVID risk perception (CRP) (latent variable), and attitude toward shopping (ATS) (latent variable). The latent variables (CRP and ATS) are defined using observed indicators, which are the psychometric questions (about the pandemic, in-store, and online shopping) that were mentioned in the Data section. In the model, we considered the impact of ATS on people’s shopping frequencies before, during, and after the pandemic, and the impact of CRP on people’s shopping frequency during the pandemic.
Age, education, gender, marital status, employment, income, and race are the exogenous variables in the models, and we modeled their effect on CRP, ATS, and the pre-pandemic frequencies of online and in-store shopping. The pandemic moment (early, mid, late) was also incorporated in the model as an exogenous variable to estimate the changes in people’s behavior during the pandemic and their expected changes after the pandemic.
We assumed that the pre-pandemic frequencies of online and in-store shopping affected the corresponding frequencies during the pandemic, and that those, in turn, will affect both expected online and in-store shopping frequencies after the pandemic.
SEM Specification
SEM has two components: the measurement model and the structural model. The measurement model estimates the power of each indicator to present the corresponding latent variable. The structural model configures the relationships among the latent variables and new observed variables ( 58 , 59 ).
Measurement Model
To build the measurement model, we applied confirmatory factor analysis (CFA) ( 60 ). CFA assumes there is a latent variable (i.e., a factor) that influences a set of indicators, interconnecting their variances and covariances. The indicators’ variances can be divided into unique and common. The unique variance corresponds to the natural dispersion of each observed variable, while the common variance is the dispersion shared by all the indicators as they are all under the influence of the same latent variable. CFA analyzes these unique and common variances to form a latent variable and to evaluate the pre-established theoretical relationships between the latent variable and indicators ( 58 , 61 , 62 ).
Equation 1 shows the relationship between latent variables (factors) and the corresponding indicators in the CFA methodology:

where
The estimation of the factor loadings (

where
The predicted value of a latent variable (


where
(
Structural Model
To build the structural model, we employed path analysis (PA). First, causal relationships (or paths) between the variables are hypothesized to draw influence chains in the model ( 60 , 66 ). Then, PA decomposes the correlations and covariations to establish direct and indirect effects and causality ( 66 , 67 ).
In particular, the structural model estimates coefficients for the hypothesized relationships, such that the differences between the variance-covariance matrices of the model and the sample are minimized. This process is typically done through the maximum likelihood method and may be modified slightly based on the type and probability distribution of the variables ( 52 ). In this study, we used the marginal maximum likelihood method, a variation of the maximum likelihood method that accounts for categorical, binomial, and discrete variables ( 51 , 66 , 67 ).
PA was applied to build three structural models for grocery, food, and other items shopping. We hypothesized numerous paths and relationships between indicators and latent variables, and eventually selected the best models (one model for each activity) based on the following tests. Since there is not a consensus about the acceptable threshold for the SEM indicators, we used two criteria for each test: a good-fit and a marginal-fit value, as recommended by Alhaimer, Irawan and Wirza, and Weston and Gove ( 42 , 54 , 68 , 69 ).
Comparative fit index (CFI): >0.9 as good fit, >0.8 as marginal fit
Tucker–Lewis index (TLI): >0.9 as good fit, >0.8 as marginal fit
Root mean square error of approximation (RMSEA): <0.05 as good fit, <0.10 as marginal fit
Standardized root mean square residual (SRMSR): <0.08 as good fit, <0.10 as marginal fit
The selected models and the associated goodness of fit measures are reported in the Results and Discusson – SEM Results section. For this study, we used the Lavaan package in the programming tool R, version 4.1.0.
Results and Discussion
This section is divided into two subsections: the first one offers a descriptive analysis of how people changed their shopping behavior during the pandemic and how they expect to change it in the future. The second section reports the SEM results, including the CFA and PA results.
Behavior Change Groups
To understand how people changed and expect to change their shopping behaviors throughout the pandemic, we estimated the changes in shopping frequency between the three phases of the pandemic (pre-, during-, and post-pandemic). Frequency in this context is calculated as the number of days in a month. We defined Initial Change as the difference between reported shopping frequencies in the pre-pandemic and during-pandemic phases, and Expected Future Change as the difference between the during-pandemic reported shopping frequency and the expected shopping frequency post-pandemic. Any increase or decrease in frequency smaller than 3 days a month was considered as no change.
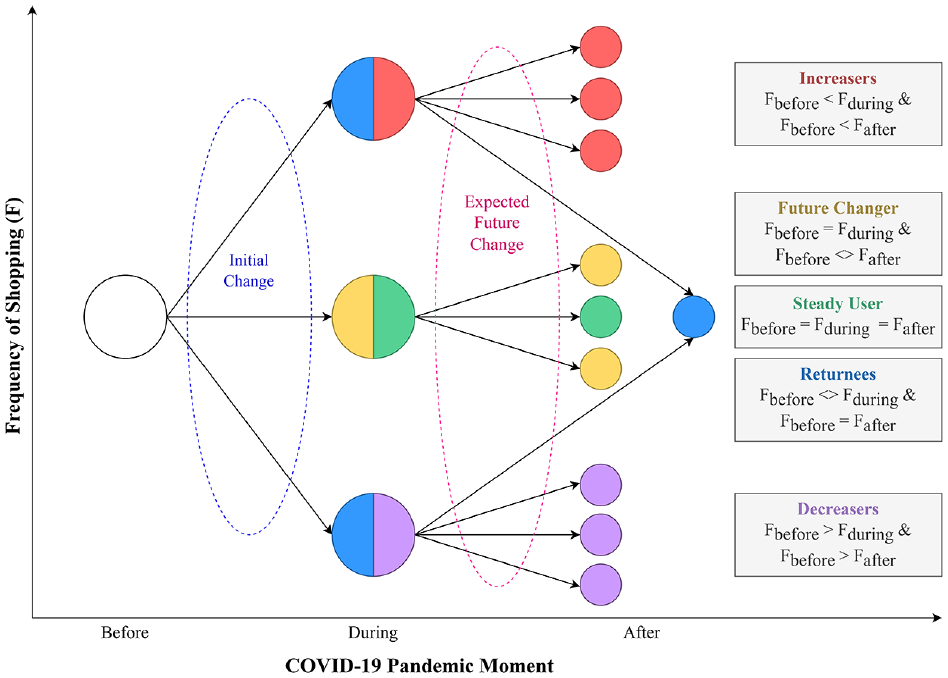
We then classified the respondents into five groups as follows, based on their initial and late frequency changes. The groups are also shown in Figure 3.
Increasers: Those who increased their shopping frequency during the pandemic, and expect to maintain a post-pandemic frequency higher than the pre-pandemic frequency.
Future Changers: Those who did not change their shopping frequency during the pandemic, but they expect to change it after the pandemic.
Steady Users: Those who did not change their shopping frequency during the pandemic, nor expect to change it after the pandemic.
Returnees: Those who increased or decreased their shopping frequency during the pandemic, but expect to return to their pre-pandemic frequency after the pandemic.
Decreasers: Those who decreased their shopping frequency during the pandemic, and expect to maintain a post-pandemic frequency lower than the pre-pandemic frequency.
The five groups did not present significant differences in their age, income, or occupation distributions. However, for all activities, online shopping Increasers have a higher percentage of females, and online shopping Decreasers are less educated with a larger percentage of non-Whites. Moreover, we found that in-store shopping Decreasers and Returnees and online shopping Increasers had higher perceived risks of COVID.
Changes in shopping frequency between the three phases of the pandemic (pre-, during- and post-pandemic).
Figure 4 shows the changes in the sample’s shopping frequency throughout the pandemic for the three online and in-store activities (grocery, food, and other items). As can be seen, in-store and online activities present different trends for all three activities: the number of Returnees is at least three times higher for in-store activities, while online shopping has a larger number of Increasers and Steady Users.
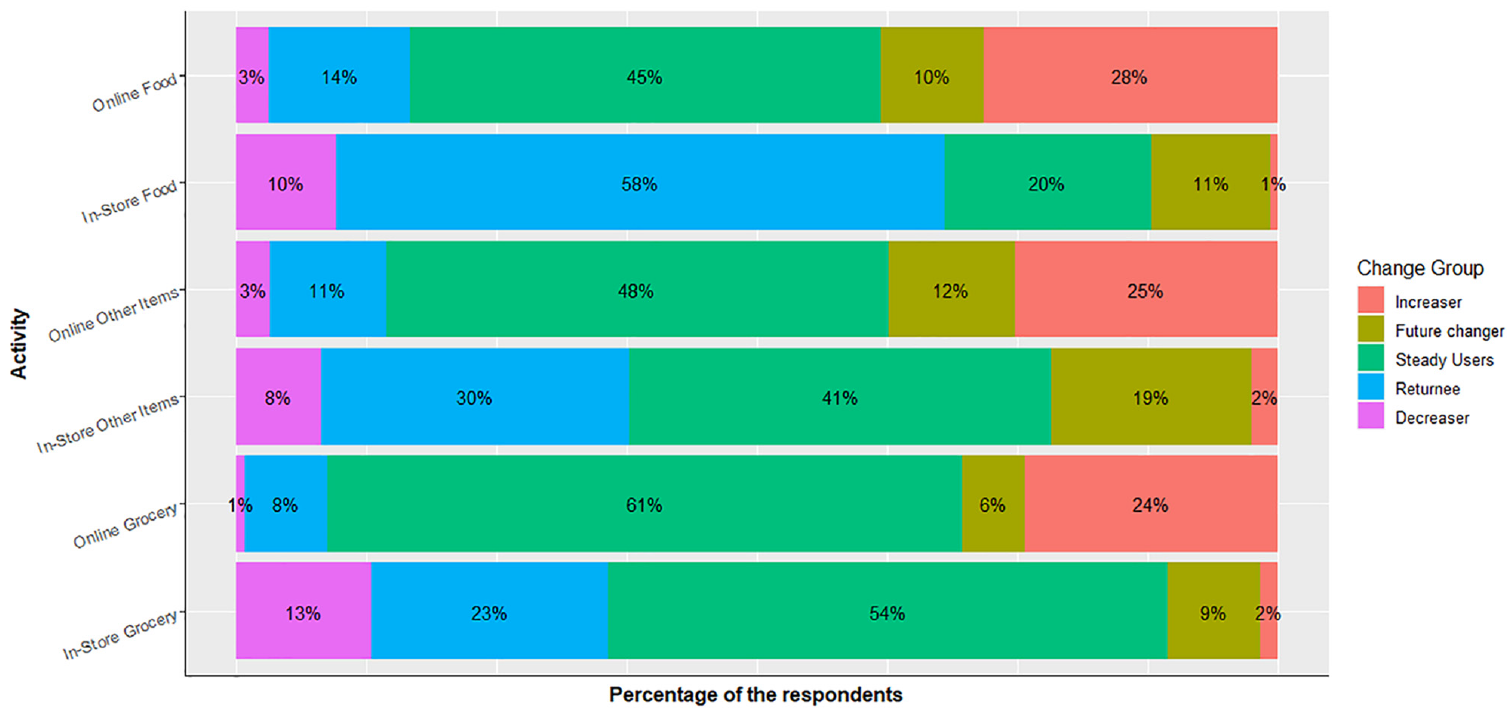
The change in sample’s shopping frequency throughout the pandemic for the three shopping activities.
On average, 25% of respondents increased their online shopping activities, but only 8%–13% decreased their in-store activities. This shows that the increase in online shopping throughout the pandemic was not merely because of the substitution of in-store activities, and that people had other reasons/motives for increasing their online shopping. Moreover, there is a notable difference between the three activities. For food and other items, the number of in-store Decreasers was about one third of the online increasers. However, the corresponding ratio was more than half for grocery items. This suggests that the substitution effect of online shopping is much larger for grocery items compared with non-grocery items, and that for food and other items online shopping plays more of a complementary role that a substitution role. This is in line with the findings of a few previous studies ( 70 – 72 ), and as Pavel (2010) argued, probably because the information and communication technology (ICT) potential to replace in-person activities reduces as the necessity of that activity decreases ( 73 ).
A majority (∼75%) of the respondents who increased their online shopping frequency during the pandemic expect to maintain the same behavior after the pandemic, while 63%–85% of the people who decreased their in-store shopping frequency during the pandemic plan to return to their pre-pandemic frequencies once the virus threat subsides.
About half the sample (41%–61%) did not change nor expect to change their pre-pandemic behaviors (i.e., Steady Users) for almost all activities, except for restaurant dine-in (in-store food shopping), for which the Steady Users represent only 20% of the sample. Dining in a restaurant had the largest percentage (58%) of Returnees, followed by in-store other items shopping (30%) and in-store grocery shopping (23%). Overall, about 60%–80% of the respondents expect to repeat their pre-pandemic behaviors after the pandemic, combining Returnees and Steady Users.
When looking at changes between the waves, the proportion of in-store Returnees constantly decreased as the pandemic subsided (i.e., between Waves 1 and 3). For example, the percentage of Returnees for in-store grocery shopping dropped from 27% to 15%. Other items and food saw a similar trend, with respective drops from 40% to 16% and from 68% to 41%. Conversely, the proportion of in-store Steady Users increased during the pandemic for all the activities. This suggests that some people who expected to return to their pre-pandemic shopping frequency after the pandemic did so sometime in the mid and late pandemic.
The change groups for online shopping for groceries and other items remained the same across the three waves. Online food shopping is the only online activity with noticeable changes between early and late pandemic: the percentage of Returnees decreased by 8%, and Steady Users and Increasers each grew by 4% during that period.
SEM Results
The results are presented for the three stages that were explained in the Methods – SEM Specifications section: CFA, PA, and SEM.
Confirmatory Factor Analysis (CFA)
Table 2 shows the CFA results for the two latent variables, CRP and ATS. The indicators used to estimate CRP are the Mask Mandate, Physical Distancing, Family Expectations, Family Risk, and Media Exaggeration. We tested Stay at Home and Business Shutdown indicators as well, but discarded them because of collinearity issues with other indicators. The three models present similar CRP coefficients. The coefficient signs imply that people with higher CRP are more likely to comply with control measures and are more mindful of their close ones’ opinions and health risks. Conversely, people with low CPR believe the media exaggerated the spread of the virus.
Confirmatory Factor Analysis (CFA) Results
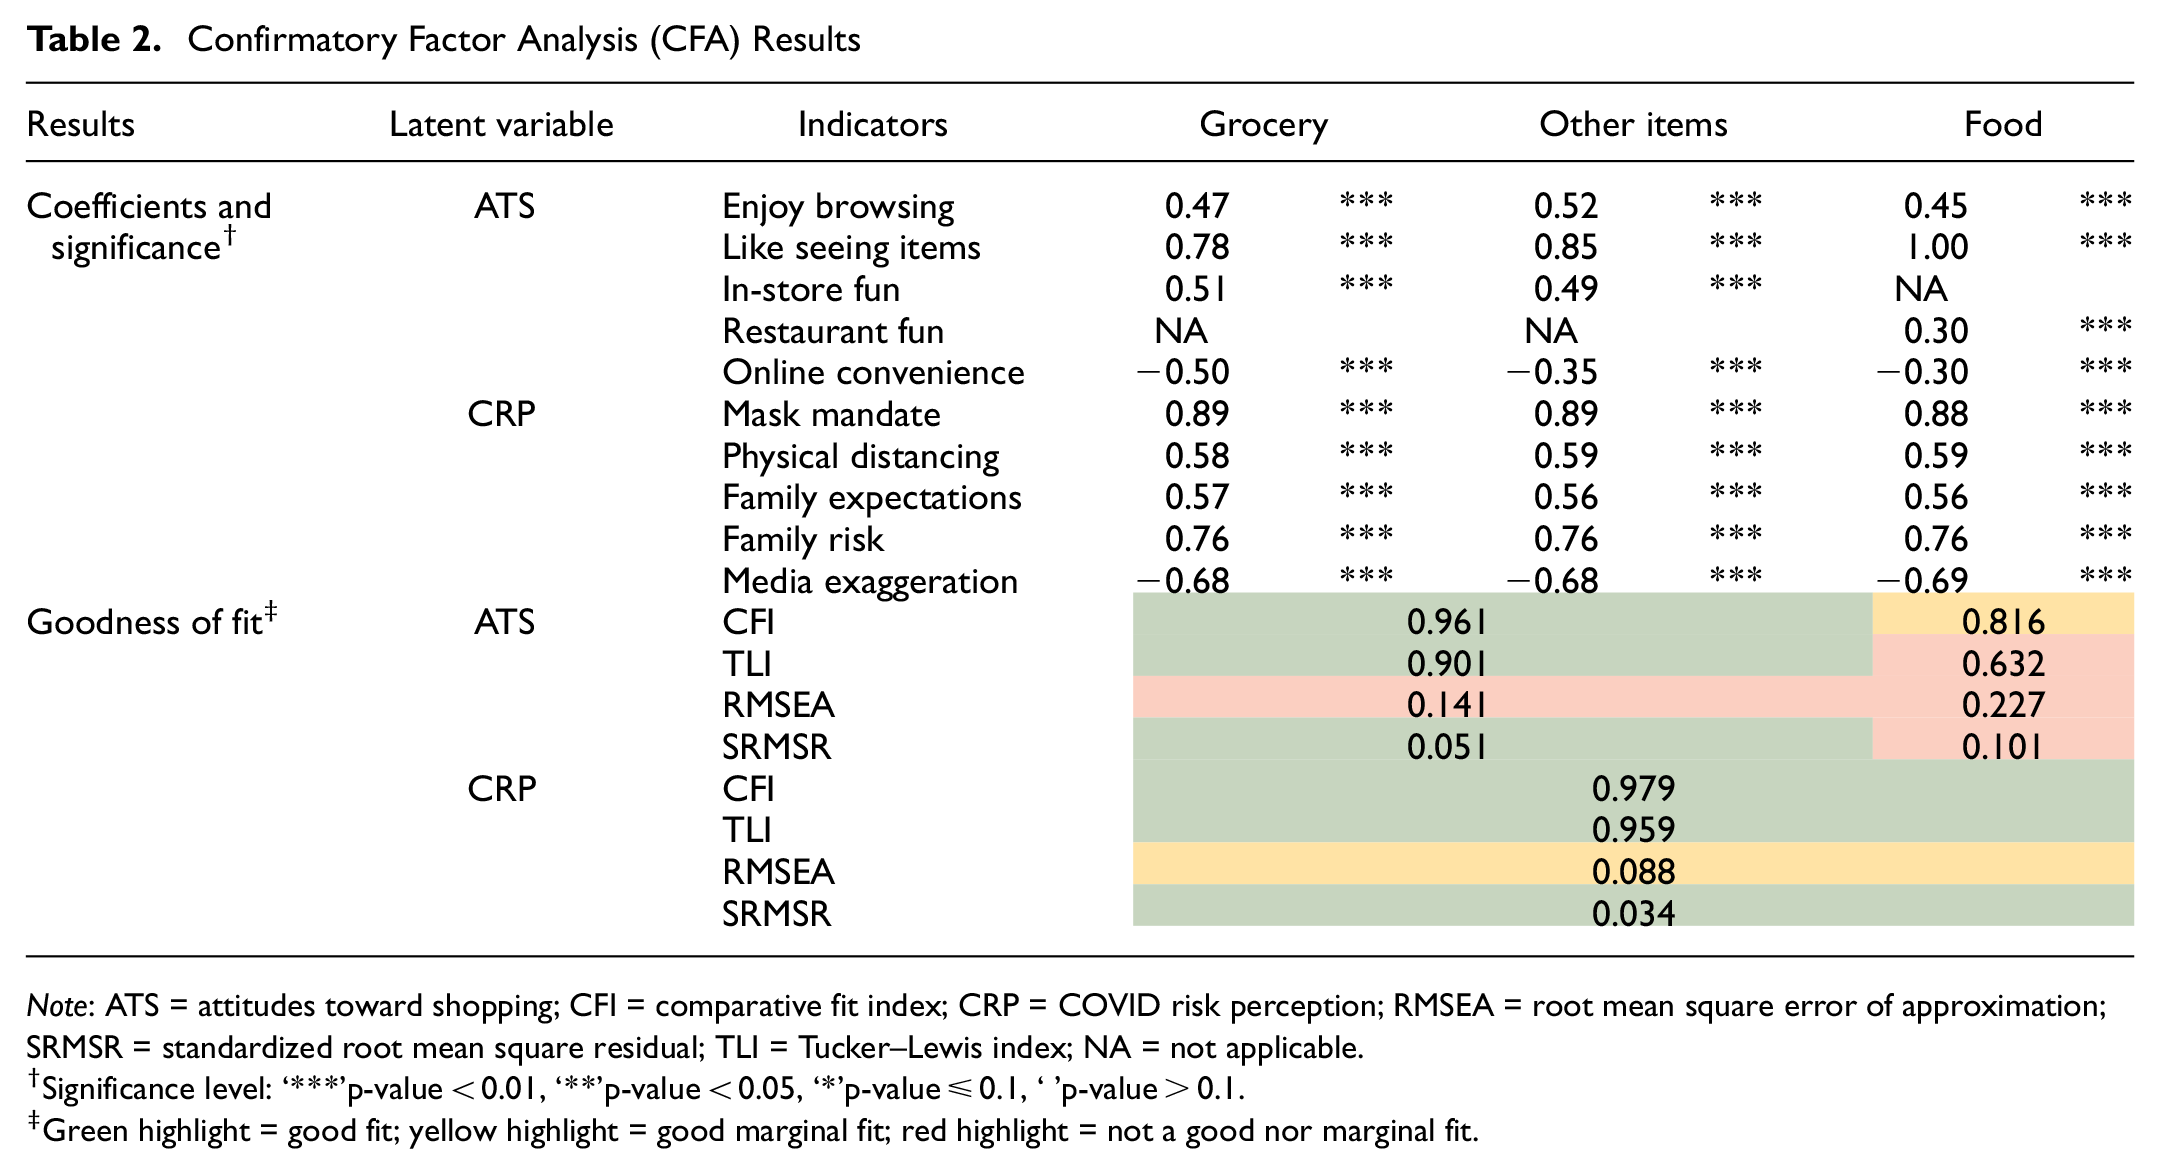
Note: ATS = attitudes toward shopping; CFI = comparative fit index; CRP = COVID risk perception; RMSEA = root mean square error of approximation; SRMSR = standardized root mean square residual; TLI = Tucker–Lewis index; NA = not applicable.
Significance level: ‘***’p-value < 0.01, ‘**’p-value < 0.05, ‘*’p-value ≤ 0.1, ‘’p-value > 0.1.
Green highlight = good fit; yellow highlight = good marginal fit; red highlight = not a good nor marginal fit.
For the ATS variable, the indicators vary slightly across the three models: models for grocery and other items include the In-store Fun variable, while the food model includes the Restaurant Fun variable. Of the four indicators, the first three are associated with ATS with a positive sign, while Online Convenience has a negative sign. A higher ATS value means a larger tendency toward in-store shopping. We tested different combinations of indicators, such as separating the attitudes toward in-store and online shopping, and including Prefer Online, but the models in Table 2 are the best ones. However, while the goodness of fit measures for the latent variables in the grocery and other items models are within the desired range, the ATS latent variable in the food model did not show a good fit.
Path Analysis (PA)
Figure 5 shows the structure of the grocery model, derived from PA. We hypothesized different causal relationships between variables, and the selected paths are as follows. People’s socio-demographic characteristics affect their CRP, ATS, and pre-pandemic in-store and online shopping frequencies. The aforementioned variables and the pandemic moment affect how people changed their shopping frequencies during the pandemic. Finally, people’s during-pandemic in-store and online shopping frequencies and their ATS affect their expected shopping frequencies post pandemic. Models for food and other items have a similar structure. The PA results for all three models are presented in the next subsection.
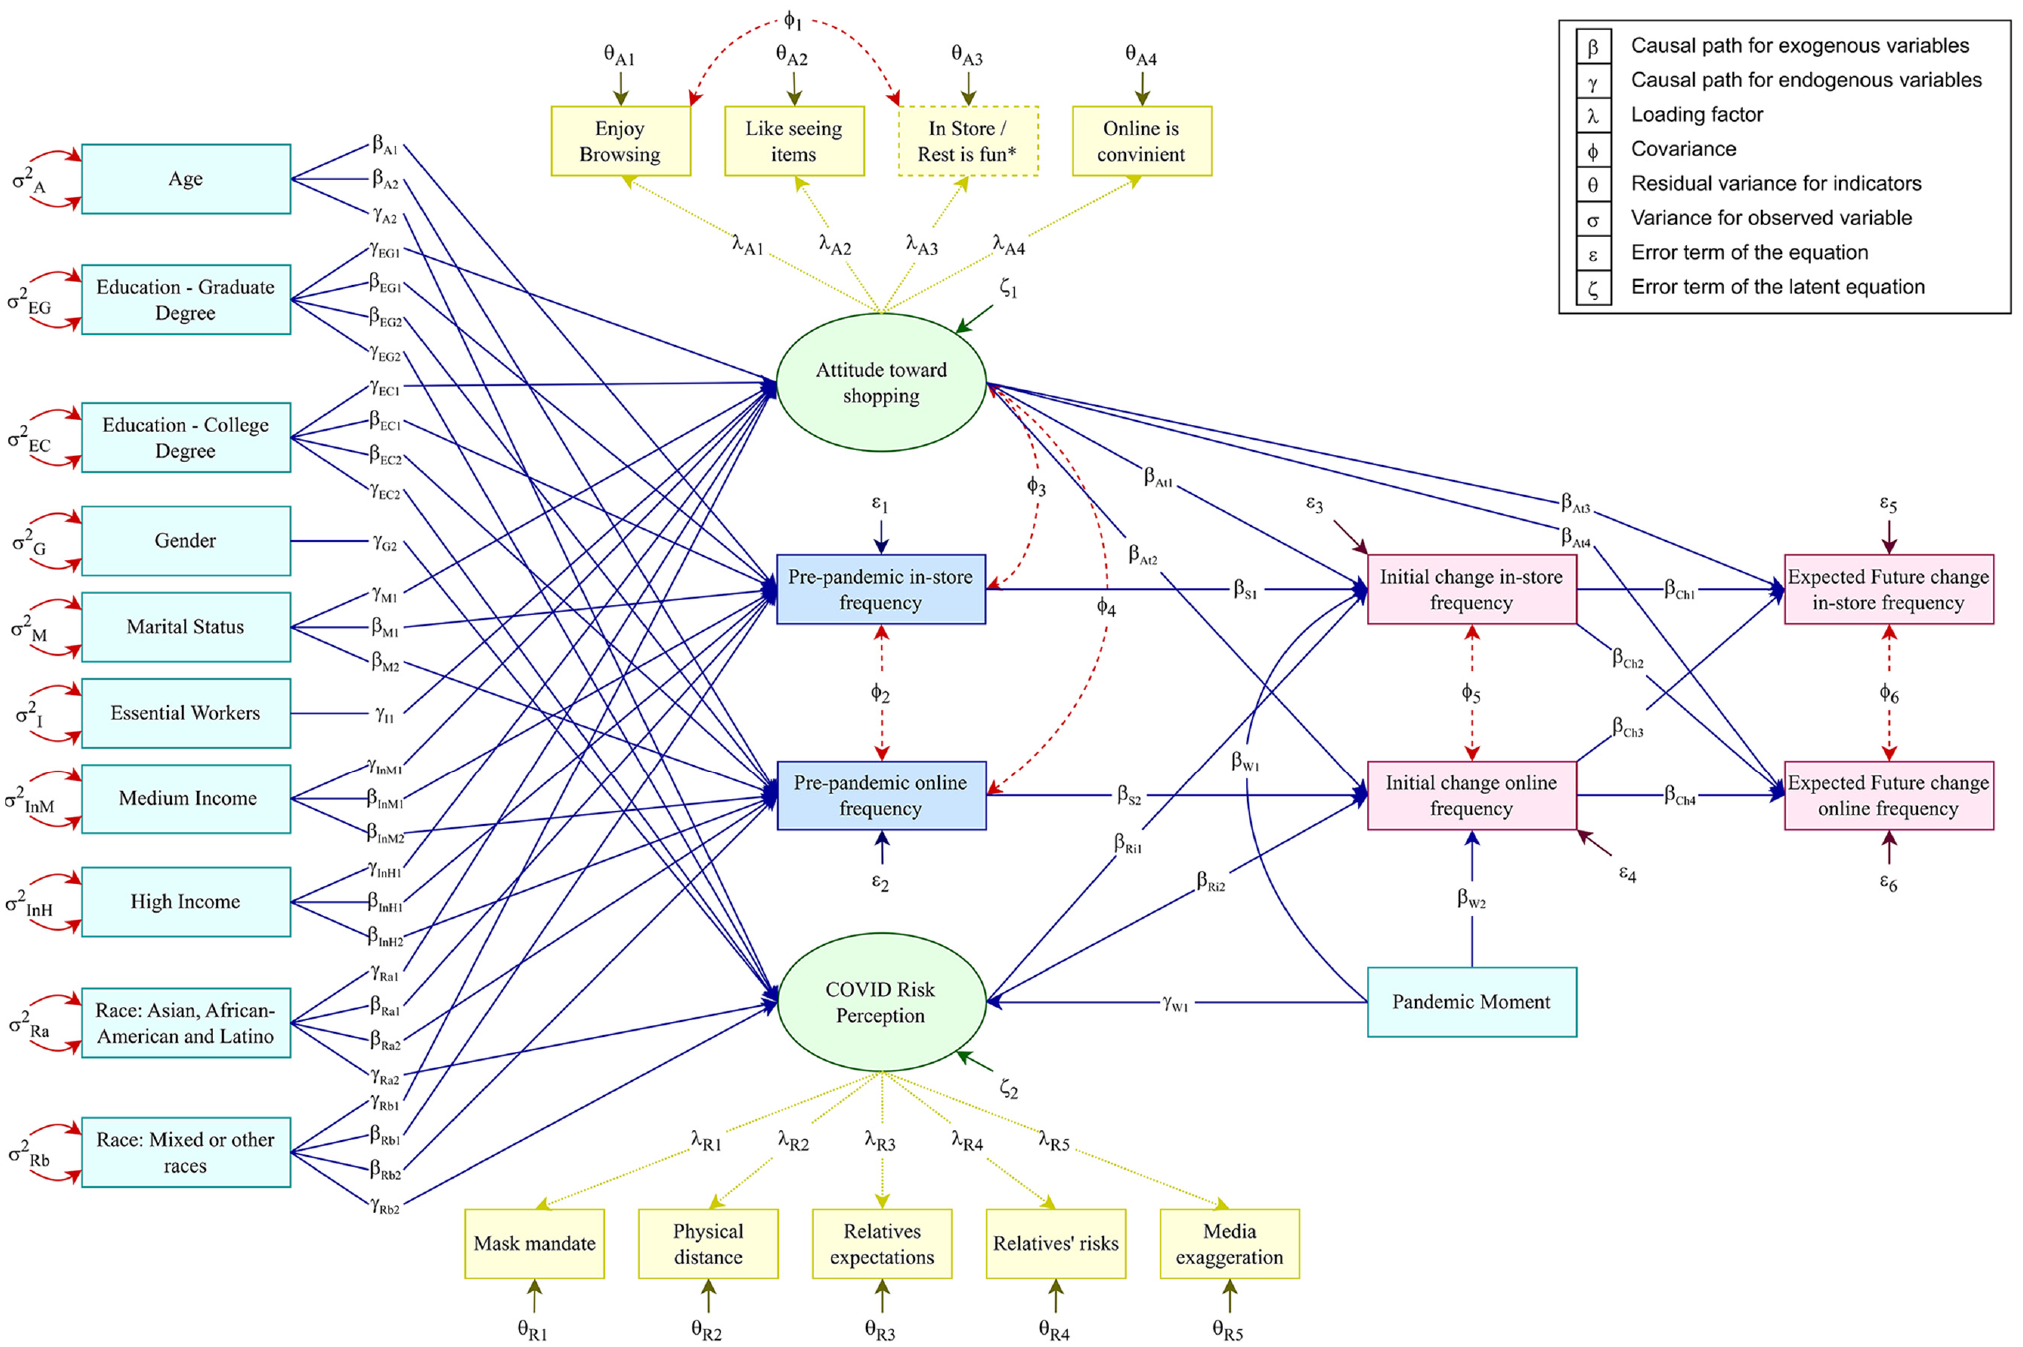
Structure of the grocery model, derived from the path analysis (PA).
We also hypothesized and analyzed covariation paths. Table 3 shows the covariation analysis results for all three models. We found that Enjoy Browsing and In-Store is Fun are correlated and that the pre-pandemic online and in-store shopping frequencies depend on each other. The results showed that people’s frequency of shopping in-store for other items pre-pandemic was independent of their ATS. But for all other cases, it was shown that people with higher ATS shopped more frequently in-store and less frequently online. For initial frequency change (during the pandemic), the negative and significant covariations between online and in-store variables show that as people increased online shopping, their in-store shopping decreased. Conversely, the covariations for expected future frequency change between online and in-store variables is positive (except for grocery which is statistically insignificant), suggesting that in-store and online shopping for food and other items will have a complementary impact on one another in the post-pandemic era, and people who plan to increase their in-store shopping also expect to increase their online shopping.
Structural Equation Model (SEM) Covariation Results
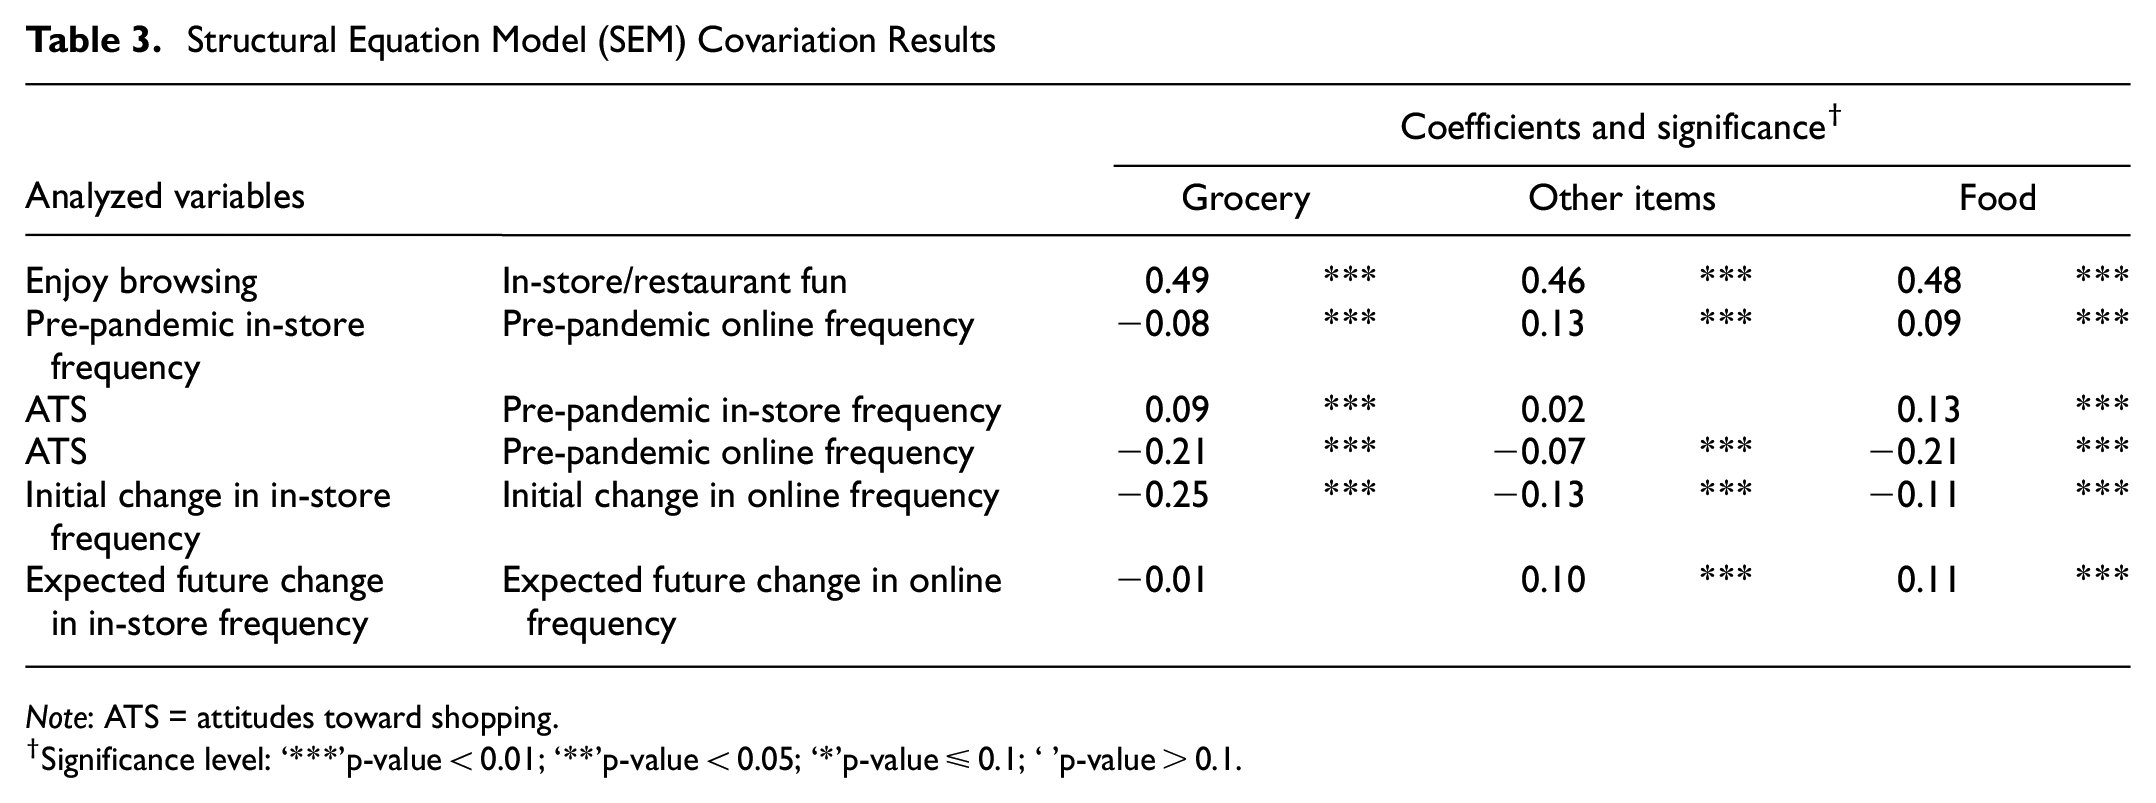
Note: ATS = attitudes toward shopping.
Significance level: ‘***’p-value < 0.01; ‘**’p-value < 0.05; ‘*’p-value ≤ 0.1; ‘’p-value > 0.1.
SEM Results
Table 4 shows the SEM results. Based on the goodness of fit indicators, all three models fit the data well and can describe the sample’s behavior. However, the Grocery model presents the best fit for the data.
Structural Equation Modeling (SEM) Results
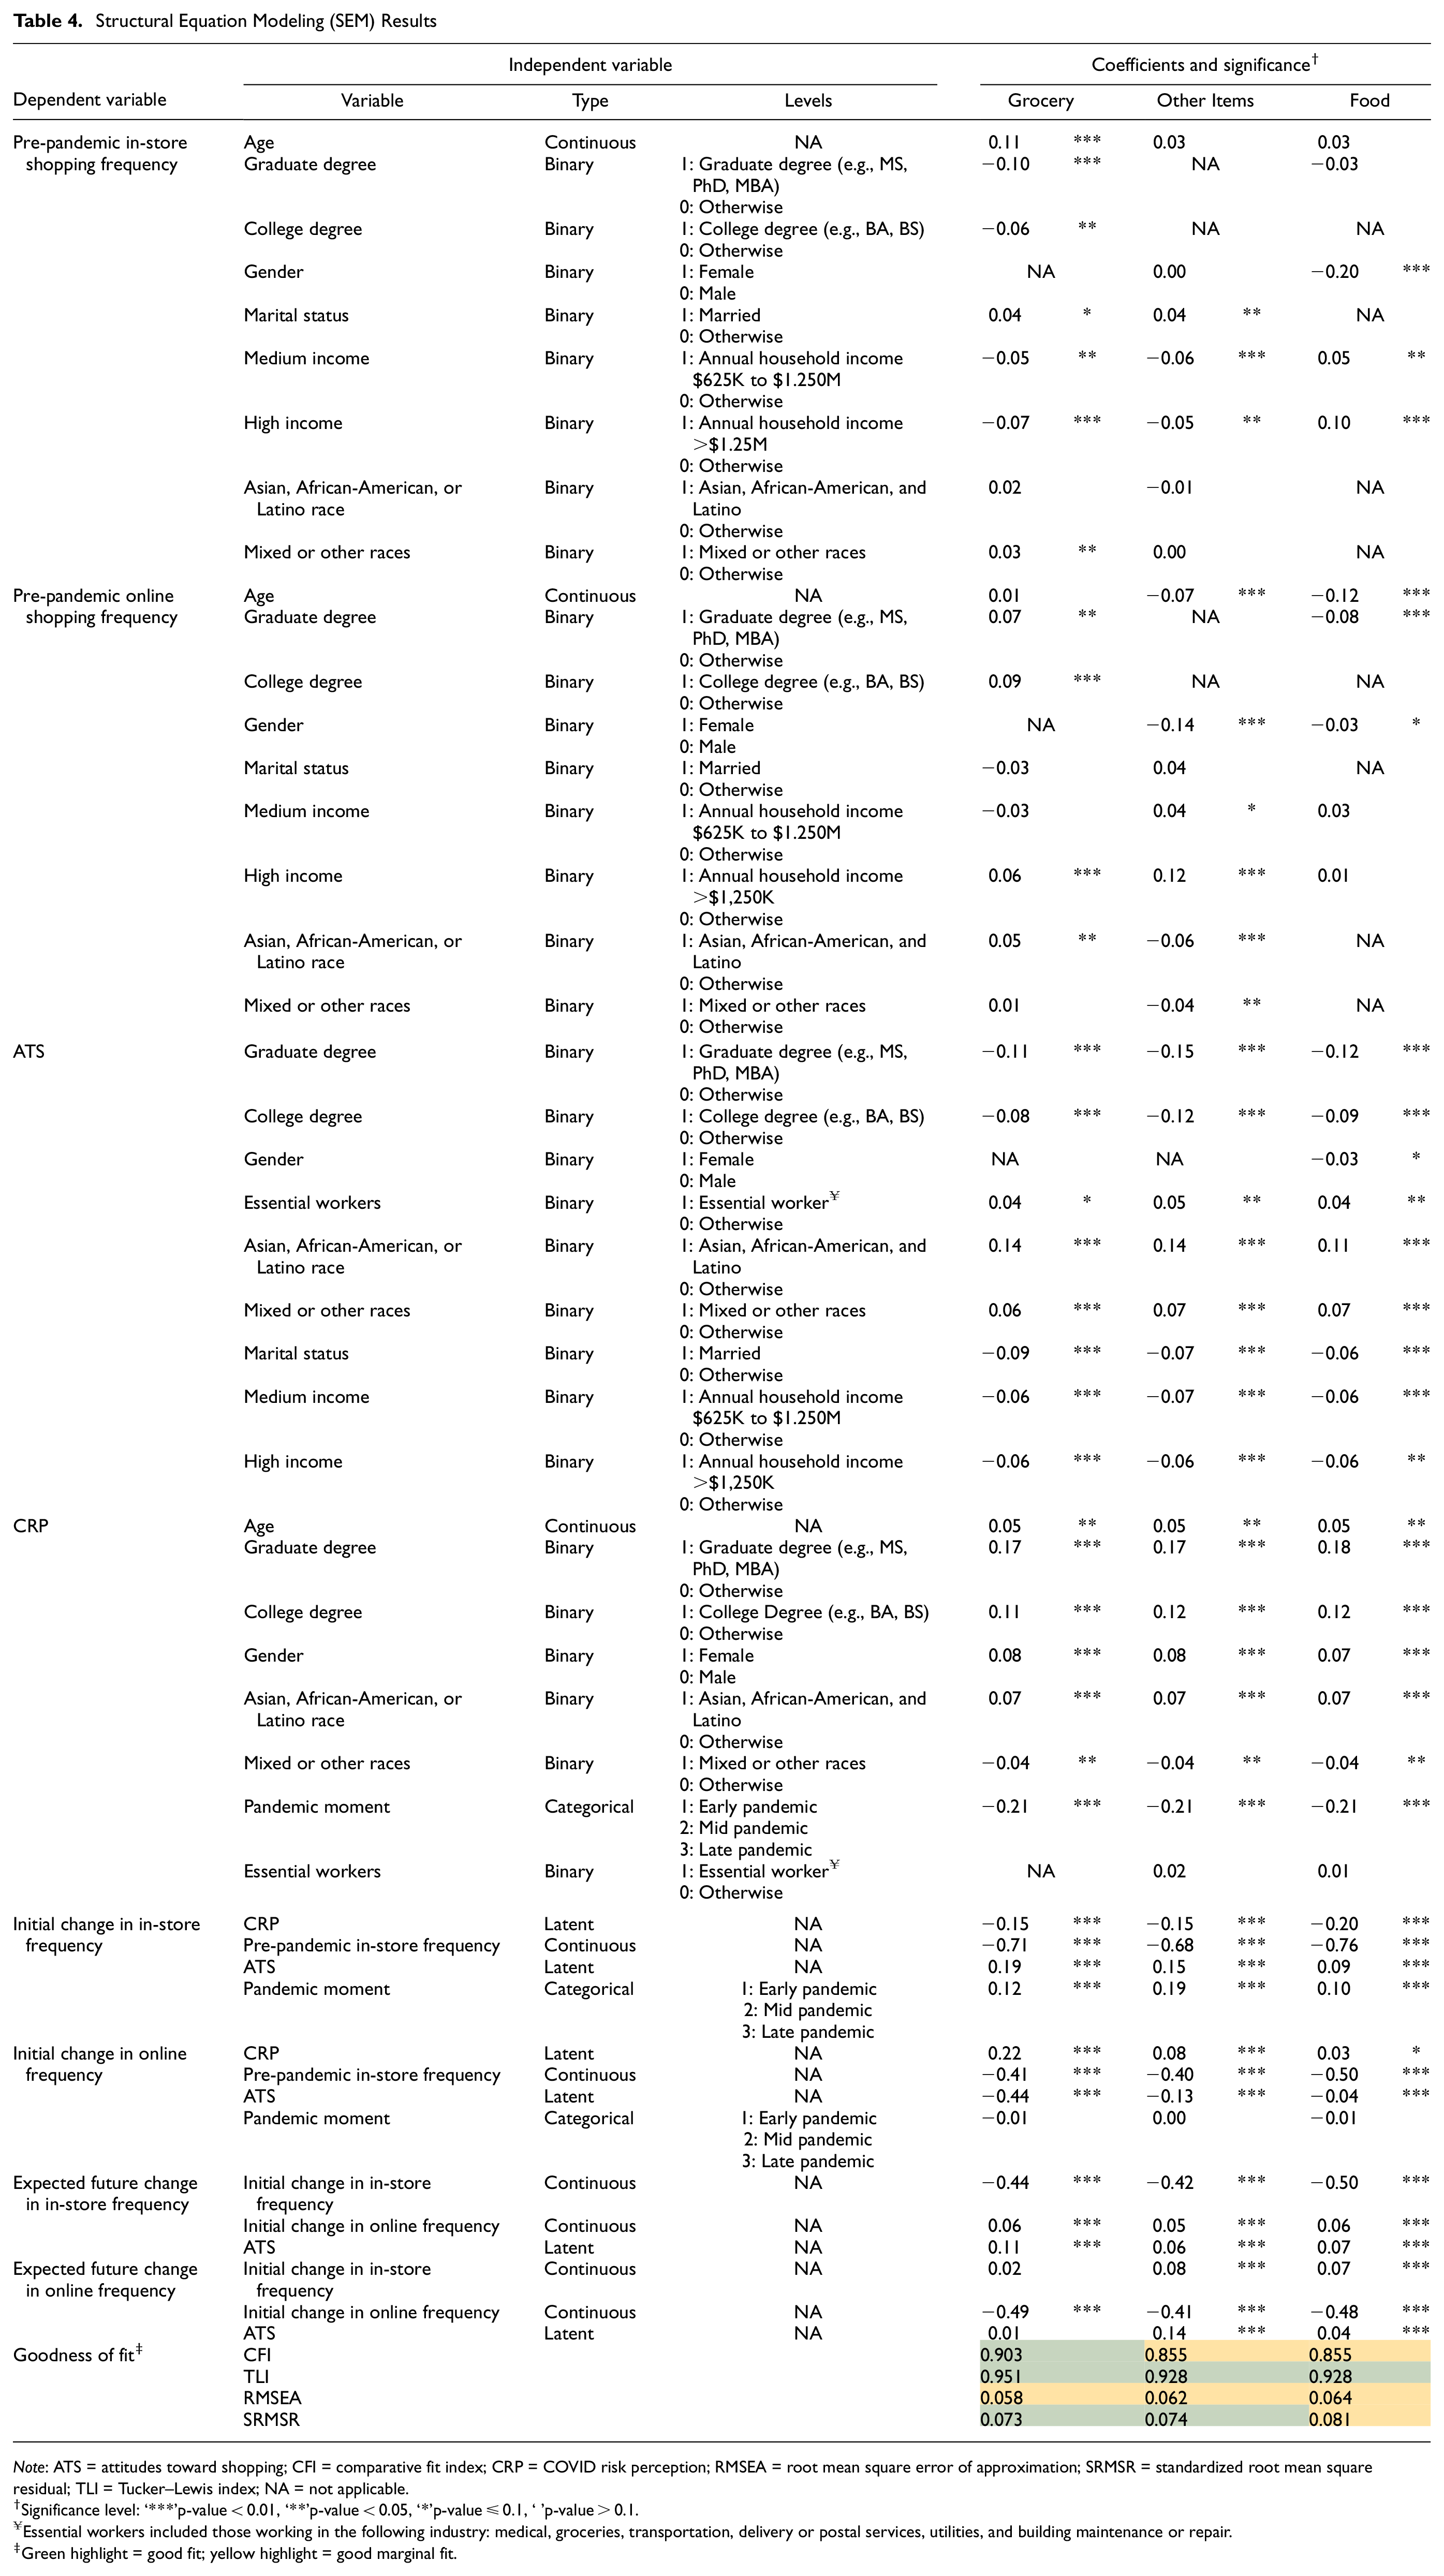
Note: ATS = attitudes toward shopping; CFI = comparative fit index; CRP = COVID risk perception; RMSEA = root mean square error of approximation; SRMSR = standardized root mean square residual; TLI = Tucker–Lewis index; NA = not applicable.
Significance level: ‘***’p-value < 0.01, ‘**’p-value < 0.05, ‘*’p-value ≤ 0.1, ‘’p-value > 0.1.
Essential workers included those working in the following industry: medical, groceries, transportation, delivery or postal services, utilities, and building maintenance or repair.
Green highlight = good fit; yellow highlight = good marginal fit.
The results showed that, for pre-pandemic shopping frequency, age was not a significant predictor for in-store shopping of other items or food; however, it was shown that older people did in-store grocery shopping more frequently than younger people. For online shopping, though, it is the opposite. Age did not have a significant impact on online grocery shopping frequency as, for most part, online grocery shopping was not so typical among any age group before the pandemic. Nonetheless, age is negatively correlated to food and other items online shopping frequency, meaning that younger people used to do more online shopping (other than groceries) and food ordering than older people did.
Marital status was found as a significant variable for in-store shopping frequency (grocery and other items) before the pandemic, showing married people went to stores more often than single people, but it did not turn out to be a significant predictor for any type of online shopping.
Race did not show a significant impact on pre-pandemic in-store shopping frequency, except for grocery shopping. White, Asian, African-American, and Latino people did in-store grocery shopping at similar rates and lower than other races. On the other hand, White people were more likely to shop other items online and less likely to shop groceries online compared with the other races.
It was indicated that, before the pandemic, people with medium and high income (>$625K per year) were less likely to go to stores for shopping groceries and other items compared with low-income people. Conversely, those higher-income groups used to dine in restaurants more frequently. The results also showed that, before the pandemic, men used to go to restaurants more frequently than women. They also had a higher frequency of buying items (other than grocery) online and ordering food for delivery compared with women.
Looking at the CRP variable, we found that the pandemic moment significantly affected CRP, in that CRP subsided from early to late pandemic, as the knowledge about the virus and its consequences increased, the vaccines were developed, and the virus weakened over time. Asian, African-American, and Latino people showed a higher CRP compared with White people, which reflects the disproportionately high impacts of the pandemic on people of different races. The elder population, women, and educated people (with a college degree or higher) showed a higher CRP, and, surprisingly, being an essential worker did not significantly affect people’s CRP.
For all the three shopping activities, CRP had opposite effects on in-store and online shopping behaviors during the pandemic: the higher the CRP, the larger the increase in online shopping frequency and the decrease in in-store shopping frequency. However, the impact varies across the three activities for online shopping. While the CRP for other items and food shopping was about the same, people were more likely to increase their online shopping for groceries because of a higher risk perception during the pandemic.
For the ATS variable, the results showed that White people, couples, those with higher education, and those with higher income are more inclined toward online shopping, and essential workers are more likely to purchase items in store.
When analyzing the in-store shopping frequency change between pre- and during-pandemic phases (initial change), the results show that the change is heavily dependent (presenting largest coefficient) on people’s pre-pandemic in-store shopping frequency, but people also changed their shopping frequency based on the pandemic moment, how threatened they felt by the virus (CRP), and how they felt about in-store and online shopping (ATS). The results for online shopping frequency change between pre- and during-pandemic phases (initial change) were quite different, though. While the pre-pandemic online shopping frequency was still a significantly large predictor, its impact size was not very different from those of ATS and CRP. Also, the pandemic moment did not present a significant effect in either model.
As for the expected future changes, the three models show similar coefficients for all the dependent variables. Interestingly, if people increased their online shopping during the pandemic, they expect to increase their in-store activity in the future, and vice versa. A possible explanation is the substitution effect: people increased their online shopping frequency during the pandemic partly because of COVID-related limitations which prevented them from in-store shopping, and they expect to decrease their online shopping frequency and increase their in-store shopping frequency after the pandemic. However, the coefficients for in-store activity are seven to eight times smaller than those of the online activity. Therefore, while online shopping will grow at a higher pace, neither activity will entirely substitute the other one in the future.
Conclusions
We used descriptive analysis and SEM to find the direct and indirect factors that determine how people changed their in-store and online shopping behaviors during the pandemic and how they expect to shop in a post-pandemic era. We modeled online and in-store shopping activities jointly for three types of goods: groceries, other items, and food.
We defined two latent variables: CRP and ATS. The CRP score was derived from people’s opinions and beliefs about the seriousness of the pandemic, effectiveness of the control measures, and friends’ and families’ expectations and health risks. Higher CRP led to a larger increase in online shopping frequency and a larger decrease in in-store shopping frequency. The CRP also declined as the pandemic subsided. The ATS score was estimated based on the joy and/or convenience that people felt about online or in-store activities, and higher ATS meant a larger tendency toward in-store shopping. The SEM model showed that pre-pandemic shopping frequencies, CRP, and ATS were affected by people’s socio-demographic characteristics. The elderly, women, non-White, and highly educated people showed a higher CRP, and White people, married couples, non-essential workers, those with higher education, and those with higher income showed a larger tendency toward online shopping. Moreover, the covariations in the model indicated that, during the pandemic, online shopping played a substitutionary role for in-store shopping across all three shopping activities, meaning people increased online shopping as they decreased in-store shopping. For a post-pandemic era, though, the substitutionary role stays for grocery shopping: in-store and online shopping activities for food and other items shopping will be complementary, and people who plan to increase their in-store shopping for those goods also expect to increase their online shopping.
The SEM models revealed that people’s in-store and online shopping frequencies are decided based on several direct and indirect factors. During the pandemic, in-store shopping frequency was influenced indirectly by people’s socio-demographic characteristics and directly by the pandemic moment (early, mid, late), people’s CRP, ATS, and, most importantly, their pre-pandemic shopping frequencies. For online shopping, though, the direct predictors were slightly different: pre-pandemic online shopping frequency, ATS, and CRP affected people’s online shopping frequency during the pandemic, but the pandemic moment did not have a significant effect on it. It can be interpreted that people decreased their in-store activities at the beginning of the pandemic but increased them again over time as the pandemic subsided. Conversely, people changed their online shopping early in the pandemic and retained those behaviors during the pandemic. The models also showed that how people expect to change their online and in-store shopping post pandemic depends on their ATS and online and in-store shopping frequencies during the pandemic.
We also classified people based on their shopping frequencies before, during, and after the pandemic into five groups—Increasers, Decreasers, Steady Users, Returnees, and Future Changers—and analyzed the similarities and differences among them for online and in-store shopping activities. The five groups did not show significant differences in relation to age, income, and occupation. However, for all types of goods, online shopping Increasers included a higher percentage of females, and online shopping Decreasers were less educated and had a larger percentage of non-Whites. Moreover, in-store Decreasers and Returnees and online Increasers showed higher perceived risks of the virus.
The analysis showed that most people plan to return to their in-store pre-pandemic shopping behaviors while continuing to shop online. At least one third of the sample changed (either increased or decreased) their in-store and online shopping frequencies during the pandemic, and more than half of the respondents (∼60%–80%) expect to maintain or return to their pre-pandemic in-store shopping behaviors post pandemic. In-store and online activities presented different trends, in that, across all three activities, the percentage of people who expect to return to their pre-pandemic behaviors post pandemic were much higher (three times or more) for in-store activities, while online shopping had a larger percentage of people who either did not/expect to not change or kept/expect to keep increasing their frequencies during and post pandemic. It was also indicated that half of the sample increased their online shopping frequency, most of whom (∼75%) expect to maintain the new increased frequency post pandemic.
Moreover, although some people decreased their in-store shopping early in the pandemic, they expect to increase that after the pandemic. Therefore, we did not observe major changes in the expected shopping frequencies for a post-pandemic era compared with stated frequencies late in the pandemic (Wave 3).
The results also showed that the decrease in in-store shopping is much smaller (one third to half) than the increase in online shopping. This shows that large increases in online shopping throughout the pandemic were not entirely because of restrictions and the high CRP which cancelled in-store shopping activities; rather, more than half the respondents who increased their online shopping frequency during the pandemic did so for other reasons, supposedly such as convenience and easy alternatives comparison. It was also indicated that neither online nor in-store activity will entirely substitute the other in the future.
The data for this research came from the Puget Sound region in Washington State, U.S., so the specific findings and statistics will probably not hold for other regions. However, we believe the findings about the hows and whys of behavior changes over time, as well as the similarities and differences between the three types of shopping, provide interesting and somewhat unique insights into people’s shopping behaviors, generally and for a post-pandemic era.
Because of the limited number of psychometric questions in the survey, we defined a single latent variable (ATS) which included both online and in-store shopping for the three activities. Including more psychometric questions in the survey could help develop separate latent variables for in-store and online shopping or for the each of the three shopping activities, which could, in turn, result in better CFA and SEM estimates.
Footnotes
Author Contributions
The authors confirm contribution to the paper as follows: study conception and design: J. M. Diaz-Gutierrez, A. Ranjbari; data cleaning and processing: J. M. Diaz-Gutierrez; analysis and interpretation of results: J. M. Diaz-Gutierrez, H. Mohammadi-Mavi, A. Ranjbari; draft manuscript preparation: J. M. Diaz-Gutierrez, H. Mohammadi-Mavi, A. Ranjbari. All authors reviewed the results and approved the final version of the manuscript.
Declaration of Conflicting Interests
The author(s) declared no potential conflicts of interest with respect to the research, authorship, and/or publication of this article.
Funding
The author(s) received no financial support for the research, authorship, and/or publication of this article.