
Abstract
Many European train drivers face major changes in their work with the introduction of the new train-protection system, the European Rail Traffic Management System (ERTMS), as information retrieval shifts from outside to in-cab, and a new rulebook is introduced. Therefore, many train drivers have to be educated in a short time, to make the transition safe and efficient. The purpose was to find out how a successful ERTMS practice can be designed in a physically low-fidelity but highly functional train-driving simulator. An experimental design was used, with 16 drivers divided into two groups: one group practiced in a simulator, and the other in reality. Standard training methodology was used, and the learning outcome was assessed by both measuring driving errors and via instructor evaluation of a simulator test. The drivers also filled in a questionnaire to capture how different factors, such as repeated practice, experience, and self-estimated confidence, correlate with performance. Results show that the simulator group committed significantly fewer driving errors and received significantly higher scores from the instructor. In addition, the simulator group's better performance is mostly caused by the possibility of repeated training of different special cases. The findings also imply that several of the more common special cases on the ERTMS can hardly be provoked in real train driving. Furthermore, this work strengthens the theory that novices can hardly estimate their own ability. Therefore, we argue that this type of low-fidelity simulator is well suited for research purposes, for practicing special cases, and for train operation companies to assess drivers’ skills.
Introduction
Sweden, as in many other countries in Europe, is in an expansive phase of replacing the national signal- and train-protection system with the European Rail Traffic Management System (ERTMS), aiming for increased railway efficiency and to simplify border crossings in Europe through a more harmonized train-driving environment ( 1 ). This development entails a major change for the drivers’ work tasks, including new regulations, information retrieval shifting from lineside to in-cab ( 2 ), new speed profiles ( 3 ), and a changed way of operational communication ( 4 ). Therefore, this globally changing train-driving environment is becoming a very important issue that needs more attention. For Sweden's train operation companies (TOCs) to make the transition safe and efficient, the rollout of the ERTMS requires educating many drivers in a short time. Five-to-eight days (depending on the TOC) of supplementary education whereof about three days is theoretical is needed for active drivers. However, after this education, train drivers still feel insecure when driving in the new ERTMS environment and their concerns are mainly with regard to handling of special cases (i.e., events that do not occur during a routine drive, but the handling of the situation is regulated). This sense of insecurity can be traced to inadequate practice since reality is difficult to control ( 5 ). In Sweden a (physically) low-fidelity simulator (LFS) is widely used within the education of train drivers ( 6 ), and for this study, such a simulator was utilized to examine how effective ERTMS training can be designed.
Simulator Fidelity
A driving simulator's physical fidelity is categorized by its field of view, the degree of the moving base, and the physical resemblance to a real cab ( 7 ). A high degree of motion and field of view is of importance to reproduce speed control and lane position, similar to real driving ( 7 , 8 ), while physical fidelity is less important for novices and when training special cases ( 9 , 10 ). Since a train does not need steering and the speed handling of a passenger train (with an electro-pneumatic braking system) is fairly simple, a LFS is suitable for training passenger-train drivers in the ERTMS and for practicing different special cases that come with the new system. Important, however, is the functional fidelity, to avoid mislearning ( 3 , 11 ).
Simulator Research and Training
Train-driving simulators have been used for education and research purpose for a long time ( 12 ) and previous studies describe several experiments. Verstappen ( 13 ) studied the effect of distraction and showed that a non-considerate person in the cabin led to poorer task completion than driving alone. Other experiments have shown that fatigue and monotonous driving combined with low task-demands impede performance and lead to increased risk for accident involvement ( 14 , 15 ). The impact of further automation has been investigated and the results are in line with the above-mentioned studies by stating that automatic speed control has a negative effect on drivers’ reaction time when facing a critical event ( 16 ). The introduction of the ERTMS is another technological development that, in one study, seems to decrease driver workload, at least on routes without many speed changes ( 17 ). Impaired situation awareness leading to a higher risk of incidents has been demonstrated when drivers facing two competing tasks ( 18 ), and impaired situation awareness can be the result of time pressure ( 19 ).
However, few studies present guidelines of simulator education for train drivers. Tichon ( 20 ) emphasized the importance of designing stress-training scenarios in a simulator environment where the incident cues should be as reality-like as possible to achieve the most effective training. Olsson et al. ( 21 ) studied the Swedish train-driving reality and found that training of special cases is rare and that simulator training therefore should focus on special cases that hardly can be controlled in reality. Tichon and Wallis ( 22 ) demonstrated in a train-driver simulator experiment that repetition of stress-training scenarios can be effective, especially in a short-time perspective, and that a high-fidelity simulator is not critical for an effective training. The literature in other, more explored, simulator domains (e.g., the aviation, marine, and military industries) also points out the importance of realistic and, for the target group, relevant training scenarios as well as an active instructor to maximize the learning outcome ( 23 – 26 ).
In the Swedish train-driver education, it is fair to say that the traditional training model, where the learner drives a real train together with an experienced instructor, is still the dominant method. Although simulator training has occurred on a small scale for a long time, it is only in the last six to eight years that it has become more widespread. Since 2016, without significant exceptions, only one type of simulator has been used within train driver education. This simulator is used in all basic train-driver education and by most TOCs both in annual training and when learning a new train-protection system ( 6 ). Like Australian operators, TOCs in Sweden state quality ( 10 , 12 , 20 ) and efficiency aspects (e.g., reduce training time via instant repetitions, see Myers et al. [ 10 ] and Naweed [ 12 ]), but also a lack of real trains as motivation for the use of simulator training.
Because of the lack of guidelines in the literature for designing effective train-driving simulator training, this study intends to contribute with important knowledge about how train-driver training in a simulator can be conducted in general, and how to use a LFS for ERTMS education in particular.
Self-Assessment
Several researchers have reported interesting results where the learning outcome of simulator training for novice drivers is measured via the learners' self-assessment ( 27 – 29 ). Self-assessment per se can have a positive effect on the learning experience ( 30 ). However, for novices it is often difficult to correctly calibrate their own ability ( 31 , 33 ). That novices often tend to be overconfident is described as the Dunning–Kruger effect and has been empirically substantiated in various fields ( 32 , 33 ). We argue that the drivers in this study are novices when it comes to the ERTMS with its rules and handling of the train-protection system, even though they are otherwise experienced train drivers in general. In part this study aims to find out if newly ERTMS-trained train drivers can estimate their own ability.
Aims and Research Questions
This paper aims to compare practice in a high-functional but low-physical fidelity simulator to practice in real trains according to a standard training methodology with respect to how many times learner drivers experience different special cases, to examine which variables are important when educating safe and efficient ERTMS train drivers and, finally, to investigate how drivers’ self-estimated confidence correlates with performance. To reach this aim, the following research questions were formulated.
How effective is ERTMS training in a LFS as compared to real train-driving practice? How many training opportunities for different special cases are offered when training in reality?
How does age, experience, number of repetitions of special cases, and internship time, respectively, affect performance?
How do drivers' own estimated confidence ratings correlate with performance scores in a ERTMS simulator test?
Method
Design and Participants
In line with previous driving-simulator studies ( 34 , 35 ) an experimental method was used, with train drivers from the same TOC in Sweden, stationed at two different locations (see Figure 1 for the experimental design). The participants were 11 men and five women aging between 24 and 52 years (M = 35.9 years, SD = 9.2 years) with train driver experience ranging from newly examined to 8 years (M = 1.9 years, SD = 2.5 years). After receiving the theoretical part of the ERTMS education for three days, the drivers were divided into two groups. One group (n = 8) carried out the practical part of training exclusively in a simulator environment, while a control group (n = 8) conducted the practice in reality according to the, by this specific TOC, standard training methods. The practice in reality was preferably done on non-revenue trips; however, there were some exceptions, because of vehicle shortages, during revenue service. Thus, the types and frequencies of special cases practiced could only partially be controlled by the instructor. During simulator practice, the instructor had a set of scenarios that included the special cases to choose from. The instructor could restart the scenarios and practice the different special cases again if needed. However, for some of the special cases, a simulator sequence needed to be completed before the specific case could be practiced, which meant that another special case sometimes occurred before it and thus was practiced once more. At both locations, one and the same instructor educated all drivers theoretically and practically and was responsible for seven and nine drivers, respectively. Thus, all drivers in the same location were educated by the same instructor, regardless of practice group. The number of practicing drivers in the simulator group varied between one and four per education round, and the control group practiced alone or with one other driver (the group size depended on how many drivers the TOC could spare for education during that specific period of time). The time of practice at the TOC did not change because of the number of participants; however, this probably affected the number of repetitions for each participant, which also was intended, since one purpose was to evaluate the effect of practice both as a driver and when watching a colleague practice. In training sessions with more than one driver practicing, watching drivers were expected to do this focused, as that time was also included in the practice time. To examine the training effects, the drivers filled in a questionnaire and conducted a simulator test shortly after the education. Both theory and practice were included in the regular TOC ERTMS education. The study lasted for 12 weeks.
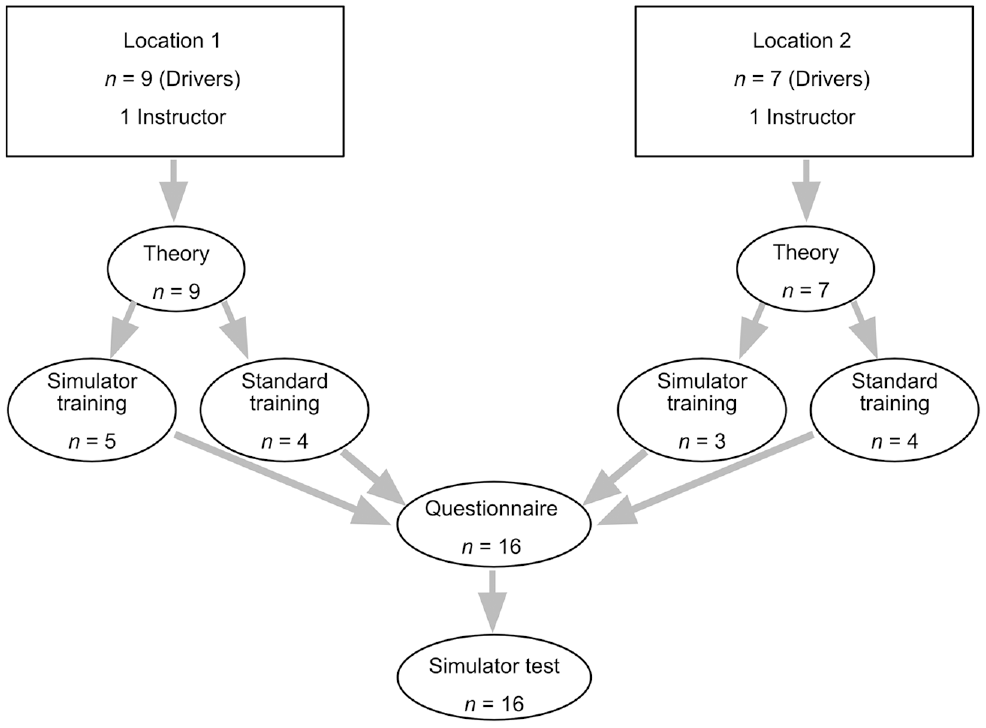
Experimental design.
Simulator Test
Although all participants at some point earlier in their career had been in contact with the simulator type, the control group made a 15-min test-drive before the actual test, to get familiar with the environment, the buttons, the levers, and other simulator functions. The simulator test consisted of two approximately 15–20 min scenarios, including regular driving, speed changes, and three special cases each. Of the total time, special cases were handled for approximately 70% of the time, and the rest of the time, about 30%, consisted of normal train driving, which included some speed changes as well as observing the lineside and in-cab signaling. During the test, which was recorded via video to enable the assessments, an instructor acted as a signaler (train dispatcher), interacting with the driver according to the regulations. The selection of special cases was as follows.
Scenario 1
Start-up within an operational zone far from a marker board in operational mode staff responsibility (SR).
System failure (SF) occurring at an open line.
Incorrect level-crossing when in the operational mode full supervision (FS).
Scenario 2
Start-up within an operational zone close to a marker board in operational mode staff responsibility (SR).
Trip (TR) occurring when at an open line.
Entering and driving in the operational mode on sight (OS) when facing end of movement authority within an operational zone.
To ensure realism, the scenarios were developed in close collaboration with two ERTMS experts with the aim of creating some of the most “commonly” occurring special cases that need to be handled according to regulations. To enable a decisive, valid, and reliable objective measurement, the test was designed with several points of measurement. See the Appendix for a detailed list of events.
Simulator Test Measurement Methods
The simulator test was assessed both by using an objective protocol measuring driving errors and by instructor evaluation, which are widely used methods for measuring performance in driving simulators ( 36 – 38 ). The purpose of this double assessment was to estimate the reliability of the measurement methods and to make the assessment more nuanced. An instructor's evaluation might capture aspects that the objective protocol cannot, such as the distinction between acting safely and securely or in an uncertain and haphazard way.
Driving Errors
The maximum number of driving errors in the objective protocol, developed by two ERTMS instructors (one of whom is the corresponding author of this paper), was 63 and consisted of 23 rule-based errors (according to the regulations), 19 skill-based errors (e.g., handling the vehicle or, in most cases, the train-protection system), 12 ineffective handling errors (time-costly train driving), and nine combinations of these. Three of the possible errors in each scenario were not linked to any specific event but were of a more general nature (driving too slowly, standing still without cause, and an intervention from the train-protection system). To prevent these being too decisive, a maximum of two errors were counted per scenario. The Appendix contains a complete list of events, expected actions, and possible driving errors.
Instructor Evaluation
Two instructors, one from each train-driver location, who had not been part of the ERTMS education, assessed the drivers’ performance during the two scenarios. A total of nine statements were evaluated according to the instructor's view of the driver's performance. These included the six special cases, a general assessment of special case management, a general assessment of normal situations, and an assessment of how time-efficiently the driver worked. The statements were assessed on a 10-point Likert-type scale (
39
), where the instructor selected an alternative between 1 and 10, where 1 = totally disagree and 10 = totally agree. An example of a statement was: The driver is perceived to be sure of how
Test of Internal Reliability
Individually and independently of each other, the two instructors observed video recordings of two drivers and made individual assessments of the performance.
Transfer to Reality
To assess the transferability of the simulator test to reality, the instructors evaluated the following statement on a 10-point Likert-type scale, where 1 = totally disagree and 10 = totally agree: If the same scenarios that occurred in the simulator at the time of the study had instead taken place in reality, the result (i.e., the drivers' performance in the study and thus your assessment) would have been the same.
Questionnaire
Before the simulator test the drivers filled in a questionnaire including age, experience, duration of practice, and number of repetitions of different special cases and shunting situations (both as a driver and as a driver plus watching a colleague practice). The questionnaire contained nine situations, of which seven were special cases and two were different forms of shunting. However, when reporting the results of situations practiced, the shunting scenarios are not included and in the rest of the results only the six situations that occurred in the simulator test are presented. The seven special cases were as follows.
Start-up in unknown position in mode staff responsibility (SR).
Trip (TR) and post-trip (PT).
Driving in operational mode on sight (OS).
Passing a marker board in mode staff responsibility (SR) after receiving permission.
System failure (SF).
Incorrect level-crossing. This means that the level-crossing equipment does not for certain protect road users.
Lost radio connection (GSM-Railway, used for communication between train and railway regulation control). This is not included in the simulator test because it is so time-consuming.
The drivers were also asked to rate their confidence when handling special cases and normal situations, and to what extent they felt that they had been given sufficient training in various special cases. Also here, a Likert-type scale was used and the ratings were made on the following type of statement on a 10-point scale, where 10 = totally agree and 1 = totally disagree: “I feel confident in how to handle different special cases at ERTMS”; “I feel confident in how to handle normal situations at ERTMS”; and “I have received enough practice regarding various special cases.”
Ten-Point Likert-Type Scale
A 10-point Likert-type scale was used for measuring driver performance, perceived confidence, and for how transferable this study is to real train driving. The 10-point scale is frequently used ( 39 ), for example in driver performance measuring ( 26 ). It contains no clarifications in words except for the end points, which could be a disadvantage compared to scales with fewer points. However, the advantages, more options for the respondent (and a higher resolution for the researcher, meaning slightly better reliability and statistical power) and people’s familiarity with this type of rating ( 31 , 40 ), outweighed the disadvantages. The scale was intended to be analogous to the percentage of agreement or disagreement. That is, 1–5 correspond to 100%, 78%, 56%, 33%, and 11% disagreement, respectively, whereas 6–10 would indicate 11%, 33%, 56%, 78%, and 100% agreement, respectively. Thus, an 8 is a moderately positive answer and corresponds in this way to a 6 on a 7-point scale (which contains only three positive answer options).
Analysis of Data
To find out what effect the simulator practice had on performance and other independent variables, t-tests for independent samples were used. Also, t-tests for independent samples were used to analyze the effect of simulator practice on the number of repetitions and which types of errors the groups made. To assess the reliability of the two measurement methods, and which variables affected performance, product-moment correlations were used. Cohen's d and partial eta squared (
Apparatus and Environment
The simulator, used for both training and testing, had a fixed base and consisted of a touchscreen PC and a lever for driving and braking, together with a 50-inch flat-screen displaying the outside view (Figure 2). Although, in physical terms, the fidelity is low ( 7 ), the functional fidelity is high with the retardation, acceleration, buttons, and train-protection system corresponding with those of the real train. The simulator software uses the same ERTMS version as reality (baseline 3) and the 16 possible training scenarios, which can be customized via a trigger function in real-time, are developed in collaboration with ERTMS experts from three different TOCs and based on real Swedish ERTMS equipped lines. Therefore, the instructors and drivers could use the same documents (i.e., line descriptions, safety forms, timetables, etc.) as they would in reality. In addition, the instructor acted as a signaler, including performing safety calls and writing forms during the simulator drive. When referring to this simulator as a LFS, it is the physical characteristics that are meant.
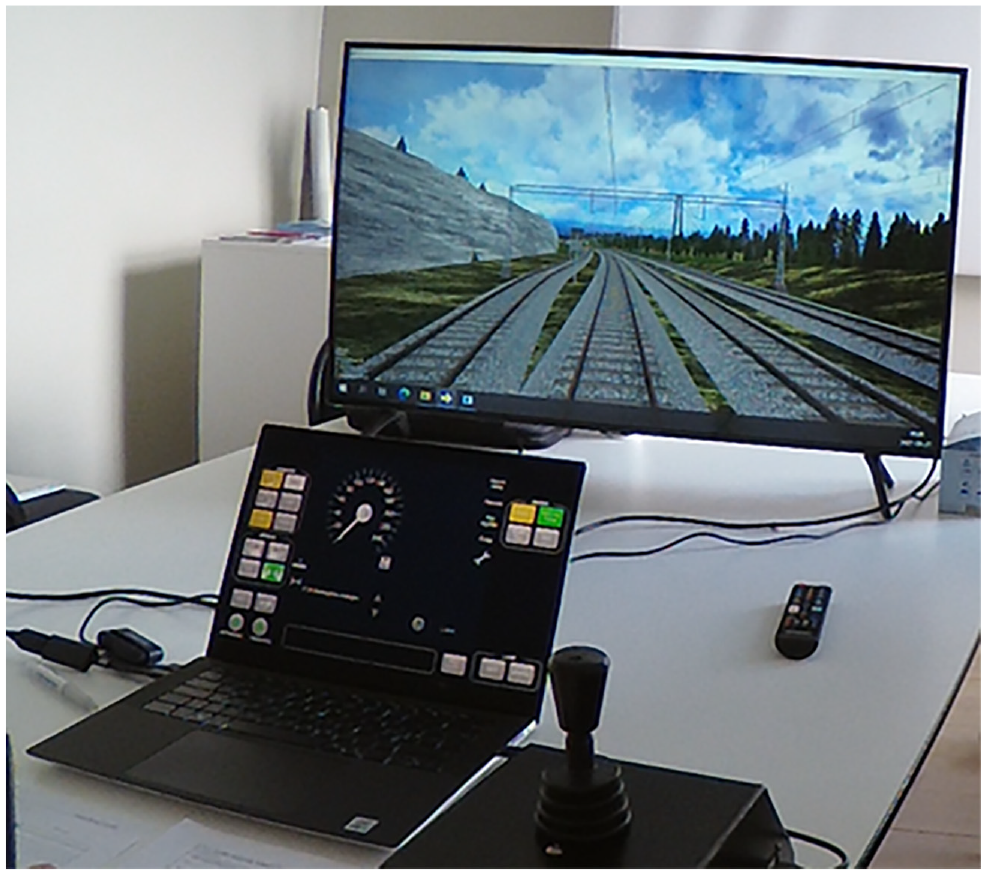
Simulator environment.
Results
Simulator Test Performance
Table 1 demonstrates a significantly better performance by the simulator group than the control group, with 38% fewer driving errors, and a 34% higher score from the instructor. The number of driving errors ranged between 14 and 27 for the control group, while the lowest and highest number of errors in the simulator group were 10 and 17, respectively. The instructor evaluation for the control group ranged between 3.11 and 5.00 and for the simulator group between 4.78 and 7.44. A strong correlation was found between the measured driving errors and the instructors’ evaluation (r = .85, p < .05). The two instructors also submitted a written motivation for their assessment for each situation, even though they were not asked to do so. An example of a motivation for a high score relating to scenario 1, special case 3 was: Does not use the positioning to identify the level-crossing, otherwise well-acted. An example for a low score (3/10) relating to the same scenario was: Careful driving against level-crossing, stops before the marker board and calls the signaler, forgets to signal the horn when passing.
Driver Simulator Test Performance
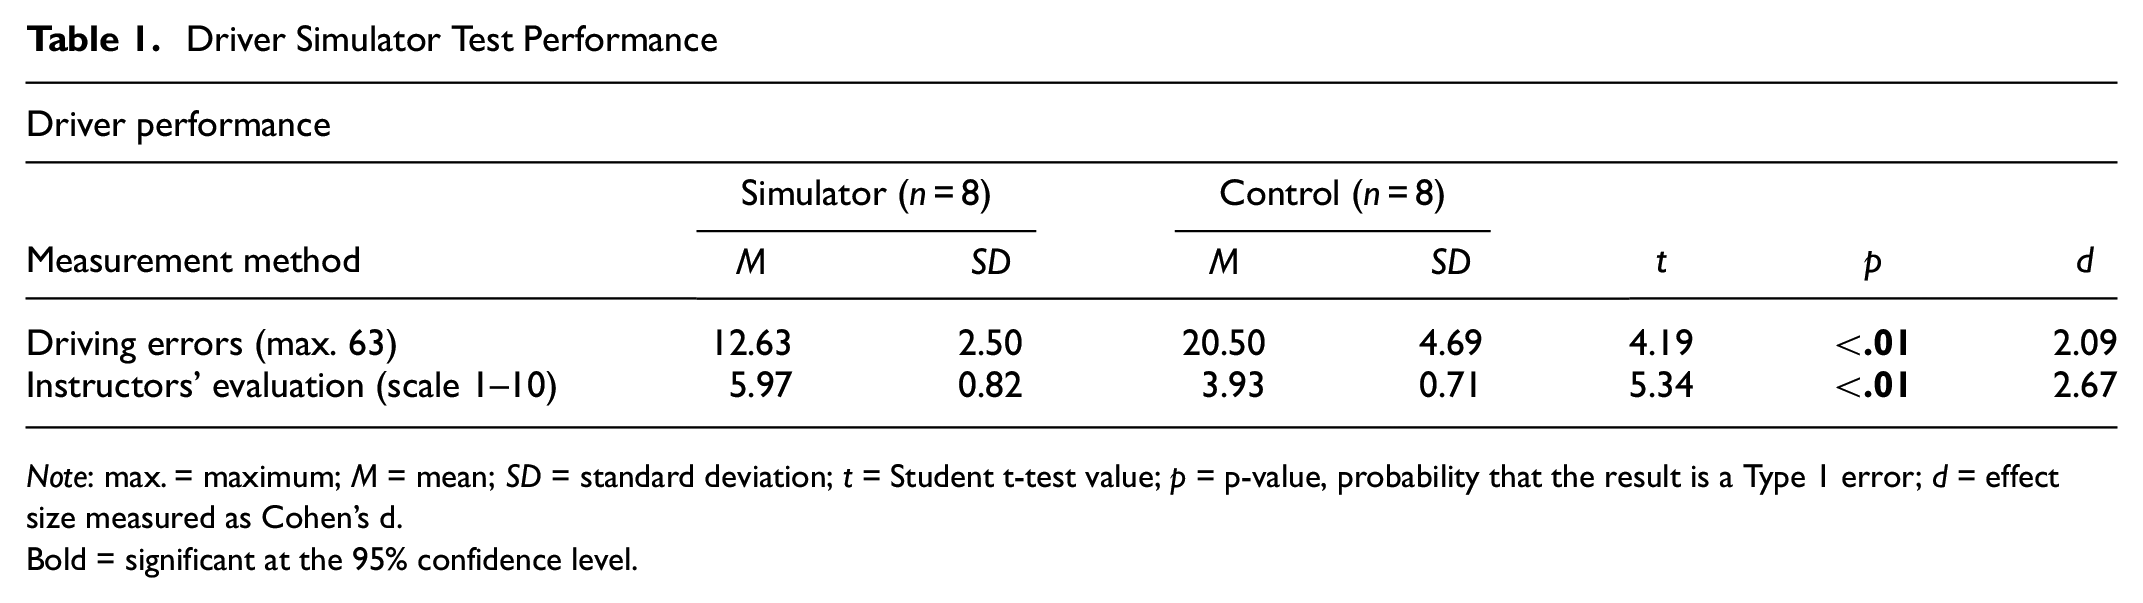
Note: max. = maximum; M = mean; SD = standard deviation; t = Student t-test value; p = p-value, probability that the result is a Type 1 error; d = effect size measured as Cohen's d.
Bold = significant at the 95% confidence level.
Type of Errors
The control group made more errors of all error types, but because of a large standard deviation, only the difference in skill-based errors was significant (Table 2). The percentual difference between the groups was 91% for skill-based errors, 69% for ineffectivity errors, and 34% for rule-based errors. Note that when an error was classified as a combination of two error types, 0.5 error per type was counted. Of the errors not linked to any particular event, the drivers made between zero and two errors, and thus the maximum of two per error was not exceeded.
Driver Error Types
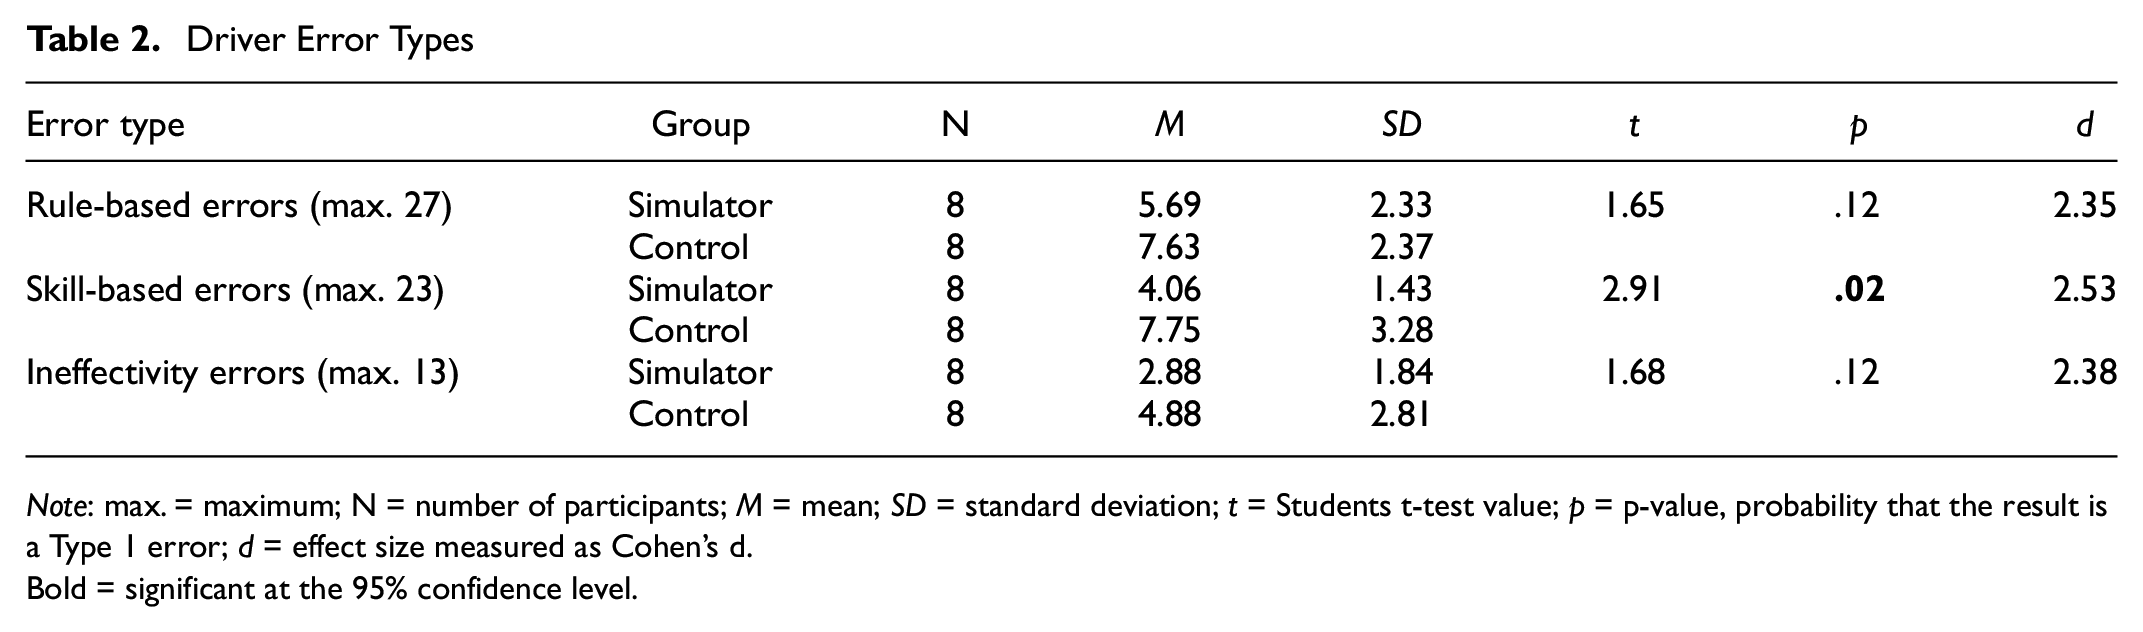
Note: max. = maximum; N = number of participants; M = mean; SD = standard deviation; t = Students t-test value; p = p-value, probability that the result is a Type 1 error; d = effect size measured as Cohen's d.
Bold = significant at the 95% confidence level.
Test of Internal Reliability
Individual evaluations from the two instructors, based on 18 measurement values each for the same two drivers, gave α = .88, reflecting high internal consistency.
Effects of Group and Location
A 2 × 2 between-subjects ANOVA tested for a potential main effect of Location, and a potential interaction between Location and Group, on driving errors and instructor evaluations. As previously found with t-tests, there were main effects of Group on driving errors, F(1, 12) = 25.12, MSE = 11.33, p < .001,
Transfer to Reality
Both instructors answered the statement about the transferability of the simulator test to reality with an 8 on a scale of 1–10.
Number of Repetitions During Practice
The simulator group reported a higher number of repetitions for each of the seven special cases, both for own practice (OP) and for watching a colleague practice (WC). For half of the cases the difference was significant (see Table 3). The control group reported more than one repetition of own practice and watching a colleague practice (OP + WC) for only two special cases, while the simulator group declared more than one repetition in all seven special cases (OP + WC). Out of a maximum of 56 (i.e., seven special cases multiplied with eight participants per group), the control group stated no practice of a specific special case 28 times, and more than four repetitions only three times (OP + WC). The participants in the simulator group declared zero repetitions four times and more than four repetitions 18 times.
Number of Repetitions of Special Cases During Practice
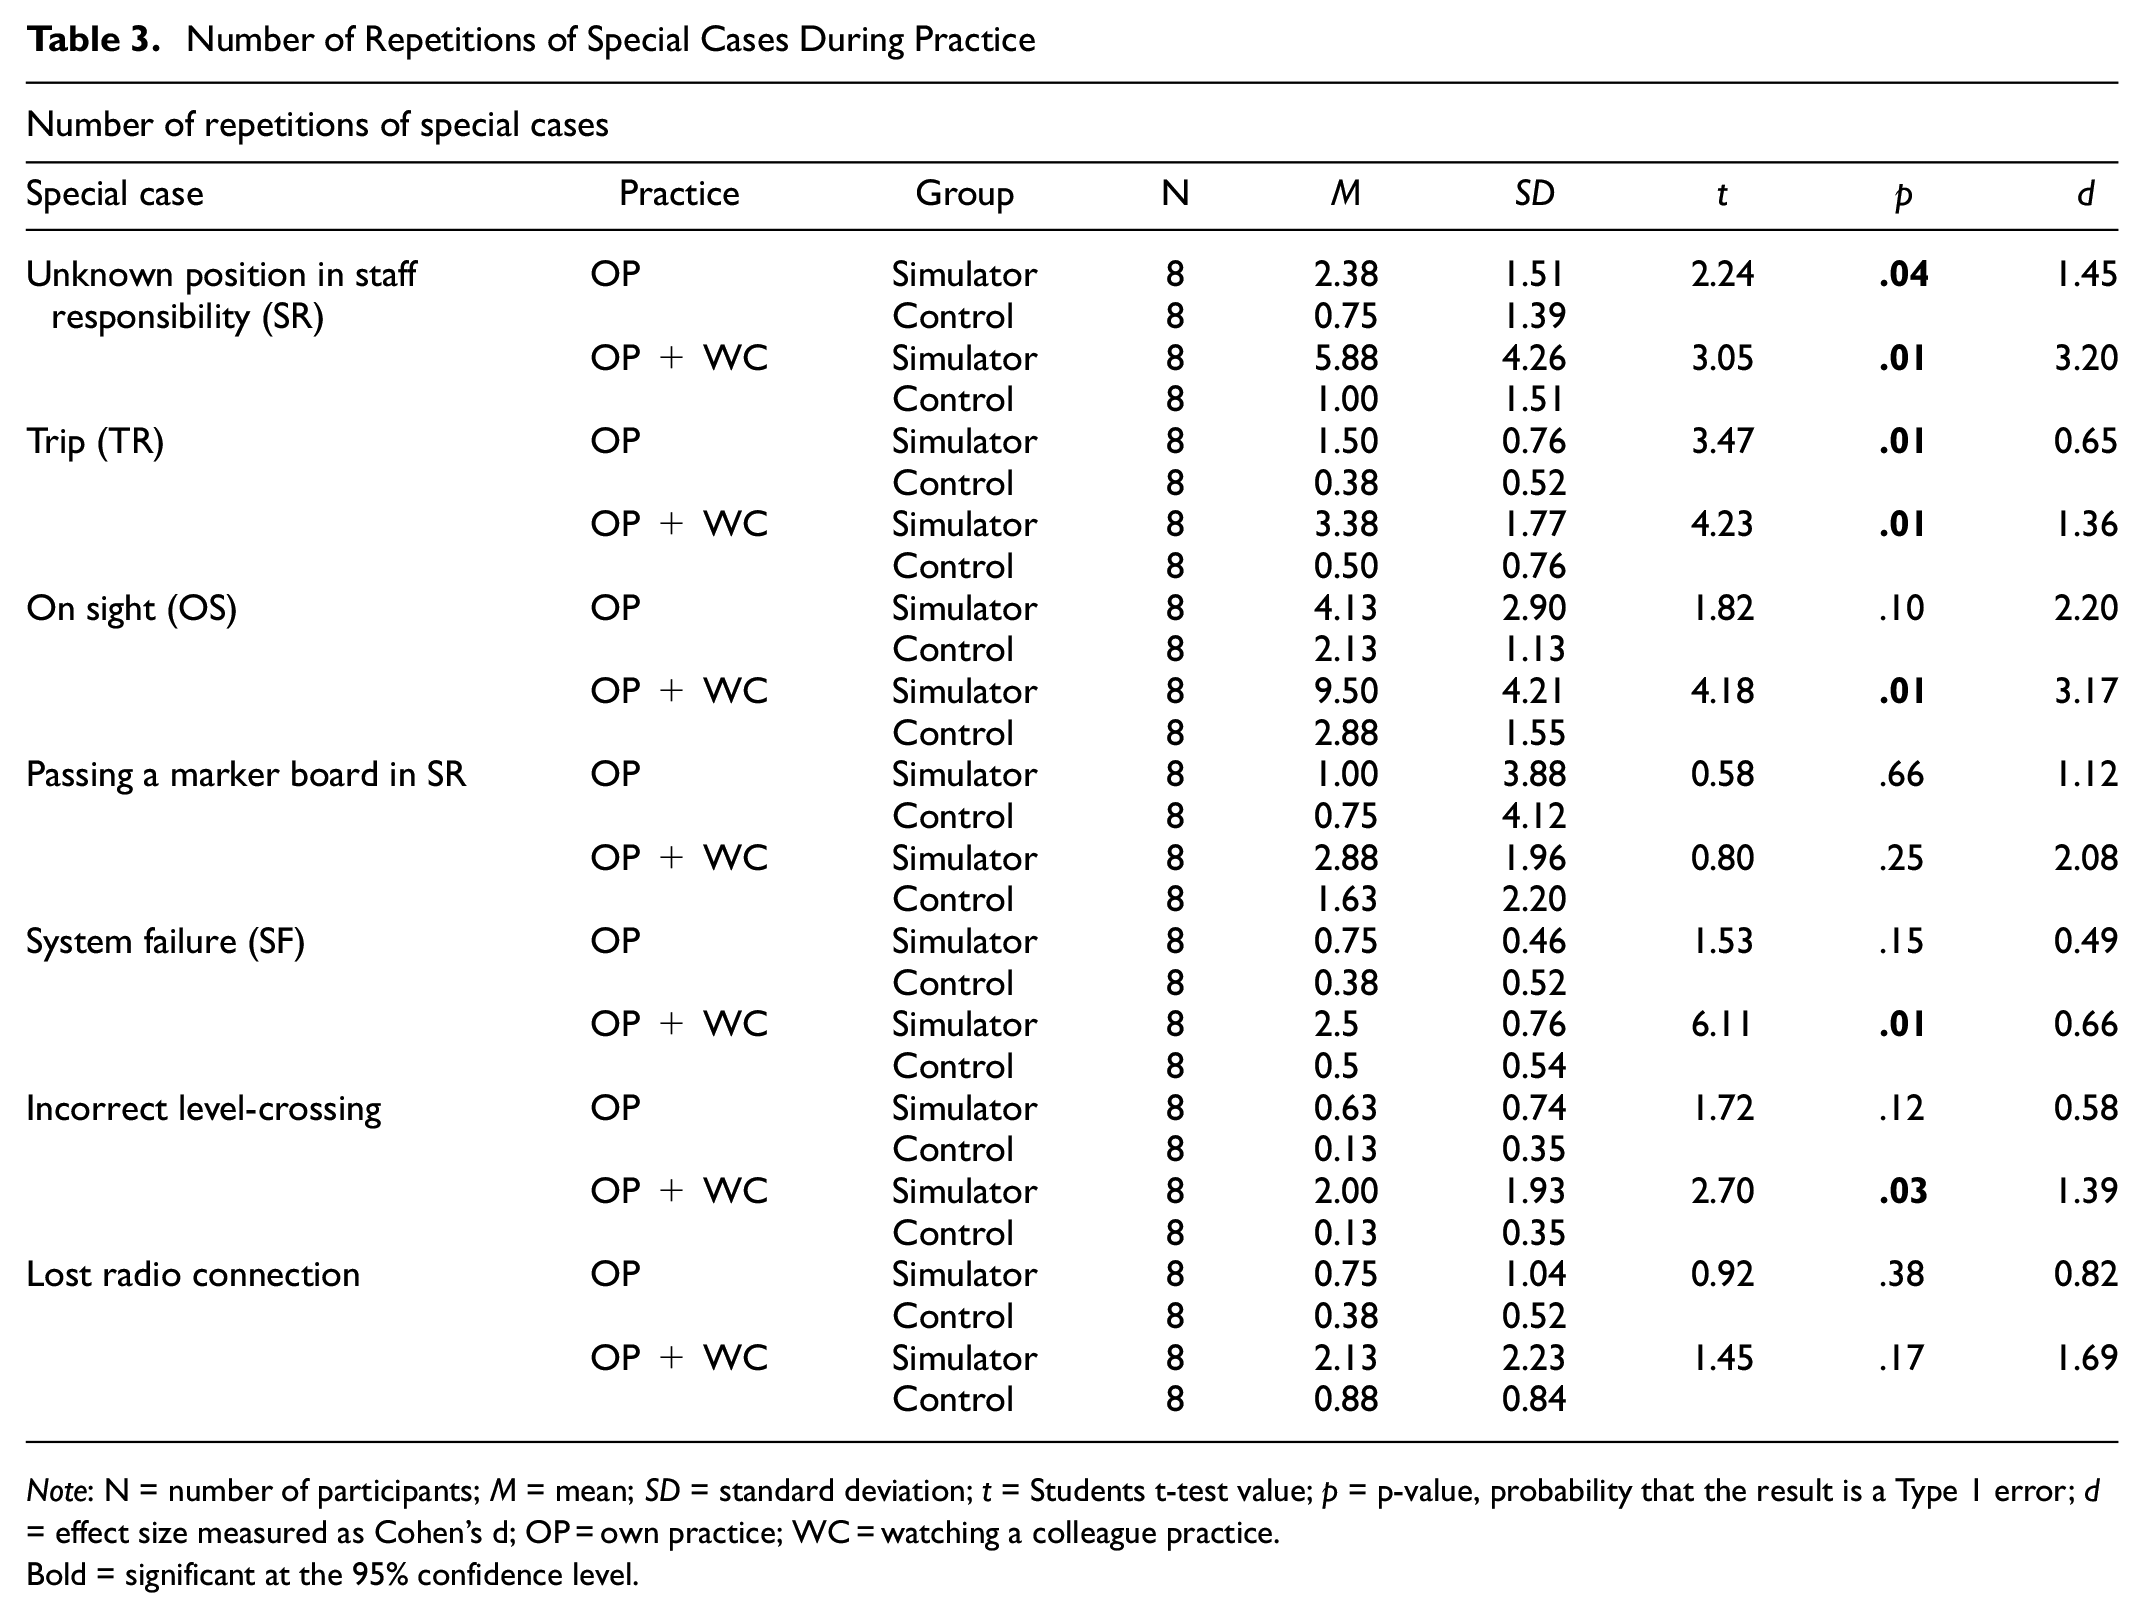
Note: N = number of participants; M = mean; SD = standard deviation; t = Students t-test value; p = p-value, probability that the result is a Type 1 error; d = effect size measured as Cohen's d; OP = own practice; WC = watching a colleague practice.
Bold = significant at the 95% confidence level.
Mean Differences Between Groups
An average difference of 11 h more practice time for the control group than the simulator group was found, but this difference was only close to significant (see Table 4). The control group declared significantly fewer (5.7) repetitions of the special cases on average when driving themselves, and when including also watching a colleague practice the special cases, the difference between the groups was even larger (18.2 repetitions).
Drivers’ Questionnaire Results
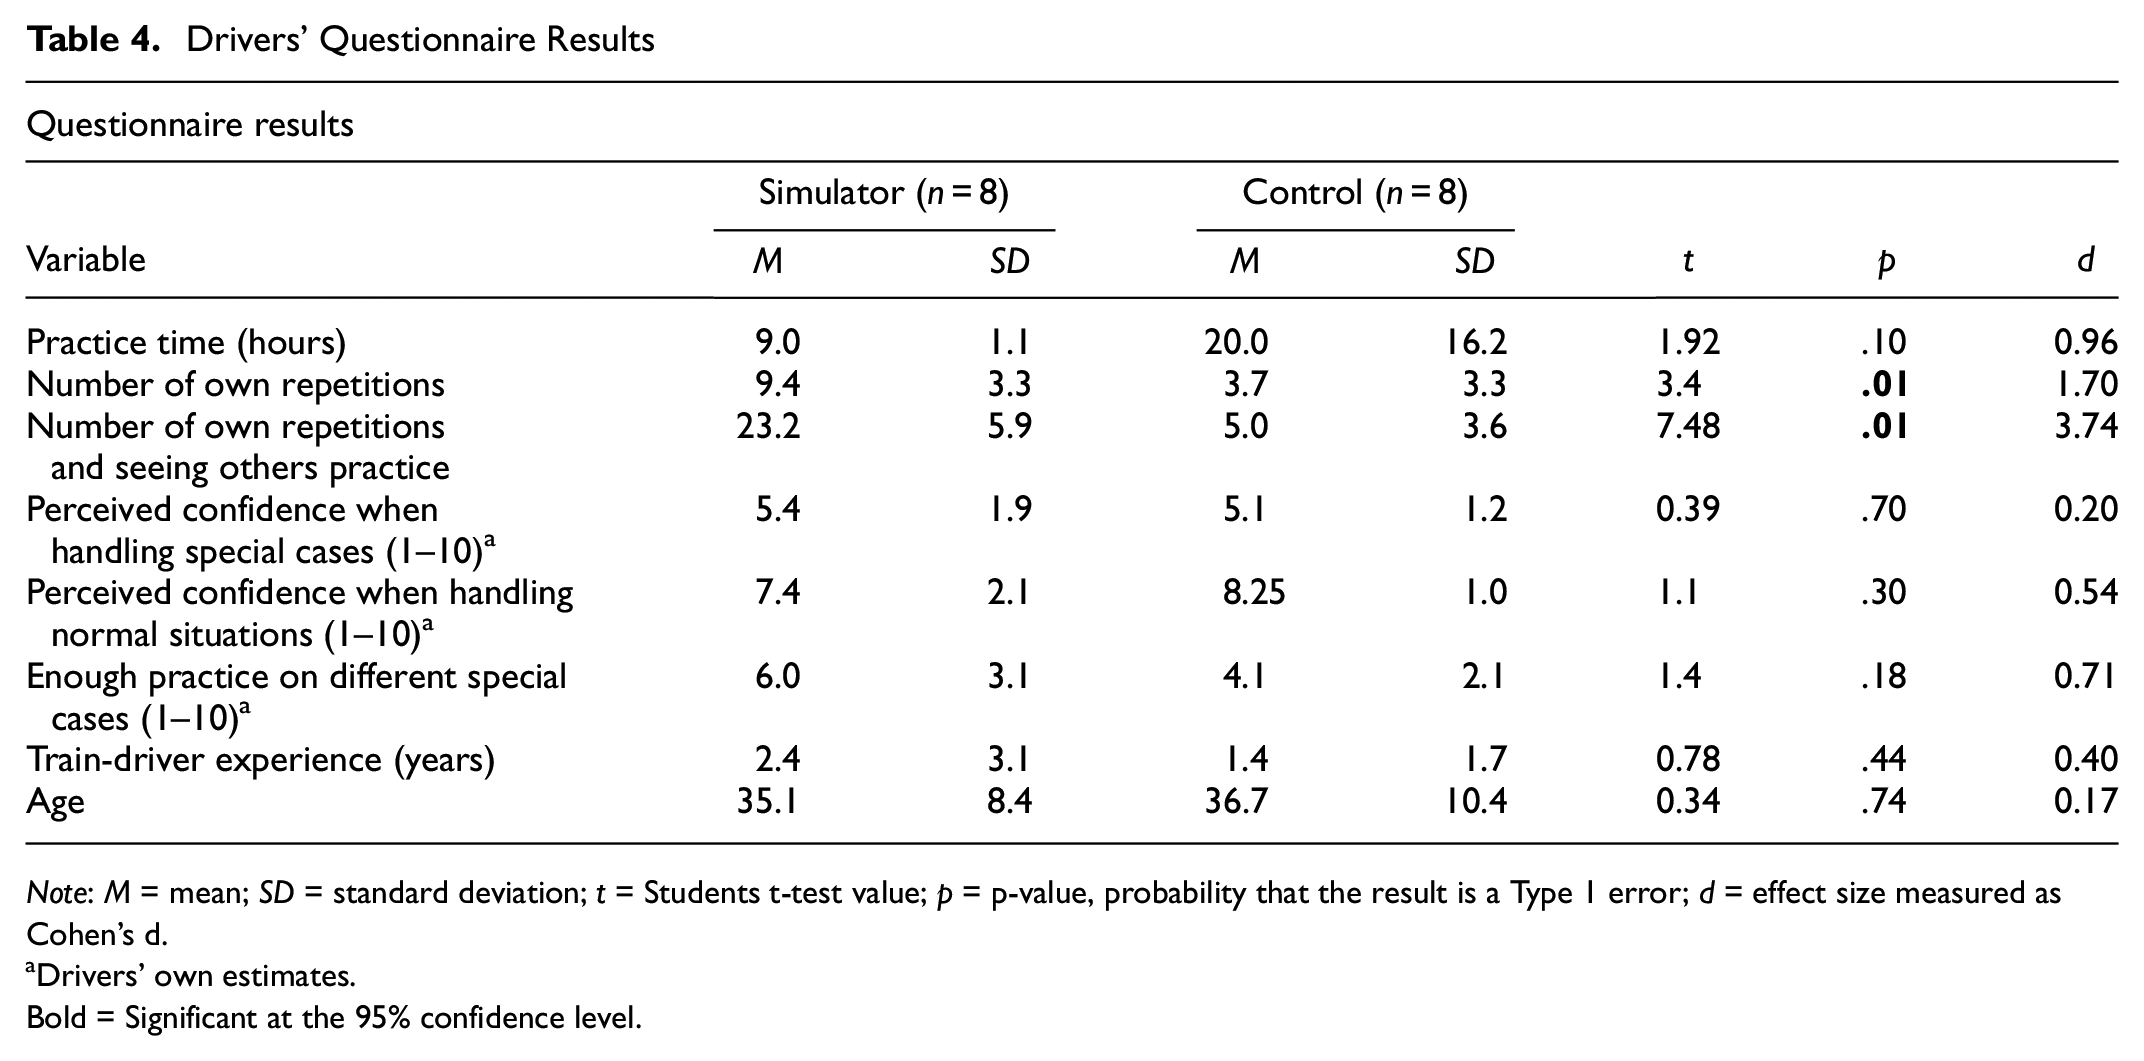
Note: M = mean; SD = standard deviation; t = Students t-test value; p = p-value, probability that the result is a Type 1 error; d = effect size measured as Cohen's d.
Drivers’ own estimates.
Bold = Significant at the 95% confidence level.
The control group included two drivers with at least five years’ experience, and the simulator group one, while all other drivers had three years’ experience or less. Both groups included three drivers over 40 years of age and three below 30. Neither age nor experience differed significantly between groups. There were two female drivers in the control group and three in the simulator group. Three questions covered the drivers’ own estimation of how well a statement agreed with their own opinion. No significant difference with regard to confidence in handling either special cases or normal situations after completing the internship could be seen. Finally, no significant difference between groups with regard to if they thought that they had received enough special case training was found.
Correlations
Correlations between simulator test performance and questionnaire responses from the train drivers are displayed in Tables 5–7.
Correlations Between Performance and the Questionnaire Responses (n = 16)
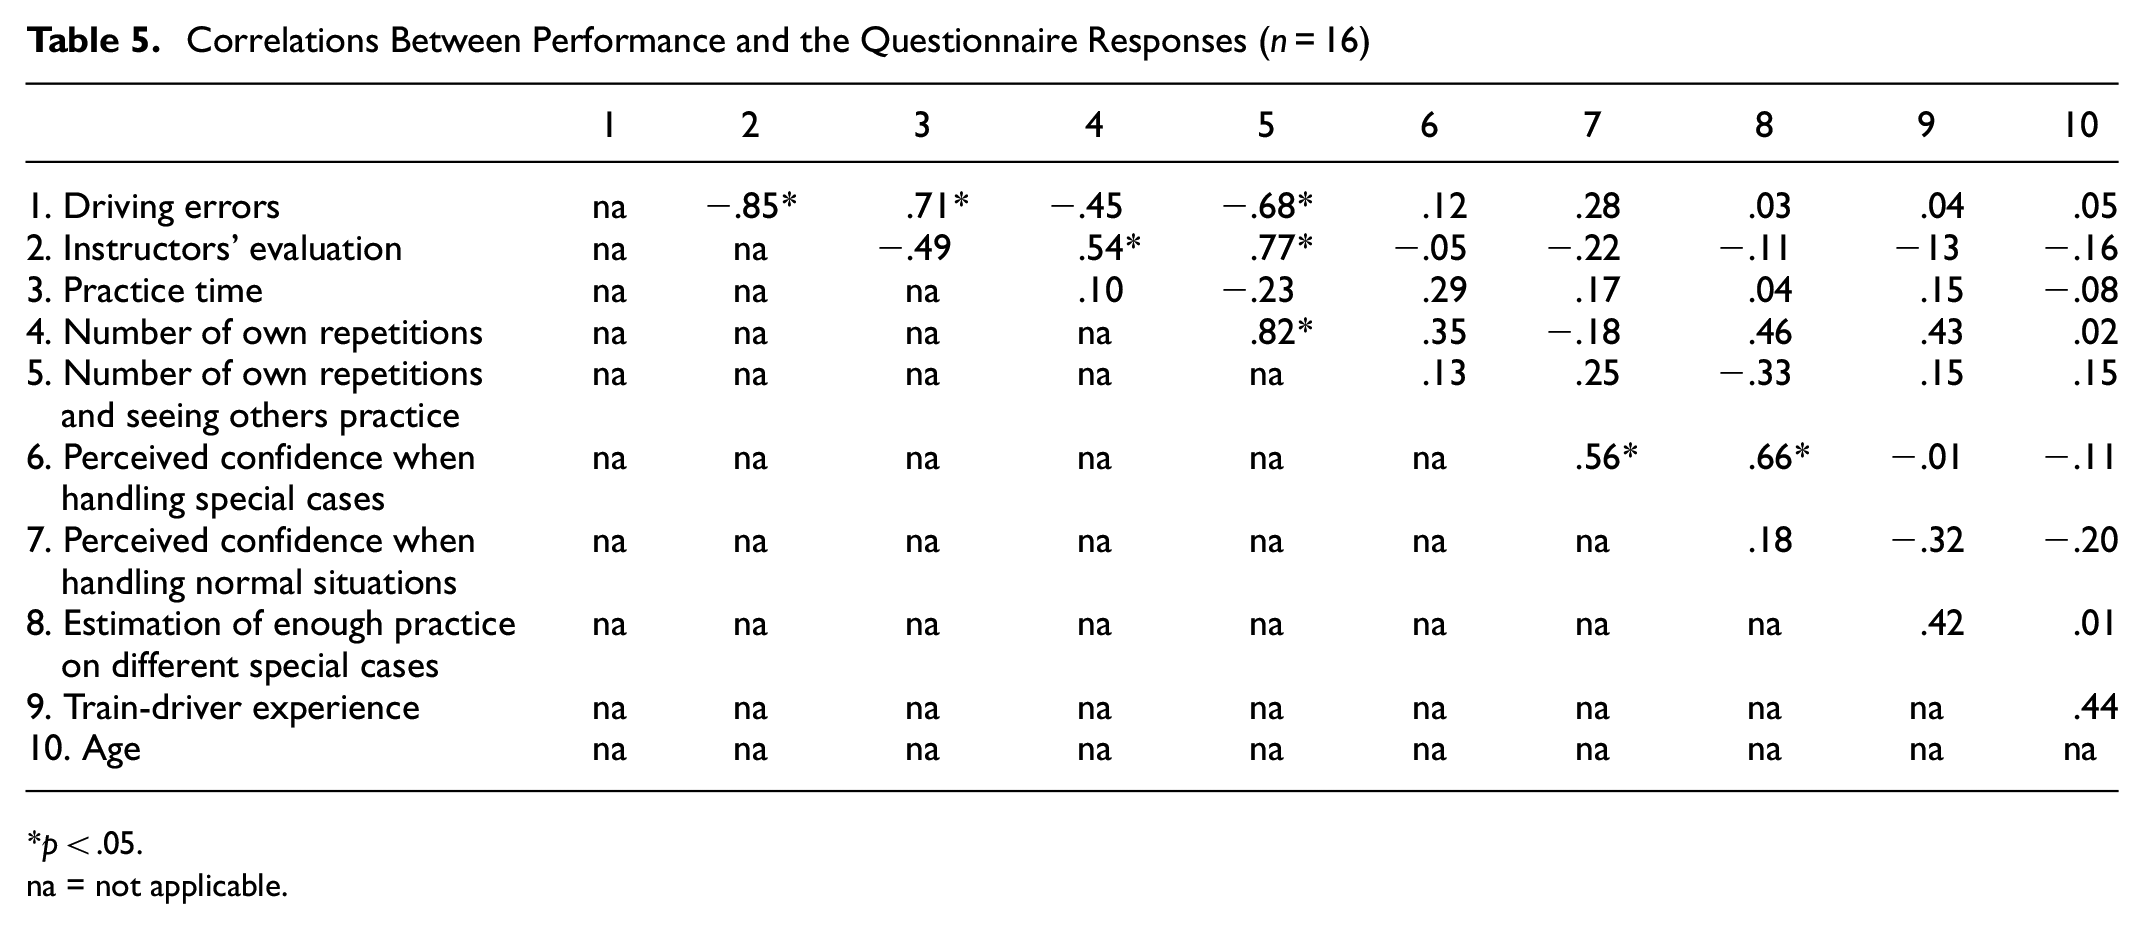
p < .05.
na = not applicable.
For the groups combined (Table 5), the number of repetitions as a driver and by watching a colleague practice correlated with performance as measured by driving errors, r = −.68, p < .05, and by instructors’ evaluation, r = .77 p < .05. Including only the number of repetitions as a driver correlated significantly with performance as measured by instructors’ evaluation, r = .54, p < .05, but failed to reach significance when measured by driving errors, r = −.45, ns.
Practice time correlated with driving errors, r = .71, p < .05, such that more practice time led to more errors. Experience, age, the drivers’ perceived confidence, and estimation of whether they received enough practice were not significantly correlated with performance.
Tables 6 and 7 show correlations for the simulator and control group separately. Since there are few drivers in each group (n = 8), a strong correlation is required to reach the critical value for significance with six degrees of freedom, r = .71.
Correlations Between Performance and the Questionnaire Responses: Control Group (n = 8)
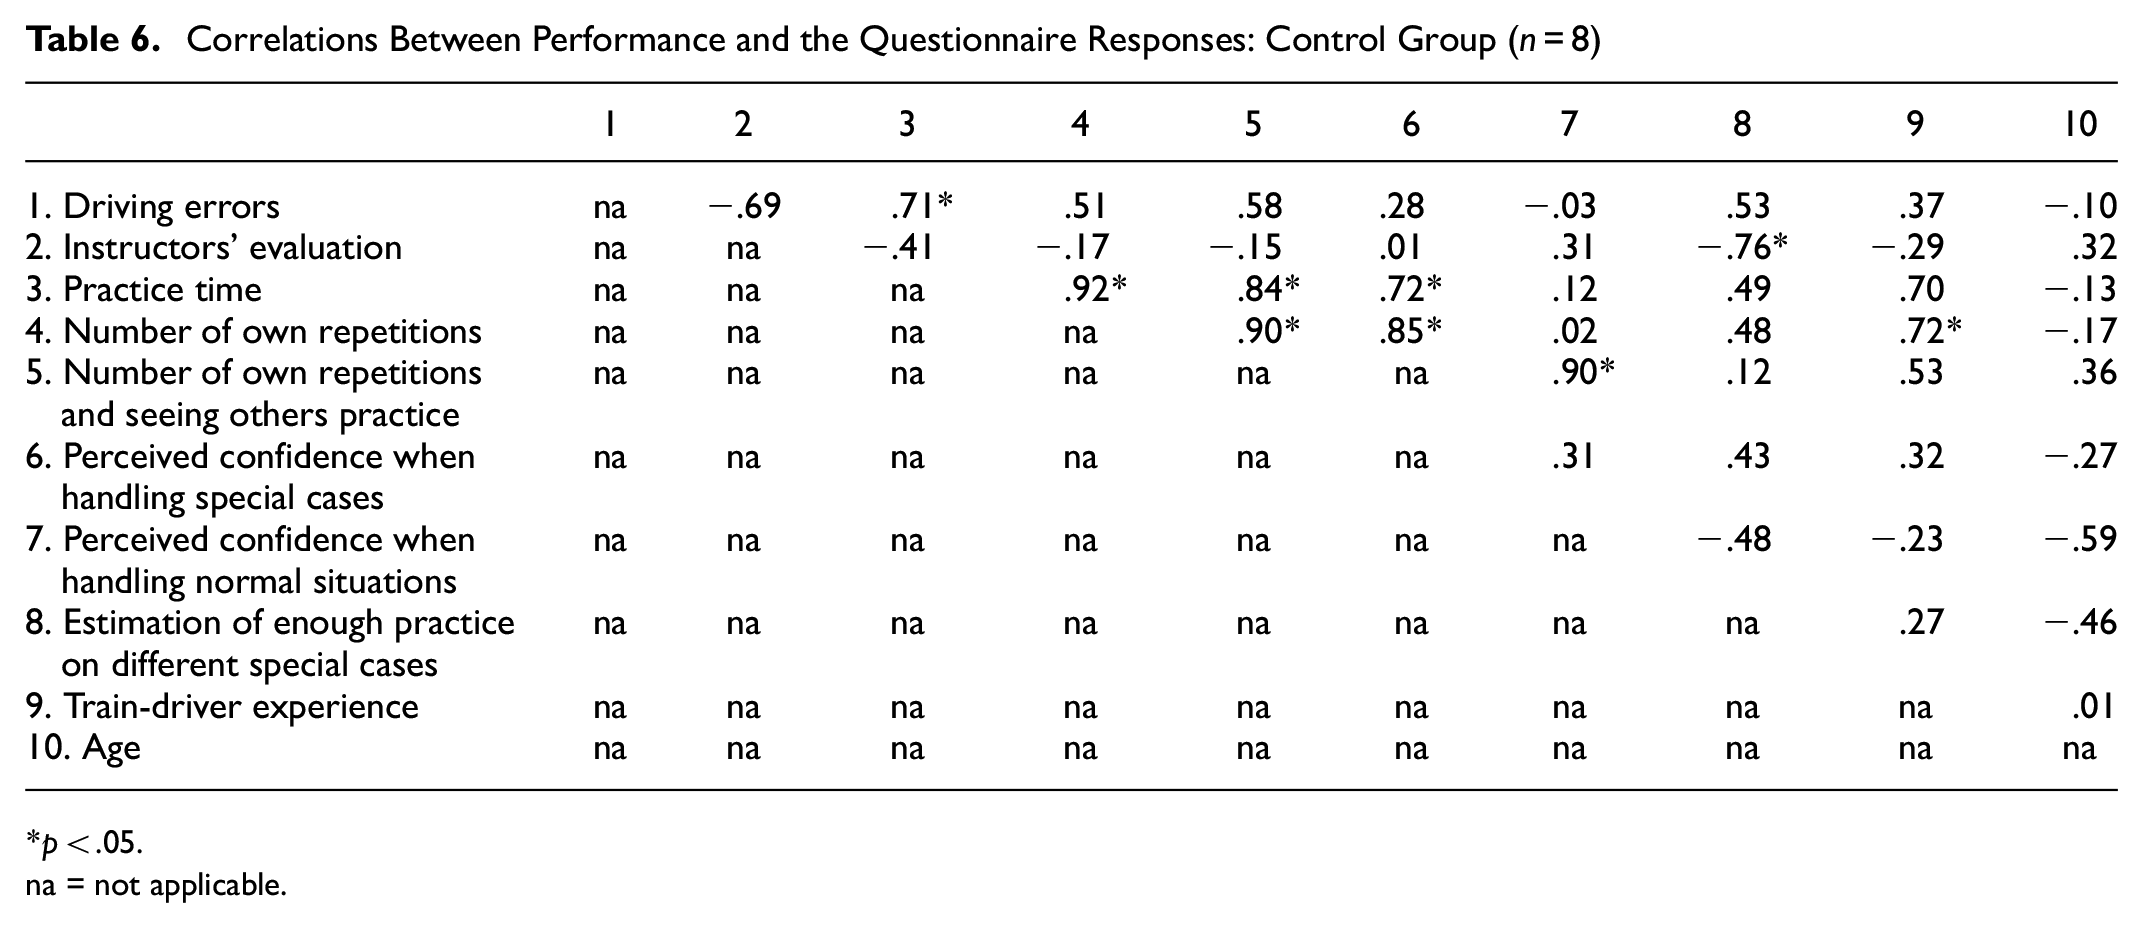
p < .05.
na = not applicable.
Correlations Between Performance and the Questionnaire Responses: Simulator Group (n = 8)
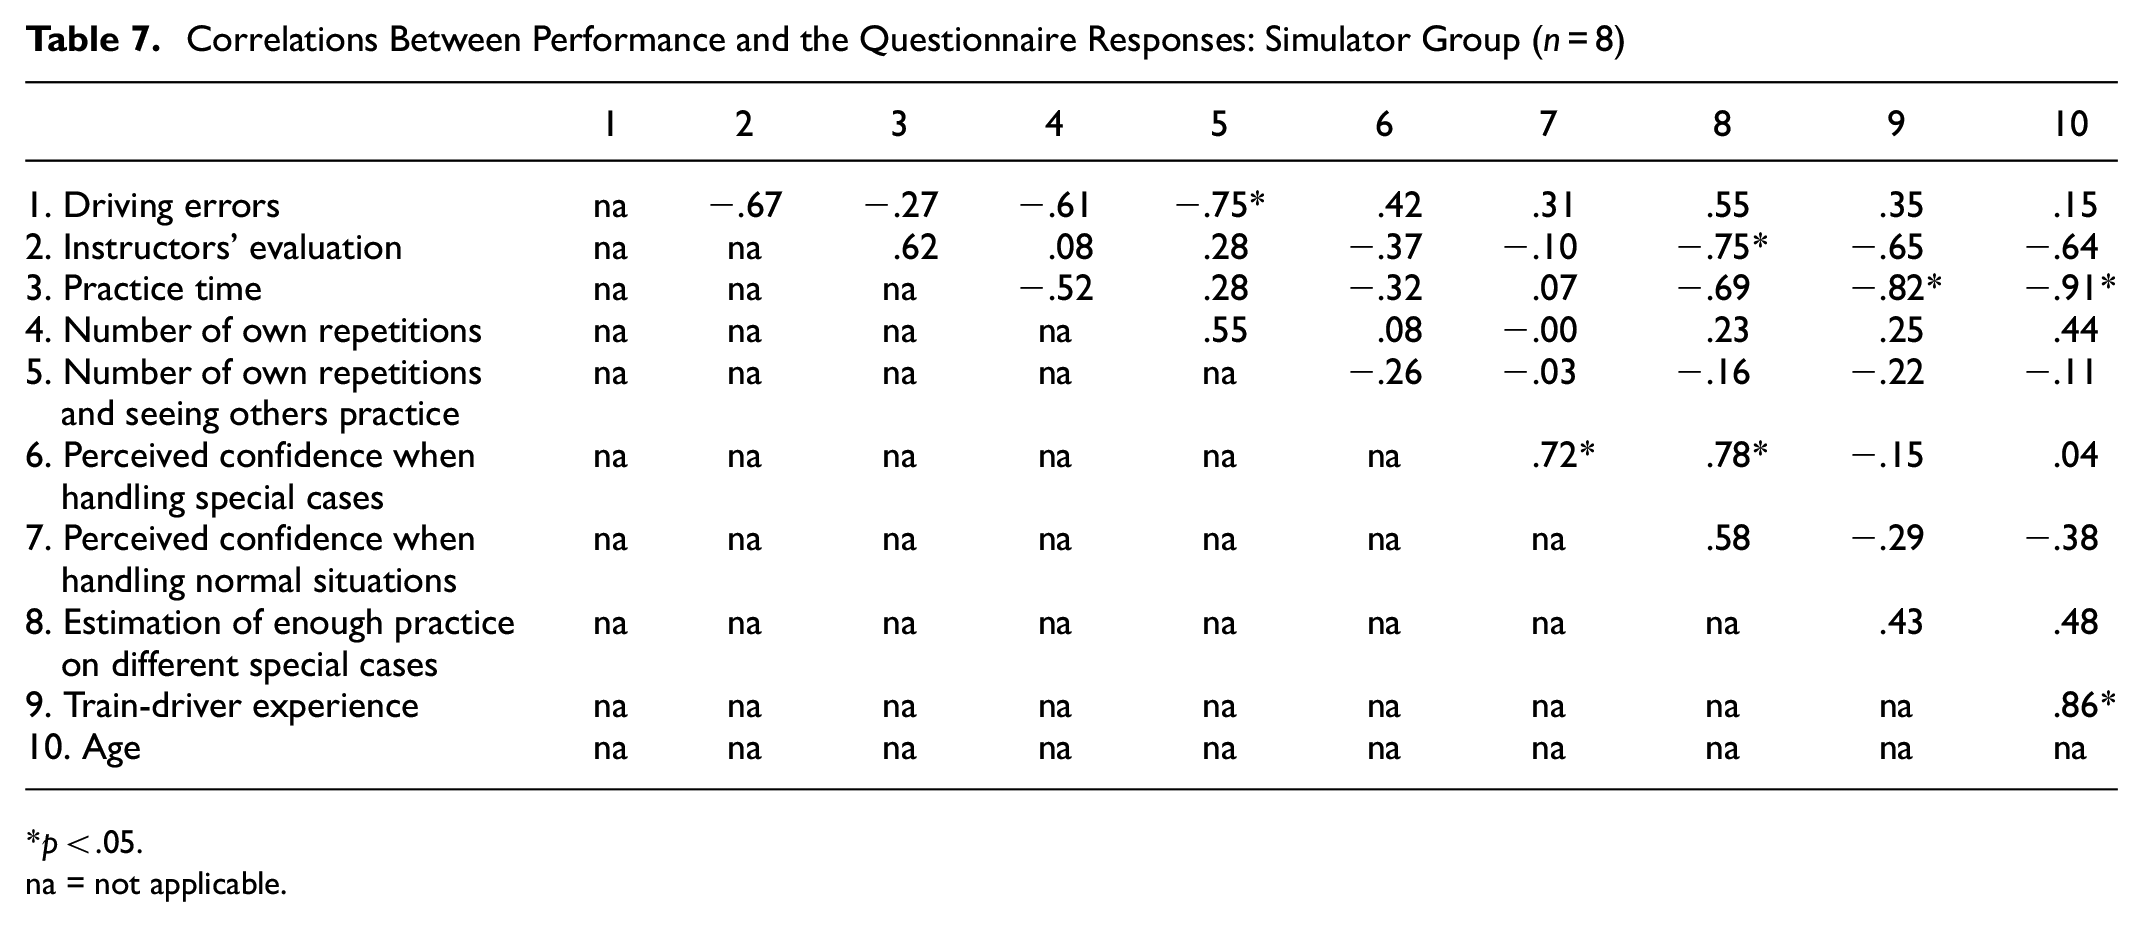
p < .05.
na = not applicable.
The simulator group's performance measured by driving errors correlates with the number of repetitions as a driver and seeing a colleague practice, r = −.75, p < .05, such that more repetitions are associated with fewer errors.
For both groups, a significant negative correlation is stated between the drivers’ own assessment of sufficient special case training and the instructors’ assessment of performance, r = −.76, p < .05 and r = −.75, p < .05, respectively. Thus, drivers who to a greater extent believed having received sufficient training actually performed worse in the simulator test.
None of the groups demonstrated a significant correlation between performance and the drivers’ perceived confidence, age, or experience.
The control group revealed a strong and significant correlation between practice time and number of repetitions of special cases, r = .92, p < .05, for being a driver, and r = .84, p < .05 when adding watching a colleague practice; however, for the simulator group there was no such significant correlation.
Discussion
LFS Versus Standard Reality Training
Clear evidence from the present results supports the previous literature that practice in a simulated environment is both time- and cost-effective as compared to standard training methods in reality, because it provides better prepared train drivers in a shorter period of time and includes fewer external resources (e.g., vehicle availability, track capacity, help from signalers, and driving to a suitable place) ( 10 , 12 ). It is possible that the simulator groups' familiarity with the simulator had some effect on performance. However, since the control group started with a test-drive, and considering that all drivers, at some point earlier in their career, had had contact with the simulator, it does not explain the large difference between the groups.
Fewer errors were made by the simulator group considering all types of errors, although the largest and single significant difference considered skill-based errors (91%). As skill-based errors mainly consisted of managing the train-protection system, the superiority of the simulator group is probably a result of the mass training of the train-protection system when handling different special cases. An explanation of the difference for ineffectivity errors (69%) is likely an increased uncertainty in the control group because of fewer repetitions, which leads to more careful driving and more consideration during the simulator test. The relatively small difference between the groups for the number of rule-based errors (34%) may be because the regulations to a greater extent (than handling the train-protection system) can be learned via theoretical training.
The strong correlation between the number of driving errors and the instructors’ evaluation provides support not only for the effectiveness of LFS training but also ensures the reliability of the objective protocol measuring driving errors and the instructors’ assessment ability. It is not unlikely that the instructors' written motivation for each assessment may have helped them to be more structured in their evaluation.
Learner Experience of Special Cases During Practice
As previous research has shown, real-life train driving offers few opportunities to practice special cases ( 21 ). The most important information in Table 3 is that, for only two out of seven special cases, the control group stated more than one learning experience on average and a high number of non-practice of special cases in reality. On 28 occasions (i.e., half of the maximum) the control group declared zero repetitions, including watching a colleague practice. Thus, there is a large risk that a driver has not received any practical practice at all on some important special cases after completing standard practice (i.e., in reality). Even if the practice is not carried out during revenue, this study’s data clearly demonstrates the difficulty of provoking several of the more common ERTMS special cases the driver is expected to handle correctly, for example a trip, a system failure, a loss of radio connection, or an incorrect level-crossing.
Repeated Practice Affects Performance
Not surprisingly, and in line with the previous literature, an important reason for simulator training proving to be more effective than reality (i.e., better performance despite shorter practice time) is because it provides the opportunity to practice different special cases repeatedly ( 20 ). Also, results imply that practicing together in small groups is effective, as watching a colleague practice also seem to improve driver performance. Likely, this is a result of drivers being focused when watching others practice, which is in line with the previous literature clearly stating that being active leads to an effective learning experience ( 41 ). Since other research points out that just watching is not enough to acquire skills to perform ( 42 ), it remains to be determined which distribution between watching and practice is most effective.
Practice time and performance correlated positively, quite unexpectedly. However, this is a spurious correlation, since the control group noted significantly more internship time, while the simulator group performed significantly better. One explanation could be that the instructor thought that some of the drivers in the control group needed more training, but that reality is not good enough as a practice arena because it is so difficult to provoke special cases.
The reason that only the control group showed a correlation between practice time and number of repetitions is because of the large variation of internship time in the control group, M = 20 h (SD = 16.2 h), in contrast to the simulator group, which was more homogeneous, M = 9.0 h (SD = 1.1 h). Reality's dependence on external factors probably contributed to the great practice-time variation in the control group.
Self-Estimation
Train-driving experience does not seem to correlate with performance in this ERTMS simulator test. Therefore, it is reasonable to label all newly educated ERTMS drivers as novices (at least when it comes to the specific rules and handling of situations assessed in this simulator test), even if their experience as train drivers in general differs.
The non-existent correlation between self-estimated confidence and performance is in line with the findings of previous studies ( 31 , 32 ) that a novice hardly can estimate her own ability.
A surprising result was that both groups showed a (negative) significant correlation between a high score when self-estimating whether one had received sufficient special training (number 8 in Tables 6 and 7) and a poor performance score from instructor evaluation (number 2). Either the drivers did not understand the statement, or it is a result of coincidence, which then shows the difficulty of estimating their own ability as a novice.
Transfer to Reality
Both instructors rated the test transferability to reality as 8 on a 10-point scale, which indicates a good transferability. This, and that the scenarios were designed by experienced ERTMS experts to be realistic, plus that the handling of special cases does not differ from reality, suggests that the results are also to some extent valid as a performance indicator in real-world ERTMS train driving.
Conclusions and Practical Implications
This study aimed to contributing guidelines about train-driving simulator training in general and ERTMS training in a LFS in particular. Below some guidelines are argued for based on the results of this study.
Firstly, repeated practice in a train-driver simulator environment is, as Tichon and Wallis ( 22 ) also found, effective, at least from a short perspective. As the practical part of the ERTMS training is not aimed at learning to drive a train (which the drivers already can), but rather at putting the theoretical knowledge into a practical context, and above all learning to handle new special cases, a (highly functional) low-fidelity train-driving simulator is excellent for the purpose.
Secondly, a LFS may, based on the results of this study, be useful in other industries where new technology or regulations have been introduced, such as new special cases in a somewhat new environment within the profession task.
Thirdly, when a simulator is used as a supplement to reality practice, it is particularly important to focus on practice of the special cases that are difficult to provoke in reality. The large difference between the groups for skill-based errors, which primarily includes handling the train-protection system, suggests that the simulator training on special cases has a special focus on handling the train-protection system.
Fourthly, the strong correlation between the measurement methods suggests that both the protocol measuring driving errors and the instructors' structured evaluation can be used for reliable assessments of a driver's performance, not only to assess ERTMS knowledge, but also for other examinations in train driving and other driving industries.
Fifthly, and finally, since self-assessments made by novices are unreliable, and that reality is difficult to control, examination of the ERTMS should be done practically, preferably with the help of standardized tests in a simulator where instructors can assess the train drivers’ knowledge in different situations. Relying on the drivers’ self-estimated confidence and not testing the drivers’ practical knowledge in the handling of special cases before driving by themselves could potentially lead to costly mistakes.
Limitations and Suggestions for Future Work
Even though the simulator function is very similar to reality, the same emotions (e.g., stress or fear) can hardly be evoked by this type of LFS. Consequently, it is possible that a driver's performance in reality could be both better (more focused) and worse (more stressed or less engaged) than in a simulated environment without real consequences. Also, the test-time is relatively short and therefore the effects of fatigue or monotonous driving are not included in this study. Although simulator sickness was not detected in this study, it has been shown to be a problem in simulator training, particularly among older drivers. It could be a problem to consider if ERTMS training is to take place exclusively in a simulator environment.
This study is limited to passenger-train driving with an electro-pneumatic braking system (the train react almost directly to the driver’s actions with the driving and brake levers). The speed handling of a freight train with an ordinary pneumatic braking system is more difficult and places other demands on the driver (much longer reaction time between drivers’ brake-handling and actual brake-reaction), which also would be of interest to investigate further.
Because the simulator test is carried out immediately after completion of training, the interpretation of the training effects is limited to a short-term perspective. A more long-term perspective would be useful to gain an understanding of how well the training effects age over time.
A larger set of data, including more drivers, should improve the power of the variables studied in this article and provide opportunities for a more sophisticated and rigorous data analysis.
The present study shows evidence that repeated practice (as a driver or watching a colleague practice) are important for achieving a good learning outcome but says nothing about how the training sessions should be designed. To examine the effect of different educational methods in a train-driver simulator would benefit both the research community and practical train-driver education.
Supplemental Material
sj-docx-1-trr-10.1177_03611981221135802 – Supplemental material for Effect of Train-Driving Simulator Practice in the European Rail Traffic Management System: An Experimental Study
Supplemental material, sj-docx-1-trr-10.1177_03611981221135802 for Effect of Train-Driving Simulator Practice in the European Rail Traffic Management System: An Experimental Study by Niklas Olsson, Björn Lidestam and Birgitta Thorslund in Transportation Research Record
Footnotes
Acknowledgements
This research was funded by the Swedish Transport Administration. The authors also wish to thank the TOC and the participants for their collaboration and contribution.
Author Contributions
The authors confirm contribution to the paper as follows: study conception and design: N. Olsson, B. Lidestam; data collection: N. Olsson; analysis and interpretation of results: N. Olsson, B. Lidestam; draft manuscript preparation: N. Olsson, B. Thorslund, B. Lidestam. All authors reviewed the results and approved the final version of the manuscript.
Declaration of Conflicting Interests
The author(s) declared no potential conflicts of interest with respect to the research, authorship, and/or publication of this article.
Funding
The author(s) disclosed receipt of the following financial support for the research, authorship, and/or publication of this article: This study was funded by the Swedish Transport Administration (TRV 2019/70073).
Data Accessibility Statement
The datasets generated and/or analyzed during the current study are not publicly available because of confidentiality reasons but are available from the corresponding author on reasonable request.
Supplemental Material
Supplemental material for this article is available online.
References
Supplementary Material
Please find the following supplemental material available below.
For Open Access articles published under a Creative Commons License, all supplemental material carries the same license as the article it is associated with.
For non-Open Access articles published, all supplemental material carries a non-exclusive license, and permission requests for re-use of supplemental material or any part of supplemental material shall be sent directly to the copyright owner as specified in the copyright notice associated with the article.