
Abstract
During the development of the European Rail Traffic Management System (ERTMS), several changes and improvements have been made to the driver–machine interface (DMI). The intention is to refine the train driver support by adding, removing, or clarifying signal information. In ERTMS Baseline 3, major DMI changes have been made between onboard versions 3.4 and 3.6. This includes clarification about speed targets and a simplified color strategy for target speed monitoring. This paper presents the effects of the DMI version shift on running time, driver target braking toward a European Train Control System target, and driver workload. In an electrical multiple unit train driver simulator, 39 student train drivers tested two different DMI versions on a 16 km railway line. In addition, the drivers rated the driver task workload using the NASA Task Load Index. From the results of this study, it can be concluded that drivers, despite a longer braking phase, go faster with version 3.6 than with version 3.4. The running time difference was about 1%. Although the driving task was short, with a low workload demand, the train driver workload was clearly affected by the onboard version, such that with the later version (3.6), the workload was statistically significantly lower.
Keywords
The European Rail Traffic Management System (ERTMS) was implemented to improve cross-border interoperability throughout Europe by creating a seamless railway system. ERTMS is a continuous radio-communication-based signal system that is expected to benefit travelers, infrastructure owners, and train operators by reducing maintenance costs, improving safety, and increasing traffic capacity ( 1 , 2 ).
Sustainable railway design plays a central role in reaching the goals of traffic safety, improved capacity, and reduced energy consumption. For a successful technical switch from the previous lineside-based signaling system, for example from the Swedish automatic train control to ERTMS and its signaling component European Train Control System (ETCS), it is necessary to examine the consequences of the transition for both train drivers and in relation to capacity measures. A need for more consideration of drivers in the design phase has been highlighted ( 2 – 4 ). For example, the simulated running time used for time scheduling has been shown to differ significantly from actual running time ( 5 ). It has been suggested that the existing tools used for speed profile design or time scheduling may be improved by including driver behavior ( 6 – 8 ).
The ETCS level defines the operating level, how the trackside is equipped, and how the information is transmitted to the train. The baseline refers to the technical baseline corresponding to a set of system requirements. The ETCS baseline can be described as the kernel of system functionality, performance, and other nonfunctional characteristics ( 9 ). Like other comprehensive software systems, the system is evolving into new baselines, with a continuous flow of new functions and software corrections. Baseline 2 was the first set of requirements to enable interoperability. Baseline 3 is the next step and includes new functions, such as an improved braking curve model and a more developed handling of level crossings. For Level 2, a continuous radio transmission of information between the train and the trackside is provided. The train reports its position to the Radio Block Center and receives movement authorities (MAs). Eurobalises are per definition the train’s physical reference, and a train detection system is required to ensure safety. Although Level 3 has been widely discussed, it is the least developed concept. In Level 3, the train supervises and reports its completeness, and there is no need for any kind of trackside signals or train detection system. Under the current Level 2 system, the national traffic administration decides what baseline version the trackside supports, and the train operators must adapt the rolling stock to these conditions. This paper is focused on Level 2 and Baseline 3.
Earlier studies have shown that ETCS restrictive driving conditions and safety margins may increase driving times compared with lineside signaling, which tends to result in lower capacity and less-than-expected improvement ( 1 , 10 ). Before reaching a limit of authority (LOA) speed restriction, ETCS implements a safety margin that ensures that the train does not exceed the new speed limit when it reaches the start point of the new infrastructure restriction ( 11 ).
A literature review revealed that for good driveability with ERTMS, the speed profile design is important since problems during this phase can have negative consequences for the train driver’s workload, driving style, and braking behavior ( 12 ). When driving with ERTMS, the driver is provided with a separate, in-cab ETCS driver–machine interface (DMI). This new interface represents a large source of information that can increase the cognitive workload for the train driver ( 4 ). Further, a simulator study with ETCS-licensed drivers revealed that drivers tend to brake according to the indication braking curve instead of the permitted curve ( 13 ). In this context, ETCS baseline development is interesting from a research perspective, especially when it comes to avoiding unwanted effects when putting the system into operation. In the transition from version 3.4 to version 3.6 (both Baseline 3), the brake model and DMI have been modified in a way that affects the driving task. However, the consequences for capacity from driver behavior as well as the effect on driver workload remain uncertain.
Train driving simulators offer safe and repetitive environments that are close to reality, which makes them important tools for research ( 5 , 12 , 14 ); it has also been suggested that they are useful for driveability analyses and evaluations ( 12 ).
This study aimed to examine the consequences of moving from ETCS onboard version 3.4 to version 3.6, focusing on capacity parameters such as braking and running time as well as on human factors. To the best of our knowledge, this is the first attempt to quantify some performance indicators related to capacity consumption. A comprehensive capacity analysis is left for future studies. To achieve this, a train driving simulator was used and the following research questions were formulated:
How does ETCS onboard version 3.6 affect …
running time?
driver braking toward an ETCS target?
driver workload?
Background
In this section, some concepts that are necessary to answer the research questions are presented and described. The standard procedure for calculating railway capacity consumption is the UIC 406 method ( 15 ). This was first published in 2004 and evaluates the capacity consumption, generally defined as the number of trains that can safely pass a given segment within a period. Capacity is affected by variations in system configurations, such as tracks, signaling system, operation philosophy, and rolling stock ( 16 ). On a microscopic level, both driver braking behavior and running time affect the capacity consumption.
Interaction between the Train Driver and Braking Curves
Via the DMI, the train driver is guided toward new speed targets, which may require both speed increases and decreases. A decrease in speed can either have the nature of an LOA, with a target speed different from zero, or a stop, end of authority (EOA). The DMI speed restriction guidance is visualized by several functions based on the ETCS braking curves, which define several warning and intervention levels.
When the authority is close to reaching the limit or the end, the indication curve (I-curve) functions as a driver indication. The time between the I-curve and the permitted curve (P-curve) allows the driver to react to a new target, without exceeding the permitted speed. At a certain distance from the target, the DMI speedometer indicates that a target is approaching, and the pre-indication monitoring (PIM) state is entered. Seven seconds later (T_preindication) the driver enters the target speed monitoring state, and the P-curve is visible in the DMI. With a speed below the P-curve, there is a margin for intervention, whereas if driving over this limit, brake intervention is likely to occur. The predicted P-curve and the other brake limits for ERTMS are shown in Figure 1. However, from the driver’s perspective, the permitted speed is displayed as a real-time calculation by the ETCS onboard based on the actual train speed and position, giving the permitted speed for a certain position ( 17 ). In this paper, the P-curve refers to the actual speed permission as presented for the driver and not the predicted one as shown in Figure 1. The motivation is that this study is focused on the driver’s perspective. Additionally, the calculation of the P-curve in the onboard equipment is somewhat simplified to avoid the need for iterated calculations. A complete description of the limits and interventions is presented in the European Railway Agency (ERA) standard ( 18 ).
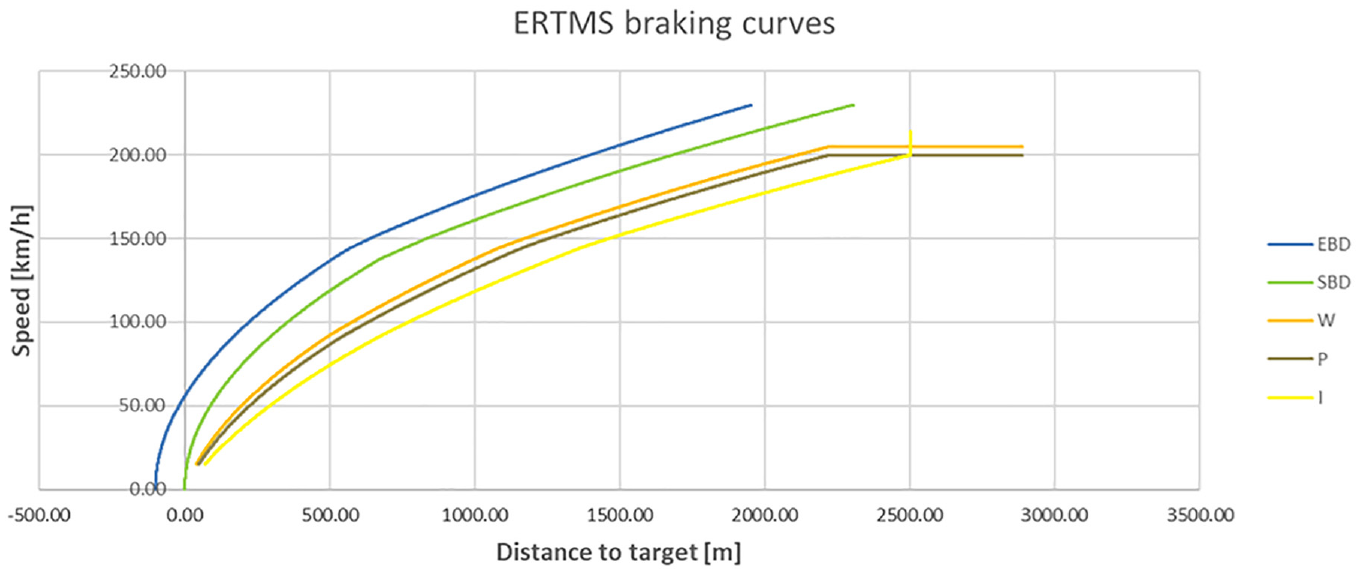
Emergency (EBD) and service (SBD) brake intervention curves together with the indication curves: warning (W), permitted (P), and indication (I). Expected train driver braking behavior is a deceleration somewhere between the I- and P-curves. This example is based on an electric multiple unit with 150% brake, indicating the brake capacity.
In the Swedish ERTMS capacity assessment guidelines, driver braking behavior is expected to align with the P-curve ( 19 ). However, a simulator study showed that this is an optimistic expectation ( 13 ); hence, the distance from the train to the P-curve is of great interest.
From the allowed speed, the circular speed gauge (CSG) will start its countdown according to the P-curve. The ETCS speedometer with its CSG, and an example of a speed decrease from 125 to 85 km/h are shown in Figure 2. The color of the filled part of the CSG indicates whether the I-curve has been passed: white indicates that the train has not passed the I-curve, and yellow indicates that the train has passed the I-curve, but not the P-curve. This is valid for system version 3.4 ( 20 ).
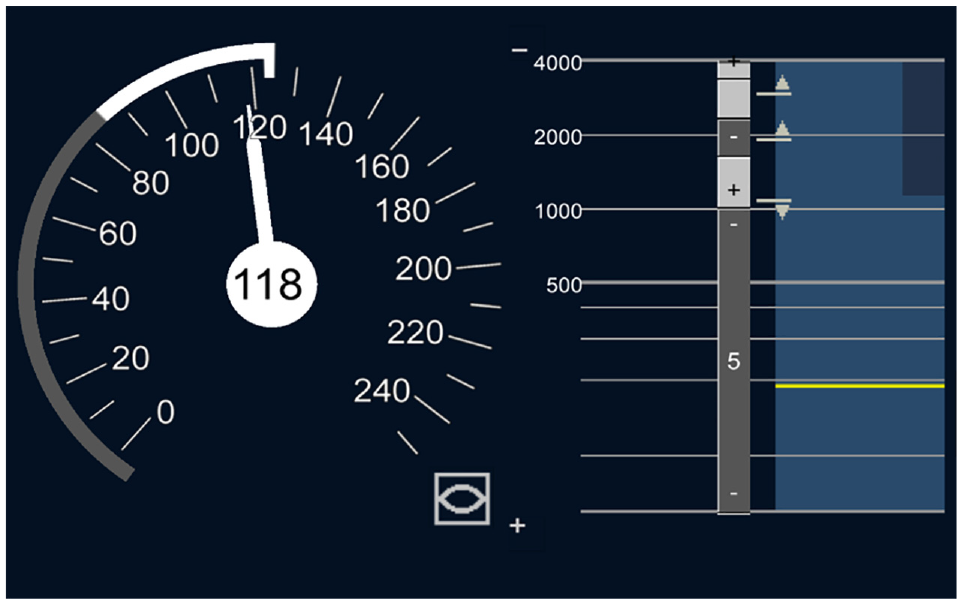
ETCS speedometer, with analog and digital speed pointer, and circular speed gauge. To the right, the planning area provides information on speed changes, track gradient, and so forth. The symbol (bottom, center) indicates “full supervision” driver mode ( 20 ).
DMI Standardization and Development
In the development of the ETCS the DMI setup changes stepwise in line with the rest of the system. Previous research has suggested that to support the task of safe and efficient driving, the DMI should display only essential information and avoid information that is of low priority to the driver ( 21 , 22 ). The shift from version 3.4 to 3.6 includes a simplified color strategy and speed targets, which are visualized in the DMI with speed limits in a new way.
In ETCS version 3.6, PIM state has been removed. These changes in the standard are illustrated in Figures 3 and 4, showing where the white area has been removed in Figure 4. The pictures are intended for the manufacturers of rolling stock, as a guide to DMI design patterns. To provide a timely warning to the driver about speed decreases, the indication supervision limit is provided to the driver earlier (Tdriver seconds) in version 3.6. Tdriver is a fixed value set to 4 s ( 23 ).
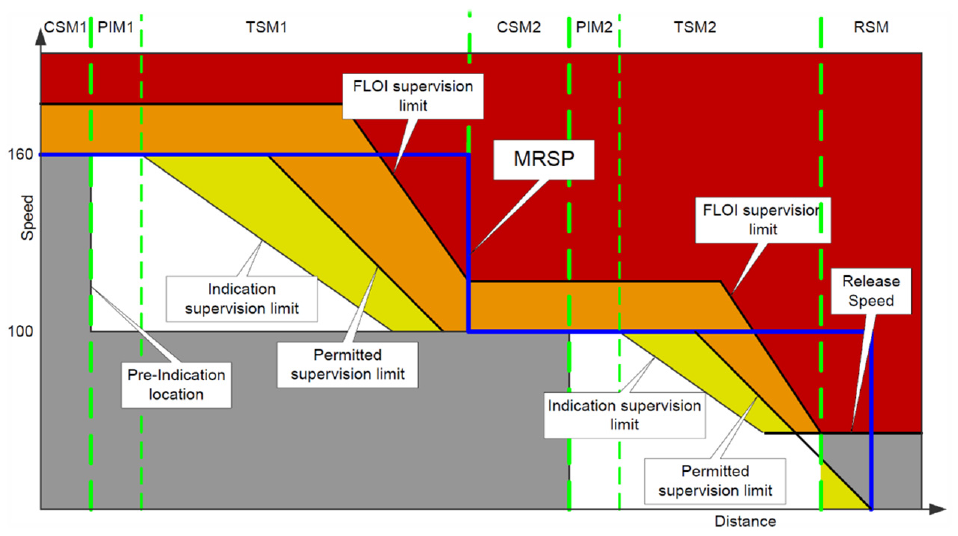
DMI version 3.4 color strategy. For an explanation and definition of the different sections see DMI standard document ( 20 ).
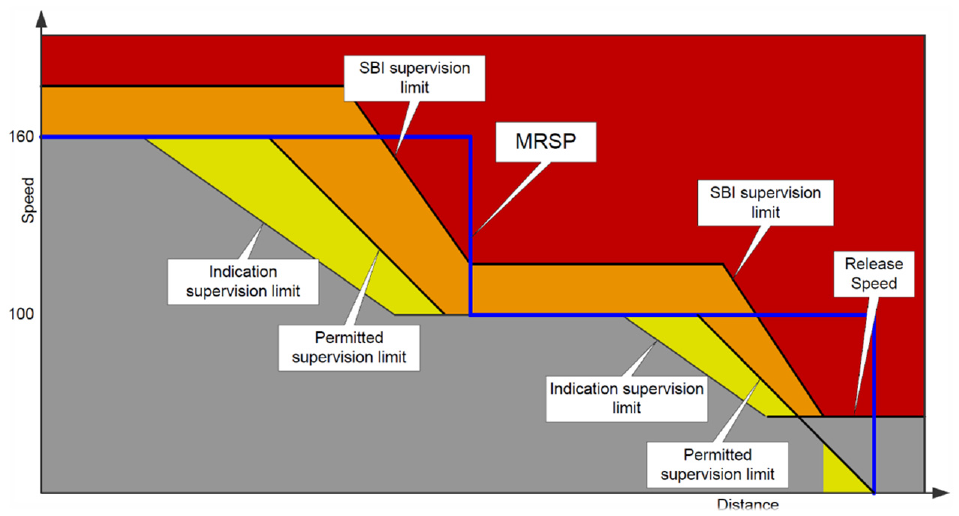
DMI 3.6 version color strategy. For an explanation and definition of the different sections see DMI standard document ( 24 ).
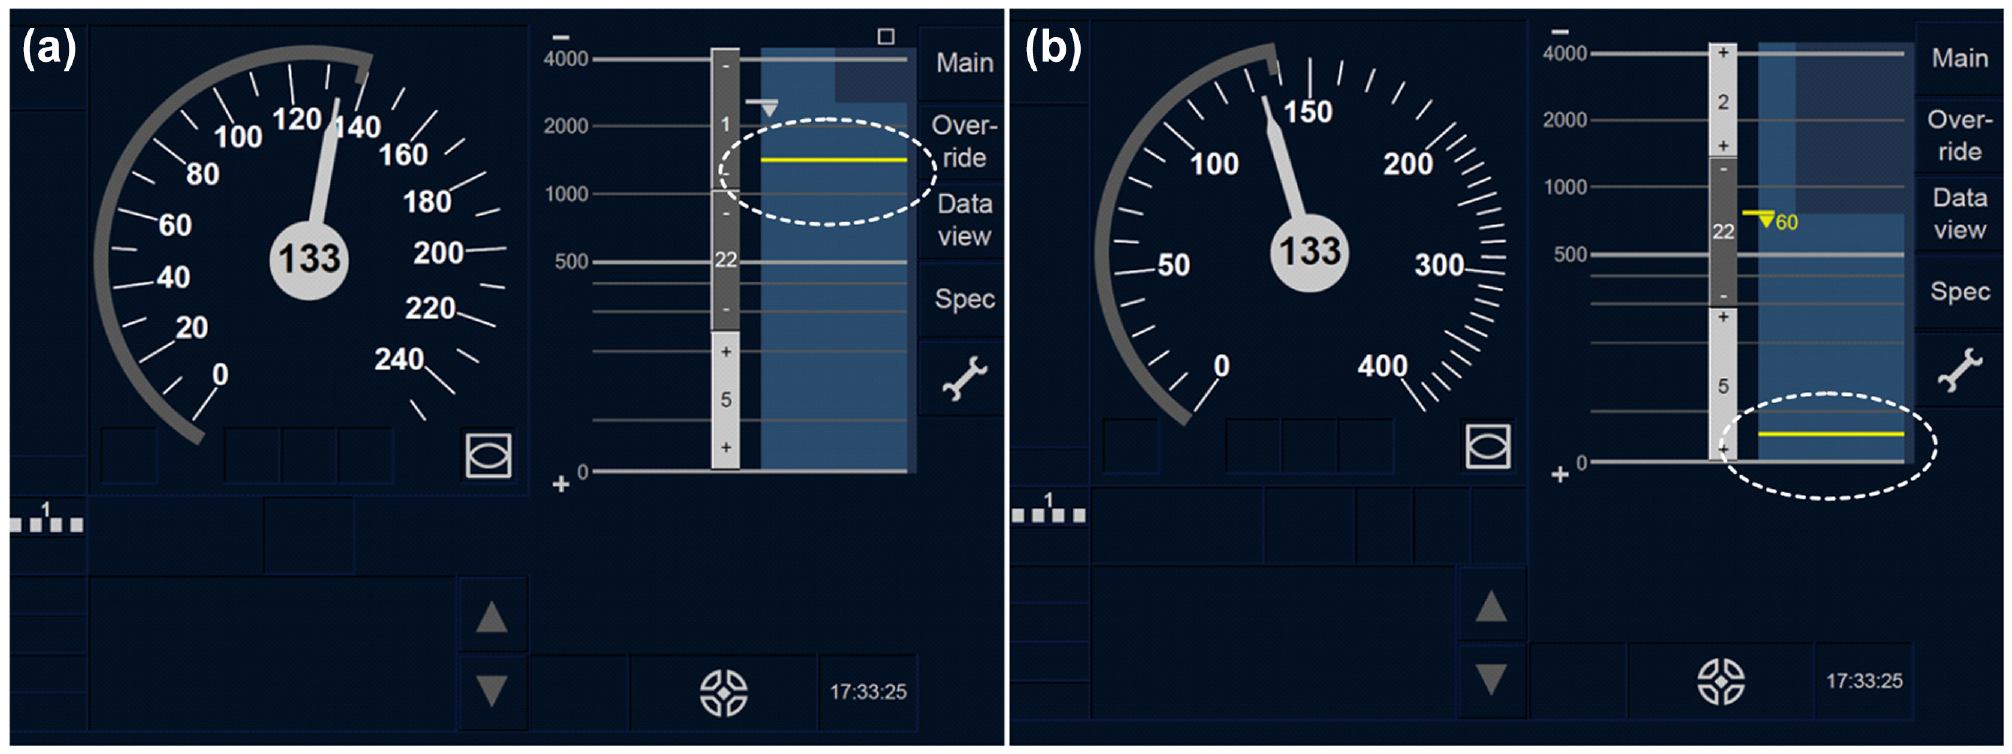
Figure 5 shows the display in the driver’s cabin, which is in line with the DMI standard. In version 3.6, the indication marker, sometimes referred to as the “yellow line,” is visually connected with its corresponding speed target.
Methods
In this section, the different methodologies used to answer the research questions are presented. Preparations, experimental setup, and data collection are described. Further, the research questions are broken down and statistical methods are suggested for hypothesis testing.
Train Driver Simulation Setup
The overall idea was to examine the effect of two different onboard ETCS versions on the variables described in the background section. To achieve this, participants drove the same railway section twice in a train driver simulator environment, using each onboard version respectively. The VTI train driver simulator, including a vehicle model in accordance with Bombardier Regina EMU (X55), was used ( 5 ). The simulator features a Bombardier Regina cruise control system, allowing the train’s speed to be adjusted in increments of 5 km/h. The train acceleration is calculated by the control system, and the braking levels are controlled by the driver. At the time of this study, the vehicle model did not include any support for rotating train mass. The simulator is designed to resemble a real driver’s cabin, which was mounted in a trailer and transported to the train driving education centers in Nässjö and Ängelholm, Sweden. In total, two visits took place in Nässjö, and one in Ängelholm. The driver cabin was equipped with a DMI, according to the ERTMS standard ( 18 , 23 ), a 56-in. TV screen showing the train front window view, an original Regina X55 driving stick, and a dead man’s pedal. Braking is performed using the same stick with seven increasing brake levels, and an additional emergency brake. The simulation with accompanying scenarios was run on a gaming computer, hidden in the cabin. Figure 6 shows an inside view of the train cabin.
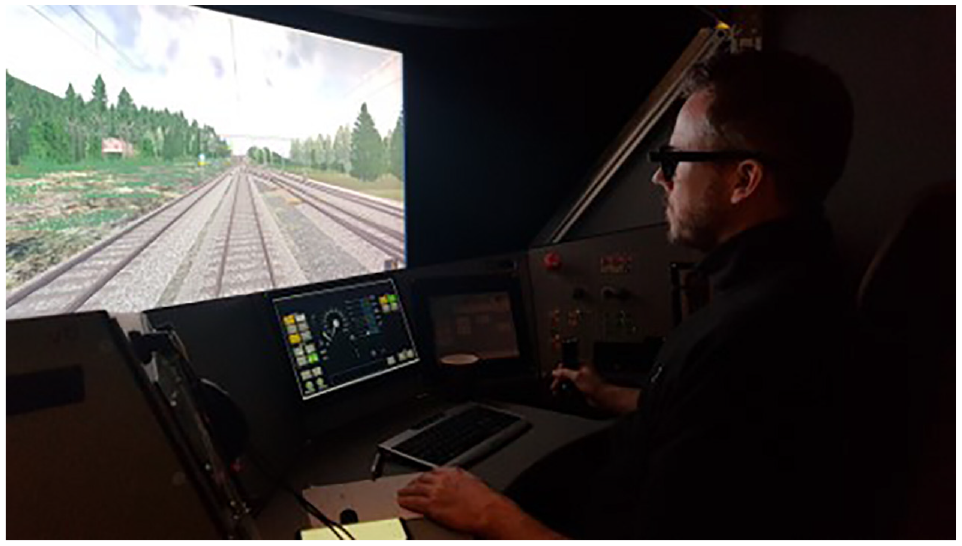
Train simulator driver cabin.
Driving Scenario
The overall scope and challenge with the driving scenario was to design a test scenario based on real signal planning that was sufficiently challenging for the driver, but not too extensive to fit within a reasonable time slot. Therefore, the main track of the Ådal line, specifically the 16-km stretch between Ramvik and Kramfors, was implemented in the train driver simulator with infrastructure data from BIS, the Swedish Transport Administration track database. The main reason for choosing this line was that it is one of the two lines in Sweden requiring the most driver interaction. It was therefore considered suitable for implementation in the train driving simulator. This implementation included track coordinates, inclination, curvature, signal positions, balise positions, and ETCS marker board positions. The environment around the track, as seen from the train cabin, was simplified compared with the real world. Figure 7 shows the railway route.
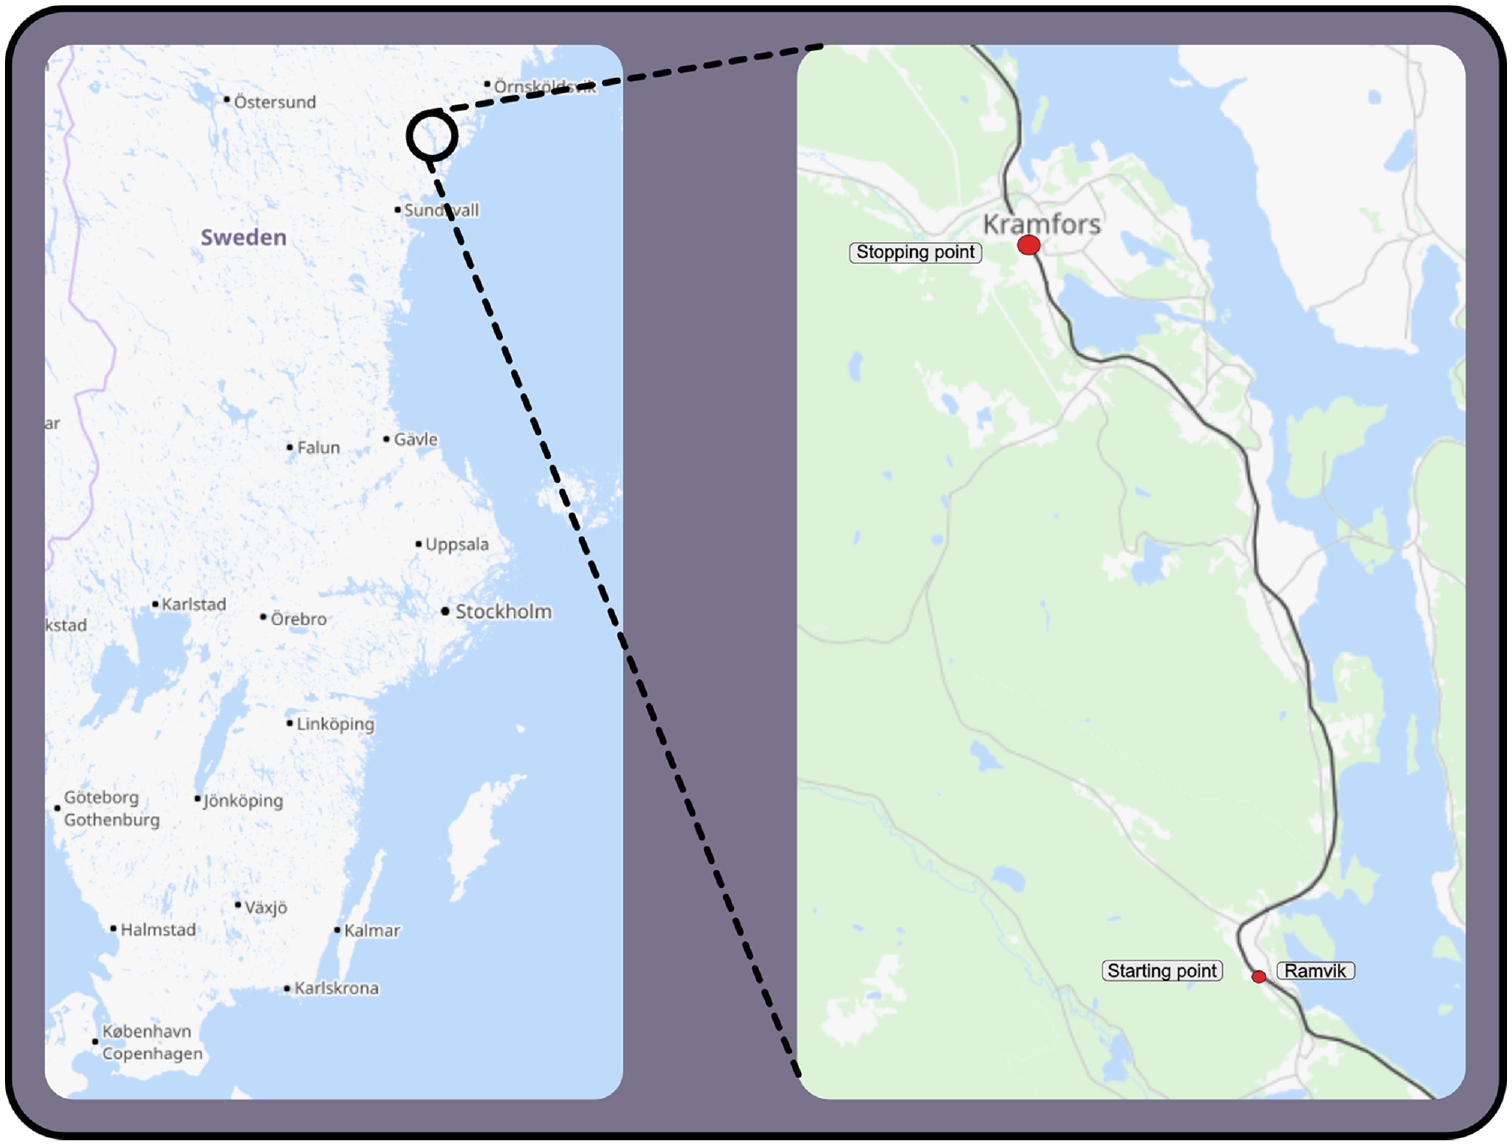
Part of the Ådal line showing the starting point in Ramvik and the stopping point at Kramfors station (25).
The basic speed profile for the selected line was implemented in accordance with the Swedish Transport Administration ERTMS project ( 11 ). Two simulation scenarios were prepared, one with onboard version 3.4 and one with version 3.6. For both scenarios, the complete train route was given with one specific MA.
Participants
The participants were recruited in collaboration with the train driver academies in Nässjö and Ängelholm. Data were collected on three occasions and, in total, 39 train driver students participated in the study, 32 men and 7 women. One participant experienced fatigue, and another encountered issues with the simulator hardware. As a result, both were excluded from the runtime and braking measurements, leaving driving behavior data from 37 participants. The motive for choosing train driver students and not experienced drivers was that this group was considered to be homogenous but at the same time familiar with the train driving simulator. All participants had previous experience of a similar train simulator as a natural component of their education, however not of driving on this specific line.
Procedure
On arrival, the participants were given oral and written information about the study and agreed to participate by signing an informed consent form. The simulator test was preceded by driving instructions, presented in two instruction videos performed by an experienced ERTMS teacher. In the first video, general information about ETCS track signs was given. In the second video, general ETCS driving was presented with comments on the ETCS DMI information. The total time for the instruction videos was roughly 15 min. This was followed by a 5-min training session in the simulator, including a specific presentation of each onboard version respectively. There was also the opportunity to ask questions about the simulator and the experiment. The participants were asked to drive as if they had a timetable without any time supplements, meaning that they had to actively follow the speed profile. All participants completed two runs, with onboard version 3.4 and 3.6 respectively, and the order was balanced.
Measures
To measure driving behavior, extensive vehicle data were collected during the test. The participants’ subjective workload was captured with a questionnaire.
Data Logging
A data logging mechanism, related to the driver’s interactions with the signal system and train performance, was implemented in the simulator software. The function enabled data of interest to be sampled. For driving behavior, the following parameters were registered:
Train clock (s)
Train speed (km/h)
Distance to target (LOA and EOA) (m)
Permitted braking curve (km/h)
Indication braking curve (km/h)
Pre-indication location (m)
Train position, track coordinate (m), and route position (m)
Most restrictive speed profile (MRSP) (km/h) and (m)
To avoid the effects of start and stop behavior, running time was measured from track coordinate 445,340 to 460,029 m (14.7 km).
Driver Braking toward LOA
To enable a brake comparison between the system versions, the driver braking behavior was measured with the pre-indication location as a reference. This is the location where the drivers get the pre-indication of an approaching target, and the onboard equipment enters PIM (see section DMI standardization and development). The brake measures are defined in Figure 8, where braking time is the running time from entering PIM to the end of the P-curve. With this definition, the braking or coasting phase has started or is about to start. Of main interest is the train position in relation to the braking curves, not exclusively the exact point of inducing the braking with the brake levelers. The same start location was used for both onboard versions, although the pre-indication location and PIM state have been removed in the System Requirements Specification v3.6 ( 23 ).
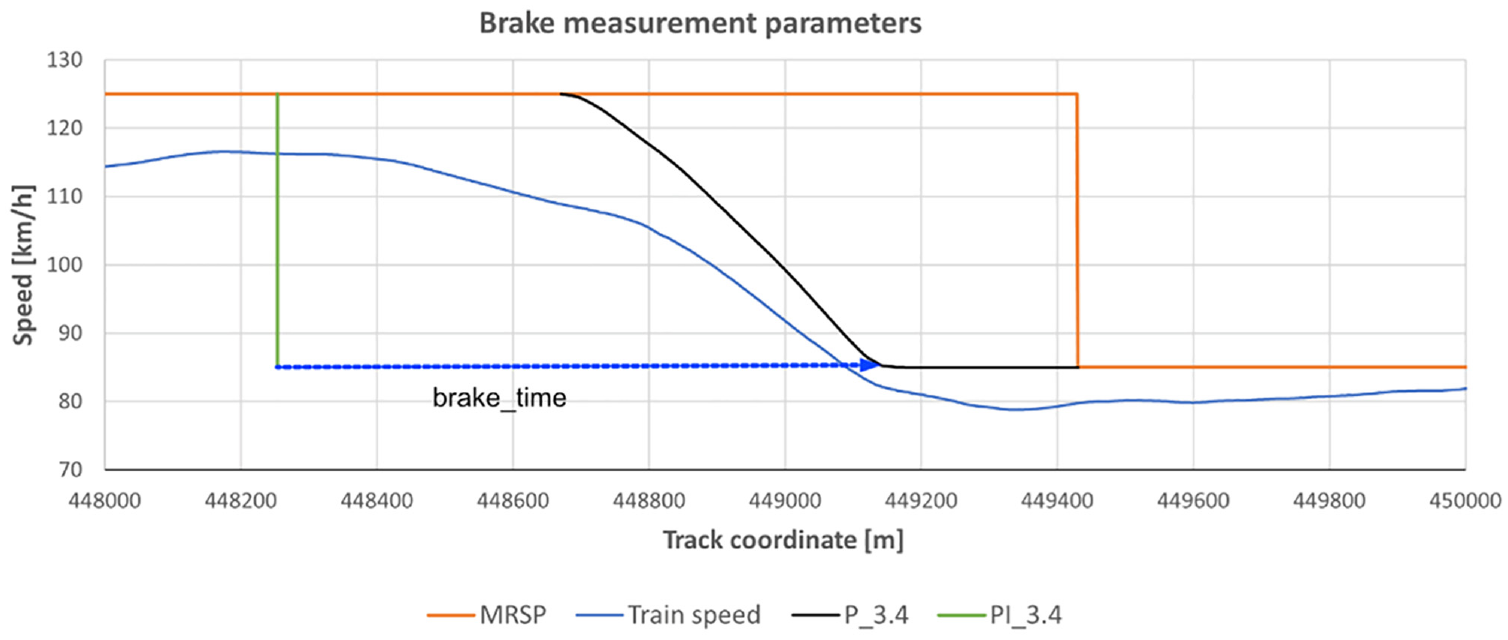
Brake measurement parameter “brake_time” (s). Most restrictive speed profile (MRSP), pre-indication location (PI), and permitted braking curve (P) are also shown.
The measurements were performed at the two largest speed changes (LOA) between track coordinates ∼448,000 to ∼450,000 m and ∼456,000 to ∼457,000 m. These correspond to a speed decrease from 125 to 85 km/h and 125 to 95 km/h, respectively. The measurement sample points are shown in Figure 9. In 12 of the brake situations, drivers did not take advantage of the permitted speed increase up to 125 km/h, therefore these samples were excluded from the analysis.
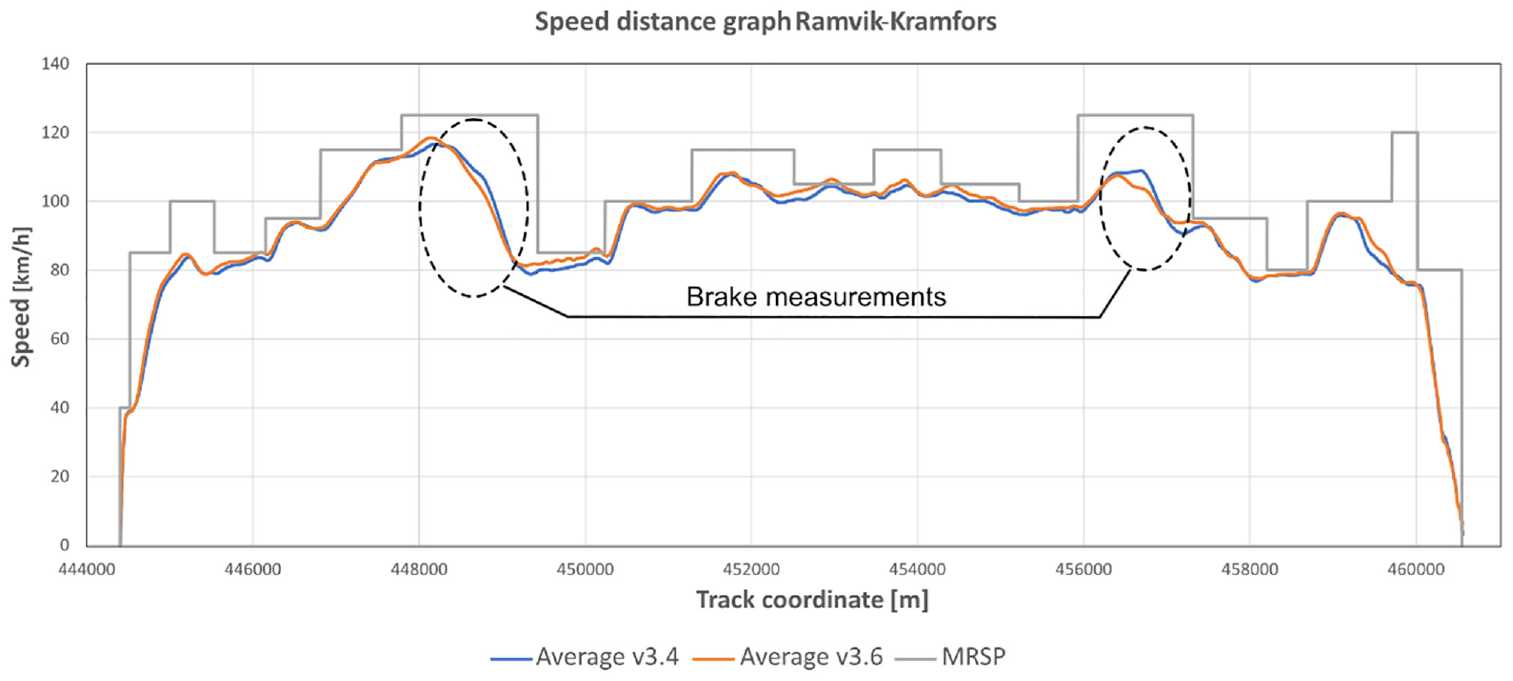
Speed–distance graph for both onboard versions based on 37 drivers. Most restrictive speed profile (MRSP) and locations for brake measurements are also shown.
Workload
After each run, the participants rated their perceived workload using the NASA Task Load Index (NASA-TLX) ( 26 ). This assessment tool is divided into the following six subjective subscales: mental demand, physical demand, temporal demand, performance, effort, and frustration. For performance, the grading is perfect (1) to failure (100), and for the other subscales very low (0) to very high (100). R-TLX, a common modification of the NASA-TLX, is obtained when the subscales are averaged without completing paired comparisons ( 27 ). To examine the effect of the onboard version, the R-TLX was used, both for each subscale respectively and as an average over the subscales, generating a global workload score. In a meta-analysis of global NASA-TLX workload scores ( 28 ), the classification of task types includes the following two tasks that can be considered analogous to train driving: driving a car (real or simulated control and operation of motor vehicles) and monitoring tasks (change detection, speech detection, and vigilance).
Results
In the following sections, the effects of going from ETCS onboard version 3.4 to 3.6 on running time and braking behavior are presented. This is followed by the effects on workload.
Running Time
A Shapiro–Wilks check on the data sets showed that the data were not normally distributed. With regard to the running times for 14.7 km driving, measured to the station in Kramfors, a Wilcoxon signed-rank test showed a significant difference (Z = 3.3, p < .001) between version 3.4 and 3.6. The difference between the average running time was 5.1 s (∼1%). The effect size according to rank-biserial correlation was rrb = 0.61. Descriptive statistics are displayed in Table 1.
Descriptive Statistics for Running Time and Mean Speed for the Two DMI Versions
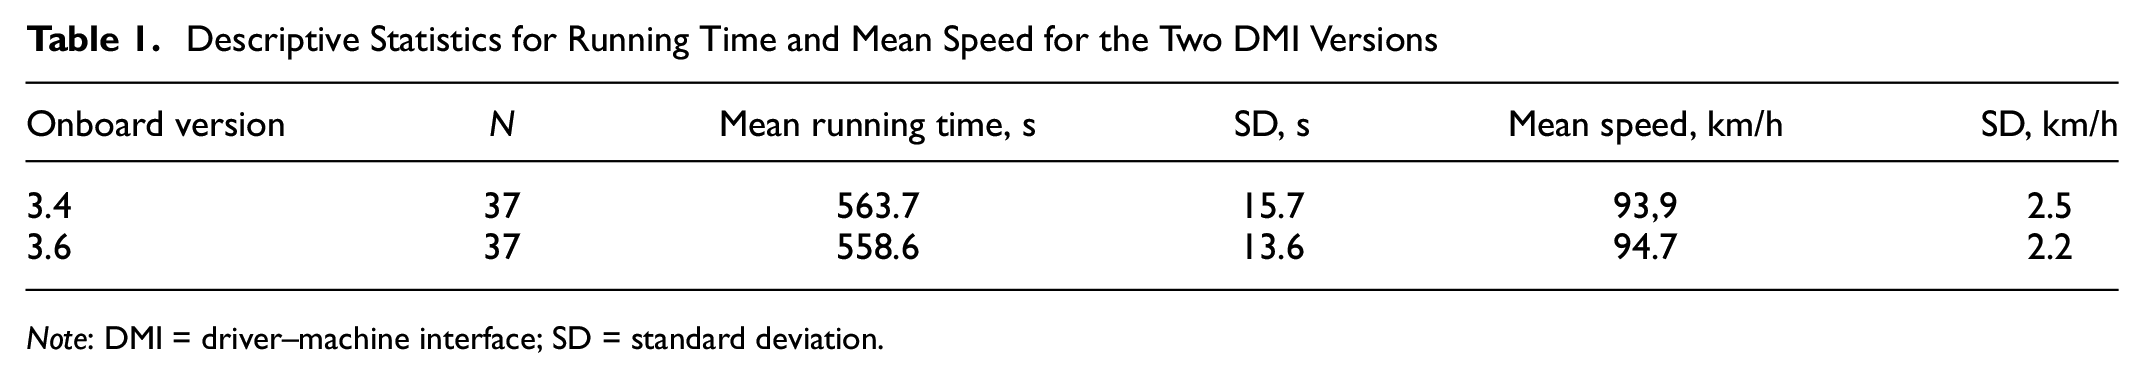
Note: DMI = driver–machine interface; SD = standard deviation.
An overall view of the train runs, based on average speed–distance calculations for 37 drivers, are displayed in Figure 9. From a driving phases perspective (acceleration, cruising, coasting, and braking), the running time difference between the two onboard systems has several causes. Specifically, the contribution from the acceleration phases is visible in Figures 10 and 11. The speed restriction highlighted in Figure 9, and the results from the corresponding brake measurement evaluation are presented in the next section.
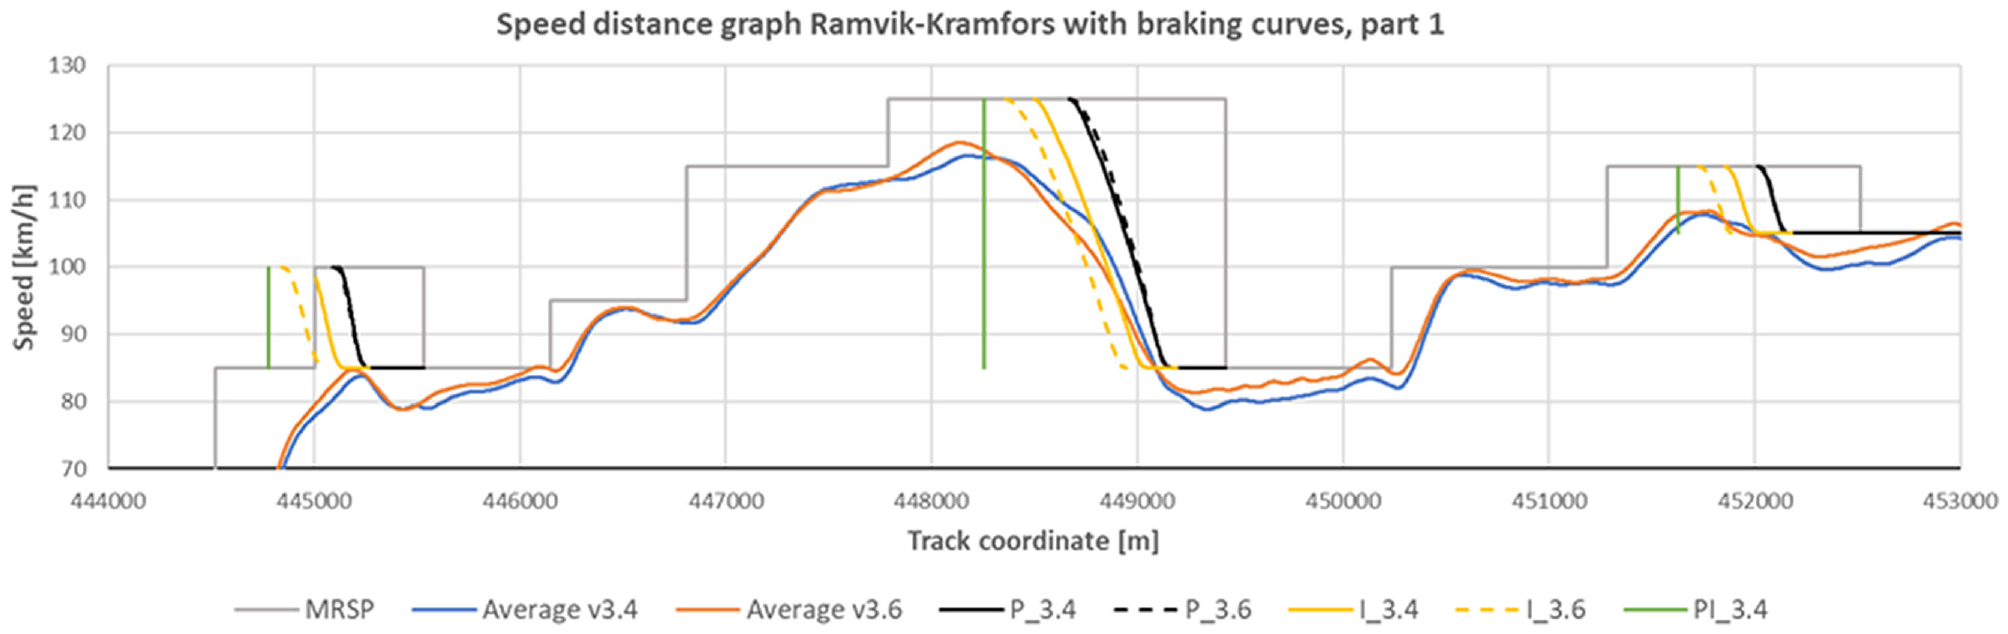
Speed–distance graph together with pre-indication location (PI), I-curves, and average P-curves. First part of the line.
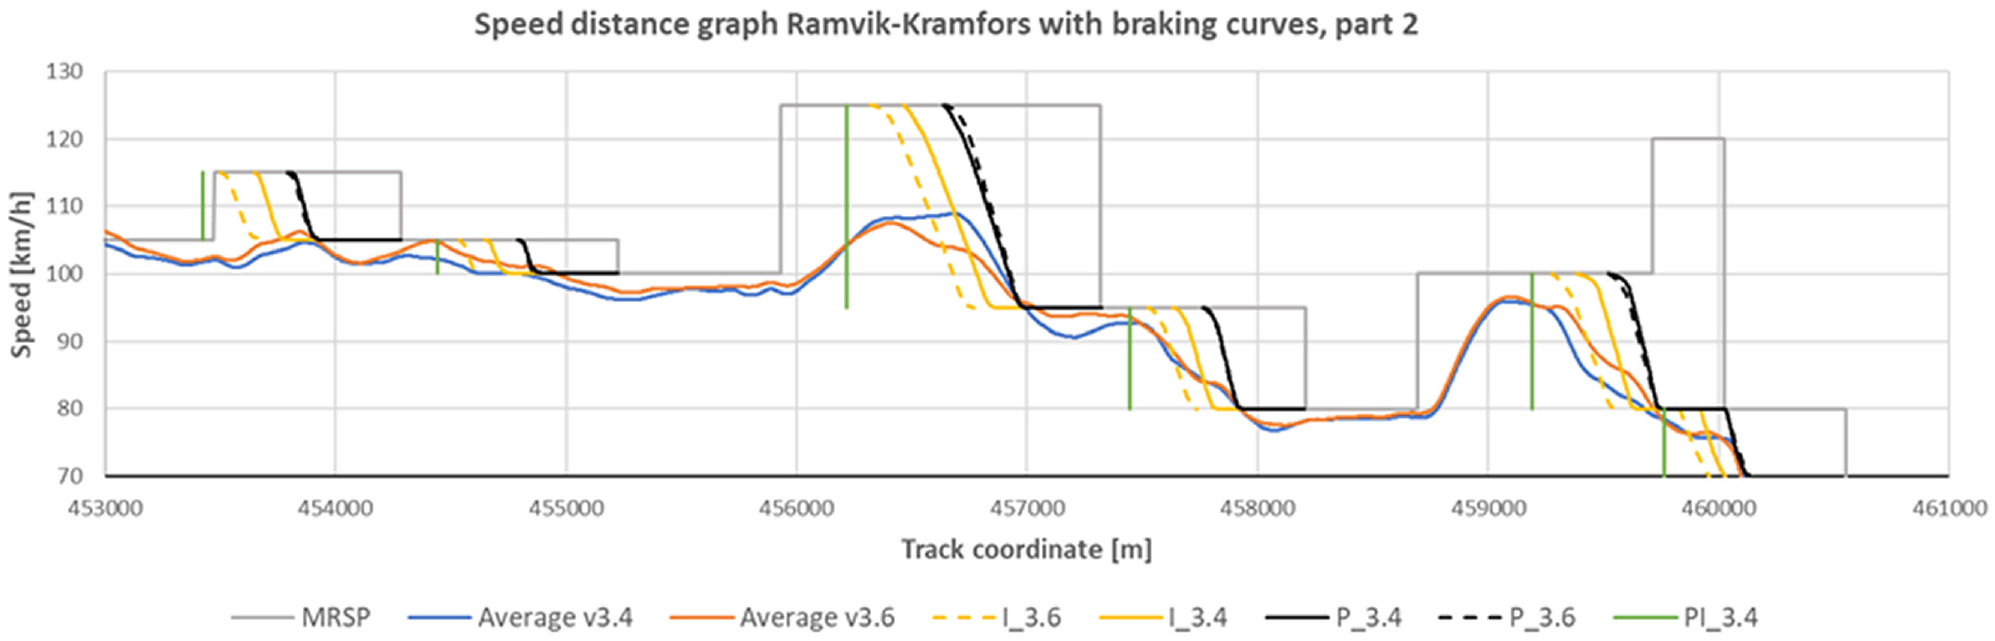
Speed–distance graph together with pre-indication location (PI), I-curves, and average P-curves. Second part of the line.
Driver Braking
For readability reasons, the speed–distance graph with the corresponding braking curves is presented in Figures 9 and 10. Visual inspection of Figures 8 and 10 indicates that from a higher initial speed (at coordinate ∼448,000 and ∼456,000 m), the drivers braked earlier with system version 3.6, compared with 3.4. In relation to the deceleration toward stop, EOA, the information is more visible on the version 3.6 interface than with 3.4, which could explain the opposite braking behavior. The slight difference between the two P-curves was because of the onboard calculations, as described in section Interaction between the train driver and braking curves. The relatively long safety distance between train and target point is visible for all LOAs in Figures 10 and 11.
A Shapiro–Wilks test showed that the data set (brake_time) was normally distributed. A significant difference between the braking times was revealed, such that with onboard version 3.6, with the PIM location as a reference, participants stayed in the defined braking section for 0.7 s (2.5%) longer compared with version 3.4. The measurement sample points are shown in Figure 8. A t-test revealed a significant difference: t = −2.15, p = .036 with effect size Cohen’s d = −0.27. Descriptive statistics of braking behavior are presented in Table 2. This test produced 62 valid measurements from 37 drivers braking at two locations. This was owing to 12 measurements of the original 74 being excluded because the drivers did not fully utilize the potential of the speed profile.
Descriptive Statistics of Braking Behavior, Running Time from PIM to P-Curve (s)
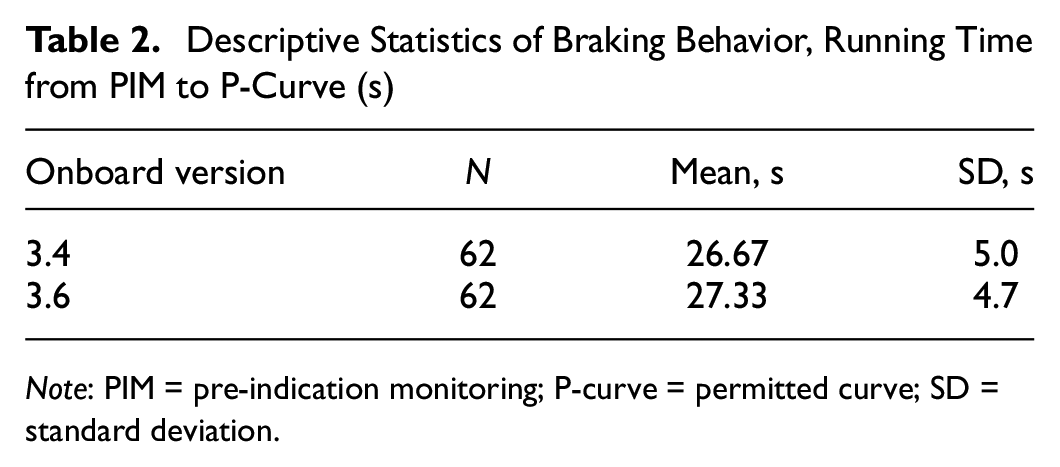
Note: PIM = pre-indication monitoring; P-curve = permitted curve; SD = standard deviation.
For the brake measurement, the LOA target is presented in Figure 12. The braking pattern for each driver is displayed for each system respectively (color-coded), alongside the braking curves.
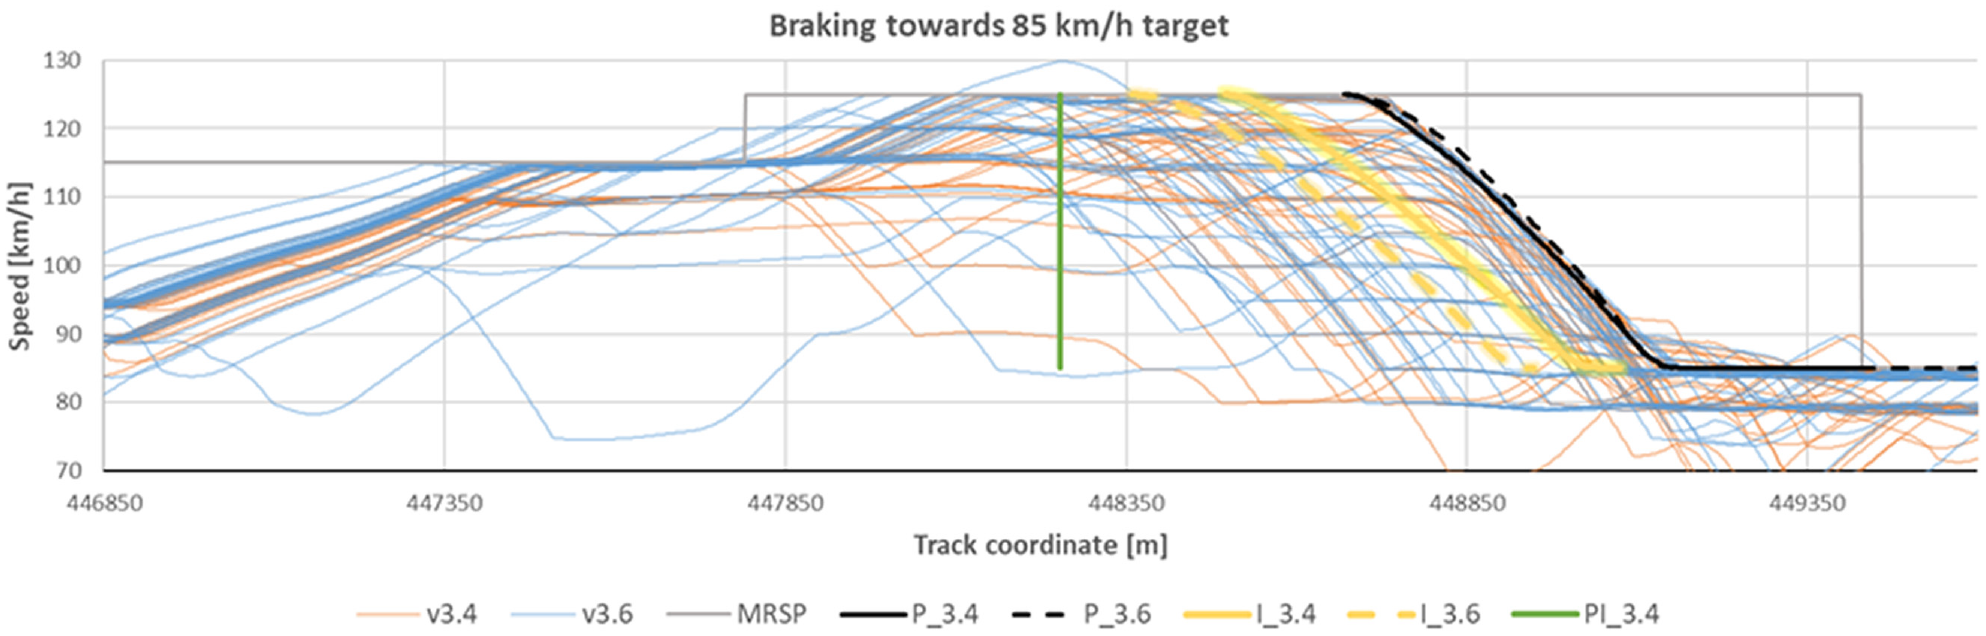
Braking pattern for the speed decrease from 125 to 85 km/h for all 37 drivers for both runs, together with PI-location, I-curves, and average P-curves.
Workload
Owing to data loss, workload data were available for 22 drivers who participated in the two later data collections. A Shapiro–Wilks check on the data sets showed that the data were normally distributed. A paired samples t-test on the global workload score of the R-TLX revealed a significant effect of the onboard version, such that workload was rated lower with version 3.6 than 3.4, t34-36(21) = 2.07 (p = .002). Examining the subscales individually, the highest values of the R-TLX ratings appeared for mental demand and effort, which was also where a statistical difference between onboard version 3.4 and 3.6 emerged (Figure 13). Paired samples t-tests revealed that with onboard version 3.6, the workload was rated significantly lower for both mental demand t34-36(21) = 3.69 (p = .001) and effort t34-36(21) = 2.40 (p = .026). Descriptive statistics of workload data are shown in Table 3.
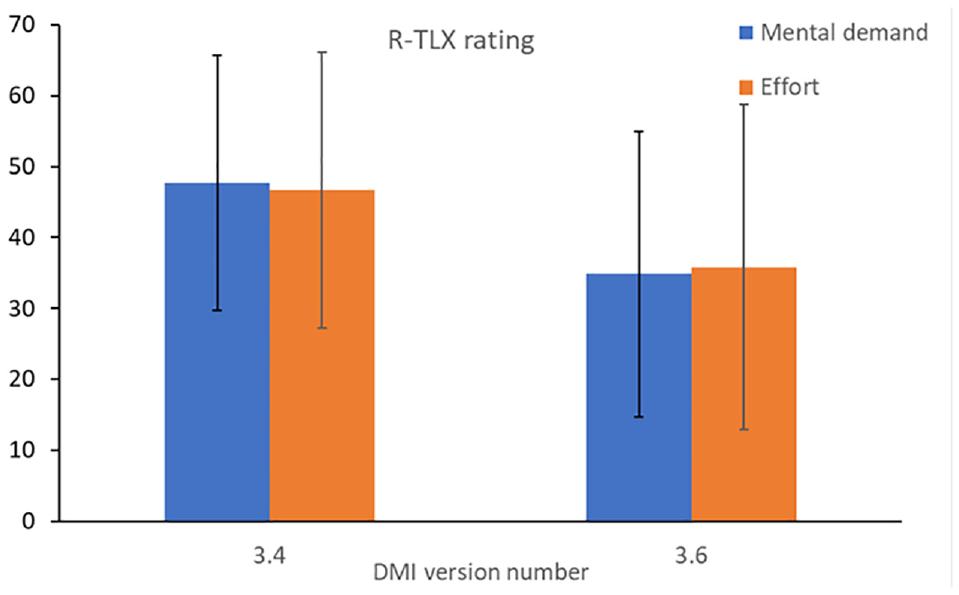
Comparison of mean R-TLX ratings for mental demand and effort. Error bars represent the standard deviation of the mean.
Descriptive R-TLX Ratings for Global Workload, Mental Demand, and Effort
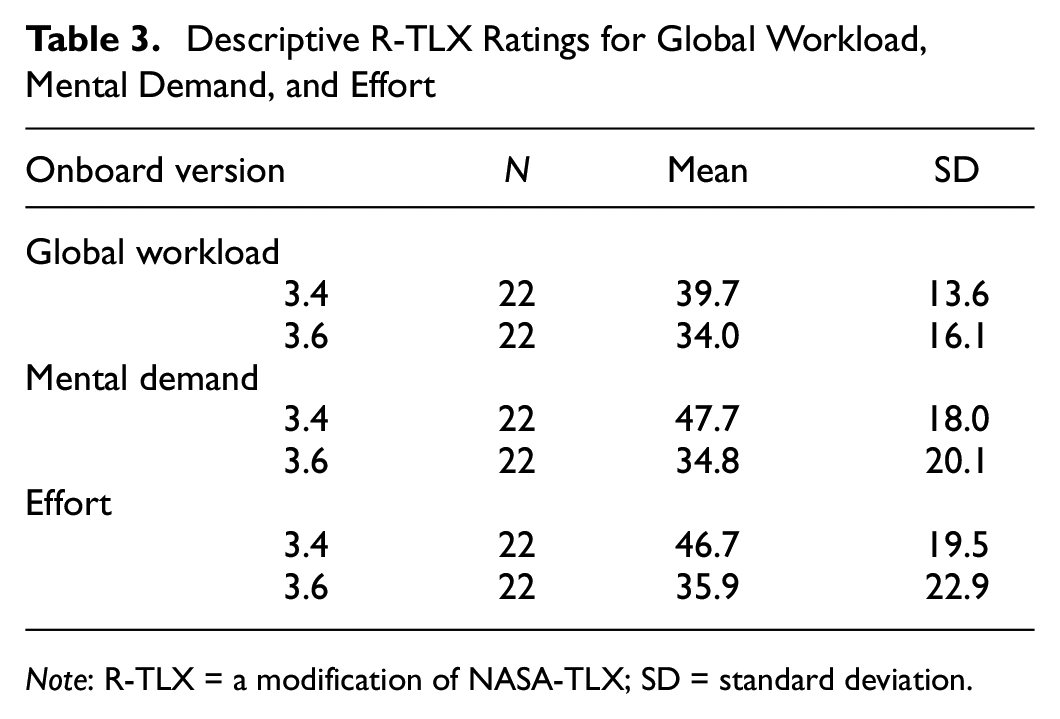
Note: R-TLX = a modification of NASA-TLX; SD = standard deviation.
Discussion and Future Work
The aim of this study was to examine the consequences and quantify the effects of changing from ETCS onboard version 3.4 to 3.6 on capacity parameters such as braking and running time as well as on human factors. For this, the following research questions were formulated: How does ETCS onboard version 3.6 affect: 1. running time? 2. driver braking toward an ETCS target? 3. driver workload?
The microscopic capacity measure running time was significantly decreased for version 3.6 compared with version 3.4—this despite the braking phase being longer for version 3.6. From the speed profile plot, it can be inferred that drivers were more confident with version 3.6, leading to a generally higher average speed. This confidence is most likely connected to the increased and clearer information provided in the DMI planning area. Further, this may be the reason for the narrowed distribution of running times, which may improve predictability for more accurate scheduling.
From an EOA perspective, the same pattern was likely to be found. In this driving task, designed to fit the main purpose of this study (see section Driving scenario), the EOA was closely preceded by an LOA of a switch point, affecting the driving behavior. This particular situation was more visible in the onboard version 3.6 interface, which is likely to improve driver confidence with the stop circumstances. Further, the DMI planning area in onboard version 3.6 displays the target speed in connection with an LOA indication. This provides the driver with more information about the conditions ahead, allowing them to accelerate to higher speeds. The absence of PIM might also compel the driver to focus more on the planning area, making them aware of the target speed and track conditions ahead. This is an additional finding outside the main scope of this paper, however of significant interest for future studies.
When it comes to the driver braking phase toward an ETCS target, the differences in the ETCS braking curves had an impact on the driver responses. The indication curve guiding the driver was further from the target in version 3.6, leading to around 1-s longer braking time for each of the investigated brakings. However, the braking measurements were performed at the largest speed changes, from 125 to 85 km/h and 125 to 95 km/h, and the effect is likely to also be correlated with the magnitude of the speed change. The quantification was based on two speed restrictions along the train route, and the effect size indicated a rather low difference between the onboard versions. From the overall analysis, the drivers probably experienced the margin to the intervention from the P-curve as narrow, leading them to the I-curve.
Figure 8 gives a hint of another phenomenon: a higher braking rate at the end of the braking phase for version 3.4, leading to a lower speed compared with version 3.6 after the deceleration phase. Examining two braking measurements on a single line, albeit with the most challenging speed profile, inevitably imposes limitations on generalizability. A more extensive braking behavior analysis with several and larger speed restrictions is a subject for future studies. Short delays on a single track can have large effects on capacity, since one delay propagates in the network. At the same time, ETCS enables a flexible speed profile implementation, making room for more frequent speed restrictions and thus more braking phases. This motivates addressing this issue.
Train driver workload was clearly affected by the onboard version, such that with the later version (3.6) the workload was statistically significantly lower. This is an interesting finding since the difference was apparent even though the driving task was straightforward and quite short. Comparing onboard versions 3.4 and 3.6, the main differences were that some information that requires driver interpretation had been removed in the later version, and clarifying information had been added. This development is in line with the suggestion that the DMI should display only essential information and avoid information of low priority to the driver ( 21 , 22 ).
A benefit when using the NASA-TLX is the ability to compare the results from a single exercise to several other studies. Specifically, thanks to the score distributions provided in a meta-analysis by Grier, the scores can be put in an interpretable context ( 28 ). In this study, the global workload corresponds to slightly over the thirtieth percentile of the overall global NASA-TLX score distribution for onboard version 3.6 and slightly over the twentieth for onboard version 3.4. This indicates that the driving task in this experiment, with either onboard version, was a task with low demands. Indeed, this was the intention since the participants were inexperienced drivers. Compared with the global workload score for driving a car ( 28 ), the global workload in this study was roughly the same when driving with version 3.4 (39.7 versus 41.5 according to Grier) and significantly lower for version 3.6. (34.0 versus 41.5 according to Grier). For both onboard versions, the workload was significantly lower compared with the global workload for monitoring (52.2) ( 28 ).
Since train energy consumption is a feature built into the train driving simulator, it was also measured in this study. Interestingly, no significant effect of the onboard version was revealed, despite the running time difference of approximately 1%. The reasons for this are unknown and present a suitable scope for future studies.
Conclusion
Conducting train driver simulator studies comparing ETCS onboard versions is a feasible method to increase the understanding of how DMI changes affect the driver as well as ERTMS microscopic capacity measures. Using a single MA enables the possibility of isolating the effects of different DMI versions. From the results of this study, comparing version 3.4 and 3.6, the following conclusions can be drawn, which add new knowledge to the field.
Onboard version 3.6 introduces a new DMI color strategy, removing the pre-indication driver state, and moving the indication state 4 s from the target. This change had a significant effect on the braking phase. Braking measures on the two highest speed changes (LOA) revealed an increased braking time of 2.5% with onboard version 3.6 compared with version 3.4.
Despite the braking phase being negatively affected from a capacity perspective, the running time decreases with version 3.6 compared with version 3.4. The running time measurements showed a significant effect of onboard versions. On average, the difference was about 1%. The reason for this is most likely that the drivers felt more confident with the new version 3.6 DMI layout. This is most important for single track lines where delays propagate in the network.
Although the driving task was short and represented a low workload demand, the effect of the onboard version on driver workload was apparent. The R-TLX global workload was significantly lower for version 3.6 than version 3.4, and the same effect was observed for the separate mental demand and effort subscales.
Footnotes
Acknowledgements
The authors wish to thank all the train driver students at Nässjöakademien and Trafikverksskolan who contributed to the project.
Author Contributions
The authors confirm contribution to the paper as follows: study conception and design: T. Rosberg; data collection: T. Rosberg, B. Thorslund; analysis and interpretation of results: T. Rosberg, B. Thorslund; draft manuscript preparation: T. Rosberg, B. Thorslund. All authors reviewed the results and approved the final version of the manuscript.
Declaration of Conflicting Interests
The authors declared no potential conflicts of interest with respect to the research, authorship, and/or publication of this article.
Funding
The authors disclosed receipt of the following financial support for the research, authorship, and/or publication of this article: This work was funded by the Swedish Transport Administration grant number TRV 2019/6490.