
Abstract
With rapid ongoing urbanization, cities across the world face a multitude of challenges in urban logistics. Delivery of goods to retail districts is particularly challenging as these places are typically located in congested urban centers. In response, policy makers have explored various freight management initiatives, including urban consolidation centers (UCC) and off-hour deliveries (OHD). This study examines the impact of these initiatives on freight flows to a retail district in Singapore. The study approach pairs empirical behavioral models and an agent-based simulation. First, using results from a stated preference survey, the choice behavior of two relevant actors—establishments that ship goods and establishments that receive goods within a retail district—and their likelihood of participating in UCC or OHD are analyzed. Then, the resulting behavioral models are incorporated into a city-scale agent-based simulator to evaluate the impact of these initiatives on freight flows, tracking multiple logistics-related performance indicators. The results show that the likelihood of participating in UCC and OHD declines when multiple actors are involved in the participation decision. Both UCC and OHD have the potential to reduce freight traffic and parking demand, although in different ways. For UCC, a minimum level of participation must be achieved to guarantee increase in vehicle load factors. OHD decreases load factors as well as the required number of dedicated trips to the retail district.
Keywords
The economic activities that sustain cities depend on urban logistics systems moving goods from places of production, distribution, or storage to places of final consumption. Freight distribution to retail districts is particularly challenging for various reasons. Retailers require frequent restocking (i.e., deliveries) because of the high value of floor area and thus limitations to inventory holding. Retail districts often provide the minimum truck parking provision mandated by regulations, which may be inadequate during peak demand. Further, retail districts attract a considerable amount of passenger vehicles and pedestrian traffic. If parking supply is inadequate, freight vehicles may compete for parking spaces, resulting in queues and illegal curbside parking. This may exacerbate traffic congestion and safety risks for pedestrians.
Cities have explored various solutions for reducing the inefficiencies and externalities arising from distribution of goods to retail districts. Supply-side solutions include improvements to the road network (e.g., dedicated freight vehicle lanes) and adjustment of freight vehicle parking spaces. Implementing such measures can be challenging because of the density of developments within retail districts, high land value, and space constraints. Demand-side solutions include restricting freight vehicle activities in certain areas, such as regulating vehicle weight and size, minimum payload factors, and types of goods carried. Other solutions are urban consolidation centers (UCC) and off-hour deliveries (OHD), which have attracted increasing attention from researchers and city authorities. Browne et al. (
1
) provide the following widely used definition for UCC: a logistics facility that is situated in relatively close proximity to the geographic area that it serves be that a city center, an entire town or a specific site (e.g., shopping center), from which consolidated deliveries are carried out within that area, where a range of other value-added logistics and retail services can also be provided.
OHD is a policy aiming to encourage establishments to shift their freight deliveries to “off-hours,” typically during the night. There are instances of UCC and OHD trials with or without incentives. In general, with UCC and OHD, total operational hours for shippers’ vehicles are expected to come down. With a UCC, shippers are expected to deliver their shipments to the UCC anytime during the operational hours. As a result, shippers can avoid direct delivery to multiple receivers as well as associated driving and parking nuisances. Similarly, for OHD even when deliveries are made to individual receivers’ locations, the traffic conditions at the delivery locations are expected to be better than during daytime peak hours, thus enabling the shippers to complete the deliveries in less time.
Examples of UCC that have brought about positive changes in freight distribution to retail districts include Binnenstadservice in Dutch cities, the Netherlands ( 2 , 3 ), Bristol–Bath Freight Consolidation Centre in the United Kingdom ( 3 – 5 ) La Petite Reine in Paris, France ( 5 ), and Motomachi Joint Delivery Centre in Yokohama, Japan ( 3 , 6 ). Pilots demonstrating the potential of OHD for retail distributions have taken place in New York City (United States) ( 7 , 8 ), Bogotá (Colombia), São Paulo (Brazil) ( 8 ), and Brussels (Belgium) ( 9 ). Despite these pilot programs, success is not guaranteed. Particularly for the UCC trials, many have failed because of poor participation from freight establishments and resulting low throughput, leading to end of operations ( 10 ). This shows the importance of thorough ex ante assessments of solutions, to better guide their implementation and increase the likelihood of success.
As a result of the inherent heterogeneity of retail logistics (goods, preferences, agents), the receptiveness to either of these initiatives among different establishments (agents) may vary—different segments of the market may prefer one policy over the other. Therefore, in this study, the establishment preferences for UCC versus OHD are analyzed. Although the solutions are not mutually exclusive, feedback from establishments and project sponsors was considered in this research design, allowing to assume this decision fit for the local context.
Establishments are the agents making the choice of whether to participate in the voluntary initiatives. Holguín-Veras et al. ( 11 ) illustrated that shippers and receivers are bound to play a key role in decision making and likely to influence the decision of carriers. Whereas most existing studies focus on only one among the three important establishment roles—shipper, carrier, or receiver—because of lack of behavioral data ( 11 ), an alternative option is to study the behavior of two dominant decision makers—shippers and receivers. This helps to study how the interactions between these agents influence the participation in these initiatives. Additionally, the behavioral models for establishment participation are developed and integrated into a city-scale agent-based simulator developed for urban policy analysis. Such modeling framework, and subsequent application, makes this research unique. Most research compromises on the participation model or the vehicle operations planning models or the traffic simulation. The simulation is conducted to examine the introduction of the solutions to a retail district in Singapore and associated changes to freight flows. This study focuses on the impact of UCC and OHD on freight flows to a retail district, although the assessment of financial viability of these initiatives remains outside the scope of the study.
This paper is organized into five sections. The second section provides a review of the literature on UCC and OHD participation models and evaluation methods. The third and fourth sections, respectively, describe the methods used in this study and present the results. The final section concludes with limitations and directions for future research.
Literature Review
This section reviews the methods used in UCC and OHD evaluations and how establishment participation in these initiatives is modeled in each of these methods. We can group the literature on UCC and OHD evaluation methods into five categories: (i) case studies, (ii) multi-criteria analysis, (iii) analytical models, (iv) traffic simulations, and (v) agent-based simulations and stated preference (SP) methods. Studies belonging to each category are briefly described in the following.
Case Studies
The general UCC or OHD concept can be evaluated through reviews of past trials and ongoing operations in different cities. This method was used by Browne et al. ( 1 ), Allen et al. ( 10 ), Nordtømme et al. ( 12 ), and van Duin et al. ( 13 ) to evaluate UCC initiatives, and by Brom et al. ( 14 ) and Holguín-Veras et al. ( 7 ) to evaluate OHD initiatives. Data on establishment participation during the pilots are directly used in such assessments, without yet developing a model of establishment participation. These studies identified freight establishment participation in UCC or OHD initiatives as one of the critical factors for their viability. However, none of the prior mentioned evaluations modeled the relevant actors’ decisions to participate in the initiative.
Multi-Criteria Analysis
As the name suggests, this group of studies evaluates an urban freight policy based on multiple criteria. Verlinde and Macharis ( 15 ) conducted an ex ante evaluation for an OHD scheme for supermarkets in Brussels using multi-stakeholder multi-criteria analysis (MAMCA), where preferences of multiple stakeholders based on multiple criteria are analyzed. UCC and OHD schemes were also studied separately by Verlinde ( 16 ), likewise using MAMCA for cities in Belgium. In this method, participation of stakeholders is not directly modeled, but stakeholders are asked to weigh the criterion they considered while making the participation decision about these initiatives.
Analytical Models
In this method, mathematical models are used to evaluate the impact of UCC and OHD initiatives. Estrada et al. ( 17 ) evaluated the economic effects of UCC and OHD initiatives using an analytical model. Mepparambath et al. ( 18 ) used an analytical model to perform an ex ante evaluation of a new UCC. A common feature of such evaluations is that participation from stakeholders is taken as a parameter in the model, which is not calibrated using real-world data. Instead, sensitivity analysis is conducted by varying the parameters of the model.
Traffic Simulations
This category of studies evaluates different aspects of a new urban freight policy with the help of traffic simulation models that simulate the impact of vehicle routes and traffic arising from introducing an UCC or OHD initiative. van Rooijen and Quak ( 2 ) used traffic simulations to study the impact of an UCC in Nijmegen, Netherlands; in this case, receivers’ participation was an input to the simulation. Iyer et al. ( 19 ) used a similar approach to evaluate the impact of OHD on traffic congestion.
Agent-Based Simulations
More recently, agent-based simulations that model agent decisions have also been used to evaluate UCC and OHD initiatives. For example, van Duin et al. ( 20 ) demonstrated the usefulness of such simulations in modeling the dynamic usage of UCCs with pricing strategies. In their experimental setup in a hypothetical city, the authors used optimization to model UCC participation where carriers seek to minimize delivery cost. Firdausiyah et al. ( 21 ) evaluated a UCC using multi-agent simulation with adaptive dynamic programming. Behavior of two types of agents—freight carriers and UCC operators—was modeled using adaptive dynamic programming-based reinforcement learning. Agent-based simulation has also been used to study the sustainability of UCC business models. van Heeswijk et al. ( 22 ) used an optimization routine for participation and expert interviews to validate some of the results. Despite this, the parameters for the cost functions that motivate participation in these studies are not fully informed by empirical data. Silas and Holguín-Veras ( 23 ) used agent-based simulation to study the effectiveness of supporting policies needed for OHD. In the analysis, it was assumed carriers and receivers participate in the OHD initiative only if both agents are better off revenue-wise. Mommens et al. ( 9 ) used agent-based simulations to study the impact of OHD on supermarkets in Belgium, where OHD participation is an exogenous input.
SP Methods
This class of studies uses SP survey data to develop behavioral models and test reactions of stakeholders to a new urban freight initiative. The literature suggests that the success of UCC or OHD in improving system efficiency and reducing negative externalities depends largely on establishment participation. An increasing amount of research is focusing on modeling relevant behaviors, as summarized in Table 1. These studies model UCC and OHD participation by single or multiple establishment roles using discrete choice models with SP surveys. Although each of these efforts developed participation models using primary behavioral data collected from establishments, none evaluated the broader transportation system implications using agent-based behavioral models, or even traffic simulation tools, which is a research gap worth contributing to.
Establishment Participation Models for UCC or OHD Developed Using Stated Preference Survey Data
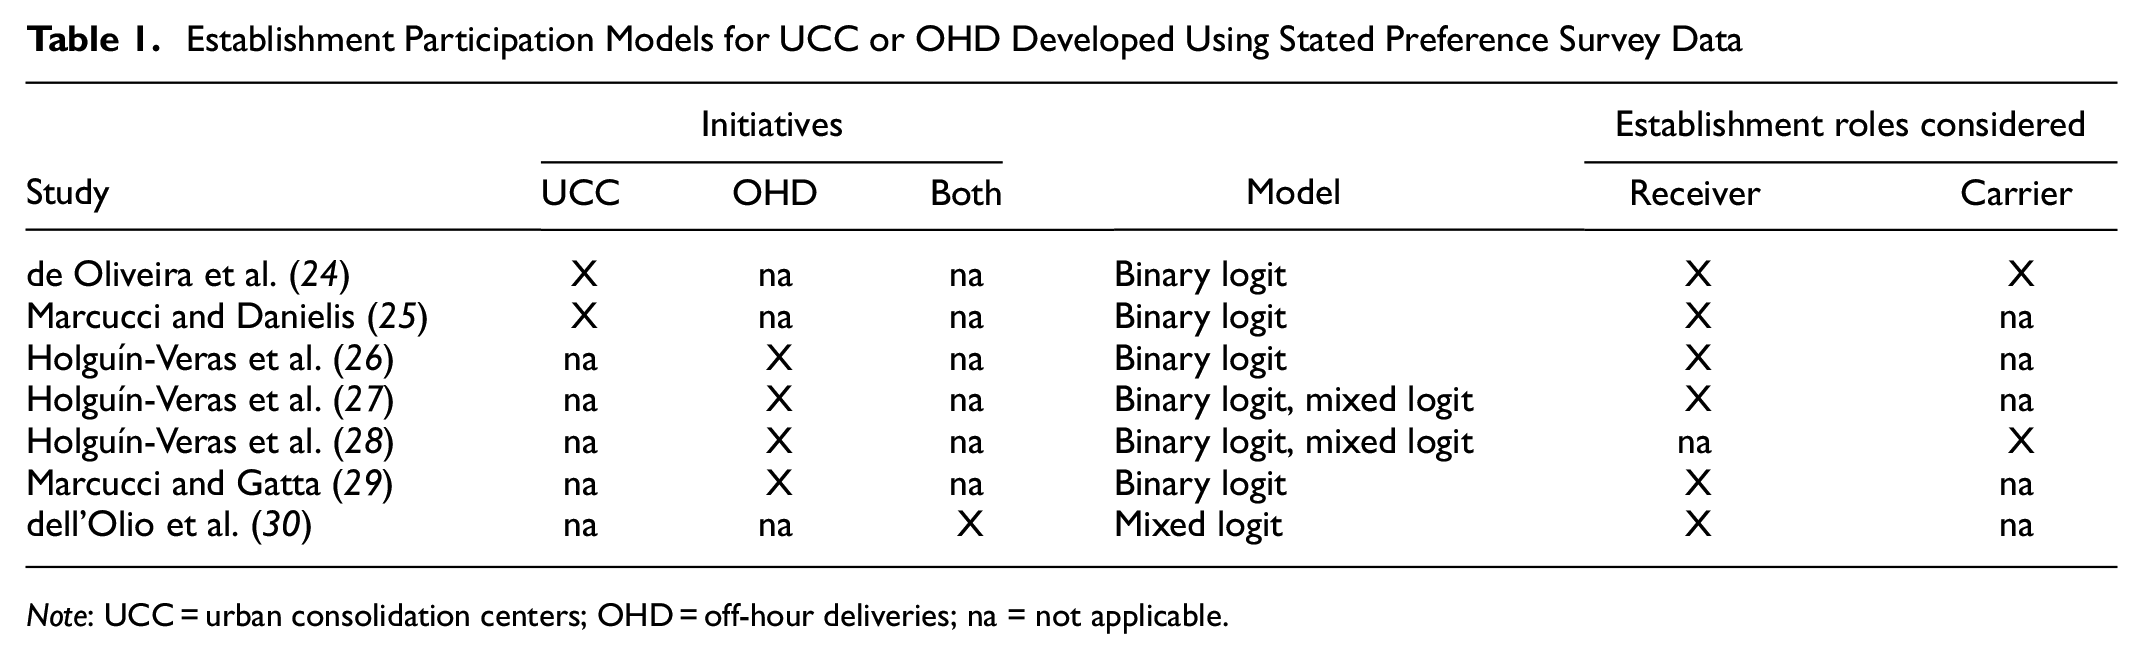
Note: UCC = urban consolidation centers; OHD = off-hour deliveries; na = not applicable.
Reviews of past/ongoing trials, traffic simulations, agent-based simulation, and SP survey methods are found to be the most common methods used in UCC and OHD evaluations. Some of the UCC and OHD evaluation studies do not model participation and use participation data from trials directly or provide participation as an input to the model. In the UCC or OHD evaluations using traffic simulations and agent-based simulations, establishment participation is often based on optimization models, in which the establishments are assumed to have a cost function and each establishment chooses a delivery option that minimizes the cost. Often, these cost function parameters are not informed by any primary data.
A majority of the studies considered either UCC ( 31 – 33 ) or OHD ( 34 , 35 ), whereas some studies ( 16 , 17 , 30 ) considered both initiatives together. Most studies limit the scope of the model application by focusing on one of the following: data collection, number of agents studied, initiatives studied, or the evaluation methods used. The current study addresses this gap by collecting primary behavioral data from two agents (shippers and receivers), developing participation models using SP and discrete choice methods, integrating the models into a city-scale agent-based simulator, and then applying it to a case study of a retail district in Singapore. In this paper, the behavior of multiple establishments and the impact of their decisions on the inherently complex urban transportation system is studied. The agent-based simulation can replicate the agent interactions and help evaluate both agent-specific and system-wide effects of solutions and their adoption. The main contribution of this study is combining the behavioral models with a city-scale agent-based simulator to evaluate the impact of both UCC and OHD.
Method
The overall framework for the study is presented in Figure 1 and details are subsequently explained.
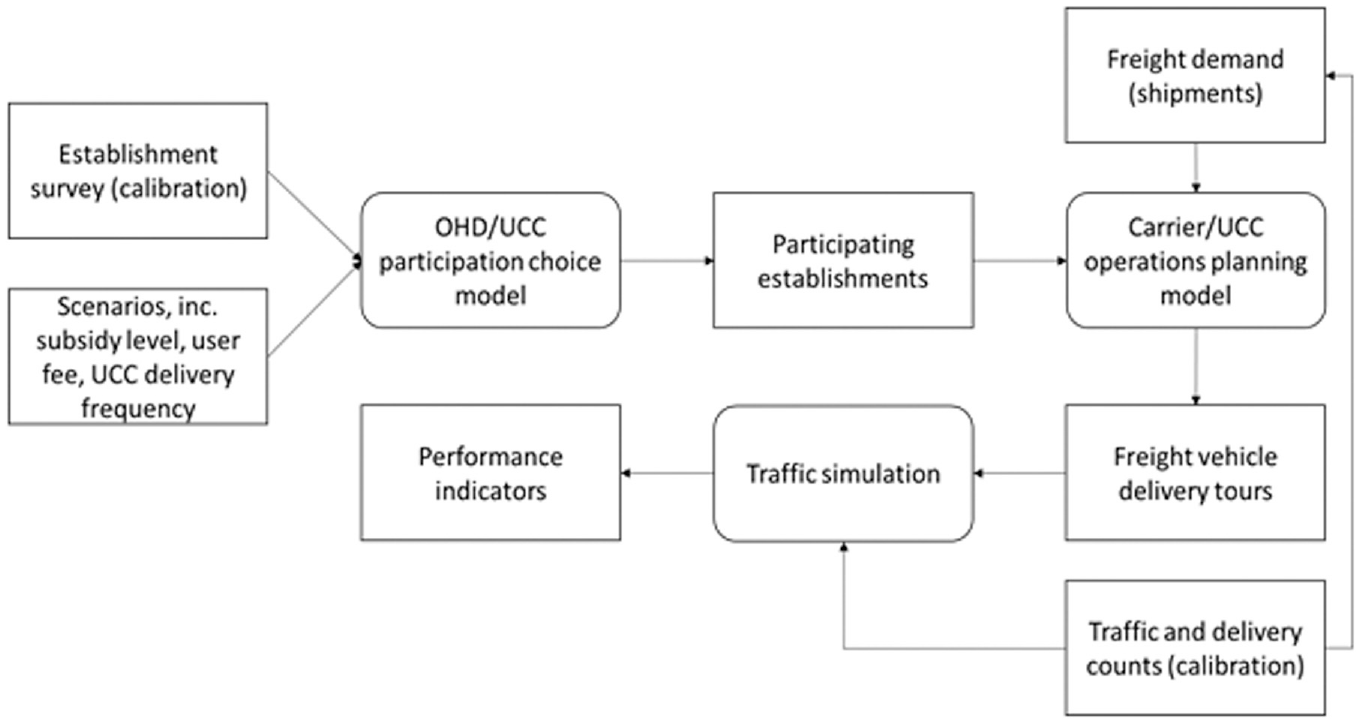
Study framework.
Establishment-Based SP Survey
A survey was conducted to collect information on establishments and their preferences for the new initiatives. The survey was structured in two sections, the first collected data on the characteristics of the establishment and the second collected choice data using an SP experiment. The first section of the survey was designed differently for shippers and receivers, with specific information relevant to each establishment role. The shippers’ survey collected establishment characteristics, such as number of employees, commodities supplied, number of customers served on a day, warehouse location, and logistics practices. The receivers’ survey collected the receiver establishment type, number of employees, floor area, frequency of receiving deliveries, and inventory holding policies. Receivers in the study are closely located and are likely to have similar land prices; therefore, this variable was not included in the receivers’ survey. Description of important variables from the SP surveys are given in Appendix A in the supplemental materials.
Whereas most of the existing studies identify the attributes for SP surveys purely based on similar studies, the attribute selection in the current study was based on both the literature and a pre-survey. A pilot of UCC and OHD initiatives was ongoing in Singapore during the time of the study. A briefing event was conducted for stakeholders as part of the pilot. The participants of this event included shipper and receiver establishments, logistic service providers providing UCC services, and the urban authorities leading the pilot. The pre-survey was conducted during the event and resulted in 15 samples from shipper establishments and 17 samples from receiver establishments. From the literature a list of important attributes was identified for UCC and OHD participation. These attributes were presented in the pre-survey for shippers and receivers to rate their relative level of importance. The final selection of attributes for the SP survey was based on this importance rating provided by shippers and receivers during the pre-survey. The attributes that presented in the pre-survey included loss of direct contact with the shipper/receiver, quality control issues of the goods, security concerns for the goods, concerns over delay in final delivery to the store, service fee, availability of subsidies, and the provision of additional services at UCC (pre-retaining/inventory holding), among others. Along with the important variables in decision making, the pre-survey revealed that one of the main concerns for both shippers and receivers about OHD was the security and quality control issues because of the non-availability of staff to receive deliveries at retail stores during off-hours. As such, the survey included two delivery options for OHD: (i) goods are delivered directly to the retail store during off-peak hours, and (ii) goods are received at a centralized receiving station located within the building during off-peak hours, to be delivered later to the retail store during regular working hours. Provision of additional services at UCC was considered in the pre-survey. There was no evidence in the pre-survey that this provision would influence the decision to participate in the initiative. Therefore, it was not included in the final SP survey and the subsequent model. As part of the pilot run of UCC and OHD initiatives, urban planning authorities in Singapore have selected a few logistic service providers to run these initiatives ( 36 , 37 ). The levels for the selected attributes in the SP survey were derived based on the information collected from these service providers. For example, the service fee was based on the fee they charged and the store delivery time attribute was based on the typical time lag between the handover of goods at UCC and delivery at the store. The levels of subsidy were also selected based on the pilot run in which the participating establishments received up to 70% subsidy on the fee ( 37 ). Based on the findings from the pre-survey and feedback from the service providers, the following attributes and levels were used for the UCC and OHD alternatives in the SP survey.
• UCC alternative:
– Store delivery time:
▪ 2 h from handover of goods at UCC
▪ 6 h from handover of goods at UCC
– Service fee:
▪ None
▪ S$1.40 per carton (S$1.00 = USD$ 0.75 as of November 2020, carton size = 59 cm × 40 cm × 37 cm [length × width × height])
▪ S$3.00 per carton
– Government subsidies
▪ None
▪ 30% of service fee
▪ 75% of service fee
• OHD alternative:
– Delivery type:
▪ Direct delivery
▪ Delivery to a centralized receiving station
– Store delivery time:
▪ During the night
▪ Next day morning
– Service fee for receiving station:
▪ None
▪ S$ 0.50 per carton
▪ S$1.40 per carton
– Government subsidies
▪ None
▪ 30% of service fee
▪ 75% of service fee
A random design method was used for the SP survey because it is not so complex as other alternatives and has been found to perform as well as any other design method in cases of no prior information about the choice model parameters ( 38 ). In the SP survey, five choice questions with varying attribute levels were presented to each respondent. Figure 2 provides an example of a choice question from the shippers’ SP survey.
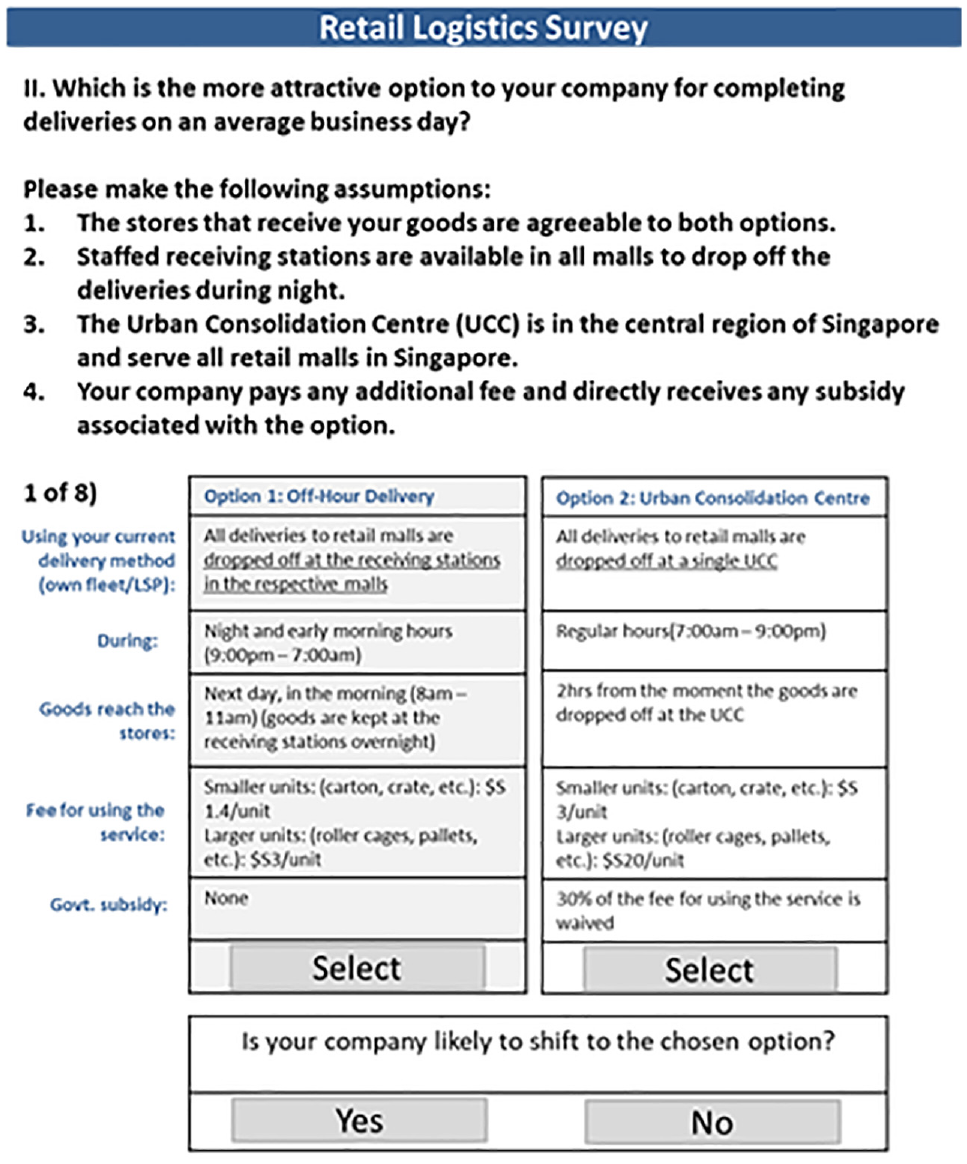
Example of a choice question from the shippers’ SP survey.
The SP design was tested using Monte Carlo simulations of choice between UCC and OHD. In this method, a true model for the respondent’s behavior is first assumed. The generated design provides a set of choice questions presented to the respondents in the survey. The responses to these questions are simulated based on the true model. The choice data thus generated are then used to re-estimate the models. The estimated model parameters and the true model parameters are compared to check the efficiency of the design and the required sample size. The assumed utility functions used for testing the design are shown in Equation 1. These utility functions are used only for SP survey testing, before data collection.


where
The details of the parameters and their assumed true values for testing are given in Table 2. The assumed true values are roughly based on Marcucci and Danielis ( 25 ) and dell’Olio et al. ( 30 ). The estimated parameter values in the Monte Carlo simulation with a sample size of 100 is also presented in Table 2. The t-statistic in the table is reported against the assumed true value, not against zero. The estimated parameter values are reasonably close to the true values with the relatively small sample size. The low t-statistic values show that the hypothesis of the estimated parameters equal to true parameter values cannot be rejected, showing that the true parameters can be reasonably recovered using a small sample size.
Estimation Results for Monte Carlo Simulation
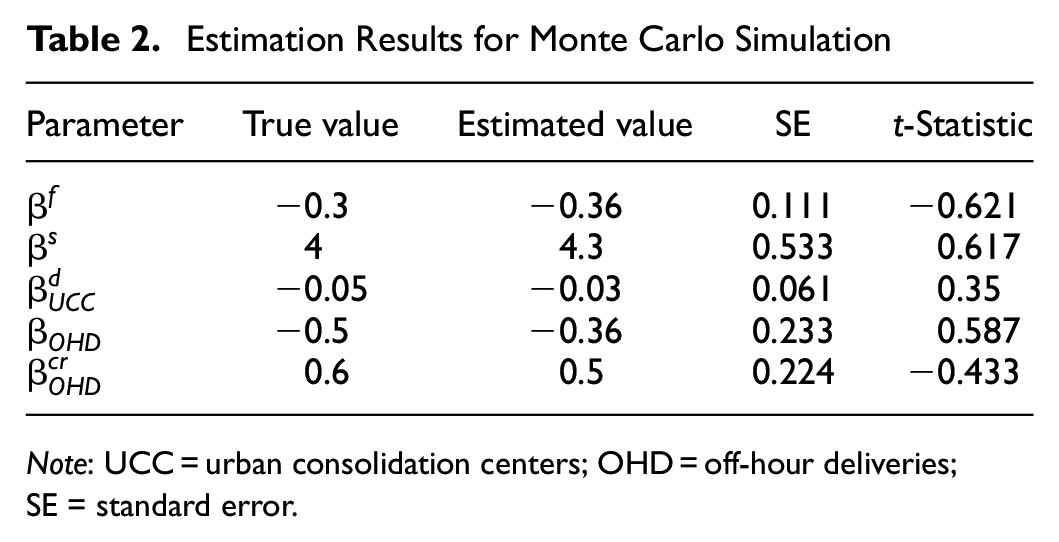
Note: UCC = urban consolidation centers; OHD = off-hour deliveries; SE = standard error.
The survey was conducted for shippers and receivers across Singapore. The target population for the shippers’ survey was establishments that send goods to shopping malls in retail districts. Establishments were selected randomly and invited to participate in the survey. The shippers’ SP survey was conducted from September 2018 to April 2019, collecting data from 95 shipper establishments on 377 choice observations. The target population for the receivers’ SP survey was all retail and food service stores located in the retail district, which is further detailed in the section discussing study area. The receivers’ SP survey was conducted from December 2018 to April 2019. Data were collected from 80 stores on 312 choice observations.
Choice Model for Establishment Participation
When deciding whether to participate in the initiatives, a shipper or receiver must choose from the following options to send or receive their goods: (i) participation in UCC (labeled UCC), (ii) participation in OHD (labeled OHD), or (iii) non-participation (status quo, labeled SQ). The decision-making establishment is characterized by establishment-specific variables. Similarly, the alternatives UCC, OHD, and SQ are characterized by their respective attributes. In line with the random utility theory, it is assumed that an establishment chooses the delivery option that maximizes its utility, which is a function of the characteristics of the establishment and the attributes of alternatives. That is, an establishment chooses an alternative such that the utility for the alternative is as specified in Equation 2.

An MNL model was specified for shippers’ and receivers’ participation because of its advantages and suitability for this context. An MNL model is tractable and straightforward to estimate. Based on available data, different model specifications were explored for shippers’ and receivers’ choice. Two main categories of variables are considered for modeling: (i) variables specific to the alternative and (ii) variables specific to the establishment. The establishment-specific variables that were collected as part of the SP survey were different for shippers and receivers. Here, we list the variables used for modeling:
• Alternative-specific variables (common to shippers and receivers):
– Fee (
– Subsidy (
– Delay owing to UCC (
– Centralized receiving station (
• Establishment-specific variables for shippers:
– Customer count (
– Vehicle count (
– Cold supply chain (
• Establishment-specific variables for receivers:
– Food service outlet (
– Supplier count (
Both the literature review and the pre-survey highlighted the importance of alternative-specific variables in an establishment’s decision to participate in the initiatives. Therefore, these alternative-specific variables were considered in the model. To account for the heterogeneity of decision makers, the establishment-specific variables were also considered in the models. Although there were other establishment-specific variables available from the SP survey, they were not found to be statistically significant in the t-test; therefore, they were not included in the final model.
Fee and subsidy are two alternative-specific variables that would influence the utility of both UCC and OHD alternatives. In SP surveys, the subsidy is presented as a percentage of fee. We can assume that establishments would only be concerned about the additional cost incurred, which would be equal to (1 − subsidy) fee. Therefore, the variable additional cost is used in the utility function. This would also reduce the number of parameters to be estimated, compared with considering fee and subsidy as two separate variables. This study’s sample size is relatively small and we would like to reduce the number of parameters to be estimated. The establishment incurs no additional cost if it chooses the SQ option; therefore, this variable will not be part of the utility function for SQ. Delay for UCC is an alternative-specific continuous variable related to UCC and would be part of the utility function for UCC alternative. The centralized receiving station variable is a dummy variable that would enter the utility function for the OHD alternative.
There are two types of taste variations or preference heterogeneity of decision makers: (i) systematic taste variations and (ii) random taste variations. Systematic taste variations among decision makers can be incorporated into an MNL model with the help of market segmentation. We develop a model for shipper and receiver participation that considers systematic taste variations among the establishments by introducing establishment-specific variables. In the model selection process, different combinations of available variables are explored and models that have better goodness-of-fit, as given by McFadden’s


where
Similarly, the selected receiver model specification is given by


where
Agent-Based Simulation for Performance Evaluation
SimMobility
To simulate the traffic impacts of the initiatives, an agent-/activity-based simulation platform called SimMobility was selected. SimMobility consists of a set of supply/demand models aimed at providing insightful analyses of passenger and freight flows under different scenarios ( 39 , 40 ), including deployment of a myriad of solutions. With regard to its models, and specifically those dealing with freight flows, a set of “long-term” decision models simulates the annual commodity flow, as contracts, between establishments, and specifies expected shipment sizes and frequencies ( 41 , 42 ); then, a set of “mid-term” decision models converts shipment flows to tour-based vehicle flows, which are then assigned to the network using a mesoscopic traffic simulation alongside passenger vehicle flows. In the baseline scenario (status quo), demand and supply are set to represent an “average day.” Participation models and operational considerations for UCC and OHD solutions are integrated into the mid-term module of SimMobility, illustrated in Figure 3. The component models in SimMobility that directly influence the results of the current study are briefly explained below.
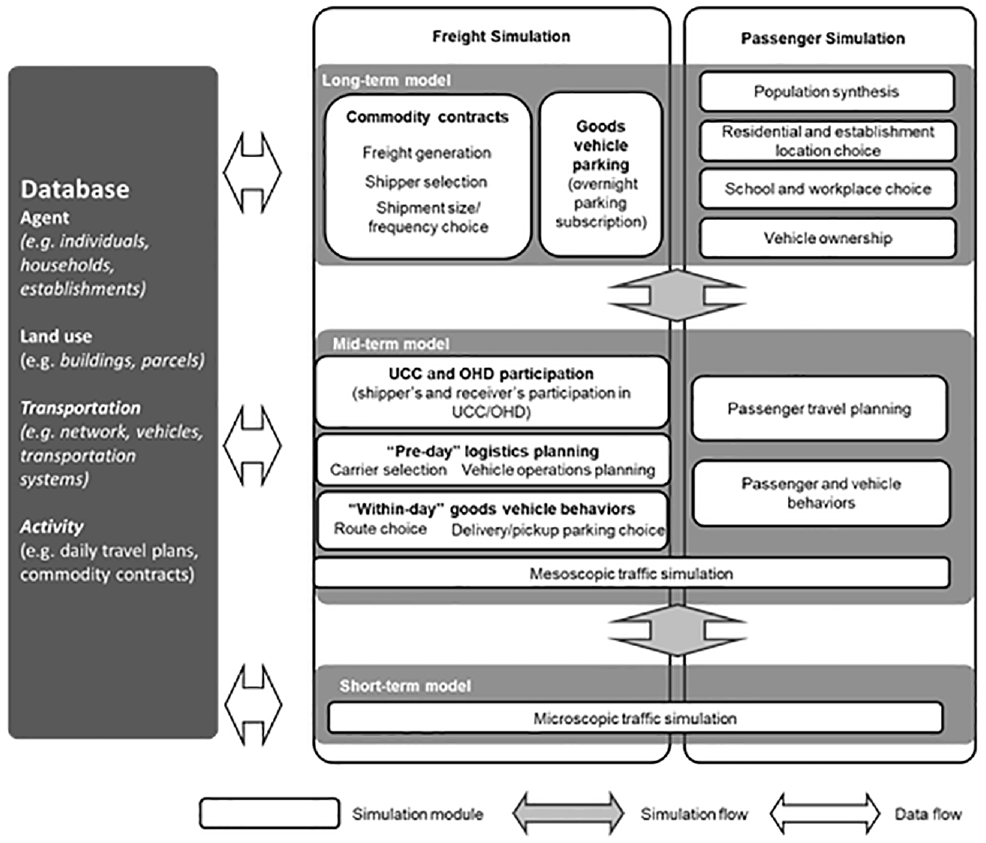
Components of SimMobility.
The freight demand used in the current study is estimated using the existing long-term models in SimMobility. In long-term SimMobility, the freight demand in the form of annual freight flows is estimated in three modules. The first module is the freight generation module, which identifies the active supplier/receiver using a binary logit model, the inbound/outbound commodity type using an MNL model and the annual production and consumption for weight using a linear regression model. The next module is the supplier selection module. In this module, each establishment that consumes a commodity selects a supplier to fulfill the demand using an MNL model, thus forming an annual contract between a shipper and a receiver. The last module in long-term SimMobility is the shipment size and frequency choice module. This module converts the annual flows from the contract into shipment size and frequency using a log-transformed regression model.
The freight vehicle tour formation in the current study follows the existing mid-term models in SimMobility. These models translate the commodity flows from long-term to vehicle flows. The mid-term model system includes three components: (i) a “pre-day” logistics planning model, (ii) a “within-day” vehicle operations model, and (iii) a mesoscopic traffic simulation model. In the pre-day logistics model, first the shipping requirement for full-truckload, less-than-truckload, or parcel shipping is determined using an MNL model. Then, the delivery time window is found using probability distributions based on the empirical data. Carrier selection is completed by assigning the shipments of goods-vehicle-owning shippers to their vehicles; for other shippers, carriers are assigned using an MNL model. The final step in the pre-day logistics model is vehicle operations planning, in which tours for each carrier are formed following a heuristic that considers the delivery time windows. In the within-day vehicle operations module, first the route choices of freight vehicles are decided based on an MNL model with a path-size factor. Then, these tours are assigned to the network in a mesoscopic traffic simulation model that also considers the other vehicles in the roads. The traffic from non-freight vehicles is estimated using the models in the passenger models of SimMobility. Further details of freight models in SimMobility are available in Sakai et al. ( 41 ) and the details of passenger models can be found in Oh et al. ( 43 ).
UCC and OHD Operations
UCC and OHD vehicles are simulated with the following assumptions:
UCC uses dedicated light goods vehicles (light commercial vehicles) to carry out consolidated deliveries to the retail district, and its fleet size is defined as per required demand to be handled. Light goods vehicles were assumed as the delivery locations are within the city center and many delivery points there have access restrictions for larger freight vehicles. As we are analyzing multiple scenarios in which the demand for UCC is different, we do not assume a constant fleet size for UCC.
UCC vehicles are scheduled to depart in hourly intervals, or early if at capacity. Receivers were found to be sensitive to the additional delay caused by UCC and this assumption was made to minimize the delay.
Shipments that arrived in the previous hour are loaded into UCC vehicles on a first-come-first-served basis and routes of these vehicles are optimized based on the routing heuristics used in the vehicle operations planning module of SimMobility. Like the previous assumption, this also helps in reducing the delivery delay.
A 10-h maximum tour duration for UCC vehicles is imposed to account for the shift change for drivers. This assumption is needed to account for the maximum working hours of the drivers.
UCC delivery operations are assumed to take place between 04:00 and 22:00 h and shipments arriving at UCC before the end of the delivery hours are delivered on the same day. Most of the deliveries to the malls take place between these hours, which we use as the operational hours of the UCC.
OHD operational hours are defined as between 21:00 and 07:00 h, which are the non-peak hours suitable for night deliveries.
User fees are S$3.00 per carton for UCC and S$1.40 per carton for a centralized receiving station in the OHD solution. The fees are fixed based on the charges in Singapore by carriers for such services.
Performance Indicators
Indicators that help in evaluating the impact of the UCC and OHD initiatives were identified on freight flows to the retail district. In addition to reporting participation, we evaluate UCC and OHD scenarios relative to the baseline scenario, that is, the status quo in the absence of these initiatives. The performance indicators evaluated are listed as follows:
• Related to the loading/unloading activity at the retail district:
– Delivery trips: Total number of delivery trips to commercial buildings (i.e., shopping malls) in the retail district in a day.
– Hourly deliveries: Total number of freight vehicles present at the commercial buildings at any given time of day. Both the arrival pattern over a day and the average arrivals per hour measured over a day are reported.
• Related to freight vehicle operations in the retail district:
– Payload: Average payload (capacity usage) of freight vehicles delivering to the commercial buildings in the retail district.
– Change in vehicle kilometers traveled (VKT) within the retail district: Change in freight VKT in a day within the retail district’s road network, compared with baseline.
Scenarios
To evaluate UCC and OHD, we first simulate the baseline scenario in the absence of these initiatives. Performance indicators from the baseline scenario act as a reference in evaluating the impact of UCC and OHD schemes. We select a few scenarios that can be grouped into two categories: (i) mandatory participation scenarios and (ii) voluntary participation scenarios. The former are extreme scenarios that are used to provide an upper bound on possible improvements from the schemes. Voluntary participation scenarios are more realistic scenarios in which the stakeholders are free to participate in any of the schemes or not. Under the mandatory participation scenarios, the level of participation in UCC and OHD is given as an input to the simulation. In voluntary participation scenarios, participation is given by the behavioral simulation of receivers and shippers. The shipper and receiver participation model developed as part of the current study is used in behavioral simulation of respective agents.
Two sets of voluntary participation scenarios are defined based on the decision maker (i.e., shipper or receiver). We assume that the decision-making agent pays for the service and receives any associated subsidy. Findings from the literature suggest that receivers are the dominant stakeholder, followed by shipper and carrier ( 11 ). In the simulation setup, we adopt this order of dominance. In the scenarios in which the receiver is the decision maker, shippers must comply with the decision made by receiver. However, for the scenarios in which shippers are the decision makers, we check the willingness of the receivers to receive goods via respective schemes, by running the receiver participation model at zero cost. Only if receivers are willing to participate, but not pay for the service, will the respective shippers get a chance to evaluate the participation in the respective scheme. Another parameter we considered in the scenario definition is the availability of government subsidies to cover the fees associated with using the OHD or UCC. Previous studies show that government subsidies help in increasing the uptake and thus the long-term viability of such initiatives.
The full set of seven scenarios simulated are listed in Table 3 along with the parameter assumptions. In the mandatory participation scenarios, all the deliveries are delivered via the respective initiative and the participation model is not used. Other parameters that may influence participation are not relevant in these scenarios and are not defined.
Scenario Definition
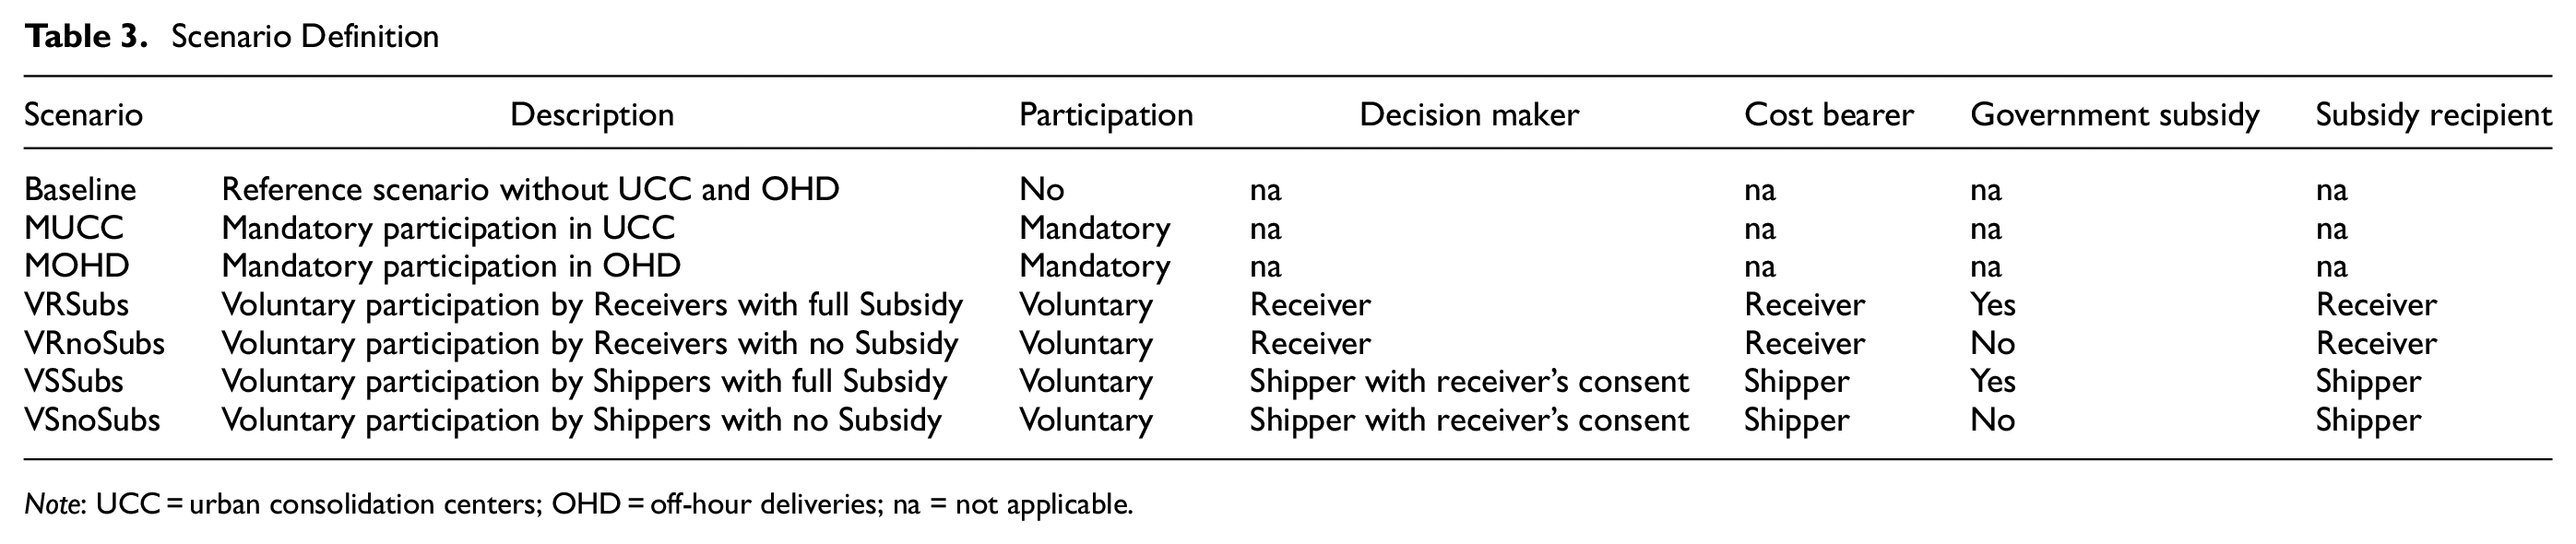
Note: UCC = urban consolidation centers; OHD = off-hour deliveries; na = not applicable.
Study Area: A Retail District in Singapore
The current study focuses on the retail sector and food services because deliveries to these sectors—or the last part of the supply chain in which the goods are transported to their point of sale—tends to be least efficient.
Singapore has aproximately 28,000 retail establishments and majority of these are located in retail malls. Despite its small land area of 719 km2, Singapore has 212 shopping malls spread across the island. The size of these shopping malls ranges from 10 to more than 500 establishments per mall. Figure 4 displays the distribution of shopping malls and their size with regard to the number of stores within each mall. The core of the city (in the south of the island) has a particularly high concentration of shopping malls, including the region surrounding Orchard Road, one of Singapore’s main shopping avenues. Shopping malls attract many deliveries, particularly to the retail and food service stores located within ( 44 ). This results in congestion at mall loading/unloading bays during peak periods ( 45 ). Therefore, this study focuses on these two industry types.
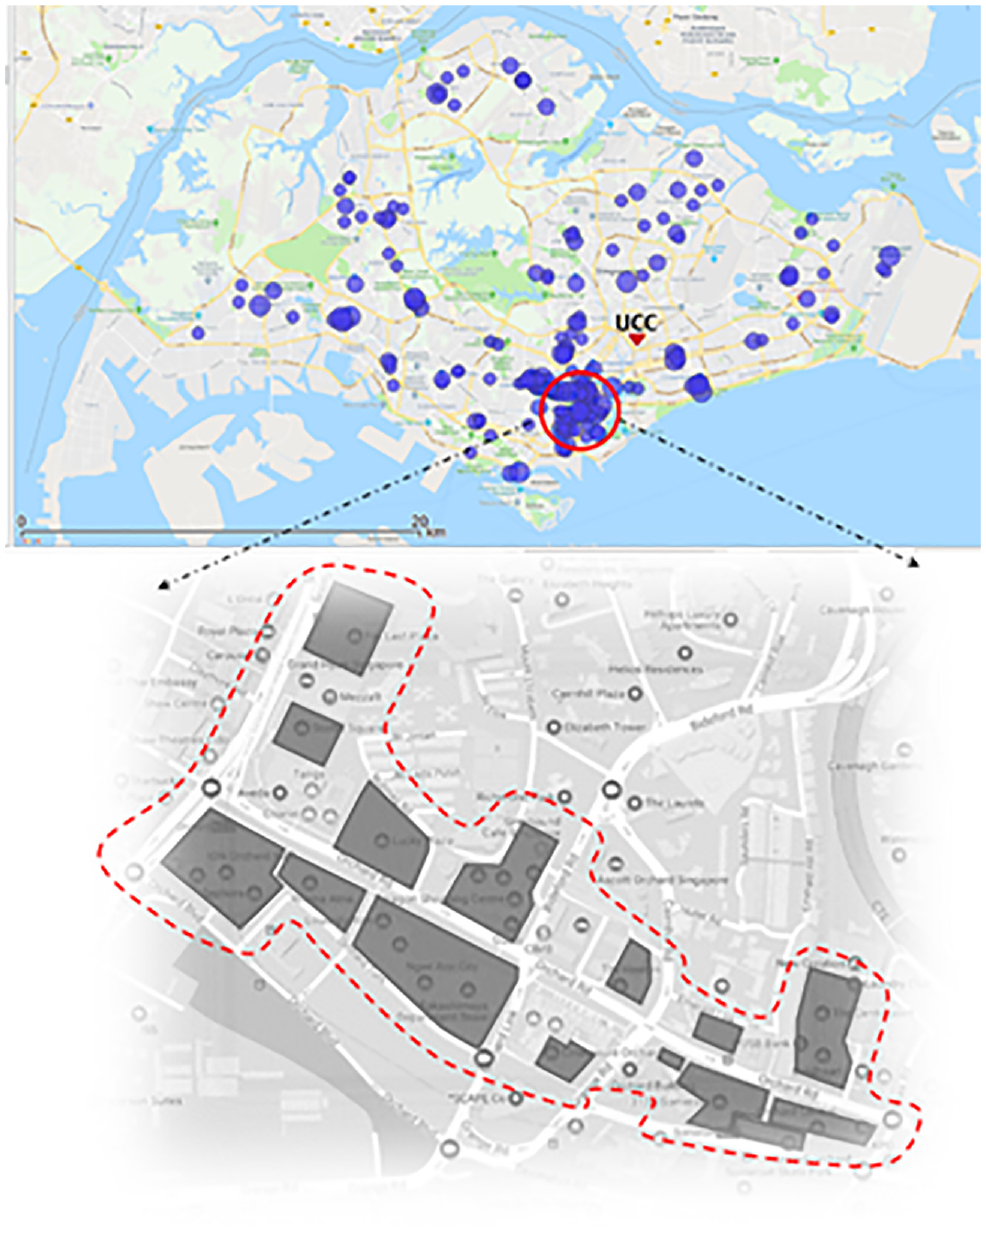
Shopping malls in Singapore (top) and the 14 malls in the retail district studied along Orchard Road (bottom).
In this case, we study the UCC and OHD initiatives for a retail district in Singapore where there is a cluster of 14 malls along Orchard Road (Figure 4). These 14 malls host 2,602 stores with 48% of stores categorized as retail, 23% as food service, and 29% as other service-related. This study assumes that the participating receivers are those located in the malls. In other words, receivers outside malls would not be engaged in OHD or UCC initiatives. Also, Cheah et al. ( 44 ) showed that among the three types of establishments located in shopping malls, retail and food service stores are the major generators of freight deliveries and other service establishments received minimal deliveries. Therefore, retail and food service establishments located in the malls were selected for the present study.
As it is a well-developed retail district with high property values, locating a freight facility like a UCC within the district itself is likely to be infeasible. Therefore, the UCC is assumed to be located in the nearest industrial area around 7.5 km east of Orchard Road. As such, the study quantifies changes to the traffic in the retail district, including all freight vehicles serving the area, as well as arrivals of vehicles to deliver at malls. As the scope of the study is restricted to the retail district, the impact beyond the retail district, such as at the origins of the flows and facility location problem for UCC, is not considered in this study.
Results
Choice Model Estimation Results
PandasBiogeme ( 46 ), an open-source software that can be used for maximum likelihood estimation, was used for model estimation. Table 4 presents the estimation results for shipper and receiver models.
Shipper and Receiver Model Estimation Results
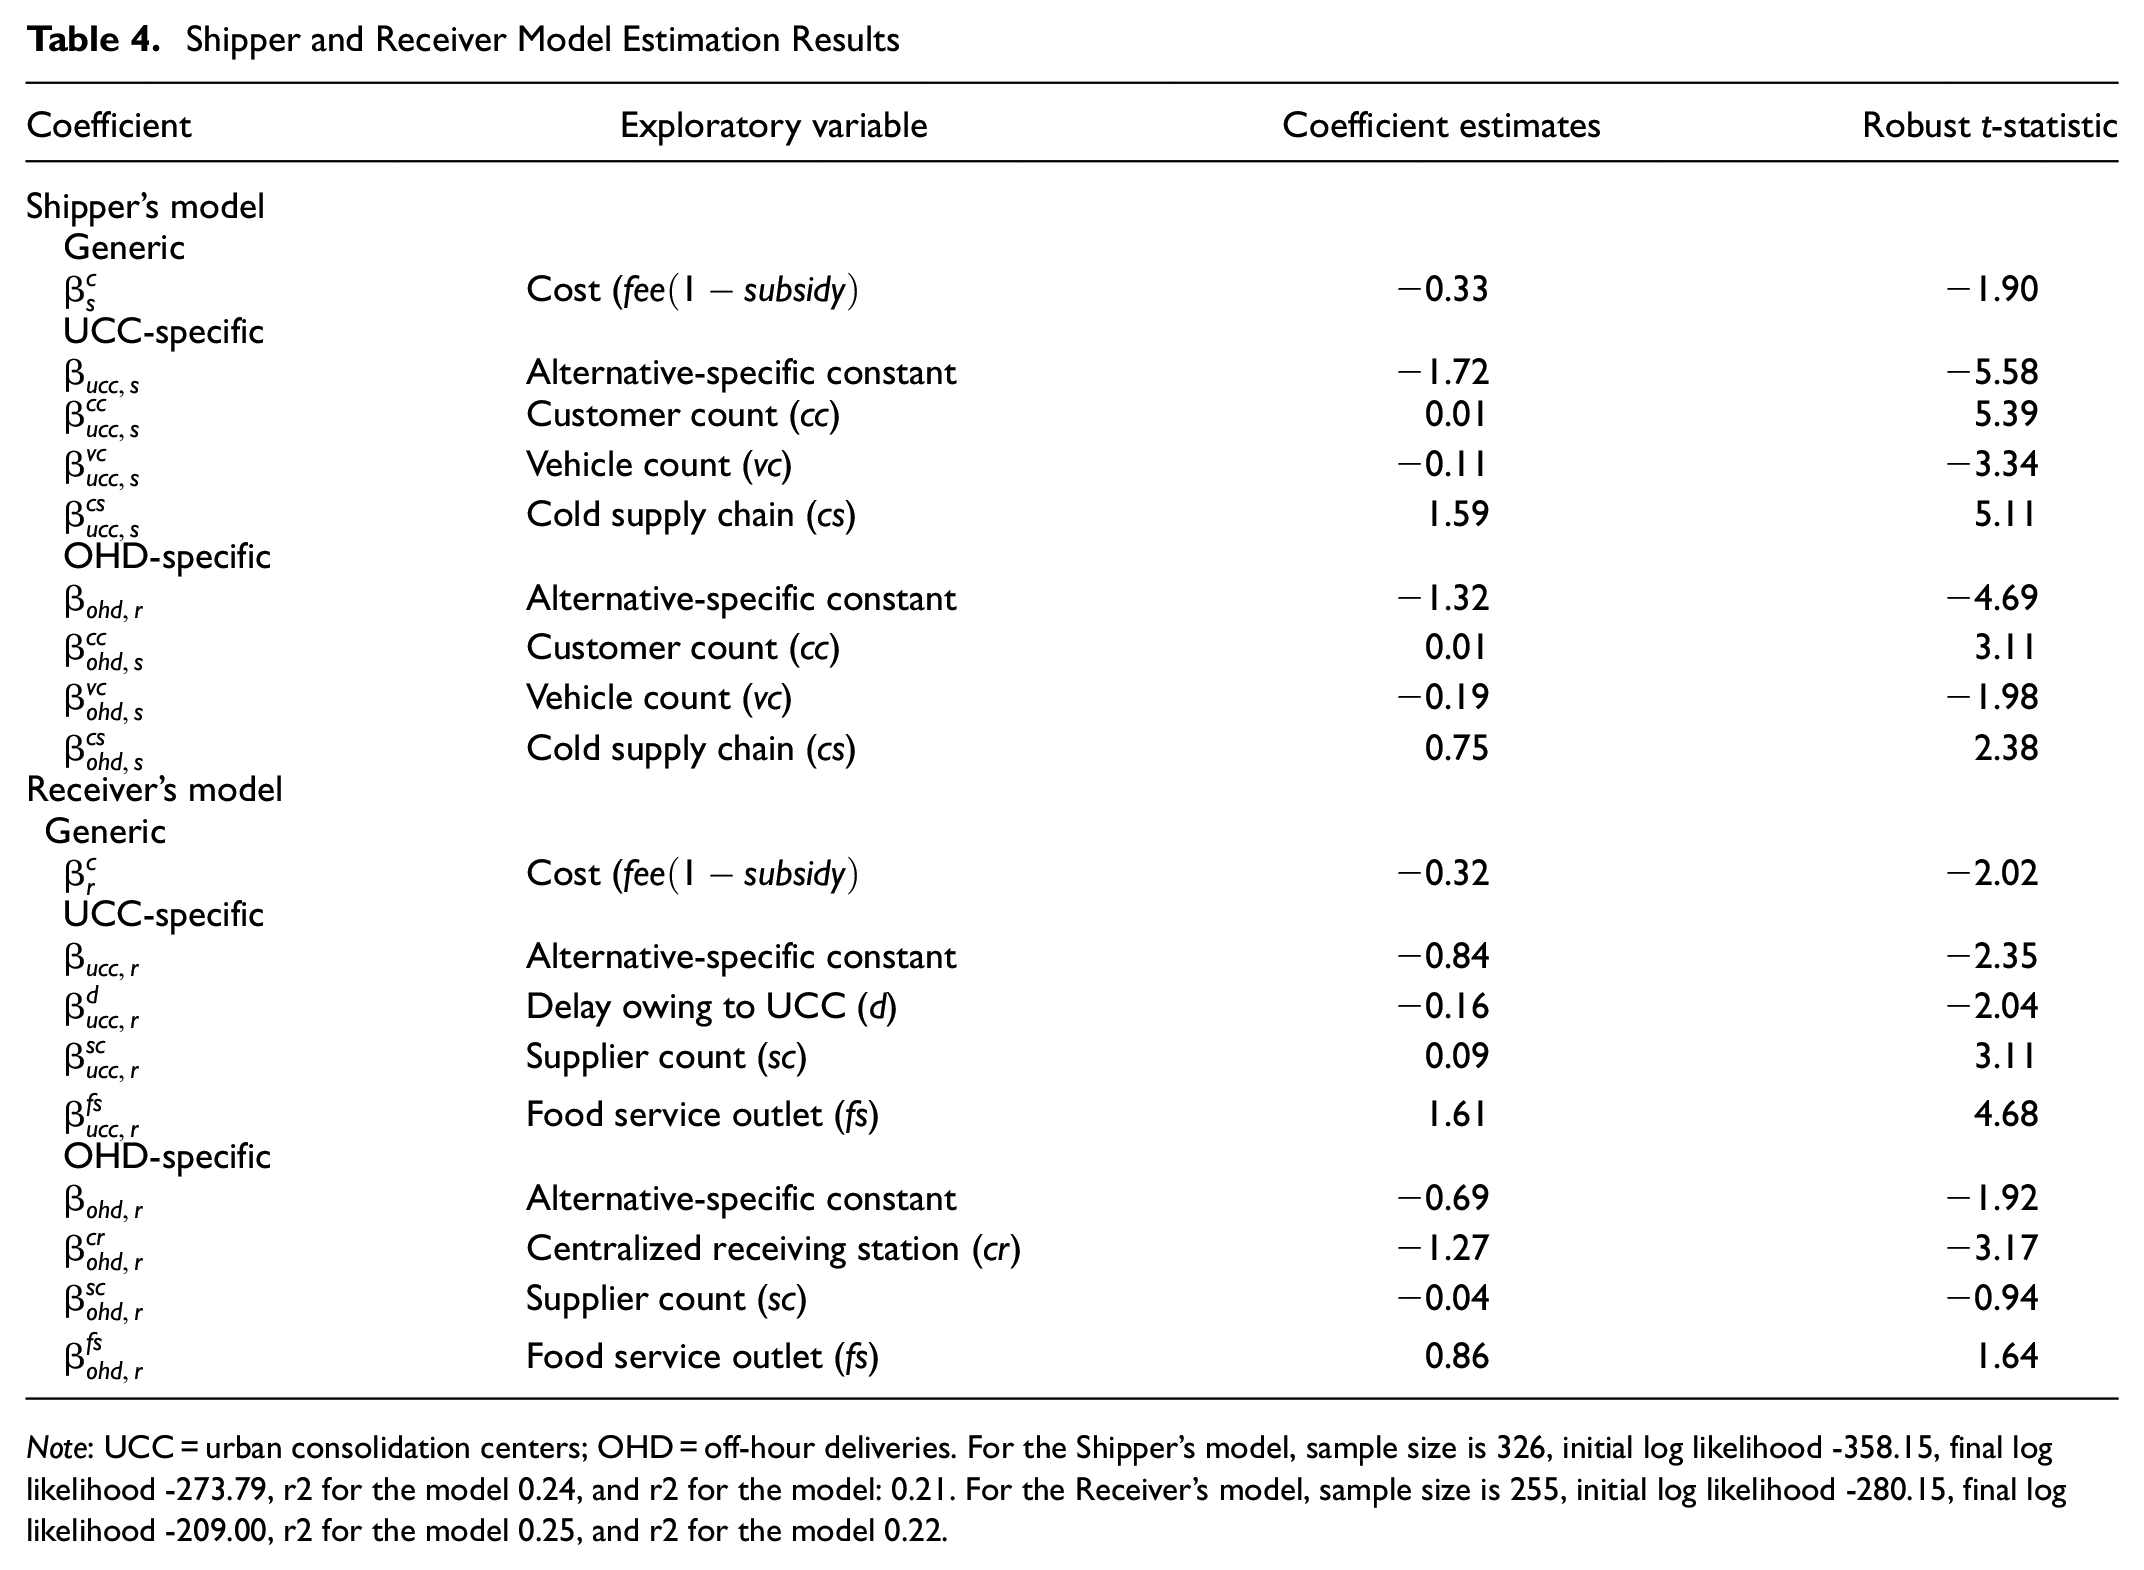
Note: UCC = urban consolidation centers; OHD = off-hour deliveries. For the Shipper’s model, sample size is 326, initial log likelihood -358.15, final log likelihood -273.79, r2 for the model 0.24, and r2 for the model: 0.21. For the Receiver’s model, sample size is 255, initial log likelihood -280.15, final log likelihood -209.00, r2 for the model 0.25, and r2 for the model 0.22.
The alternative-specific constants of UCC and OHD are statistically significant and negative, for both shippers and receivers. This implies that establishments negatively perceive both UCC and OHD relative to SQ for reasons other than those specified in the model. The coefficient on cost is also statistically significant at 90% confidence level and negative, as expected. The coefficient of delay owing to UCC was not statistically significant for shippers but was found to be negative and significant at 95% confidence level for receivers. Delays in delivery at receiver location owing to UCC are more likely to directly affect the operations of the receivers than those of the shippers. The binary variable for OHD to a centralized receiving station was insignificant for shippers, whereas it was statistically significant and negative for receivers, showing that the presence of centralized receiving stations does not influence shipper choice but it might influence receiver choice. A possible explanation is that an additional handover of the goods to a third party is not desired by receivers.
For shippers, the coefficients for customer count, vehicle count, and the cold supply chain were statistically significant (at 95% confidence level). Customer count was positive for both UCC and OHD, which intuitively can indicate more burdensome delivery operations. On the other hand, vehicle count (the number of freight vehicles owned by a shipper) was negative for both UCC and OHD. One possible explanation for this is that establishments that have more freight vehicles might be invested in the use of their fleet and have greater flexibility in operations. Shippers of refrigerated goods—represented by the cold supply chain dummy—have a positive coefficient for UCC and OHD. This implies that they are likely to choose either option over their status quo. This may look counterintuitive, but these establishments have a higher cost of storing/transporting goods and thus comparatively higher sensitivity to traffic congestion and waiting time at the delivery locations. It was evident during the survey that under the SQ scenario, these establishments face traffic congestion. The positive coefficient shows that they are open to exploring options other than SQ.
For receivers, supplier count and those associated with food service led to statistically significant results. Supplier count has a positive sign for UCC whereas it has a negative sign for OHD. One possible explanation for this result is that as UCC reduces the number of delivery instances from different suppliers, employees of the receiver (a retail store) will have more time to serve their customers. At the same time, in case of OHD without centralized receiving, if the receiver has more suppliers, the employees of the receiver may have to remain at the store for longer hours to receive deliveries from multiple suppliers. The positive coefficient for food service outlets for both UCC and OHD may reflect that like suppliers of refrigerated goods, these food outlets are not satisfied with the SQ alternative. A possible reason is that they attract a larger number of essential deliveries daily (average number of deliveries per day for food service stores is 2.3 whereas for other retail stores it is 0.6) and, as a result, they may be more sensitive to current delivery-related issues. Thus, they are more likely to consider alternatives (UCC and OHD) as possible solutions to inefficiencies in their current logistics operations. This is also consistent with the findings from the study by Paddeu ( 4 ) in which in a survey among the users of the Bristol–Bath Freight Consolidation Centre, participating food and drink stores expressed the highest level of satisfaction with UCC. Similarly, Holguín-Veras et al. ( 7 ) identified the food sector as one of the best candidates for participation in OHD. Holguín-Veras et al. ( 26 ) showed that restaurants in Manhattan, New York, are interested in OHD participation and providing financial incentives will increase uptake by restaurants.
It is relevant to discuss survey bias in the shipper and receiver samples. Of the shippers interviewed in this study, 63% served more than 10 customer locations on an average business day and 86% of these shipper companies delivered goods using own account vehicles. Also, 45% of the shipper companies shipped cold supply chain products. Overall, this shows that a good proportion of shipper companies in the sample are those that complete large number of customer deliveries per day using own account vehicles and those that carry cold supply chain goods. Similarly, 20% of the receivers interviewed were food service establishments. This is expected in the present study setting in which the survey was targeted toward companies that either shipped the goods to retail malls or received goods at retail malls. These retail malls typically have a good number of food service establishments that attracted frequent deliveries compared with other establishment types in the mall ( 44 ). Therefore, we cannot generalize the findings from this study to other settings in which the type of shipper and receiver establishments might be different.
Scenario Simulation Results
For an average day, SimMobility predicted about 7,300 shipments are delivered to the retail district, which is constant across all scenarios. This demand is estimated using the long-term freight models in SimMobility, explained in the section describing study methods. Table 5 presents the results of the participation in initiatives (when applicable) and performance indicators from the traffic simulation of initiative/participation scenarios. Starting with the mandatory participation scenarios (MUCC, MOHD), the benefits in the MOHD scenario are predominately derived from deliveries taking place “off-hours.” This is limited to a small reduction in freight vehicle trips to the malls (−4.7%) and overall VKT (−0.7%). It is interesting to note the drop in average payload, as shipment demand is spread through the day without much reduction in the vehicles used. The MUCC scenario, forcing consolidation, results in the biggest changes to the status quo of freight deliveries. Freight vehicles to malls reduce by 62.7% and overall VKT reduces by 11.4%. The impact of consolidation is demonstrated by the increase in average payload from 31% to 62%. As discussed earlier, receiver participation scenarios result in higher percentage of participation in UCC and OHD compared with shipper participation scenarios (assumed to require receiver “consent”), and overall participation increases for those with subsidy. For this reason, the benefits of voluntary receiver participation scenarios (VRSubs and VRnoSubs) are superior to those of voluntary shipper participation scenarios (VSSubs and VSnoSubs). Still, the latter with limited participation still achieves a modest reduction in freight vehicle arrivals to malls per hour, despite no change to overall trips (because of the spreading occurring from OHD); reduction in VKT is because of the feasible availability of shorter routes to the destination.
Participation and Performance Indicators in Simulated Scenarios
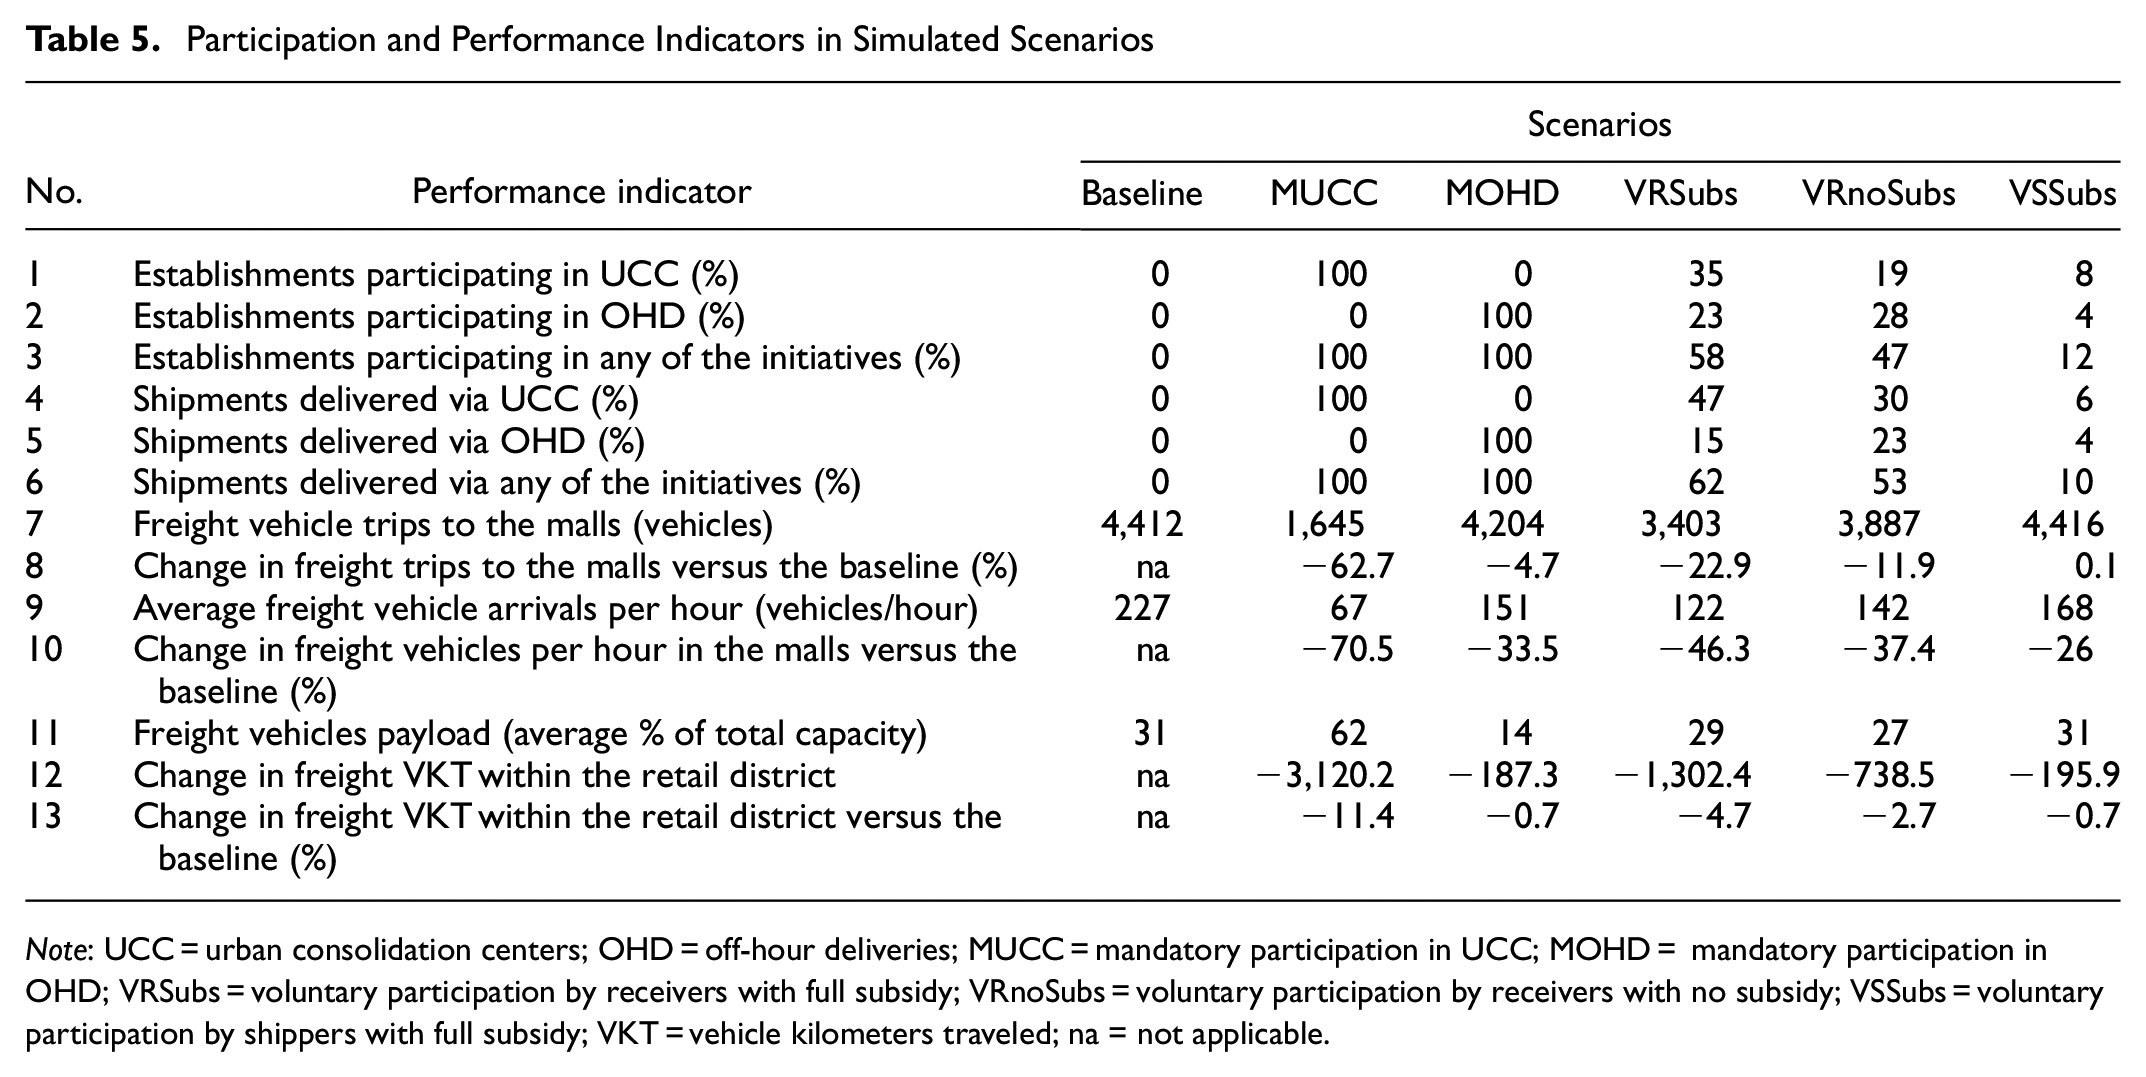
Note: UCC = urban consolidation centers; OHD = off-hour deliveries; MUCC = mandatory participation in UCC; MOHD = mandatory participation in OHD; VRSubs = voluntary participation by receivers with full subsidy; VRnoSubs = voluntary participation by receivers with no subsidy; VSSubs = voluntary participation by shippers with full subsidy; VKT = vehicle kilometers traveled; na = not applicable.
Figure 5 complements Table 5 with a graph of freight vehicle arrivals to 14 shopping malls in the retail district by time of day. Here, we can see the highest reduction in freight vehicle arrivals at malls during daytime occurring in mandatory participation scenarios (MUCC and MOHD). As expected, OHD has the biggest impact as it shifts deliveries to nighttime.
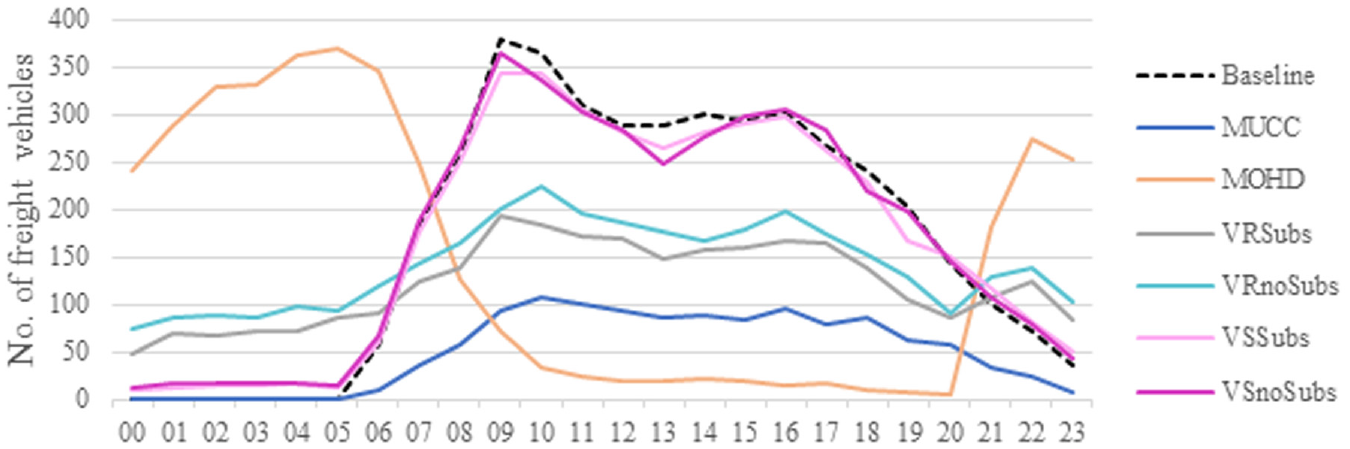
Freight vehicle arrivals to 14 shopping malls in the retail district by time of day.
We can also compare the impact of receiver participation scenarios (VRSubs and VRnoSubs) and shipper participation scenarios (VSSubs and VSnoSubs). As discussed, the limited influence of shipper participation reflects in a minimal change versus the baseline. We can observe the positive impact of the subsidy in the receiver participation scenarios (VRSubs and VRnoSubs). Plus, having both initiatives in concurrent operation allows for flattening of the vehicle arrival profile, potentially having implications toward (reduced) freight vehicle parking requirements. The latter is not possible with MOHD alone.
Conclusions
This paper evaluated the impact of UCC and OHD initiatives for a retail district in Singapore by pairing empirical behavioral models and an agent-based simulation platform. This operational behavioral study accounting for stakeholder participation in UCC and OHD is a valuable tool for policy analysis. Lack of data on the choices made by establishments makes model development difficult. We developed models for shipper and receiver participation in UCC and OHD schemes. Primary data collection using an SP survey method was used to estimate these models. The method is novel as it uses high-resolution participation models, a freight vehicle operation planning model, and traffic simulation. Two agent roles—shippers and receivers—are jointly examined and their participation decisions were modeled using SP survey data collected in Singapore. These participation models were integrated into SimMobility, a city-scale agent-based transportation simulator, to evaluate the implication of participation on various freight vehicle flow metrics. The results provide insightful findings that can help to guide the development of OHD and UCC initiatives.
Consistent with the findings of dell’Olio et al. ( 30 ), Holguín-Veras et al. ( 7 , 26 ), and Holguín-Veras ( 47 ), financial incentives in general increase the total participation in the initiatives, although the effects are more pronounced for receivers than for shippers. Financial incentives are more critical for UCC participation than for OHD participation. When subsidies are removed, participation in UCC comes down and participation in OHD increases as receivers shift from UCC to OHD. Provided receivers dominate the decision-making process, receiver-led participation scenarios perform better for increasing participation in the initiatives. Moreover, retailers receiving a higher number of shipments per day prefer UCC over OHD, making them a good target group for the UCC initiatives. The evaluation shows 4.7% reduction in VKT within the retail district under voluntary participation from retailers with subsidy. This percentage reduction in VKT is similar to that in findings of van Rooijen and Quak ( 2 ), in which the truck-kilometers in the city of Nijmegen in the Netherlands was found to reduce by 5% when 98 out of 632 retail stores join the UCC.
Activity-based simulation of freight traffic is a valuable tool that can provide valuable insights to policy analysis. We enhanced an existing agent-based simulator—SimMobility—to conduct scenario analysis for UCC and OHD. To test the efficacy of UCC and OHD, a set of scenarios was identified and simulated using the SimMobility agent-based simulator. The scenario simulation results showed that, at a reasonable level of participation, UCC and OHD are able to reduce the intensity of peak hour vehicle arrivals to malls. Results also show that receivers are a better target group for implementing these schemes. The behavioral simulations of receivers showed higher participation from establishments with higher number of shipments, which in turn helps in increasing the throughput of the UCC.
We found that there is improvement in the performance of loading/unloading activity in the retail malls in most scenarios analyzed, which is evident from the reduction in trips and the average number of freight vehicles present in the malls. The freight traffic on the road network in the retail district also showed some improvement. The results also show that lower levels of participation can only cause negligible changes in freight trips and not much improvement in the overall system performance. Another observation is that OHD, if utilized only for a small area, may reduce the payload utilization of vehicles.
Given certain levels of participation, UCC and OHD can reduce the intensity of freight vehicle flows and associated vehicle arrivals to the loading/unloading areas. Overall, lower participation levels show negligible changes compared with the baseline, highlighting that the initiatives require a certain critical level of participation to be feasible. It also highlights the need to consider a wide set of performance indicators when analyzing a freight policy initiative. The “best” performing scenario depends on what one is trying to achieve. The performance analysis becomes even more complex when a broader set of concerns are included, such as safety, noise reduction, air quality, or the financial aspects of UCC such as cost of extra handling. Similarly impact on passenger transport is outside the scope of this study, but their inclusion might show additional benefits for the OHD case.
We acknowledge some limitations of the study. As a result of the modest response to the SP survey, the models are estimated on a limited sample. Therefore, more sophisticated model specifications were not considered and can be the subject of future work. The current study assumes receiver dominance in decision making, a strict assumption that can be relaxed to the exploration of different relationship dynamics. Also, the scope of the impact analysis using the agent-based simulator can be further extended by including vehicle emission models to quantify the environmental impact of future urban logistics initiatives and interactions with passenger vehicle flows. Modeling the parking choice of freight vehicles and associated impact of congestion would be of value and is currently a focus of future research. Testing the sensitivity of the results to key assumptions can provide additional insights into the relevance of the solutions. We did not consider a scenario in which establishments can participate in both UCC and OHD. This was decided based on the feedback received from the target shipper and receiver establishments in Singapore, who mostly showed interest in only one of the two initiatives based on their operational constraints. In other context, when establishments display potential interest in participating in both initiatives, it would be interesting to investigate the impact of such a mixed scenario. We expect that participation in both initiatives would lead to complementary benefits. Although UCC applied to OHD might not be necessary, co-participation in the solutions can potentially reduce further the impacts of freight traffic. From a simulation perspective, our tool could accommodate such a scenario. Still, this would bring additional challenges to justify the setup. One such example is identifying which shipments would be more suitable for each initiative, at the establishment level.
Ultimately, the framework used in this study was able to reveal some policy insights. Both UCC and OHD have the potential to improve freight distribution to retail districts. However, these initiatives should be thoughtfully implemented and based on an ex ante assessment of the specific initiative considering all relevant performance indicators. The framework used in the study is acknowledged as data-intensive but has wider applicability in freight policy analysis, in which policy makers are interested in evaluating the feasibility of new policies by ex ante quantification of performance indicators. One of the most important factors in such quantification is modeling the behavior of freight system users in response to the new policies. The framework used in the present study combines empirical behavioral models and agent-based simulation and can be particularly useful in such a context.
Supplemental Material
sj-docx-1-trr-10.1177_03611981221092385 – Supplemental material for Evaluating the Impact of Urban Consolidation Center and Off-Hour Deliveries on Freight Flows to a Retail District Using Agent-Based Simulation
Supplemental material, sj-docx-1-trr-10.1177_03611981221092385 for Evaluating the Impact of Urban Consolidation Center and Off-Hour Deliveries on Freight Flows to a Retail District Using Agent-Based Simulation by Rakhi Manohar Mepparambath, Lynette Cheah, P. Christopher Zegras, André Romano Alho and Takanori Sakai in Transportation Research Record
Footnotes
Author Contributions
The authors confirm contribution to the paper as follows: study conception and design: R. M. Mepparambath, L. Cheah, A. R. Alho, P. C. Zegras; data collection: R. M. Mepparambath, L. Cheah; analysis and interpretation of results: R. M. Mepparambath, L. Cheah, A. R. Alho, P. C. Zegras. draft manuscript preparation: R. M. Mepparambath, L. Cheah, A. R. Alho, P. C. Zegras, L. Cheah, T. Sakai. All authors reviewed the results and approved the final version of the manuscript.
Declaration of Conflicting Interests
The author(s) declared no potential conflicts of interest with respect to the research, authorship, and/or publication of this article.
Funding
The author(s) disclosed receipt of the following financial support for the research, authorship, and/or publication of this article: This research is supported in part by the National Research Foundation, Prime Minister’s Office, Singapore (NRF), under its CREATE program, Singapore-MIT Alliance for Research and Technology (SMART) Future Urban Mobility (FM) IRG. It is also supported in part by the Singapore Ministry of National Development and the NRF under the Land and Liveability National Innovation Challenge (L2 NIC) Research Program (L2 NIC Award No. L2NICTDF1-2016-1).
Supplemental Material
Supplemental material for this article is available online.
Any opinions, findings, and conclusions or recommendations expressed in this material are those of the authors only.
References
Supplementary Material
Please find the following supplemental material available below.
For Open Access articles published under a Creative Commons License, all supplemental material carries the same license as the article it is associated with.
For non-Open Access articles published, all supplemental material carries a non-exclusive license, and permission requests for re-use of supplemental material or any part of supplemental material shall be sent directly to the copyright owner as specified in the copyright notice associated with the article.