
Abstract
Off-peak-hour delivery (OPHD) has the potential to reduce congestion in busy urban areas and at the same time improve the efficiency of logistics providers, shippers, and receivers. There has been growing interest in OPHD in the Greater Toronto and Hamilton Area (GTHA), an important freight hub in Canada. The Government of Ontario is considering permanently relaxing noise by-laws to promote OPHD throughout the province. The purpose of this study is to provide quantitative assessments of the impacts of region-wide adoption of OPHD for the GTHA. A recently developed commercial vehicle (CV) model for the GTHA is presented in the paper. Various OPHD scenarios have been tested with the CV model. The impacts of induced passenger demand have also been demonstrated. Modeling outcomes indicate that OPHD could result in 5,530 vehicle-hours saved in a day after induced demand is accounted for. Light truck carriers would benefit the most by shifting to off-peak hours and prioritizing Toronto and Peel Region customers would yield the highest travel time savings during the off-peak hours.
Off-peak-hour delivery (OPHD) involves the delivery of goods during the evening and overnight hours. This strategy has the potential to reduce congestion during daytime and improve the logistics operations of the participating carriers, receivers, and shippers. There has been growing interest in OPHD in the Greater Toronto and Hamilton Area (GTHA), which is a major generator of freight traffic in Ontario thanks to its large consumer base, location of major transportation hubs, and manufacturing activities ( 1 ). A 2019 pilot program conducted in the Region of Peel, a suburban region in the GTHA showed promising results of OPHD ( 2 ). Near the beginning of the COVID-19 pandemic the Government of Ontario limited municipal authority across the province to regulate noise related to goods delivery. This allowed 24-h deliveries, with the intention of alleviating pressure on the supply chain during the pandemic. The Government of Ontario has introduced legislation to make this policy permanent.
Off-peak delivery of goods has been tested in various pilot studies across the world. For the most part, studies have shown promising results. The key benefits of OPHD include higher travel speed during the off-peak hours (OPHs) compared with daytime, especially the peak hours; shorter service time as a result of less competition for a loading dock or a parking space; more reliable restocking as supplies are replenished in the store during the previous night; reduced emissions from trucks thanks to less congestion as well as improved safety as pedestrians and bicycles have fewer encounters with trucks during the daytime ( 3 , 4 ).
There are many challenges involved in implementing an OPHD program. For instance, receivers need staff to accept deliveries or make alternative arrangements, such as a storage place or a locker where deliveries can be made. All stakeholders—receivers, carriers, warehouses, and shippers—need extra working hours for staff which require extra pay and changes in shifts; they may also face obstacles from labor unions. All stakeholders have to make changes to operations. Carriers may need additional equipment. Local residents may complain about night-time noise ( 5 ). However, if managed and implemented well, OPHD programs have been shown to have benefits that outweigh the challenges ( 3 ).
This study is part of an ongoing project that investigates the impacts of OPHD from several aspects including congestion, emissions, safety, noise impact on residents, and business participation. The study specifically aims to quantify travel time savings resulting from OPHD by modeling various scenarios using the GTHA Commercial Vehicle (CV) model. Such analysis makes two key contributions: (a) it adds to the limited research on the use of freight demand models to assess OPHD scenarios; and (b) it informs the Government of Ontario’s decision on noise by-law policies for OPHD.
In the literature, there is no consensus on the definition of off-peak or off-hour delivery, which are often used interchangeably across studies, and the time covered varies by study area ( 3 ). For this study, the OPHs are considered to be between 7:00 p.m. and 6:00 a.m., covering the evening (EV) and overnight (ON) periods in the CV model.
The paper is organized as follows. The next section reviews the literature, looking at lessons learned from OPHD programs and modeling exercises. Then, the GTHA CV model structure is presented, followed by the OPHD scenario results from the model. Finally, some concluding remarks are made on key findings and lessons learned from scenario modeling.
Literature Review
Various pilot studies worldwide provide important lessons on potential benefits and challenges, and how to successfully implement OPHD programs. One of the successful pilot programs was conducted in Manhattan, New York, in which 25 stores from three large companies and eight carriers participated. Data obtained from onboard GPS devices suggested that significant productivity gains (travel time and service time) were achieved by the participating stores. The travel speed from the depot to the first customer increased by 71% during the OPHs compared with the peak hour average. In a 10-mi delivery tour, a driver would be able to save 1.25 h in the OPH compared with a daytime tour. The service time, which is the time spent during the delivery to a store, reduced by over 50%. Given their improved productivity, the participating stores reported having to accept larger shipments during the OPH. This in turn resulted in more profitability and greater competitiveness ( 6 ).
In the UK, six OPHD trials were run in participating retail stores in 2010. The trials were by and large successful with improvements in travel speed, fuel consumption, and store operations. Some of the participating stores reported better operational efficiency because of timely replenishment of stocks during the night. While steps were taken to minimize night-time noise, there were site-specific challenges. The pilot studies demonstrated the need for engaging with all pertinent stakeholders—public officials, logistics operations, participating companies, and so forth—in successful implementation of OPHD projects ( 7 ).
Fu and Jenelius examined the impacts of OPHD in Stockholm, Sweden that was implemented from 2014 to 2016 ( 8 ). Two trucks were used: one served three large stores and the other delivered to large number of small stores. They assessed transportation efficiency obtained from the OPHD based on four dimensions: travel time, variance of travel time, energy efficiency (i.e., fuel savings from improved travel speed), and service time per customer. The results indicate that OPHD resulted in transportation efficiency in all four dimensions. The improvements were substantial when compared with peak hour travel, while the improvement over daytime travel was marginal.
In Canada, the Ministry of Transportation Ontario (MTO) led a pilot study in 2015 during the Pan/Parapan American Games in which approximately 100 businesses, located mostly in the Greater Toronto Area (GTA), participated in an OPHD program. Results suggested that the program was a success. During the pilot, over 18,000 deliveries were shifted to the OPH which was equivalent to removing 240,000 vehicle kilometers traveled (VKT) from the peak periods. Many of the participating businesses in Toronto and Mississauga continued the OPHD program until late 2015 ( 9 ).
Very recently, a more comprehensive pilot program was conducted in Peel Region, Ontario from February to August 2019 where three major firms—LCBO, Loblaw, and Walmart Canada—shifted deliveries to 14 retail stores to OPHs. Local municipalities in Peel Region exempted the noise by-laws during the pilot program. Over 30% of daytime trips to the participating retail stores were shifted to the OPHs. Analysis of onboard GPS data showed that travel speeds improved by 18% during the OPHs compared with the daytime speed. Emissions of greenhouse gases—CO, NOx, PM10, and PM2.5—also reduced markedly, ranging from 10% to 15% during the pilot. The participating firms supported an expansion of the OPHD program in the region ( 2 ).
While pilot studies provide unique and specific lessons learned from the participating businesses, they do not provide the impacts of an OPHD program on the overall transportation network. Only a handful of studies looked at OPHD from a system’s perspective through modeling. A good example is the study by Holguín-Veras et al. ( 4 ) who quantified economic benefits of off-peak deliveries in Manhattan, New York. Participating receivers/businesses would get financial incentives to cover for staffing and other costs. Participation rates were determined from a separate behavioral study ( 6 ). Benefits to road users and carriers (travel time improvements and emissions reductions) were modeled in a regional demand model along with a mesoscopic traffic model. Composite measures of value of time (VOT) from travel time savings and valuations of criteria pollutants were used to compare the costs and benefits of various participation rates. Annual financial incentives ranged from $5,000 to $50,000, with corresponding percentages of truck traffic shifted to the off-peak period ranging from 6.49% to 41.65%. The results suggest that the optimal range of incentive was $10,000 to $15,000 a year resulting in a 14% to 21% shift of total truck traffic.
Yannis et al. ( 10 ) use a traffic assignment model called SATURN to model truck delivery restrictions during peak hours in Athens, Greece. First, they develop a base case traffic assignment that outputs reasonable link-level volumes and then model scenarios with trucks restricted on the network during morning and afternoon peak periods. Results indicate that the average speed goes up during morning (7:00 to 10:30 a.m.) and afternoon (2:00 to 4:30 p.m.) peak periods by 4.7% and 1% respectively, while the midday (10:30 a.m. to 2:00 p.m.) traffic experiences a average speed lower by 5.8% as a result of additional truck traffic.
This study adds to a very limited number of modeling exercises ( 4 , 10 ) on OPHD impacts on transportation networks. While there have been a few pilot studies in Canada, this is the first research that models the network-wide impacts of a potential OPHD program in a Canadian metropolitan area.
Data
Commercial Travel Surveys
Three commercial travel surveys were conducted between 2007 and 2012 across the GTHA: one in Peel Region, another in Durham Region, and a third across the GTHA ( 11 ). These surveys are consistent in their collection method and data content (similar data fields, categories, etc.), and can therefore be pooled. The surveys in GTHA and Peel Region were developed and conducted by University of Toronto, while Durham Region implemented a similar survey for its jurisdiction. The data set has three components: information specific to the business establishment, shipment-level information, and tour-level information. Information relevant for this study includes the number of employees and the number of trips by various truck types incoming and outgoing from the business establishment in the last 24-h period. Business establishments include shippers and receivers of goods or services.
Road Counts
Road count data come from the Cordon Count Program that the City of Toronto and the Regions of Durham, York, Peel, and Halton participate in ( 12 ). The data set consists of traffic counts by various modes including passenger cars and buses as well as light, medium, and heavy trucks. For the CV model, road counts along various screen lines are used for model calibration. Road counts are updated every 2 to 3 years.
EMME Network System
The CV model presented in this paper is implemented in EMME, using the roadway network developed for the GTAModel ( 13 ). The GTAModel is a model of passenger travel demand for the GTHA, developed by the Travel Modeling Group at the University of Toronto, and used in operational practice by the City of Toronto. Passenger travel demand is modeled based on the Travel Activity Scheduler for Household Agents (TASHA). TASHA outputs tours and trips by simulating out-of-home activity and travel episodes for members of households across the GTHA for a typical 24-h weekday ( 14 , 15 ). The GTAModel network consists of freeways, arterials, collectors, and local roads. The network is connected to the Transportation Tomorrow Survey (TTS) zone system.
GTHA Commercial Vehicle Model
The CV model has three components: trip generation, trip distribution, and traffic assignment. Figure 1 illustrates modeling steps, including OPHD scenario modeling. The CV model makes two improvements in trip generation to the work done by Roorda et al. ( 16 ). First, separate regression models have been developed for industry classes, rather than simple trip rates per employment. Second, special generators (e.g., intermodal terminals and airports) have been treated separately (details are in the next section).
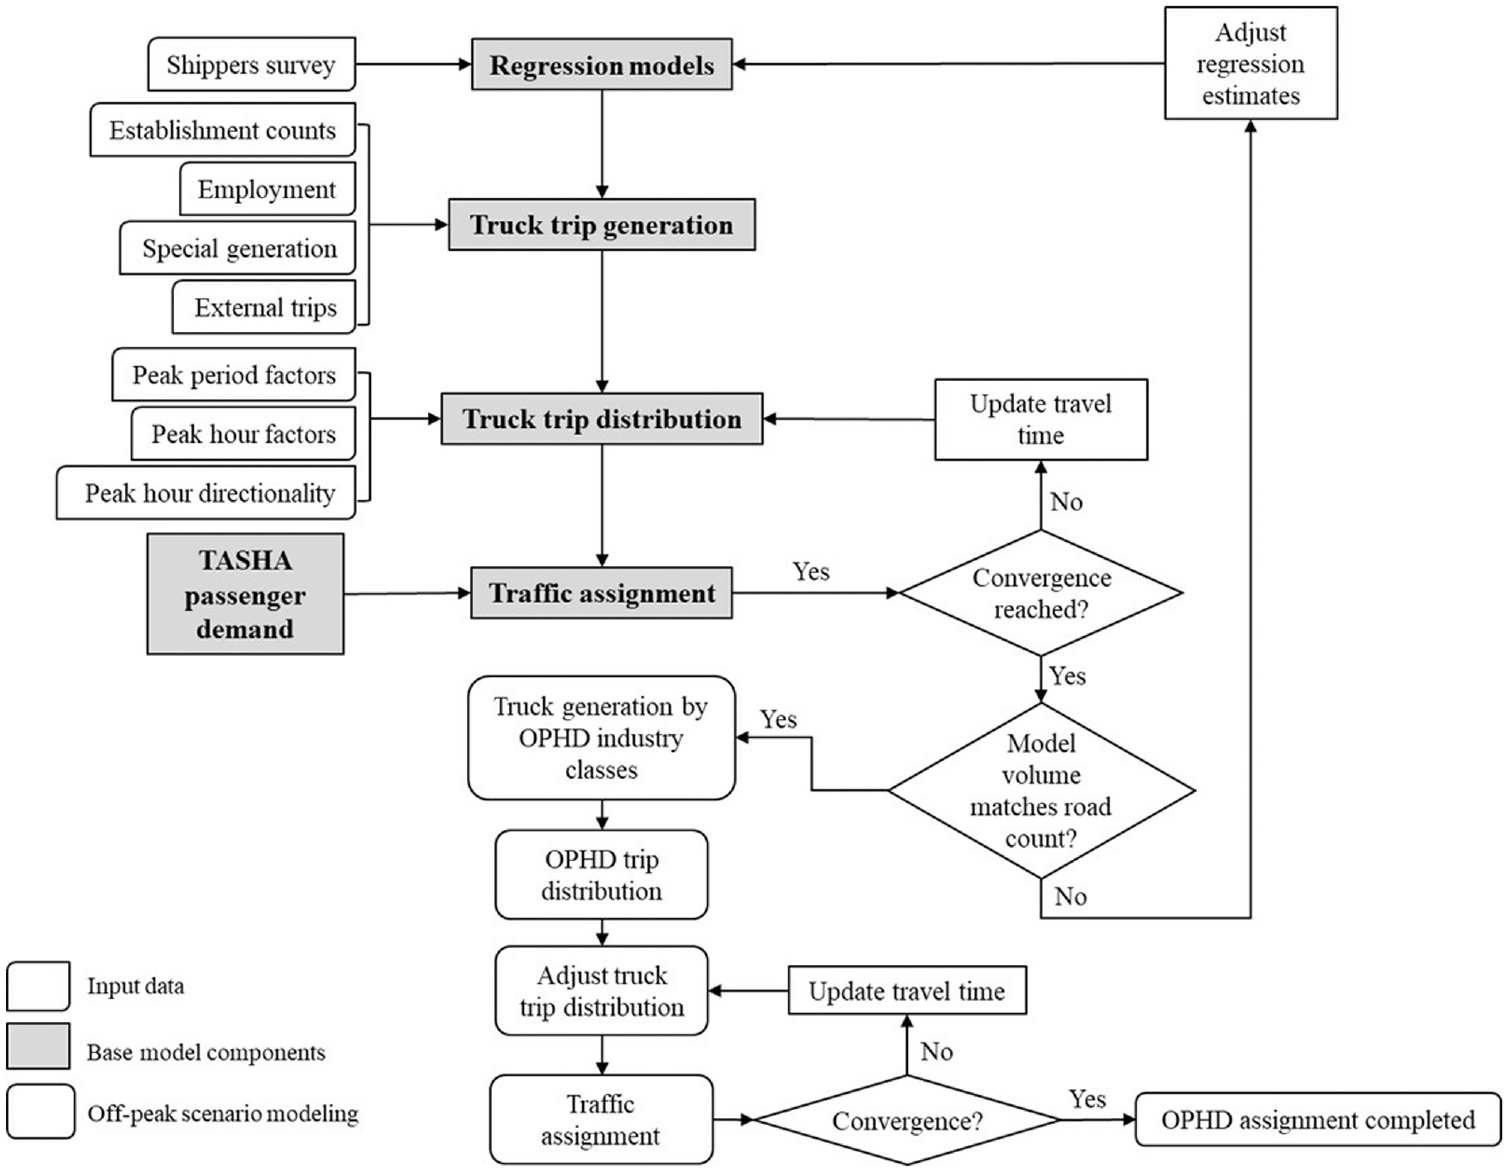
Modeling steps.
The CV model has been integrated with GTAModel V4, and is based on trip generation and road counts from 2016. The model outputs truck volumes by type (light, medium, and heavy trucks) for the following time periods on road links across the GTHA. The model is calibrated for a 13-h period (6:00 a.m. to 7:00 p.m.), covering morning (AM), midday (MD) and afternoon (PM) periods, because road counts are not available after 8:00 p.m.
Morning (AM): 6:00 to 9:00 a.m.
Midday (MD): 9:00 a.m. to 3:00 p.m.
Afternoon (PM): 3:00 to 7:00 p.m.
Evening (EV): 7:00 p.m. to midnight
Overnight (ON): midnight to 6:00 a.m.
Trip Generation
The trip generation component is based on a linear regression for each of 15 different industry classes (2-digit NAICS with some industry classes grouped into “Various Services”). The estimation was done on pooled data of the three commercial travel surveys, assuming that variation in trip generation over the time period is small. The regression models have one explanatory variable—employment—and the dependent variable is total number of incoming and outgoing trips in a weekday (24 h). Three types of model specification are tested: (a) intercept-only; (b) slope-only; and (c) with intercept and slope. For each industry class, the model with the lowest root mean square error (RMSE) is selected as the best model if the slope is not statistically significant in model type C. This method of freight trip generation is similar to the work done by Holguín-Veras et al. ( 17 ) in New York. As shown by Table 1, most industry classes are either suitable (i.e., with the lowest RMSE) for intercept-only (22 out of 45 for all truck types) or intercept with slope (20 out of 45) regression specifications which is consistent with the results reported by Holguín-Veras et al. This confirms that the standard rate-base approach either over- or underestimates trip generation at the zone level depending on which industry classes are present in a specific zone.
Estimated Parameters of Preferred Models
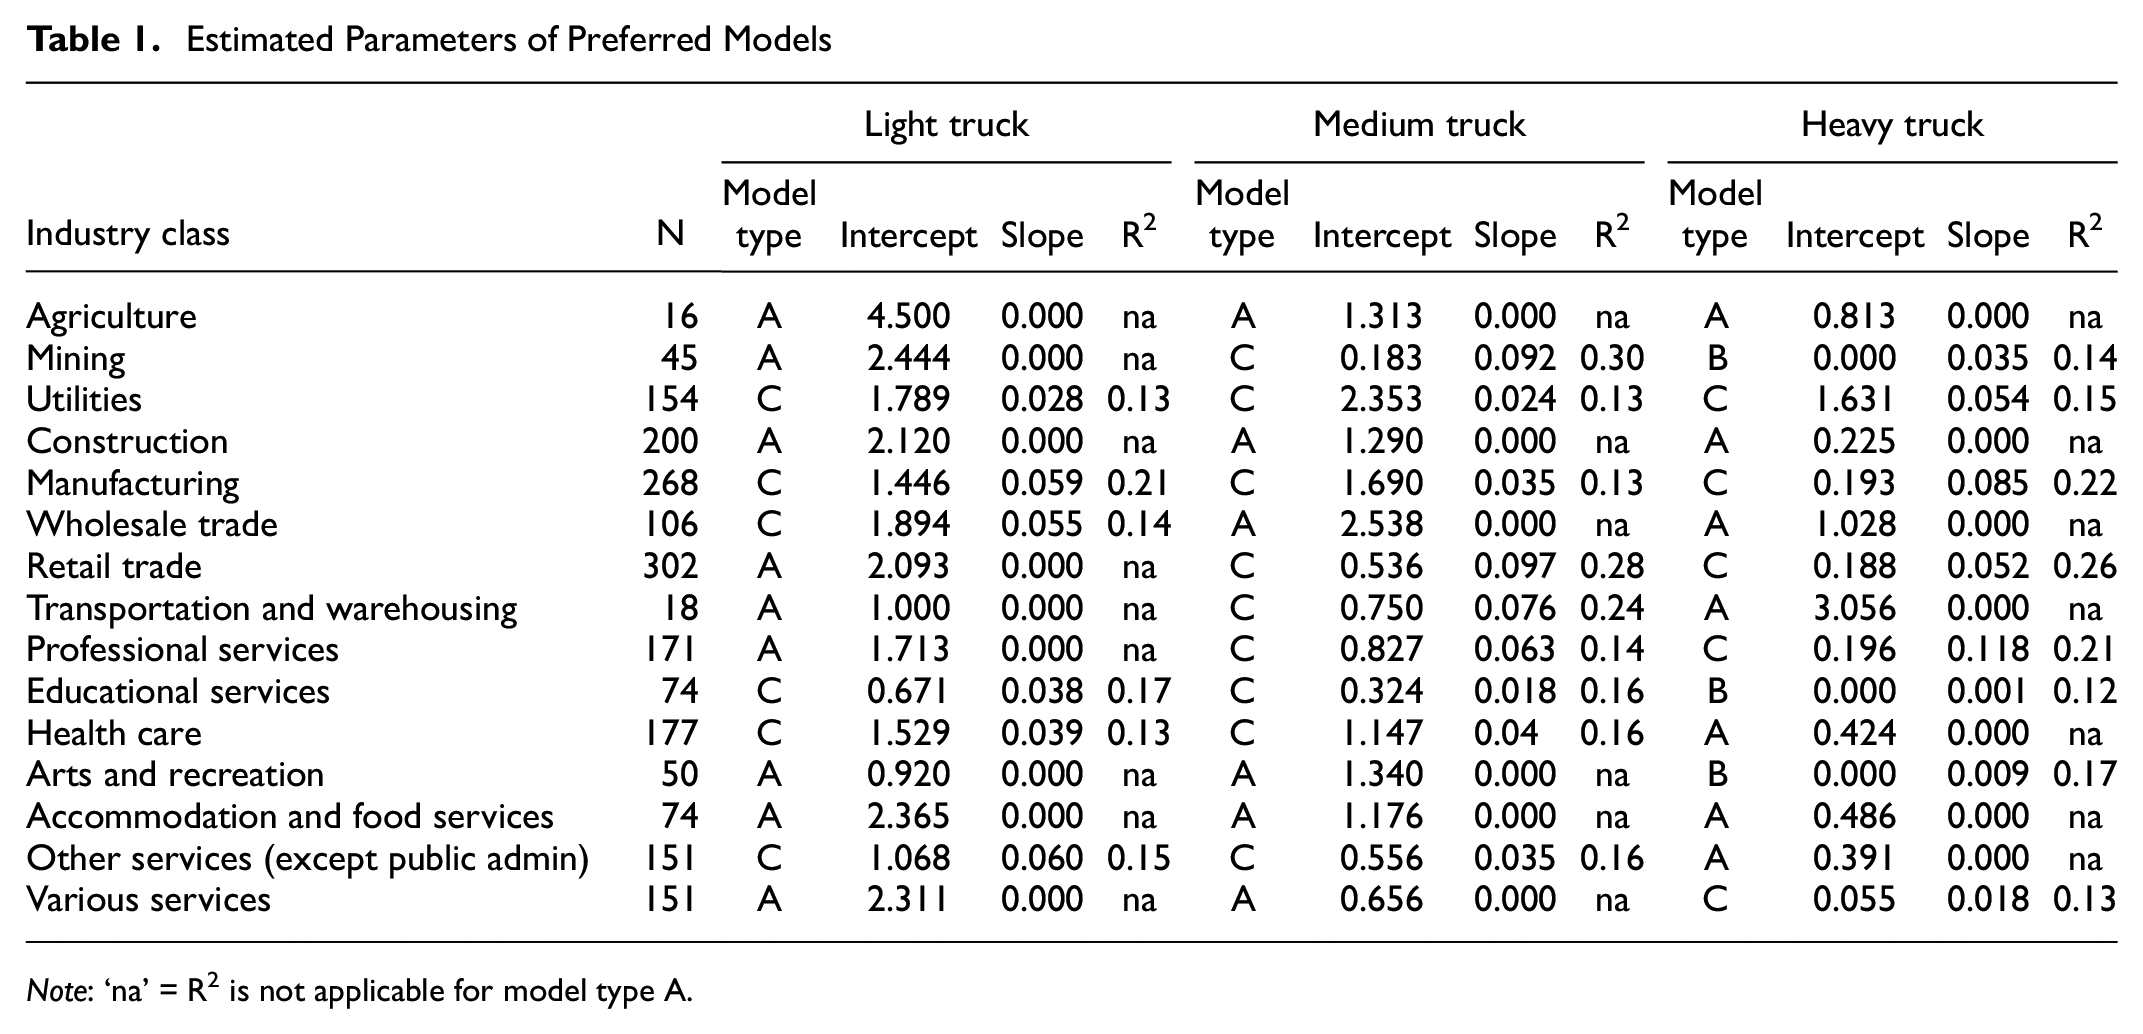
Note: ‘na’ = R2 is not applicable for model type A.
Household trip rates from the Quick Response Freight Manual ( 18 ) that were calibrated by Roorda et al. ( 16 ) are used for household trip generation.
The zonal 24-h trip generation total is calculated using the count of establishments and the total employment by industry class that come from InfoCanada 2017 and Statistics Canada 2016, respectively. InfoCanada reports latitude and longitude of individual business establishments. Zonal counts are obtained by aggregating the number of records by zone in GIS. Employment data from Statistics Canada come in a different zone system (Greater Golden Horseshoe [GGH] Model zone system) which is translated into the TTS zone system in GIS. For one-to-one matching zones, the employment is simply copied; for many-to-one (multiple other zones corresponding to one model zone), the sum of employment is taken, and for one-to-many or many-to-many, employment is assumed to be proportional to the zone area. After estimating total zonal 24-h trip generation, the number of trips over 24 h originating in or destined for that zone is obtained by dividing the total generation by 2. This assumes that, for shippers, CVs that leave to make deliveries return within 24 h, and that for receivers, CVs that arrive with a delivery leave within 24 h.
For external trips, that is, trips entering, leaving, or going through the GTHA, origins and destinations by seven gateway zones are assumed to be equal to the 2016 road counts of screen lines located close to the gateway zones.
Trip generation by special generators, such as railway intermodal terminals do not depend on employment, rather several other factors are involved. For instance, total container cargo generation or TEUs for intermodal yards would be more relevant than total employment. For the three major special generators in the GTHA—Canadian National (CN) and Canadian Pacific (CP) intermodal terminals and Pearson International Airport—the reported truck generation is used because of the absence of a specialized trip generation model for these special generators. As shown in Table 2, the reported trip generation is quite different than regression models used in this study, which stresses the need for separate models for special generators.
Modeled versus Reported Truck Generation (13-h) by Special Generators
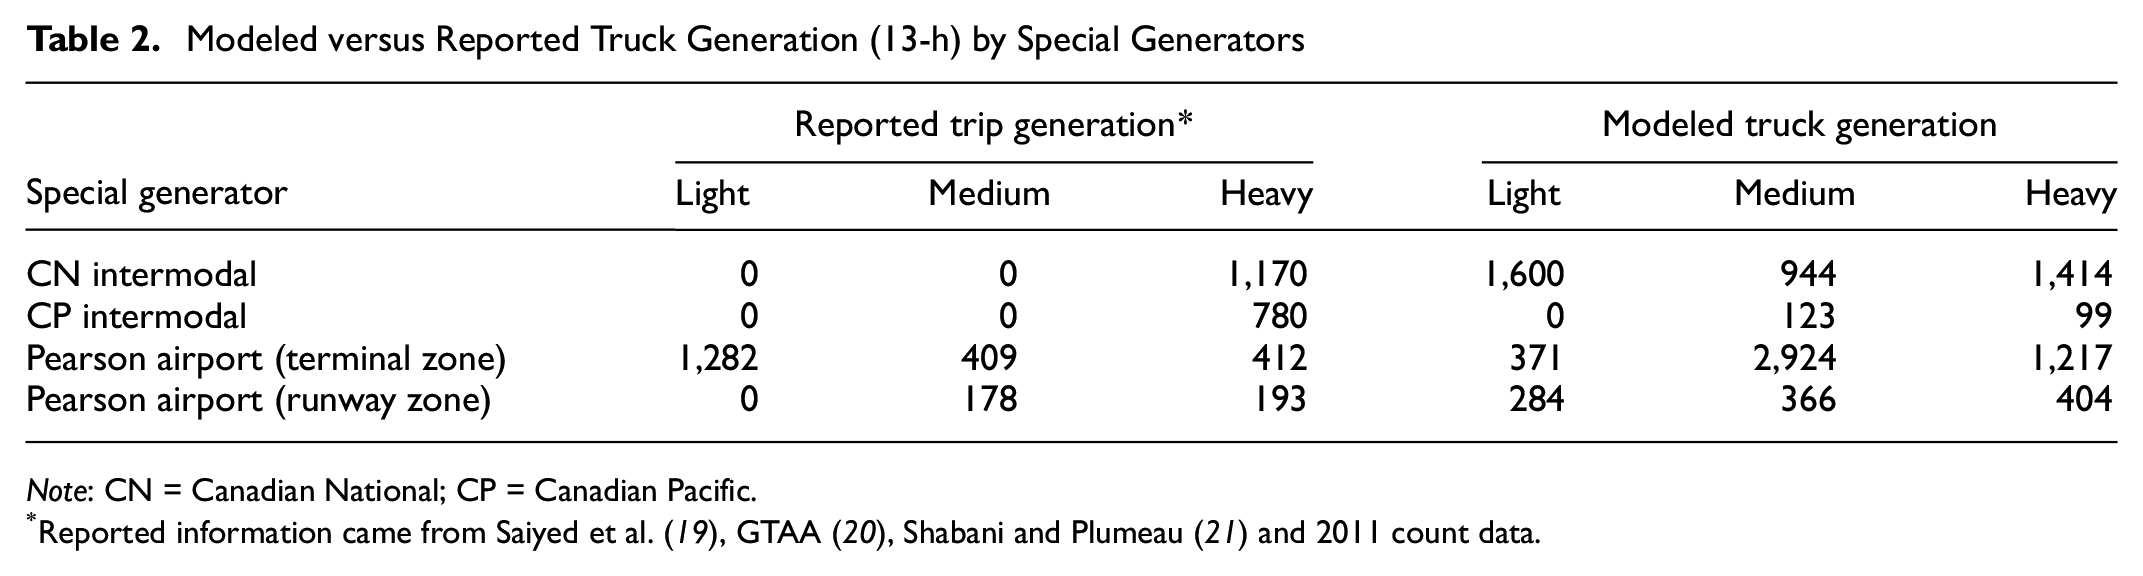
Note: CN = Canadian National; CP = Canadian Pacific.
Trip Distribution
A standard doubly constrained gravity model is used for trip distribution which takes the following form:

where
Before any calibration, the model is run with initial
Traffic Assignment
Traffic is assigned in the GTAModel framework using a multiclass user equilibrium assignment where four classes of vehicle are specified: passenger cars (auto) and light, medium, and heavy trucks with PCUs 1.0, 1.0, 1.75, and 2.5, respectively. The traffic assignment is considered to have converged if a relative gap of 0.0001 or a maximum of 300 iterations is reached. As mentioned earlier, the passenger demand comes from the agent-based passenger model TASHA. The gravity model is then updated with the new travel time matrices, followed by a rerun of the traffic assignment. This process is repeated until a specified convergence is reached.
Model Calibration
Three types of calibration factor are used in the CV model: factors related to trip generation, gravity model friction factors (
Calibration Factors
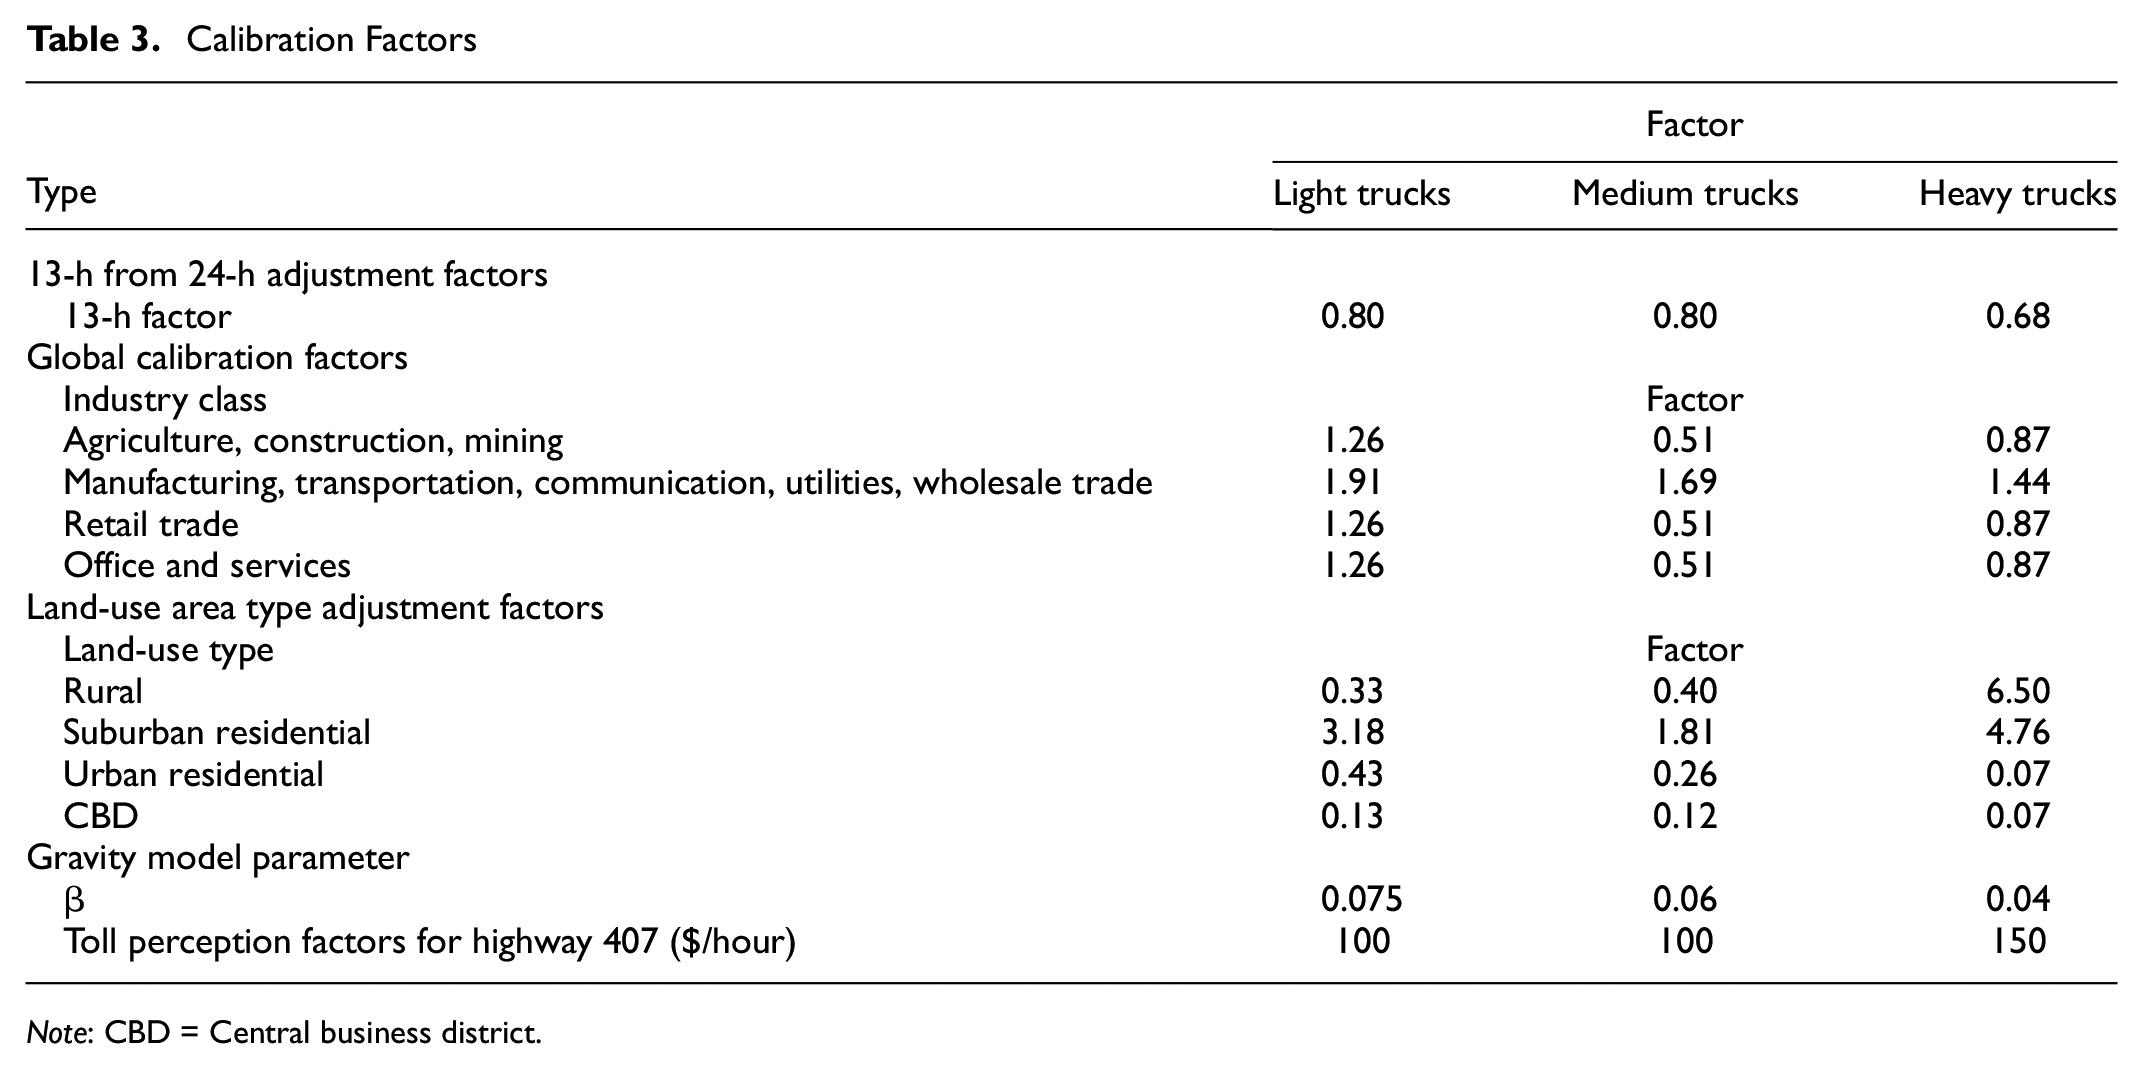
Note: CBD = Central business district.
The
After calibration, the model volumes are reasonably close to the observed volumes from screen line counts. Overall percent differences between model volume and count volume across various screen lines across GTHA are within 0.2% for light, medium, and heavy trucks (Table 4). The volumes presented here are for 13-h period (6:00 a.m. to 7:00 p.m.) since the road counts are not available after 8:00 p.m.
Calibration Results Across Screen Lines (Total of AM, MD, PM Periods)
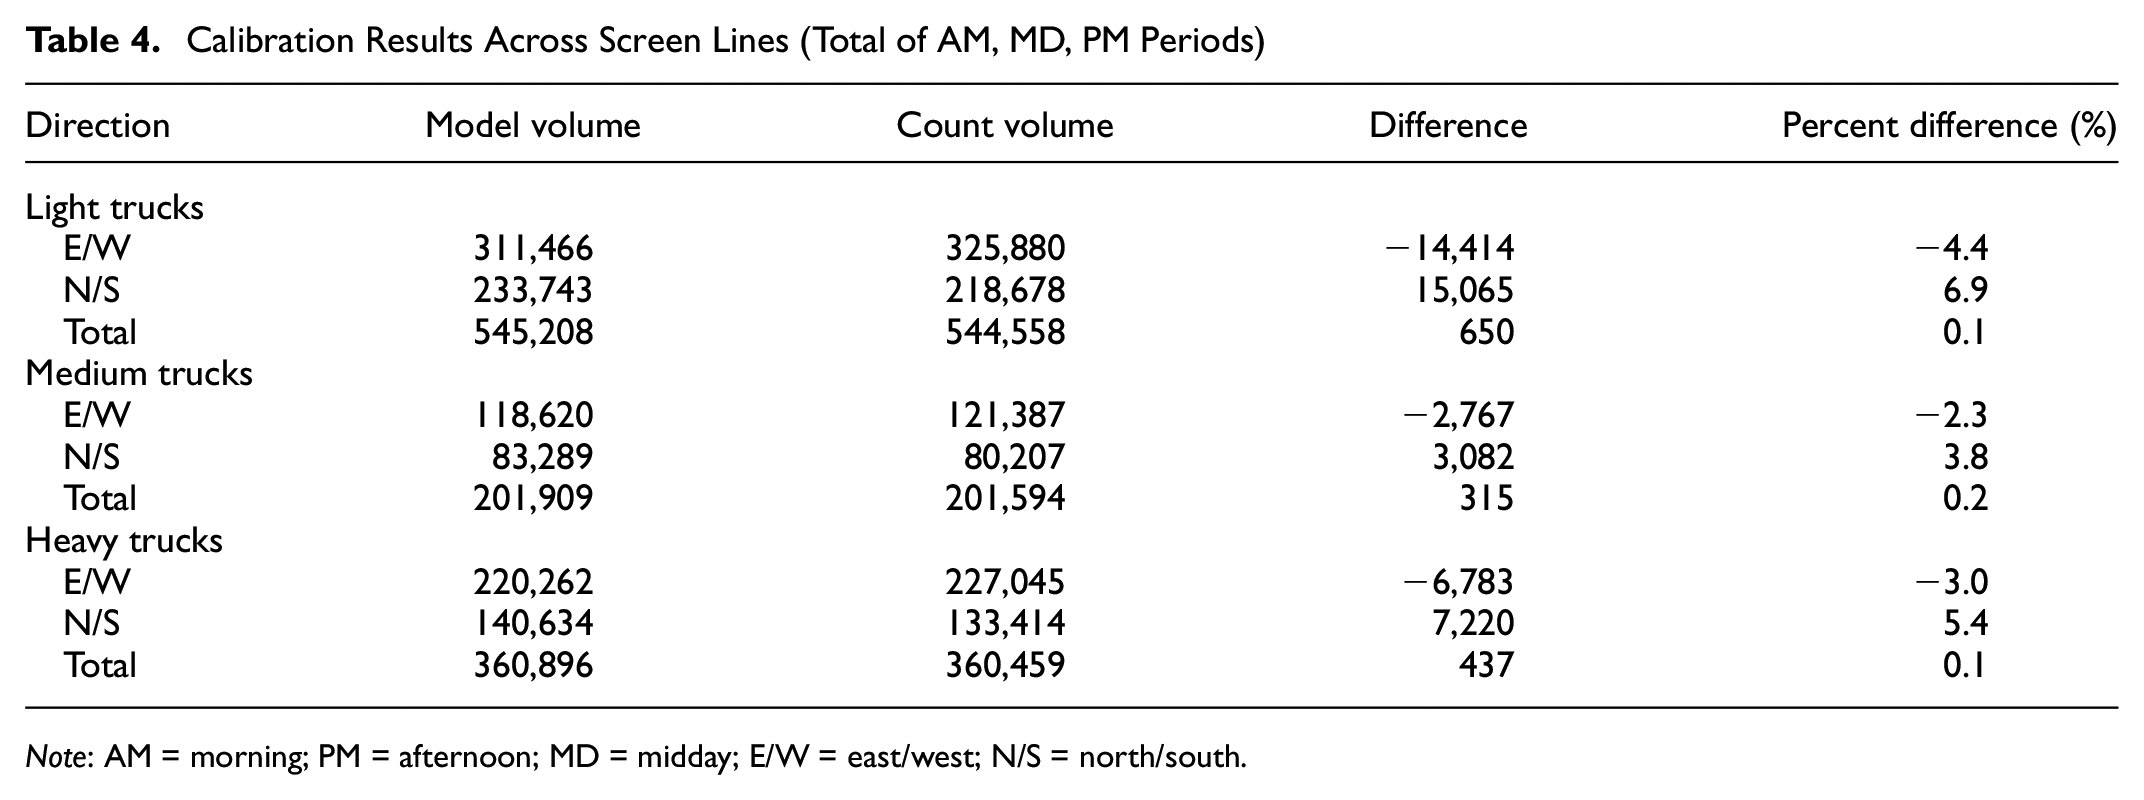
Note: AM = morning; PM = afternoon; MD = midday; E/W = east/west; N/S = north/south.
Modeling OPHD Scenarios
Not all businesses are suitable to receive OPHD. Holguín-Veras et al. suggest that retail stores, wholesale trade, accommodation and food services, and various other services are most willing to accept off-peak deliveries ( 22 ). Based on the discussions with public officials, the private sector, and other stakeholders in the GTHA, and recent experience from the Peel Region pilot project ( 2 ), three industry classes have been considered for OPHD scenario analysis: retail trade (RT), wholesale trade (WT), and accommodation and food sector (AF). For the WT, only grocery-related businesses (NAICS 4244) are considered to participate in OPHD.
The OPHD scenarios reflect various participation rates by the selected industry classes, 10%, 20%, 30%, and 50% of trips to be shifted to OPHs. Many accommodation and food services (e.g., restaurants) are likely to receive perishable goods late at night or early in the morning ( 22 ). Some of the retail and wholesale deliveries (e.g., produce) can be expected to follow the same delivery pattern. In the scenarios, AF-generated trips are assumed to be delivered during overnight (ON) period. Two cases are considered for RT and WT trips: a) 100% are delivered during evening (EV), and b) 50% delivered in the EV and 50% in the ON period. For each of these cases, induced passenger demand as a result of reduced daytime truck volume is modeled. Four truck shift rates, two cases of delivery periods, and the inclusion of induced demand resulted in 16 different scenarios. The following steps were taken to model the OPHD scenarios.
First, we calculate separate trip generation vectors for participating industry classes:

where
Next, we estimate trip distribution demand matrices for each of the participating industry classes for the 13-h period,

where
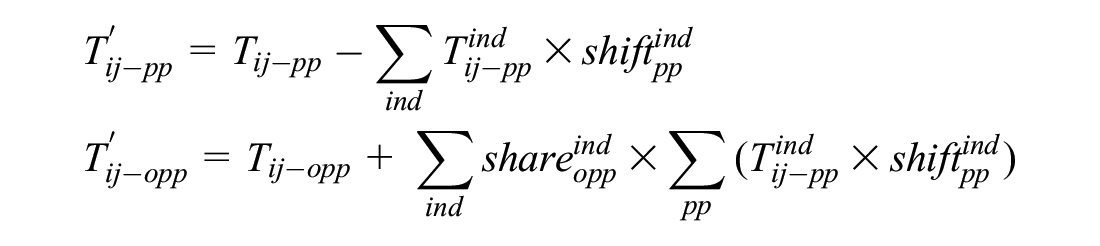
where
Scenario Results
The participating industries (RT, WT, and AF) generate approximately 15%, 9%, and 14% of light, medium, and heavy truck trips, respectively. These are the shares of truck trips that would be shifted to the off-peak period if a 100% shift-rate is assumed. Based on the Peel Region pilot study, a 30% shift can be reasonable, which represents a shift of just over 4% of trucks or 0.45% of all vehicles (including passenger cars).
Impacts on Daytime Traffic
Some interesting insights can be gleaned from the model’s response to the OPHD scenarios. Since the total volume changes across scenarios, only the average metrics are compared. The changes observed for the three metrics: VKT, travel time, and travel speed of the daytime traffic complement each other. For brevity, only non-induced scenarios are shown here. The impact of induced demand is discussed in a following subsection.
The average VKT changes differently for different types of vehicle. Passenger cars (auto) and heavy trucks experience marginal change in the average VKT, while light and medium trucks experience an increase in average VKT (Figure 2). This trend, along with the change in average travel time and speed suggest that as more trucks move to the OPHs, light and medium trucks take faster but longer routes which usually involve freeways. Heavy trucks already take longer routes through freeways in the base case, so their overall routing does not change much with trucks moving to the OPHs.
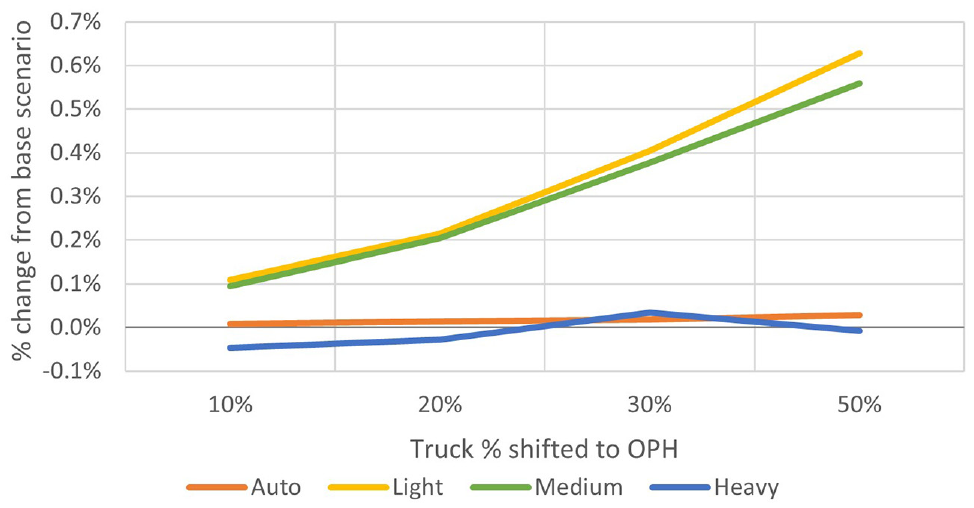
Change in average VKT during daytime (6:00 a.m. to 7:00 p.m.).
The average travel times of light and medium trucks drop marginally compared with passenger cars and heavy trucks (Figure 3). However, the average speed of all trucks improves by similar rates. This correlates with the change in average VKT, that light and medium trucks take longer routes, and presumably take freeways as more trucks shift to the OPHs.
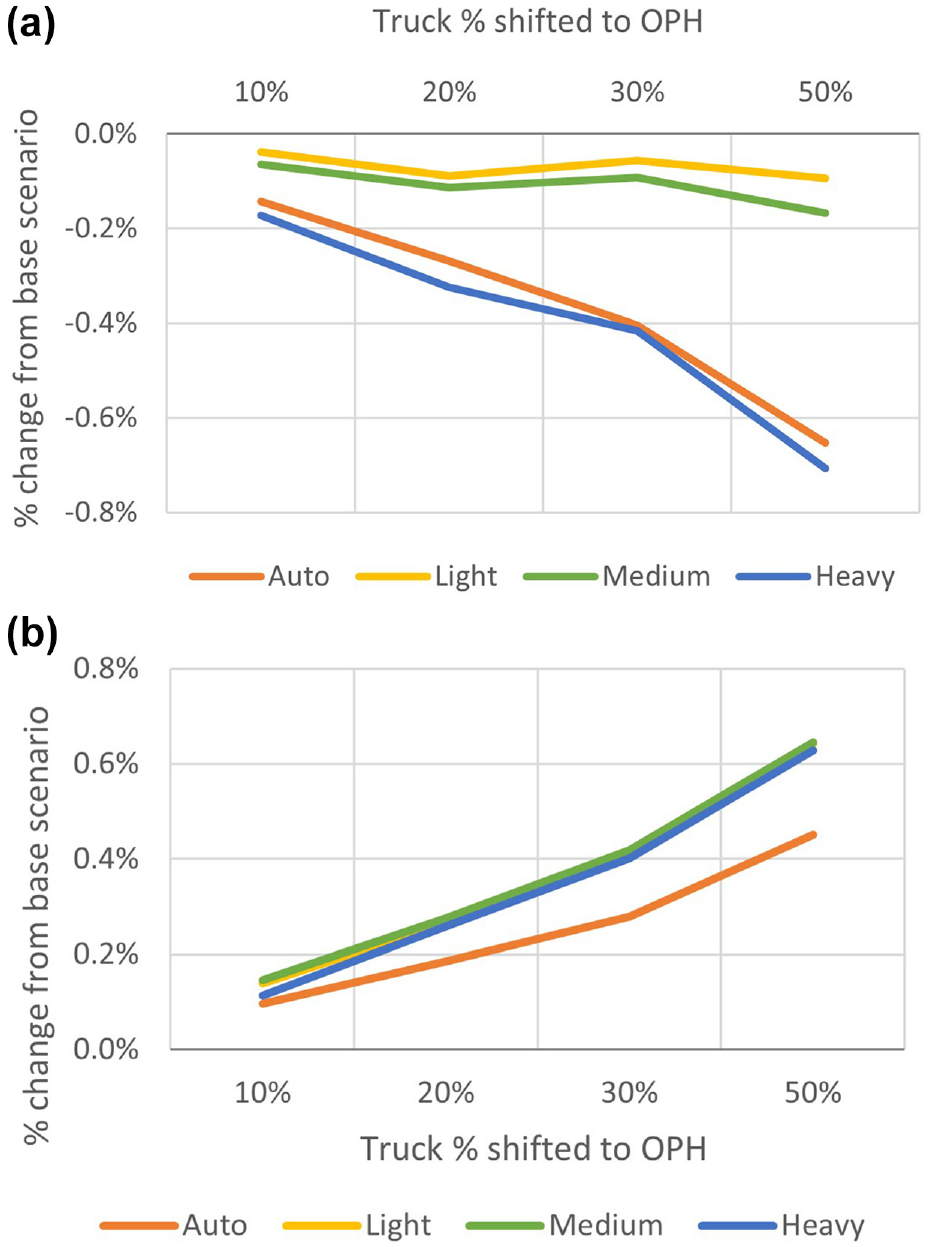
Change in average daytime (6:00 a.m. to 7:00 p.m.): (a) travel time; and (b) travel speed.
Impacts on Off-Peak Traffic
In the GTAModel, the evening and overnight periods represent the off-peak periods. Overnight traffic is practically at the free flow state and the impacts of added off-peak trucks are negligible. the traffic conditions are, therefore, not reported here. The evening traffic experiences higher average travel times with the addition of off-peak trucks which is expected. Heavy trucks have the highest increase, followed by light, medium trucks (lines representing light and medium trucks overlap in Figure 4), and passenger cars. This is because the additional off-peak trucks introduce some congestion in the network causing more delays to longer trips which is the case for heavy trucks.
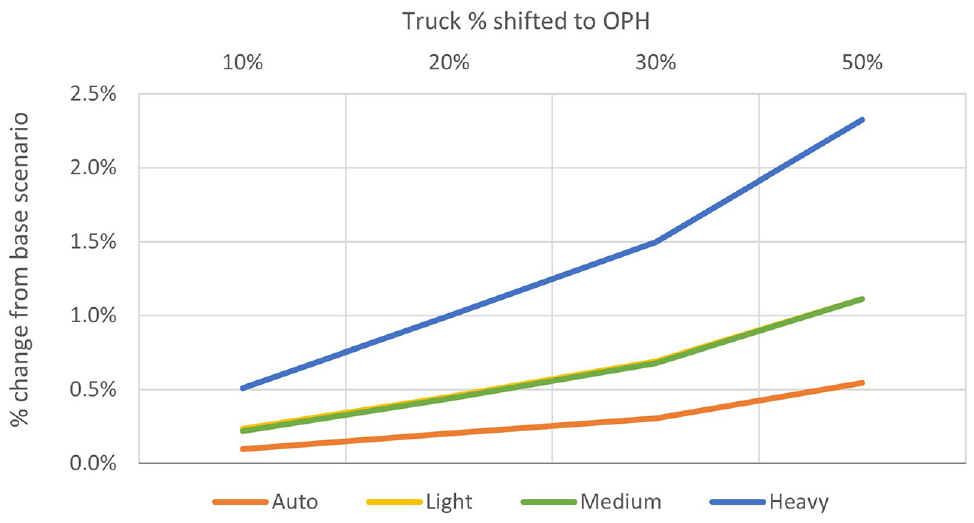
Change in average travel time during evening (7:00 to 11:00 p.m.).
Benefits of Off-Peak Delivery Trucks
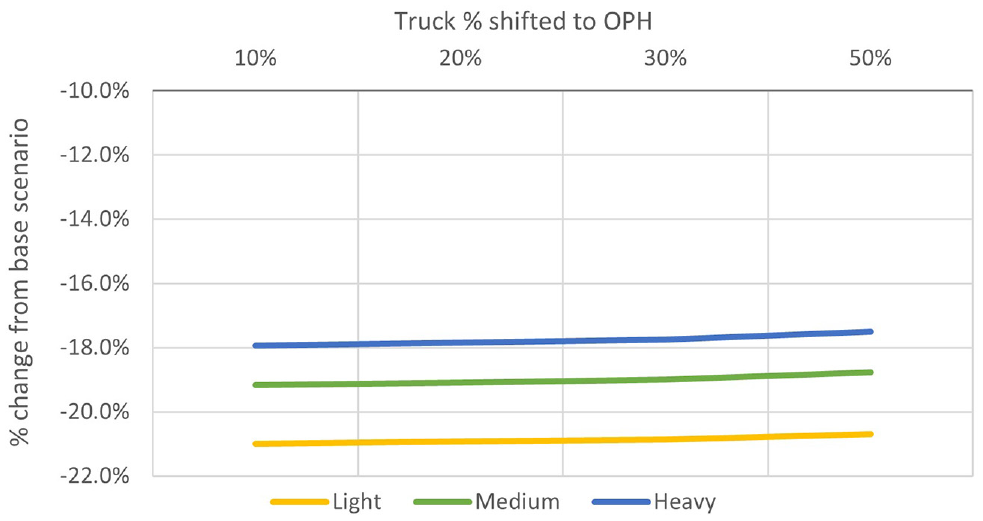
Trucks that participate in the OPHD experience a more drastic improvement in the average travel time, compared with the remaining traffic on the road. This is expected because there is less congestion in the evening and overnight periods compared with the daytime. As more trucks are shifted to the OPHs, travel times increase slightly with greater truck volumes, especially in the evening, but the increase is small (less than 1%).
Among the shifted trucks, light trucks benefit the most, followed by medium and heavy trucks. Recall, of the daytime traffic, light and medium trucks have the least travel time savings, while they have the highest travel time savings if they shift to the OPHs. Thus, based only on travel time savings, light and medium truck carriers would have a higher incentive than heavy trucks to switch to off-peak deliveries.
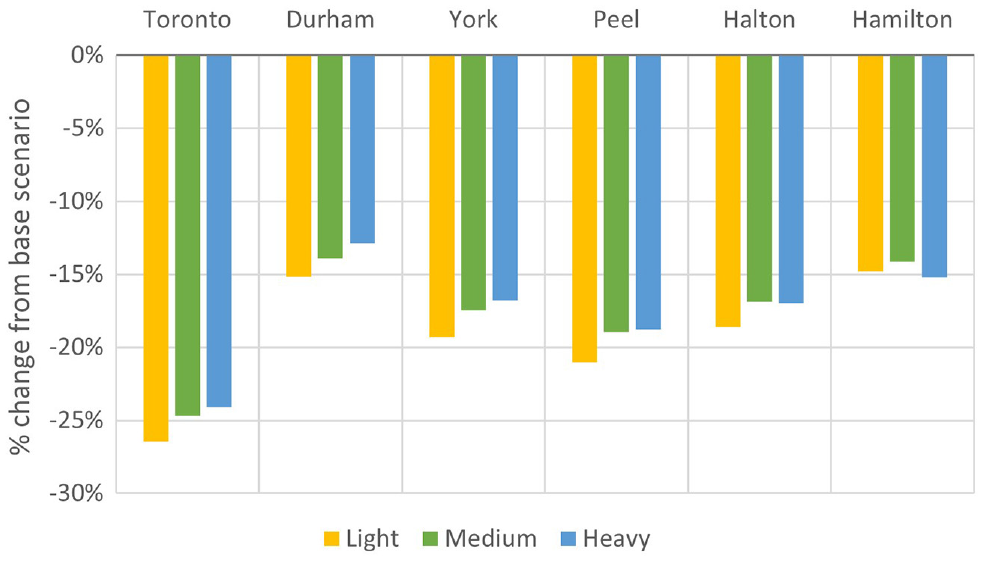
The travel time savings by the OPHD trucks can be further broken down by trip destination regions in the GTHA (Figure 5). Only the scenario with 30% shift is demonstrated here but the same trend is true for other scenarios as evident from Figure 6. The 30% shift is a reasonable participation rate based on the Peel Region pilot study ( 2 ). Off-peak deliveries made to Toronto are associated with the highest savings, followed by Peel Region. Toronto is the most populous and congested municipality in the GTHA, followed by Peel Region, which also accommodates a very large share of the transportation and logistics industry in the GTHA. It means that truck carriers will benefit the most by prioritizing customers in these two regions if they shift to OPHD.
Travel time savings by OPHD trucks by region.
Change in average travel time of shifted trucks.
Impacts of Induced Demand
The improved travel time during the day would induce more passenger demand. The induced demand comes from the passenger model, TASHA of the GTAModel. Induced demand results from changes in passenger activity generation, activity scheduling, destination choice, and mode choice thanks to travel time changes resulting from OPHD. Figure 7 shows how the average travel time is affected with induced demand for two scenarios: 30% and 50% truck shift. The trend is similar for the other scenarios, but less prominent. Overall, with induced demand (shown by the lightly colored bars), the average travel time increases as a result of more congestion caused by the additional passenger demand. Interestingly, light trucks experience increased travel time as more passenger cars are introduced. This is because light trucks have similar travel patterns as passenger cars (e.g., parcel delivery in congested urban roads). Some passenger cars experience higher travel times with induced demand as indicated by lower travel time savings compared with non-induced scenarios. However, the impact is more prominent on light trucks simply because there are fewer light trucks than passenger cars on the network. Induced passenger demand has the least impact on heavy truck and moderate impact on medium truck travel time.
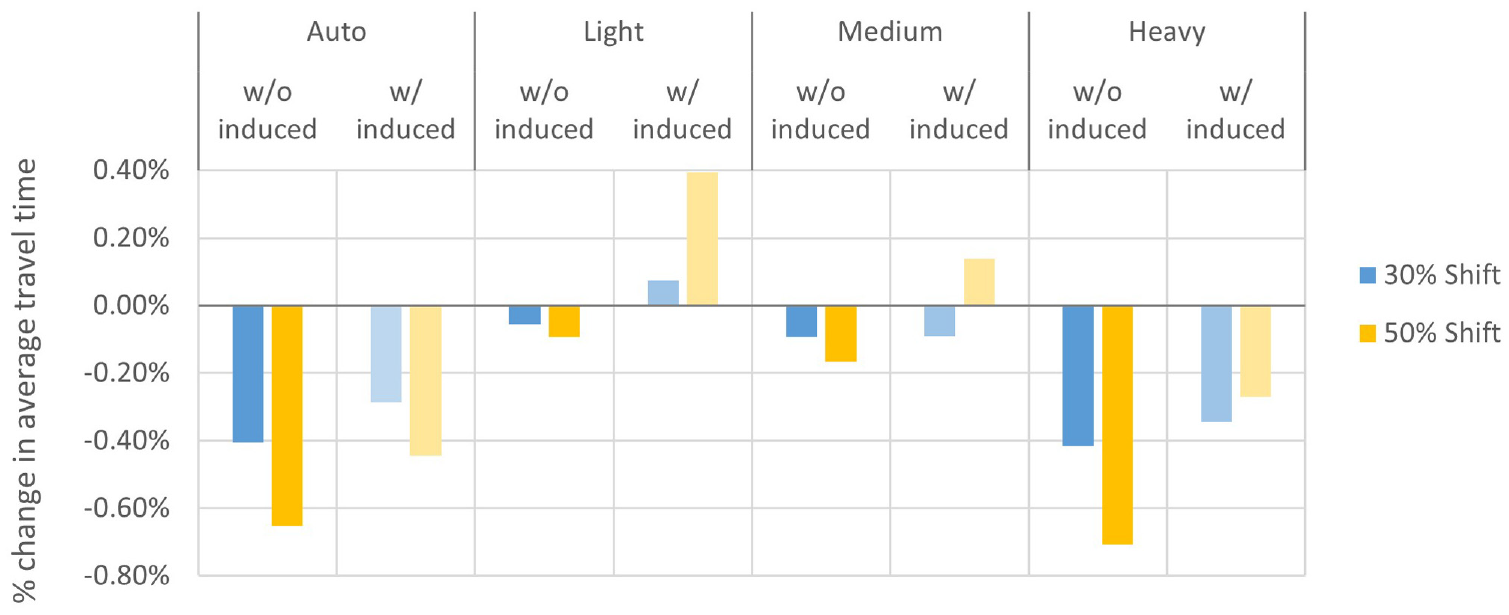
Change in average travel time during daytime (6:00 a.m. to 7:00 p.m.).
Table 5 summarizes the net travel time savings for the scenarios with 30% shift. Total vehicle-hours for three types of traffic are shown here: daytime traffic which generally benefits from the removal of the OPHD trucks from daytime, evening traffic which is worse because of the additional OPHD trucks, and the OPHD trucks which benefit from switching to the off-peak operations. The change in travel time of the overnight traffic is negligible, therefore it is not shown here. Overall, the system has a net benefit of 5,530 h of saved travel time with 30% truck shift, when induced demand is accounted for. These results are based on the scenario where all shifted retail and wholesale trips go to the evening period. If half of these trips move to the overnight period, the system has a net travel time saving of nearly 5,680 h (2.7% more).
Change in Total Travel Time (Vehicle-Hour) if 30% of Participating Industry Truck Trips Move to OPH
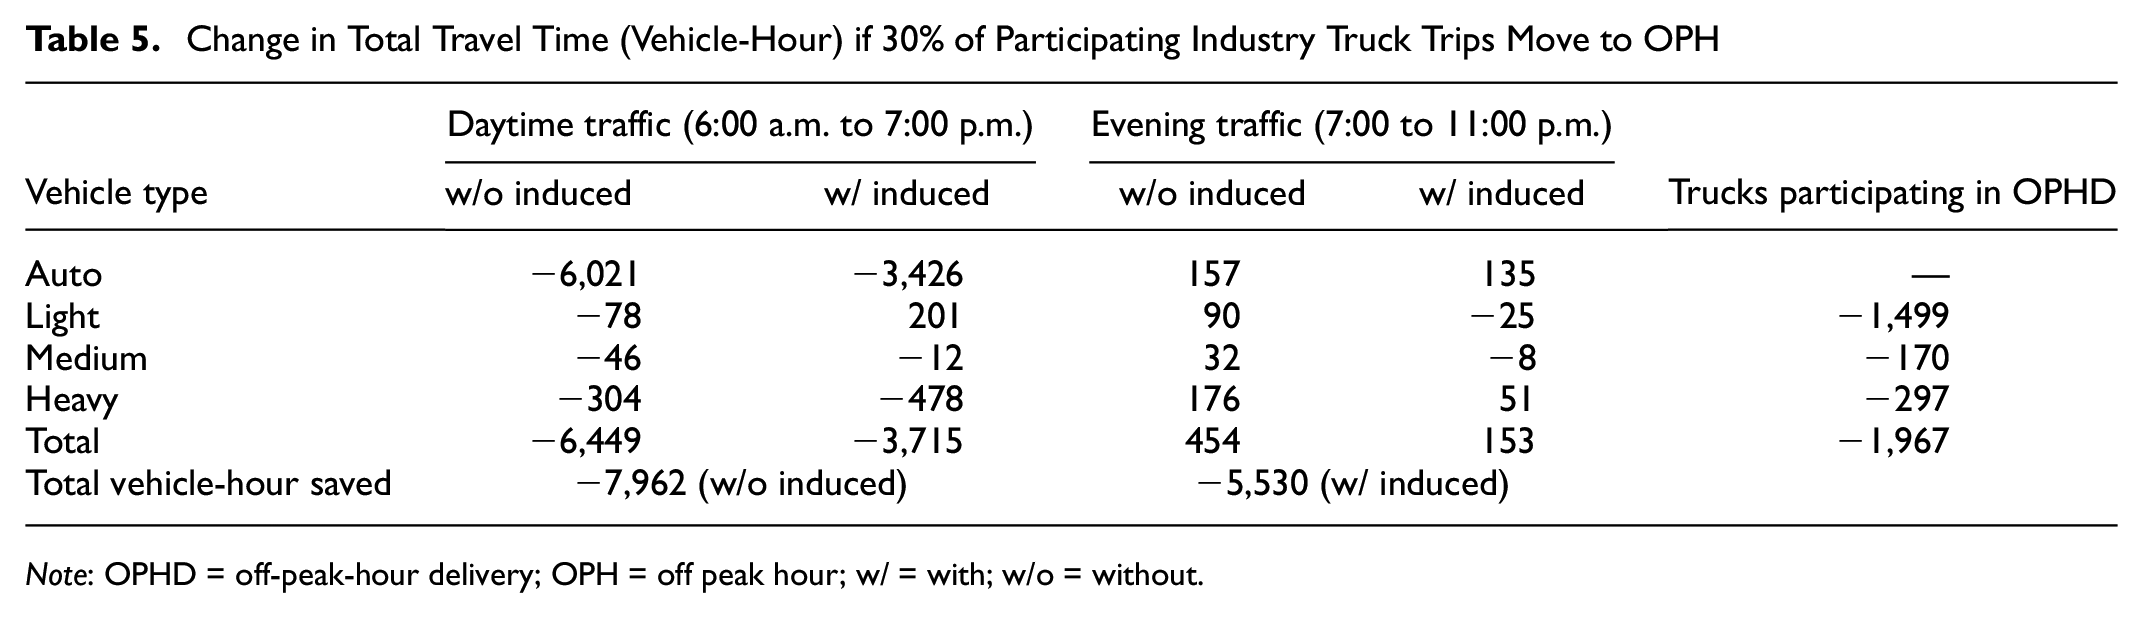
Note: OPHD = off-peak-hour delivery; OPH = off peak hour; w/ = with; w/o = without.
Light trucks would benefit the most from switching to the OPH from two fronts: a) daytime light trucks are worse off with more induced passenger cars that have similar travel patterns as light trucks (e.g., parcel delivery), b) highest average travel time savings by light trucks that participate in OPHD.
Peak-Hour Congestion on Freeway Corridors
So far, the network-wide impacts have been discussed. But it is worth looking at the impacts of OPHD on peak-hour congestion. Specifically, if truck trips are removed from the peak hours, what is the travel time savings by the remaining traffic? To answer this question, the three most congested stretches of freeway corridors have been selected: Highway 401 between Mississauga near the Highway 407 interchange and Pickering at Whites Rd ramp; Queen Elizabeth Way (QEW) between Burlington (near the Highway 407 interchange) leading to Gardiner Expressway in Toronto downtown at York St; and Don Valley Parkway (DVP) between Toronto Lake Shore Blvd to Highway 404 to Markham at the Highway 7 interchange. AM and PM travel times between zones connected by the three corridors are compared between the base case and the 30% and 50% shift scenarios. Travel times are the same for all vehicle types which is expected from the model.
The overall magnitude of average travel time savings for all vehicles in AM or PM peak hours is around 1% for the scenario with 50% shift which translates to less than 1 min of saved travel time per vehicle (Table 6). This is unsurprising, since only a small share of all trips (0.7% for 50% shift) are shifted to the off-peak. The QEW and Gardiner Expressway benefit the most, while DVP and Highway 404 have the least travel time savings. The AM peak is more congested than the PM peak, but the travel time savings are similar for AM and PM peak hours.
Peak-Hour Travel Time Savings on Selected Freeway Corridors
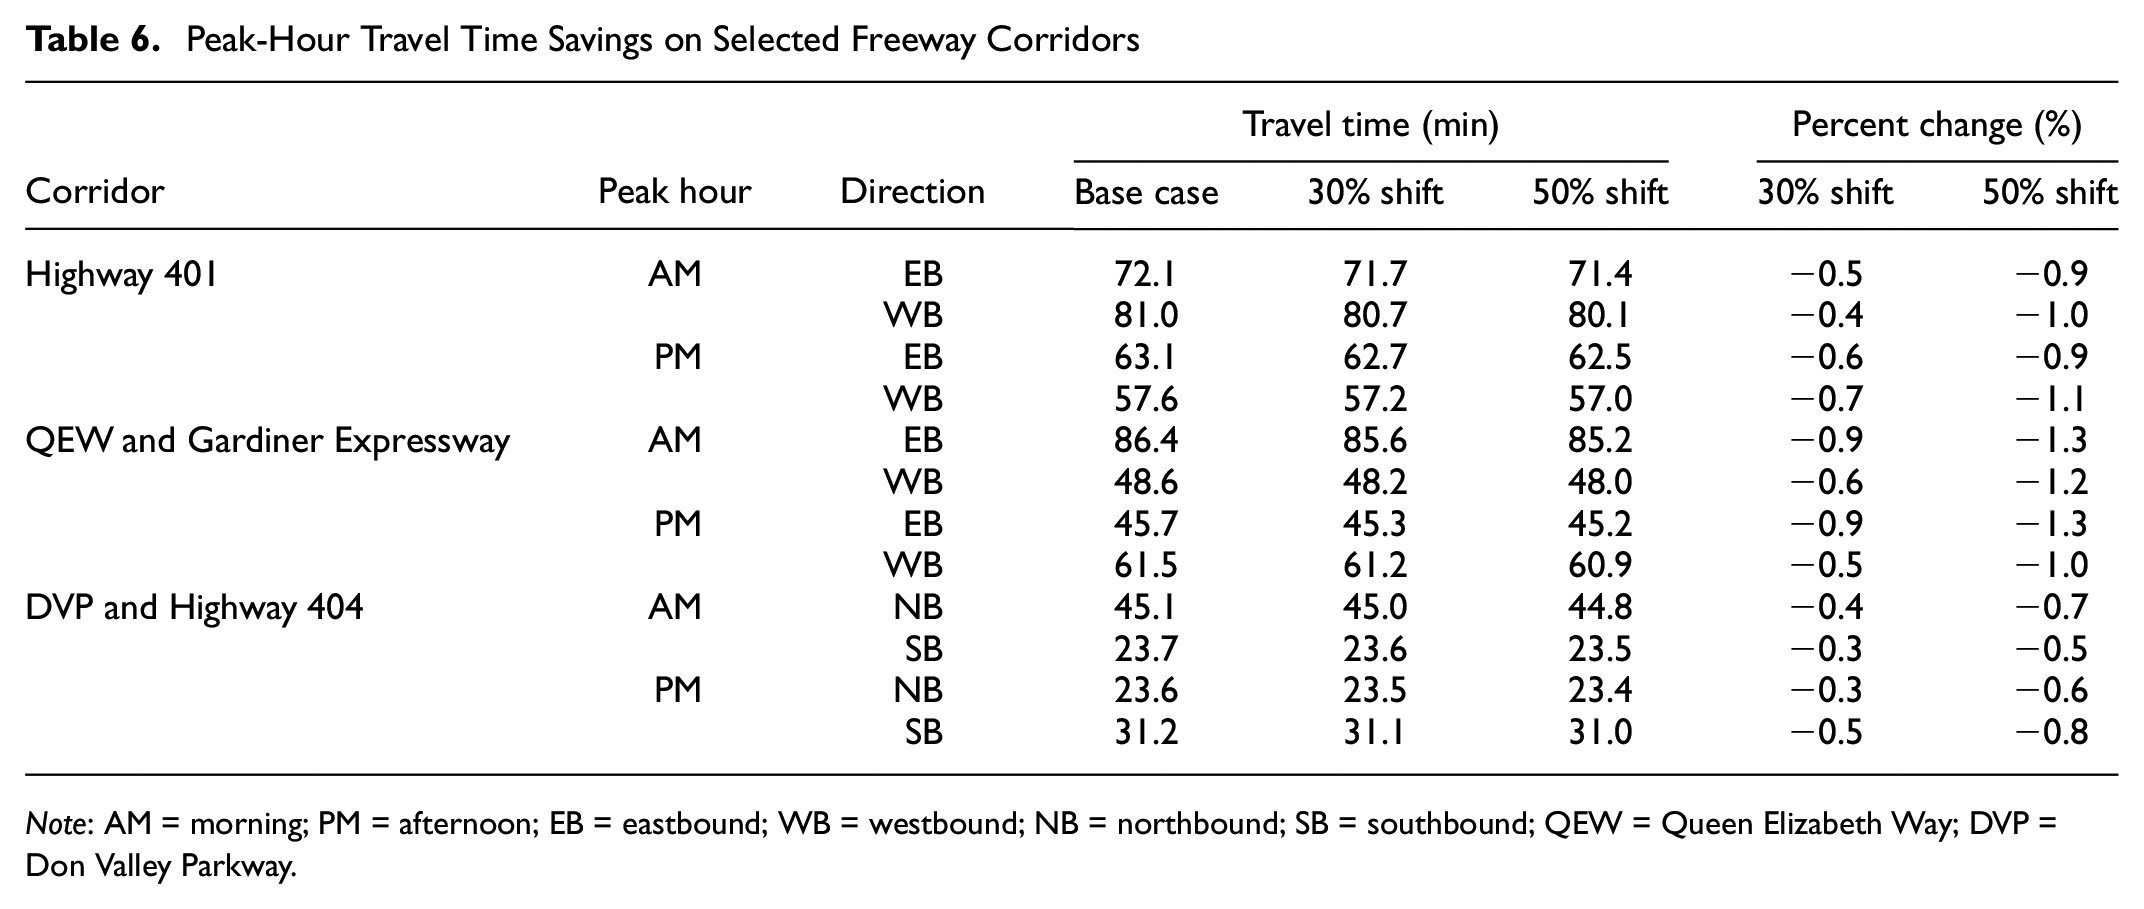
Note: AM = morning; PM = afternoon; EB = eastbound; WB = westbound; NB = northbound; SB = southbound; QEW = Queen Elizabeth Way; DVP = Don Valley Parkway.
Conclusion
The purpose of this paper was to quantify the impacts of OPHD in the GTHA using a recently developed CV model for the region. The CV model is based on a robust trip generation process and it has been calibrated to output traffic volumes that match the observed road counts for the base case. OPHD is modeled as different scenarios representing various levels of participation by selected industry classes. Model results provide several interesting insights.
First, the daytime traffic, on average, experiences travel time improvements as a result of OPHD. Light and medium trucks experience less travel time savings than heavy trucks. This is because light and medium trucks take longer but faster routes as indicated by the increase in average VKT, while the average speeds of all trucks change at the same rate.
Second, when induced passenger cars are accounted for, the travel time savings decline for all vehicles, which is expected. More interestingly, the average travel time of light trucks increases with induced demand. The reason is that light trucks have similar travel patterns as passenger cars (e.g., parcel deliveries in congested urban areas) and the additional passenger volumes make their shared routes more congested. Medium trucks show a similar trend, as we move more trucks to the OPHs.
Third, light trucks save travel time the most by shifting to off-peak, followed by medium and heavy trucks. This, combined with light trucks being worse off during the daytime when OPHD is introduced, suggests that lights truck carriers would benefit the most by shifting to off-peak hours, if only travel time saving is considered. In addition, truck carriers would yield the most travel time savings by delivering to off-peak customers in Toronto and Peel Region.
Fourth, with a participation rate of 30%, which can be considered a realistic scenario in the GTHA, the total daily travel time saving is 5,530 vehicle-hours that can go up by 2.7% if half of retail and wholesale trucks are shifted to overnight, instead of evening.
The model results suggest that a region-wide OPHD policy would be beneficial to the participating trucks as well as the rest of the daytime traffic even when induced passenger demand is accounted for. However, travel time is just one of many factors that will have to be carefully examined when a policy is devised in relation to a region-wide OPHD.
Footnotes
Acknowledgements
We are grateful for the data which were provided by the University of Toronto Data Management Group, the University of Toronto Travel Modelling Group, and the Ministry of Transportation of Ontario.
Author Contributions
The authors confirm contribution to the paper as follows: study conception and design: M. Roorda; T. Chowdhury; J. Vaughan; M. Saleh; K. Mousavi; M. Hatzopoulou; data collection: T. Chowdhury; J. Vaughan; M. Roorda; analysis and interpretation of results: T. Chowdhury; J. Vaughan; M. Roorda; draft manuscript preparation: T. Chowdhury; J. Vaughan; M. Roorda; K. Mousavi. All authors reviewed the results and approved the final version of the manuscript.
Declaration of Conflicting Interests
The author(s) declared no potential conflicts of interest with respect to the research, authorship, and/or publication of this article.
Funding
The author(s) disclosed receipt of the following financial support for the research, authorship, and/or publication of this article: Financial support for this research was provided by The Atmospheric Fund the Region of Peel, the City of Toronto, and the Natural Science and Engineering Research Council of Canada.