
Abstract
Passenger railways face reliability challenges resulting from shared track with other trains, limited infrastructure capacity, and rolling stock and trackway that is subject to major failures during service. Dispatchers may have limited contextual information when responding to an emerging delay, and often rely on their own experience to manage an incident. This study leverages various aspects of delay logs—a common set of data collected during railway operations—to arm dispatchers with an understanding of delays, provide contextual information about previous delays that are similar to an emerging event, and make predictions about the size of a delay based on emerging information. Using graph theory, short-text topic modeling, cosine similarity, and machine learning regression models, we demonstrate that agencies can leverage this single data source for insight and operational support. To showcase the potential insights gained by these methods, we apply them to delay log data from the GO Rail network in the Greater Golden Horseshoe area of Ontario, Canada. We find that elastic net and random forest regression models outperform naive models that may be tacitly used in practice today.
Keywords
In complex and interconnected passenger railway networks, understanding the characteristics and possible outcomes of an emerging delay can allow operators to respond by allocating the right resources, making adjustments to the timetable, and communicating the delay and possible knock-on effects to passengers. An appropriate response requires knowledge about how a specific delay might evolve over time, how long the incident could last, and what other parts of the rail network may be affected. The operational decisions and the accuracy of predictions that are made during an emerging incident can have an impact on the number of affected passengers and the total passenger delay ( 1 ). Responses to emerging delays can rely heavily on institutional memory, drawing on the expertise of dispatchers to respond to emerging incidents with their knowledge of the network and of previous events. This places a lot of onus on individual dispatchers and their recall of similar situations, as well as their ability to predict the magnitude of delays that result from an incident.
Machine learning has emerged as a promising data-driven approach to supporting passenger rail operations by predicting railway delays and incident duration ( 2 ). Traditionally, studies investigating delay propagation in railway networks use methods such as maximum-likelihood estimation ( 3 ) or max-plus algebra ( 4 , 5 ). More recently, machine learning methods such as fuzzy Petri nets ( 6 ), support vector regression ( 7 , 8 ), Bayesian networks ( 9 – 11 ), neural networks ( 12 ), long short-term models ( 13 , 14 ), and random forests ( 15 ) have provided promising results, because of their ability to detect patterns across the many factors that may influence delays on the railway.
Studies that focus specifically on incident delay prediction ( 11 , 12 , 15 , 16 ) are generally concerned with determining system response and recovery times, not supplementing existing expertise with context from historical data. Studies that focus on the propagation of delays throughout the network ( 5 , 10 , 17 ) tend to focus on determining weak points and the prioritization of potential improvements, whereas Zilko et al. provided dispatchers with predictive information to support their response to an incident as it unfolds ( 11 ). They focused on predicting two phases of disruption—latency (time to respond and access the disruption location) and repair (the time to fix the issue)—as the typical operational approach to disruptions in The Netherlands is to execute pre-planned and optimized scenarios. They studied a single type of disruption (track circuit failures) and developed a model that considers the factors that influence the length of the two phases. Their results suggest both that predictive information about unfolding incidents is of critical importance to rail operators, and that there is room for a more general prediction method that includes multiple delay causes across a wide range of locations.
There have also been some attempts to leverage the textual data provided in delay reports for various transportation models. Noursalehi et al. applied natural language processing techniques such as Latent Dirichlet Allocation to extract information from textual data for rail delays ( 18 ), building on work from Pereira et al. on traffic analysis ( 19 ), Willams and Betak on railroad equipment accidents ( 20 ), and Wang et al. on fault diagnoses of railway maintenance failures ( 21 ).
Our goal is to demonstrate a set of practical and implementable methods that leverage delay logs to provide insights into the system and make predictions about larger incidents. We outline a set of machine learning methods that leverage logs to examine factors contributing to larger incident delay, predict the characteristics of larger incidents, and support the response and decision-making process for these incidents as they emerge. We demonstrate the efficacy of the approaches using data from the GO Rail network in the Greater Golden Horseshoe area of Ontario, Canada.
The rest of this paper is organized into three parts: The methods section outlines the methods used in the study and describes how they may be used in a broader context. The application section describes the data used and the specific data processing and model configurations used as part of the application to the GO Rail network. The concluding section discusses limitations and future work.
Methods
The methods support two main goals: Providing an analytical understanding of delay trends on a passenger rail network, and supporting operational response to delays as they emerge. Figure 1 shows how the various methods are connected.
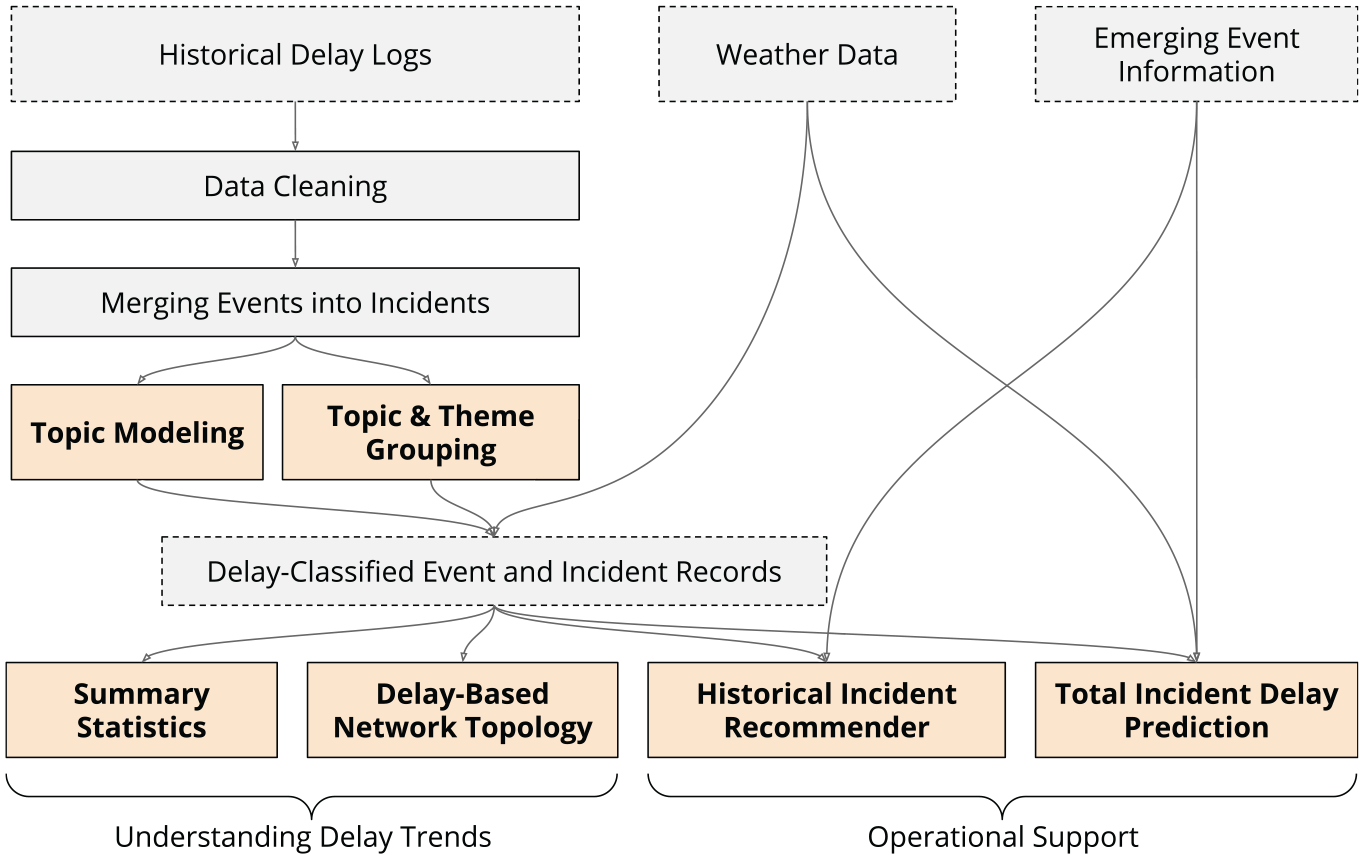
Research methodology.
In addition to boosting historical understanding of delay trends in the system, this paper provides two key items which can be used by an operator in real time to gain more information and context about an event as it emerges, and to gain predictions about how much delay an incident is likely to experience after an initial delay is reported. Each of these outputs is supported by information contained in logs recorded by a railway describing a delay and containing metadata information about delay location, time, the initial delay experienced, and information about the root cause. This section introduces general approaches that can be used on any log-based event data; the application of the techniques on a specific data source is found in the subsequent section.
Throughout this paper we will refer to two similar but distinct sets of information. We use the term
Event data typically contain a timestamp referencing when the record was created, a location of the delay, some information about the trains involved, the delay amount, a delay code or some reference to the reason for the delay (broken switch, operational error, etc.), and some text remarks with additional information. Incident data therefore include aggregates of these metadata, including lists of locations and trips involved, total delays, and time spans. Connecting events into incidents can be done by detecting overlapping comments—as with the application below—or by some other method specific to the data structure for that agency.
The initial delay is reported at the time of the incident when the train crew first reports the incident to the operations center. As this initial delay is part of the data available to a dispatcher at the reporting of the event, it is included as part of the analyses and prediction models.
Understanding Delay Trends
Descriptive Analytics
There is a wide array of summary analyses and statistics that can be calculated using the available delay data. We are interested in learning about what topics lead to longer delays, and how these topics contribute to the total delays on the network, and will consider the following summary statistics:
Average total yearly delay by theme (see the subsection on thematic grouping): This provides insight into what types of delay have the largest impact on the total delay on the network.
Average event delay by theme: This provides an understanding of which types of delay last longer than others, and allows for an understanding of delay types without regard for frequency of delays.
The distribution of events and incidents by delay: This allows for an analysis on the frequency and impact of major delays, and to understand the shape of the distribution of delays (i.e., long-tailed, uni-modal).
Graph Analysis of Connected Locations
Two locations are considered “connected” if events at these locations are part of the same incident. We can use this connectivity to construct and analyze a graph that maps the topology of the sets of locations (station and other network locations named by the agency) that appear together in incidents. The graph consists of nodes representing locations on the rail network, and edges with weights
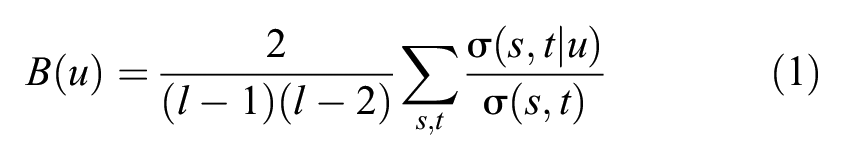
where
Thematic Grouping and Topic Modeling
Delays are classified into topics to learn more about the types of root causes that lead to delays and to support prediction modeling. We identified several topics and overarching themes that allowed us to capture the vast majority of delays. Ideally, manual classification is possible using agency-assigned delay codes, but in the absence of this information topic modeling can be used to infer this information. We discuss both approaches in this subsection.
Delay log data often have manually assigned “delay codes” which attribute the delay to a business-specific situation or cause of delay. Although these delay codes provide valuable business insights, they are not always directly connected to the delay cause and can be very specific. For example, an agency might have a separate code to label delays caused by various contractors doing track work, when ultimately the track work is the root cause of the delay; the specific contractor is not particularly important. It is helpful to cluster these codes into topics and themes using a manual mapping process.
Choosing specific themes and topics uses an iterative process. We begin with larger themes that are relatively independent. For example, delays caused by various interactions of people with the rail system (people–train conflicts) are independent from delays resulting from construction projects, or delays caused by rule and safety violations. With these larger topics in hand, a list of agency delay codes sorted by their total delay was used to assign specific delay codes to topics that emerged within each theme. As topics emerge from this process, some initial themes may become unnecessary, while new ones emerge. Table 1 shows an example of how various incident codes can be mapped to a smaller subset of themes and topics, and is the final categorization used in the case study example.
Theme and Topic Grouping for Delays
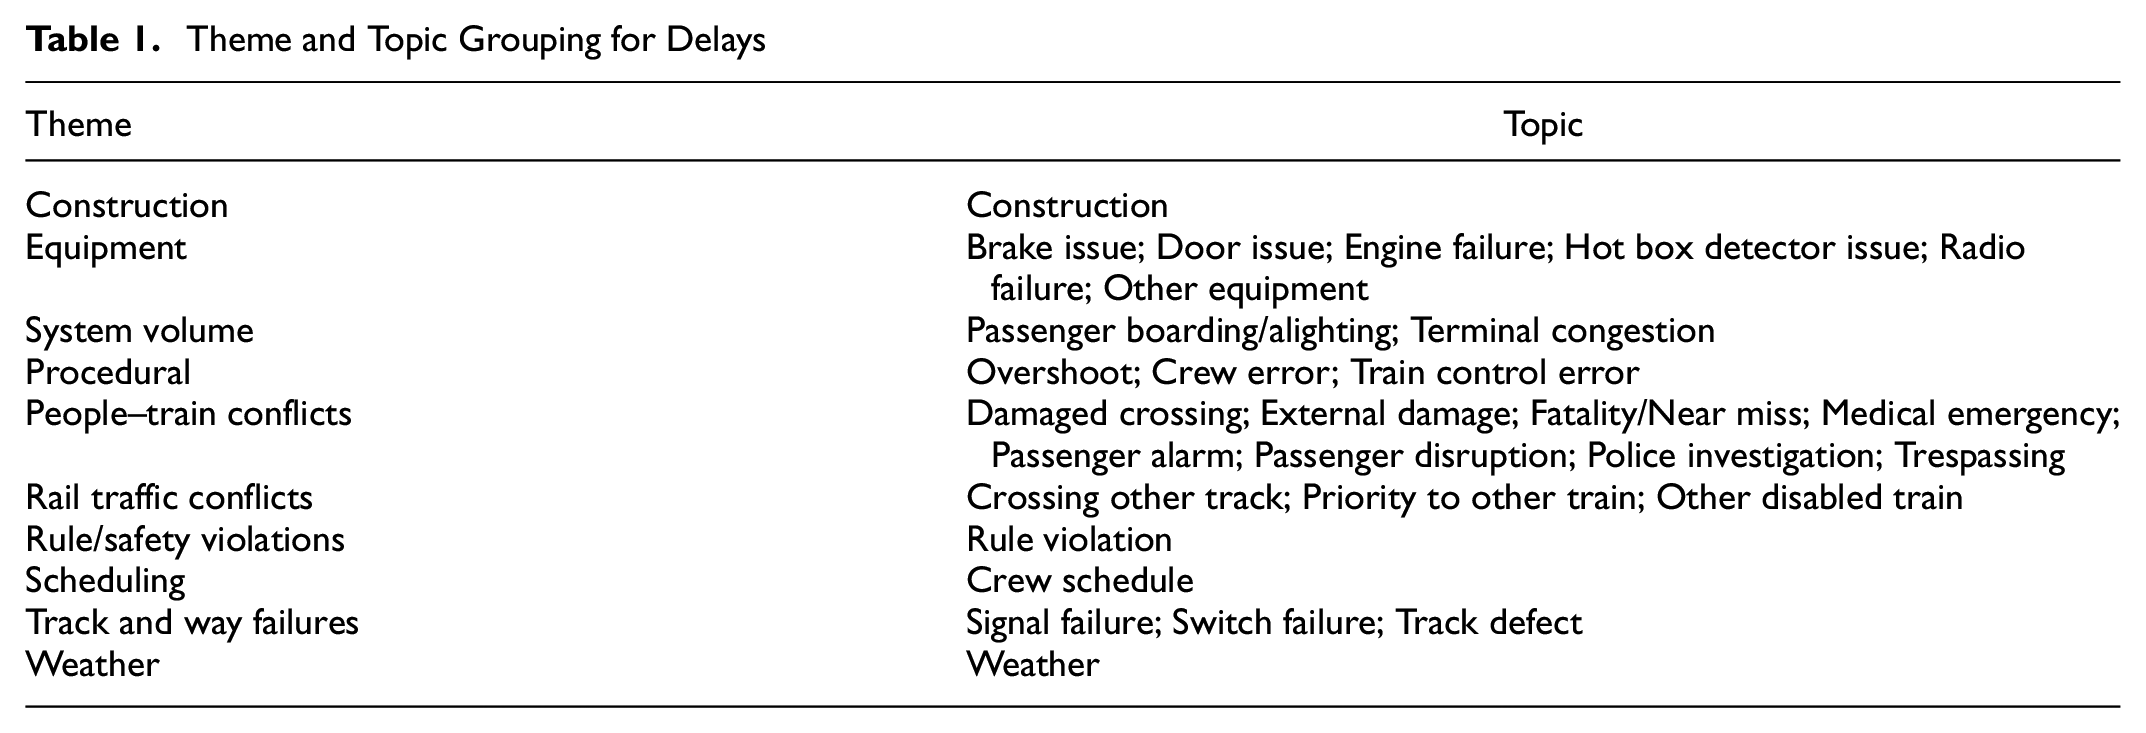
In some cases, delay codes may not be assigned as part of the event-recording process, are unreliable, or have a miscellaneous category that includes many potential delay topics. Using free-text remarks from these logs, we can apply a form of unsupervised machine learning and word clustering called topic modeling. Generally, topic modeling is used to find groups of related words in a set of documents.
Given the relatively short nature of delay remarks and the general fact that each log refers to a single delay topic, a short-text topic modeling approach was used (as opposed to the commonly used Latent Dirichlet Allocation which assumes multiple topics per document and is used for longer documents). We invoke a Gibbs sampling algorithm for a Dirichlet Mixture Model (GSDMM) known as the “Movie Group Process” (
24
) which allows for automatic inference of the number of clusters and converges quickly. Documents are assigned randomly to a set of
Remove numerical information such as train numbers and delay values.
Remove common English stopwords.
Remove ubiquitous terms such as “delay,”“minutes,”“due,”“route,” and the name of the service. This can be done by iterative inspection of the resulting groupings.
Tokenize, lowercase, lemmatize, and stem words to ensure all words are in their base root form and to minimize overlap of similar words.
The final bag of words can then be processed with the GSDMM model and clusters of words can be analyzed to develop emerging themes from the data.
Historical Incident Recommender
Providing historical context to a dispatcher during an emerging incident requires providing them with information about similar delays from the past. This enables the dispatcher to examine delay logs that are closely matched to the type of incident that is ongoing for insight into how the delay evolved previously and how it was responded to. This can be especially helpful to novice dispatchers who may not have encountered or responded to these specific types of events in the past.
The process of finding similar historical events is akin to a recommendation system which suggests similar movies or products to a user based on their own preferences. In this case, similarity of events is based on the initial delay of the emerging event, location, time of day, and the delay topic. Each event is converted to a vector of these characteristics and matched with other events based on the cosine between the two vectors
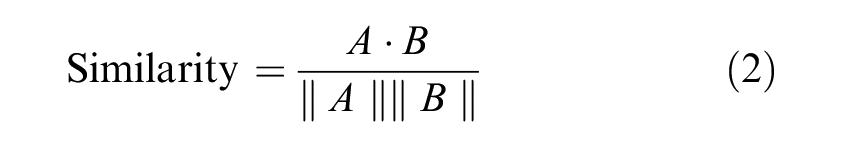
The cosine similarity measure allows for the greatest amount of flexibility when comparing fields. Distance-based measures such as Euclidean and Manhattan are used when the magnitude of values has an important influence, which is not the case here. Jaccard similarity was ruled out because of the relatively small set of features that are considered for matching. Data can be one-hot encoded to avoid any influence of the ordering of labels, or can be label encoded if there is a natural ordering of the labels (such as with time of day). One-hot encoding is a technique by which each unique value in a set of data (e.g., locations) is treated as its own feature, with a binary variable (1 or 0) to indicate its presence in a particular event.
Evaluating a cosine similarity model empirically is difficult as the model is not performing a prediction but is creating a matching score and displaying results the model considers relevant to the emerging event. For this reason, the evaluation of this applied model is restricted to qualitative discussion of the results using manual inspection of recommended events based on random samples of the data.
Delay Prediction With Machine Learning
The goal of the delay prediction model is to make predictions about the eventual incident delay based on information provided in an initially reported event. Information in the individual log data, which is considered available to the dispatcher at the time of the event delay, can be used to make predictions about the larger incident that might emerge.
The data include a mix of categorical and numeric features and are also imbalanced; low-delay events are much more likely than high-delay events. There are correlations between features, given that locations may share the same rail corridors. Given these considerations, an ordinary least squares model is likely to provide a poor prediction. We considered three regression models: a random forest regression, an elastic net regression (closely related to support vector regression), and a method using aggregate results from the cosine similarity recommendation method described above.
Random Forest Regression
Random forest is a meta-estimator method that performs fits using several classifying trees over subsets of the data and averages them to improve prediction accuracy. Decision tree models train by examining a set of binary decisions that lead to correct results, developing a decision-making tree that can be used to predict future data. Data cleaning and feature creation and engineering is described further in the application section below.
Decision tree models have an intuitive structure and process, but they can be prone to over-fitting of the data if the depth and complexity of the tree is too high. Restricting the maximum tree depth and varying the total fraction of samples used in each tree can mitigate this issue. Hyperparameter tuning using
Elastic Net Regression
Elastic net regression is a form of regularized least squares regression that combines a least absolute shrinkage and selection operator (LASSO) and ridge regularization methods together into a single model. In this case, the goal of the regression is to minimize the sum of the squared residuals, plus a linear combination of the sum of the absolute values of individual feature weights (LASSO regularization) and the square of the feature weights (ridge regularization). Elastic net regression requires the tuning of two hyperparameters:
The LASSO method is particularly useful for data sets with large numbers of features, as it tends to select only one from a set of highly correlated features, ignoring the others. Ridge regression is useful for developing longer-term prediction models as the model tends to favor less-sensitive prediction approaches. Combining the two balances these strategies.
Cosine Similarity Regression
It is possible to extend the cosine similarity model described in the previous subsection to make a prediction about delays. In this regression approach, the average delay across the
Model Evaluation
As a metric for model comparison, we consider three “naive” prediction methods that may be given tacit use in operations: predicting that the initial delay will equal the total incident delay, predicting the median delay across all incidents, and predicting the mean delay across all incidents. We compare these three models with the three regression models described above. Results will be evaluated using the mean absolute error (MAE), the mean squared error (MSE), and the root mean squared error normalized by the standard deviation of the data (NRMSE-
Application to the GO Rail Network
GO Rail is the rail service division of Metrolinx, a provincial agency responsible for regional transit planning and operations in the Greater Golden Horseshoe area which surrounds the city of Toronto, Ontario, Canada. GO Rail service is divided into eight rail corridors (Figure 2) and 69 stations. Union Station in downtown Toronto is the largest transport hub in Canada and one of the largest rail stations in North America, serving more than 350,000 daily passengers (pre-pandemic).
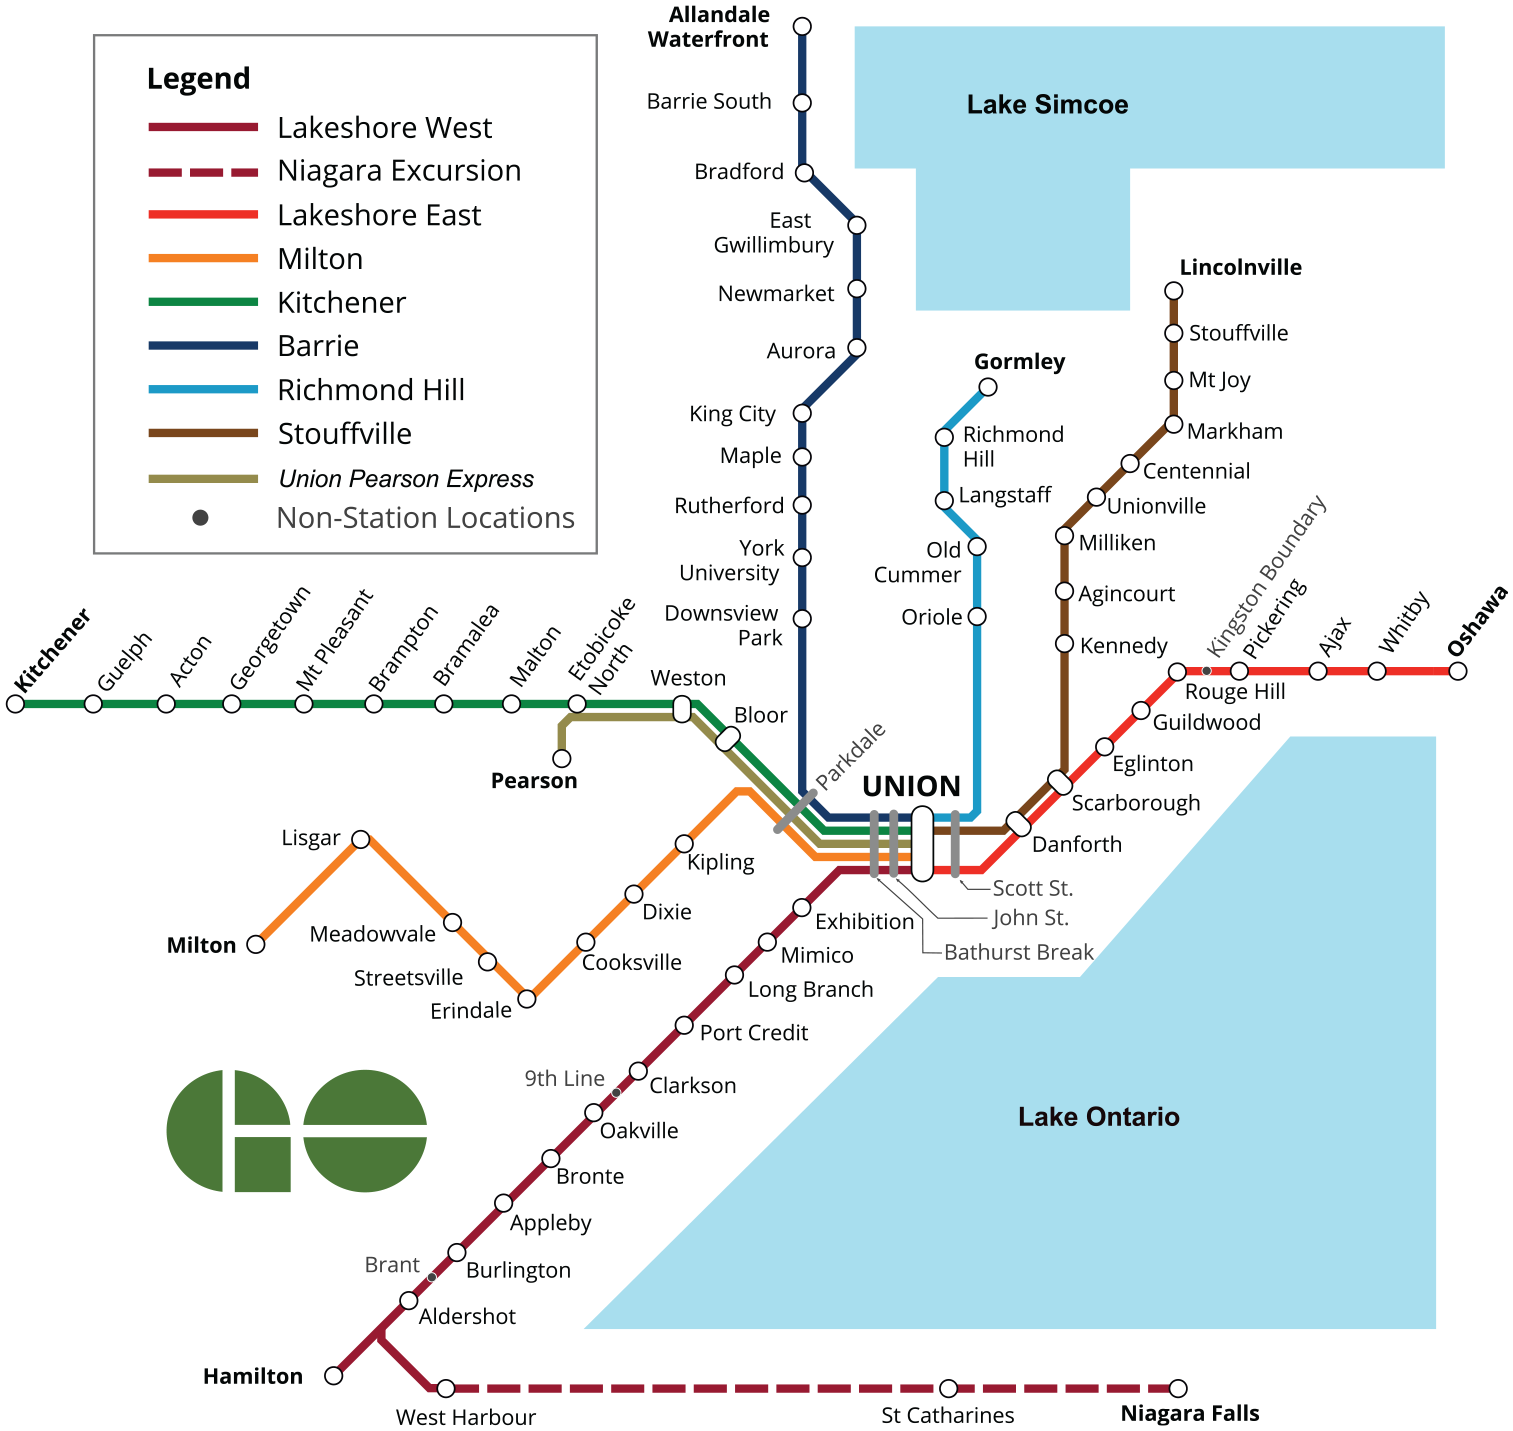
GO Rail Network (modified from Wikimedia).
Delay log data spanning from January 1, 2015 to December 31, 2019 were provided by Metrolinx for this study. The data consist of 78,608 delay logs with a total recorded delay of 418 days over the 5-year period. As several of these delays were coded using a “miscellaneous” category, a topic model was built using only the remarks found under this category and the steps described in the above methods section. This model produced clusters of words that indicated that some delays resulting from construction and heavy passenger volumes were being categorized as “miscellaneous.” Using regular expression searches for key terms such as “passenger,”“volume,” and “construction,” several of the miscellaneous categories were tagged with the appropriate themes and topics. More detail on the application of topic modeling to the entire data set is described below.
This cleaning and categorization process resulted in some data loss because of being unable to categorize events; the final cleaned data set therefore contains 70,904 events, of which 39,425 are for delays greater than 5 min. For the purposes of constructing prediction models that use emerging event information, only the first event in each incident is used in the model training data, a total of 46,900 events. Each delay log also includes a series of metadata consisting of the time the event was recorded, the location, corridor, and train consist information involved. Events are also tagged with an internal delay code which was mapped to a broader set of topics and themes following those in Table 1, using the iterative process outlined in the methods section.
As a stand-in for the region, historical weather data from Toronto Pearson International Airport ( 25 ) were collected, which include hourly temperature and visibility measurements, as well as human observations (e.g., “mostly cloudy” or “thunderstorms”). These three fields were included alongside the metadata obtained from the logs to support predictions.
Events to Incidents
In addition to the specific metadata, a free-text field is filled in by operators and extended as further delays related to the same incident occur. For example, a remarks section for a given event might look as follows:
[Train A] was held 30 minutes at Union Station waiting delayed [Train B] to clear Newmarket sub.
[Another Railway Dispatcher] reports crossover is not locking normal or reverse at Snider South. All trains through will have to take pass stop authority with one switch in hand. [Railway Maintainer] advised no ETA yet.
[Train C] was delayed 15 minutes en route to Snider because of switch issue with crossover at Newmarket sub.
[Train D] was delayed 13 minutes at Aurora GO because of late arrival [Train C].
Because of confidentiality and the sometimes sensitive nature of the data, specific examples of data provided here have been changed from their original. The structure of the data for illustrative purposes is preserved.
Each paragraph in the delay log entry is appended to the original text when a new record is created. This means that two entries will have partially overlapping text when they are a part of the same incident. We have used this overlap to collect delay events on the same day into incidents via the following steps:
For each operating day in the data, create a graph where nodes consist of individual events, and add edges when events share overlapping text.
Find all connected subgraphs of this original graph. Each subgraph’s set of nodes is considered part of the same incident.
Collect and aggregate the metadata from all events into a single incident.
This process resulted in the assembly of 68,555 incidents, indicating that a large fraction of incidents contain only one event.
Summary Results
Figure 3 shows the total average yearly delay for each of the 10 identified themes for delays. People–train conflicts consist of any adverse interaction of people with the rail system and include topics such as trespassing, collisions, passenger assist alarms, damage at crossings, and vandalism. Traffic conflicts include any situation in which a train other than the one delayed is given priority, causing the train to incur delay. Track/way delays consist mainly of broken switches and signals, but include other track maintenance issues as well. These three themes make up a large portion of the yearly delay. Safety and weather delays, although infrequent and accounting for a small part of the total delay on the network, tend to take the longest to resolve. System volume issues (delays resulting from crowding) and procedural issues such as platform overshoots resolve more quickly.
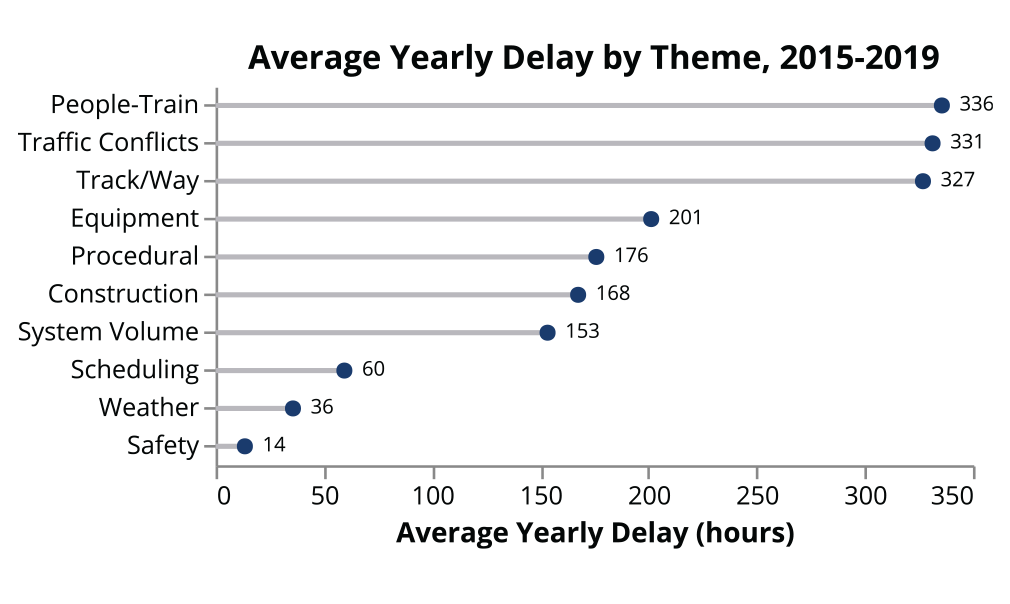
Total yearly delay by theme.
Aside from a few extreme examples of delay days where system-wide failure occurred (e.g., power loss in multiple signals as a result of lightning), the large majority of incidents consisted of a single event (77%), with two, three, and four-event incidents forming most of the remaining incidents. Delay distributions for both events and incidents (Figure 4) are long-tailed, with incident distribution being more spread out and forming a longer tail because of the presence of rare but high-delay incidents. The distribution of the first event delay for each incident takes a form very similar to the overall event delay distribution in Figure 4, with a mean of 6.51 min, and a standard deviation of 6.44 min.
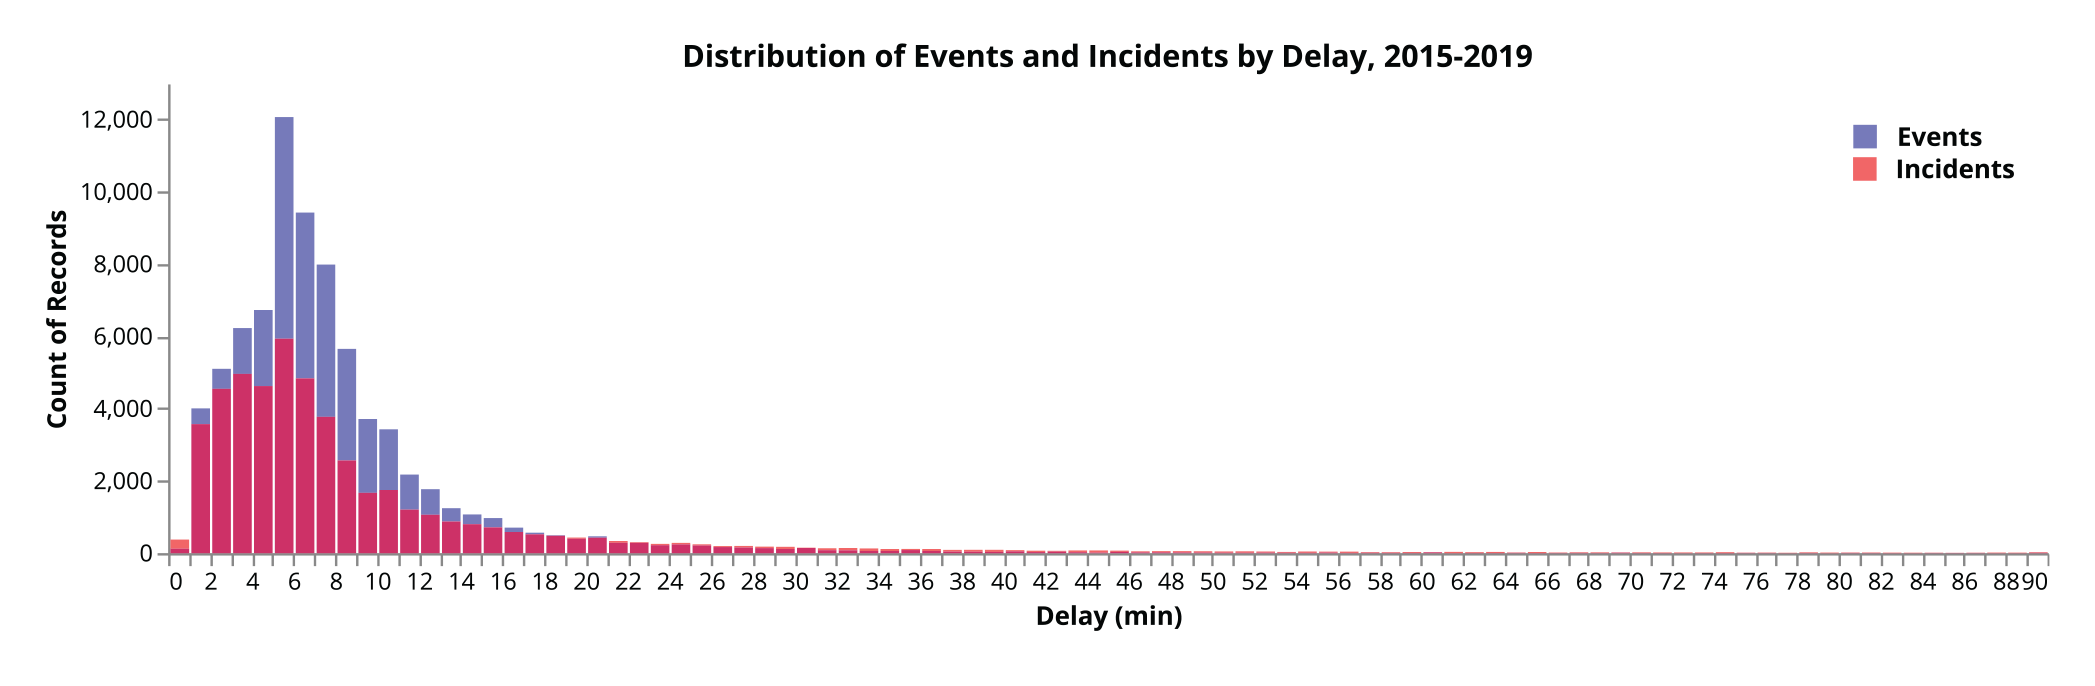
Distribution of event and incident delays. Data are truncated at 90 min for visualization purposes.
Connected Locations
Figure 5 shows the 10 most strongly connected location pairs on the network, based on the count of shared incidents. The Union Station–Aldershot GO pair are two termini of the busy Lakeshore West corridor and share the most delay between them, followed by the terminal stations of the Lakeshore East line. Adjacent locations such as Union Station and the Scott St. interlocking to the east also share delays. Figure 6’s degree similarity measure emphasizes Union Station’s importance as critical node on the GO Rail network, followed by the two other terminal stations of the Lakeshore West and Lakeshore East lines. In contrast, the betweenness centrality (Figure 7) shows top locations such as Bathurst Break and East Gwillimbury GO, relatively minor delay locations that act as bridges between other delay locations. John Street, which is a ladder interlocking system just west of Union Station that serves all inbound traffic from the west side of the network, acts as a critical delay node as well.
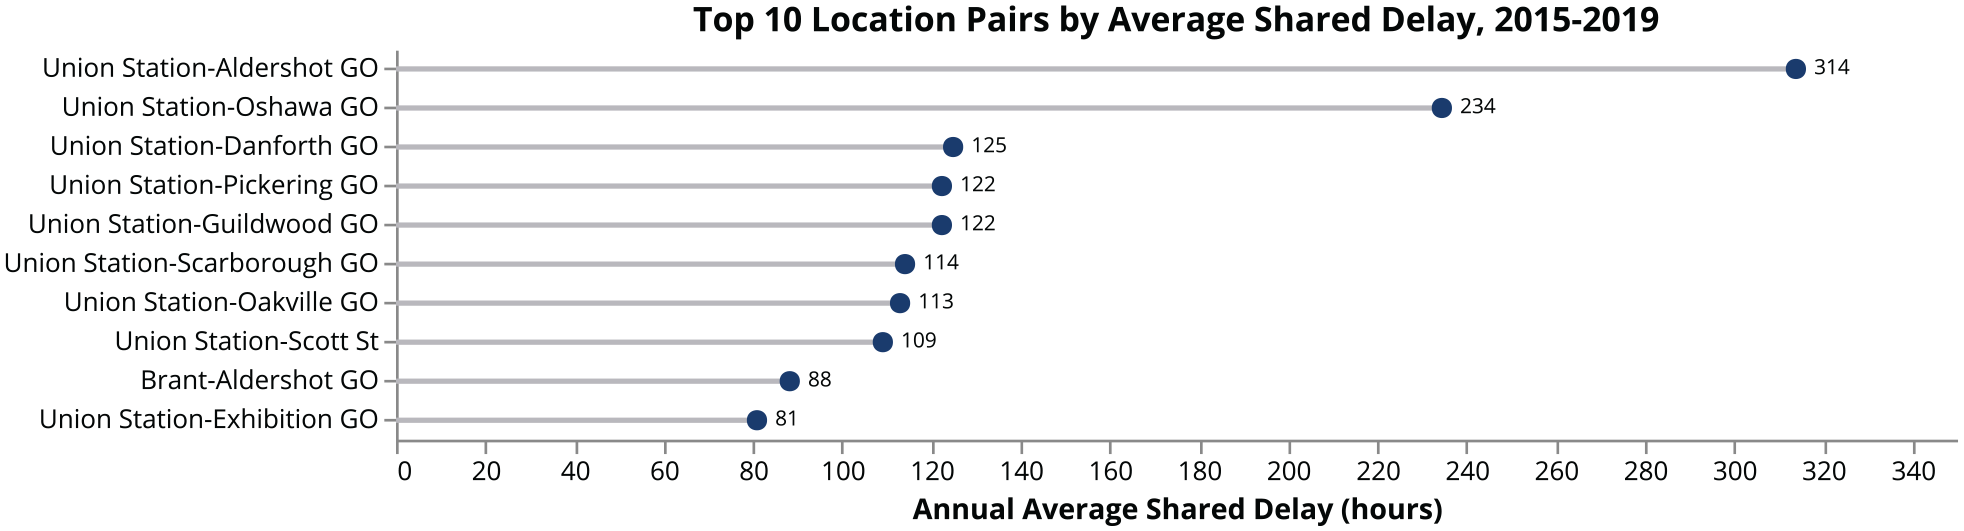
Shared delay by location pairs.
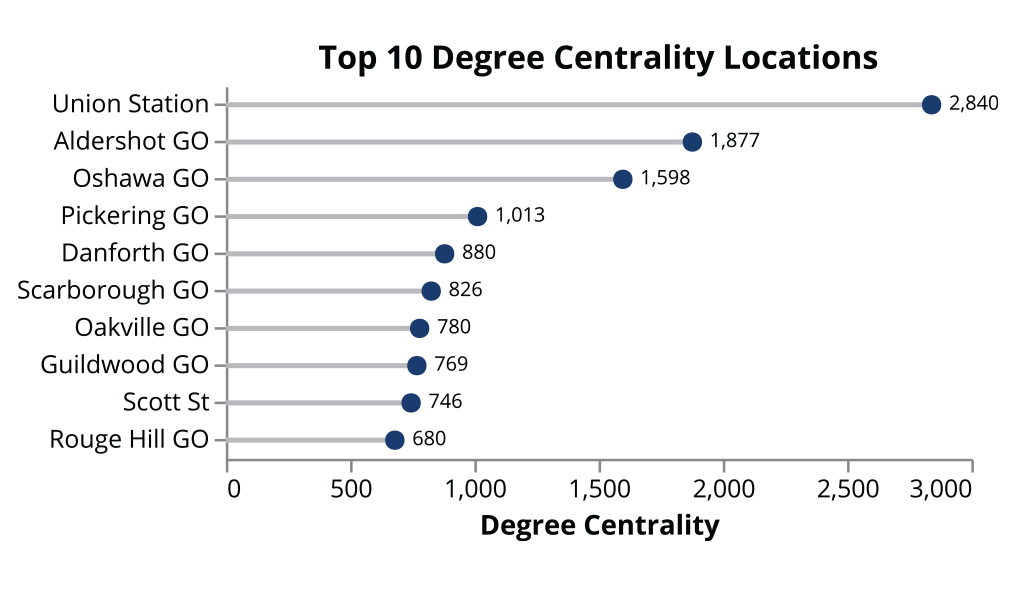
Degree centrality of locations.
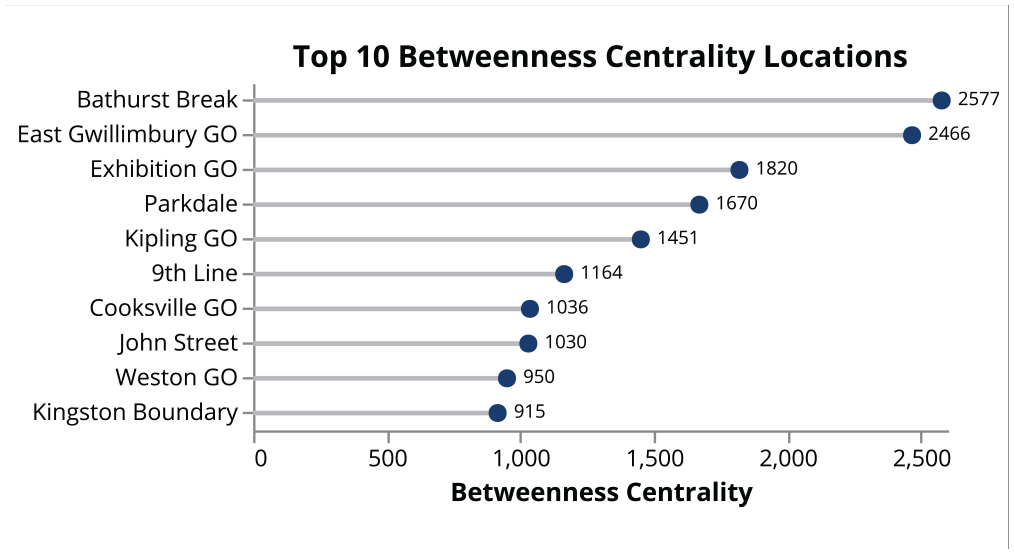
Betweenness centrality of locations.
Topic Modeling
After removing stopwords, lemmatizing, and stemming the remarks, a total set of 66,855 documents was used to fit the topic model. The GSDMM algorithm was used with parameters of
Top Five 5-Word Clusters From Topic Model and Their Ascribed Meaning
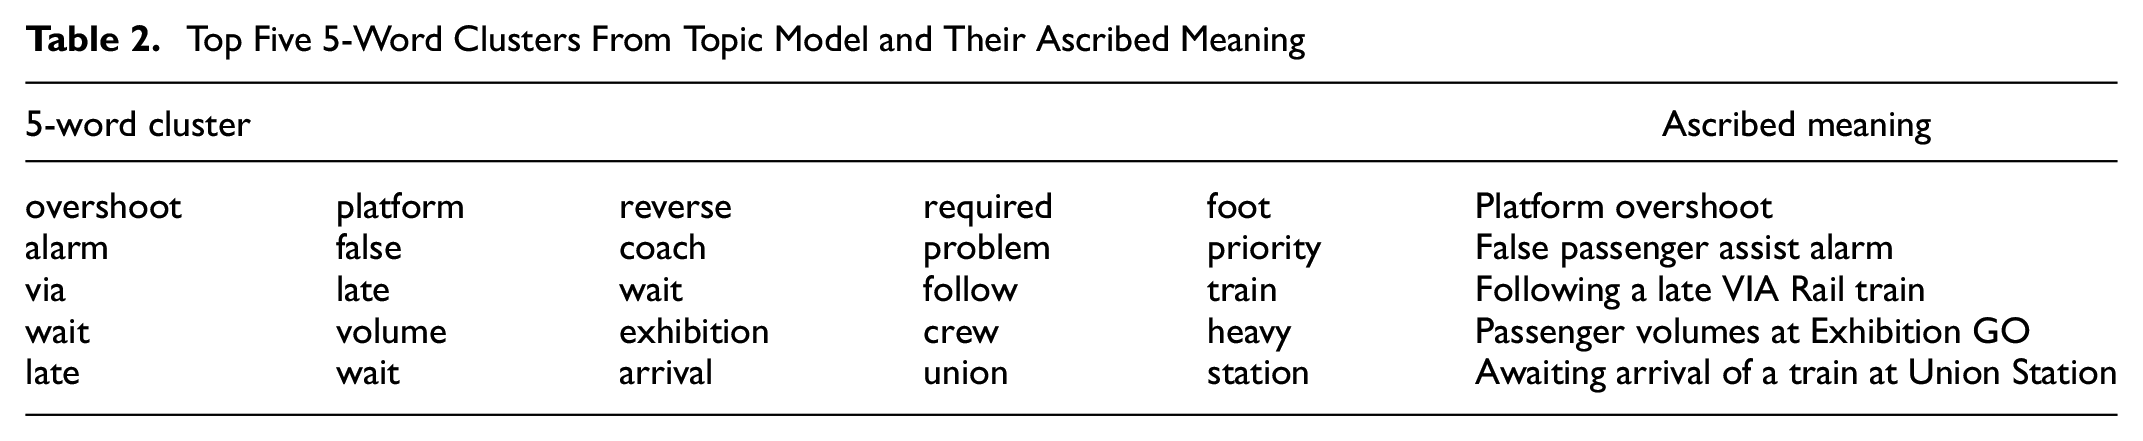
The word cluster topics assembled by the prediction model are easily interpreted and demonstrate that latent topics that may not specifically be categorized can be found within the remarks portion of the log data. Agencies can use these word clusters to develop their own classification topics and to determine areas of the network or causes of delay that may not otherwise be apparent.
Historical Incident Recommendation
A recommendation engine was built to match an emerging event with historical events based on the following features:
The location of the delay, encoded using one-hot encoding.
The topic of delay, encoded using one-hot encoding.
The time of day the delay was logged, including early morning (00:00 to 06:00), morning peak (06:00 to 10:00), mid-day (10:00 to 15:00), evening peak (15:00 to 19:00), and evening (19:00 to 00:00), encoded using ordinal encoding.
The air temperature at Pearson International Airport, classified as cold (−5°C), hot (more than 30°C), and normal (otherwise).
The visibility at Pearson International Airport, classified as poor (if less than 1 km) or good (otherwise).
The initial delay, classified into ranges of [0, 5), [5, 15), [15, 30), and
Data were split randomly into two sets: a test set to simulate new events (20%) and a library set of historical events (80%). Each member of the test set was matched with each member of the library set to calculate a matrix of cosine similarities between all permutations of the two data sets. Although evaluating this method on an analytical level is not possible, visual inspection of the top results returned from several randomly sampled trial events indicated both that the data set is large enough to return multiple independent incidents for a test event, and that the cosine similarity measure provides a good method of matching with historical events and providing a dispatcher with relevant historical information.
Delay Prediction
Performing regression on a mix of categorical and numerical features required preprocesssing and encoding of data. Station locations and delay topics were one-hot encoded, whereas the time of day (hour), the temperature in Celsius at Pearson International Airport, and the initial delay were kept as numeric values. These numerical values were scaled by removing the mean and scaling to a unit variance, namely:

where
The Python package Scikit-learn ( 26 ) provides methods for elastic net and random forest regression models, as well as the ability to perform hyperparameter tuning using 10-fold cross-validation and techniques such as random searches (sampling from a wide field of parameters) and grid searches (iteratively checking all parameter combinations in a smaller subset). Results for the three prediction methods (random forest, elastic net, and cosine similarity) are tabulated in Table 3 next to three naive methods.
Model Results for Delay Prediction Regression
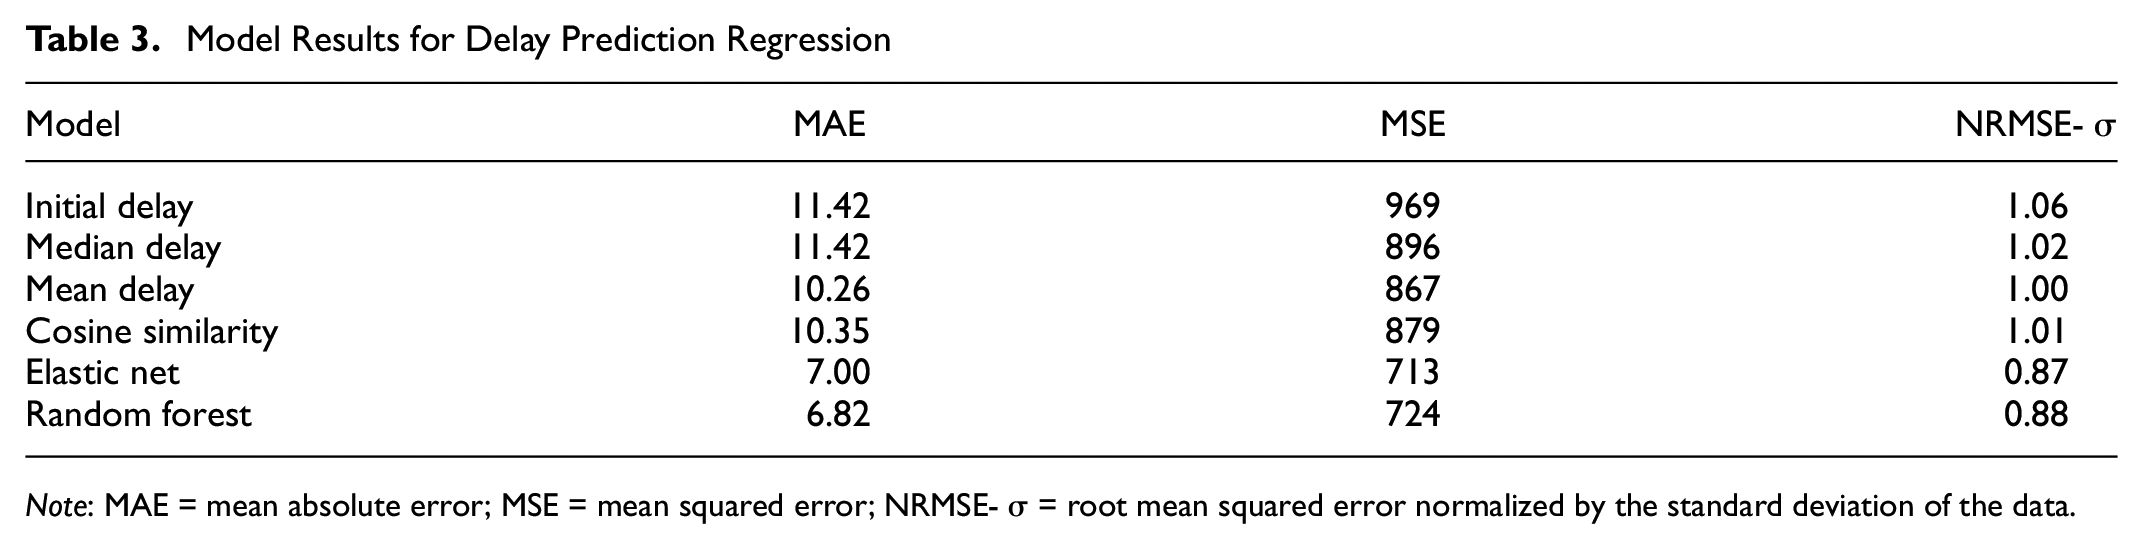
Note: MAE = mean absolute error; MSE = mean squared error; NRMSE-
Overall, the random forest and elastic net models outperformed all naive methods of prediction and the cosine similarity approach. Both machine learning methods resulted in a normalized root mean squared error below one; given the high variance in the data this is a promising result.
Random Forest Regression
Hyperparameter tuning of a random model was performed using a 5-fold cross-validation grid search. This resulted in a maximum tree depth of four, and a forest of 5,000 decision trees. Restricting the maximum depth of the tree avoids over-fitting on the testing data.
The feature importance selected by the random forest model offers insight into the factors that influence prediction of total delay. Figure 8 charts the 10 most influential features in the model training process. The three numerical values (initial delay, hour, and temperature) feature in the top 10. The initial delay reported plays the largest influencing role, in part because the total delay can only be equal or greater to this value. Hour and temperature are less important than some of the binary variables such as whether a signal failure has occurred, but their larger range of values provides the model flexibility in using them for decision making.
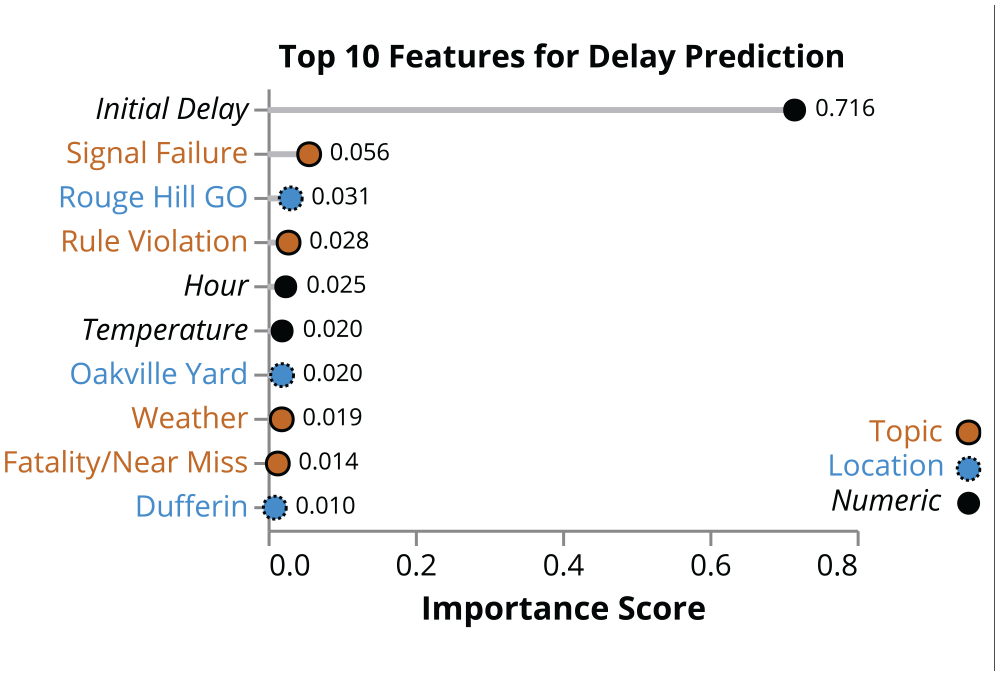
Random forest feature importance (top 10).
Figure 9 provides some insight into the decision-making tree that is produced by the random forest regression model. Note that this is one of 5,000 different trees that are averaged, so this tree is to be taken as an illustrative example rather than the final decision-making process. Although some branches use a low sample count for decision making, this may not be the case across all the trees used in the random forest. As was indicated by the feature importance score, initial delays feature prominently in several parts of the decision tree. We can also see how the splitting of samples at a decision point is often very unbalanced; this is one of the reasons that a shallow tree produced better results with less over-fitting than a deeper tree.
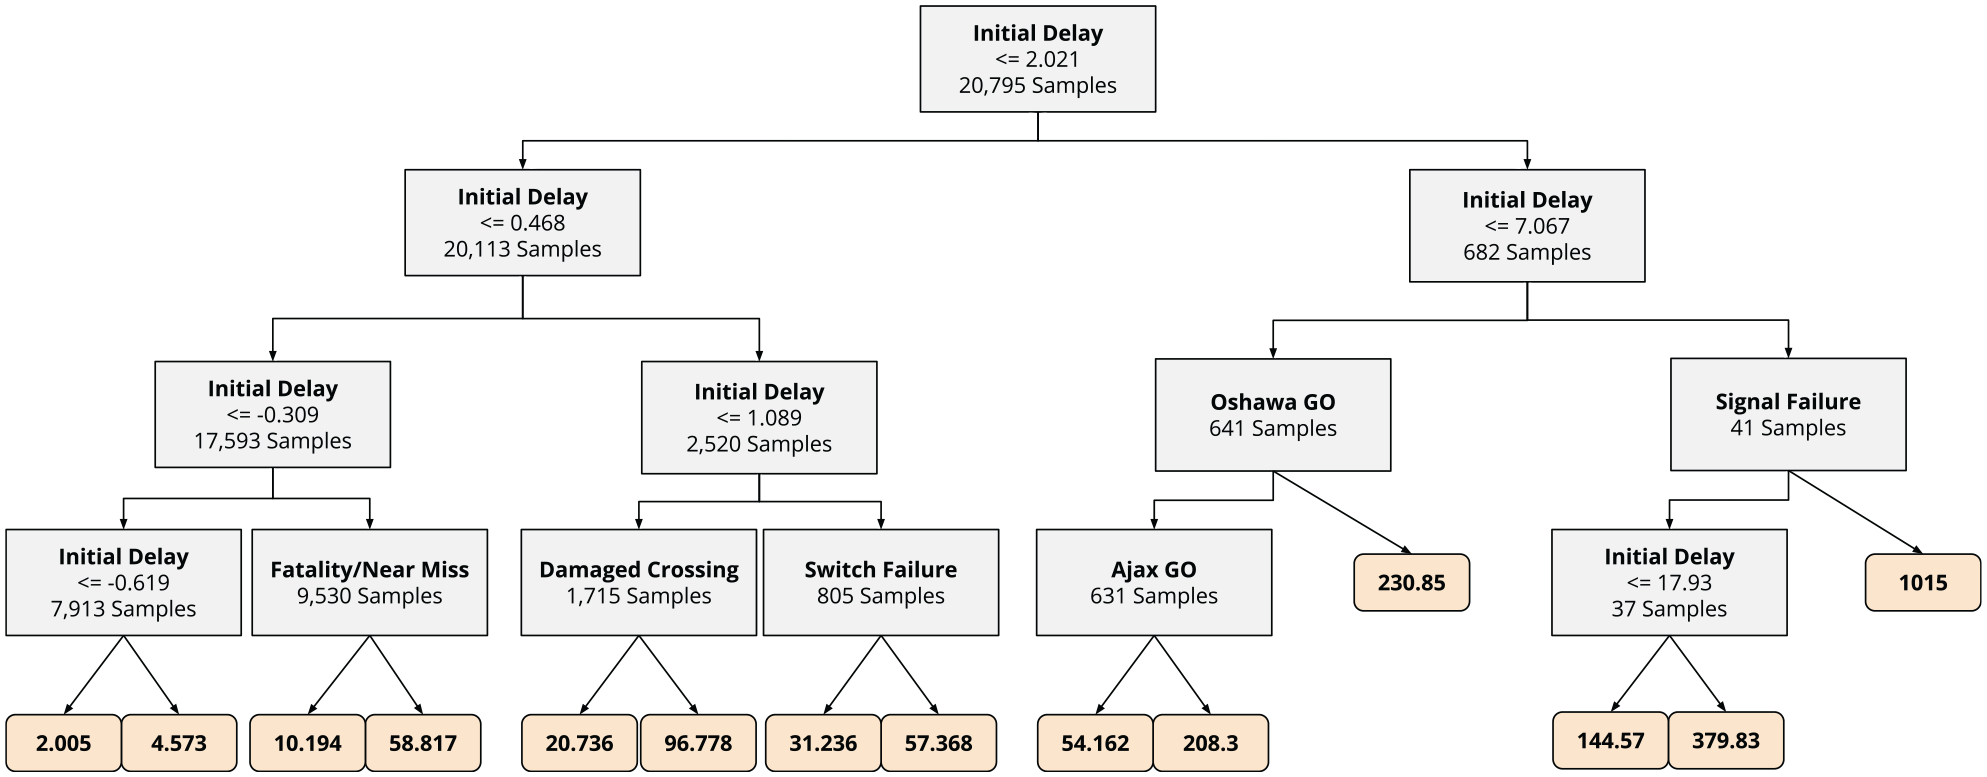
One of the 5,000 decision trees in the random forest regression model.
Elastic Net Regression
The elastic net regression model was tuned using a 10-fold cross-validation across a wide range of possible
The resulting fit had an intercept of 12.19 min, with 20 negative coefficients, 36 positive coefficients, and 152 features that were removed during the fitting process. Figure 10 shows the 10 features with the most positive coefficients. Note that the numeric inputs of initial delay, hour, and temperature were normalized to have a mean of zero and a unit standard deviation; coefficients for these values are not directly comparable with those associated with binary location and delay topic values. For comparison, the most negative coefficients were crew scheduling issues (−4.40), priority given to other trains (−3.99), delays crossing the Welland Canal seaway (−3.88), and passenger boarding and alighting delays (−3.10).
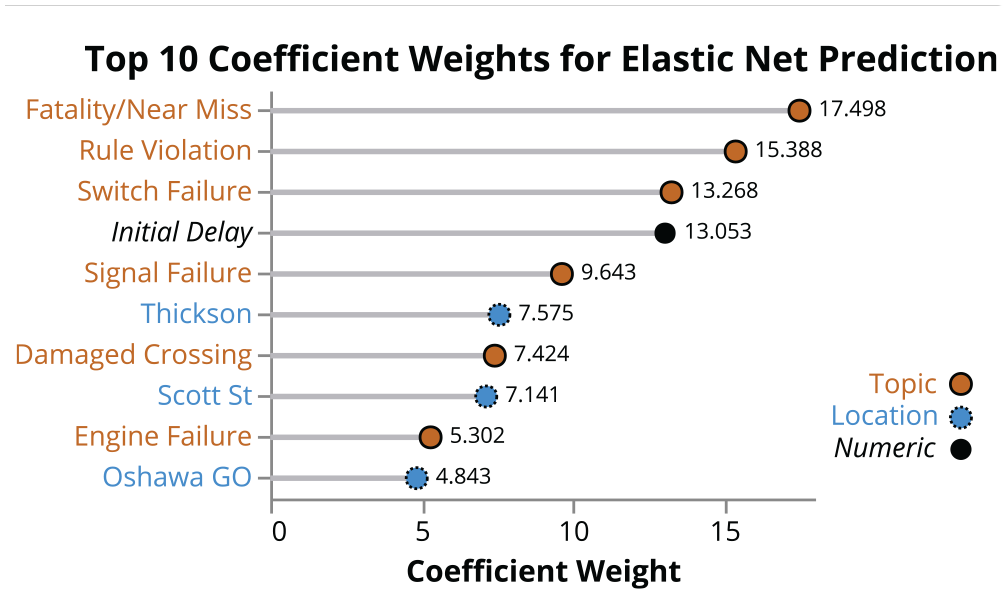
Elastic net feature importance (top 10).
The model identified the largest delay impacts as near miss and fatality incidents, rule (safety) violations, and switch failures, closely matching topics that make up the themes plotted in Figure 11. Taken in combination with the results from the random forest regression (Figure 8), it can be surmised that signal failures, rule violations, and fatalities or near misses cause the greatest multi-incident disruptions and delays, likely because of their initial duration and the resulting knock-on effects of impassable track.
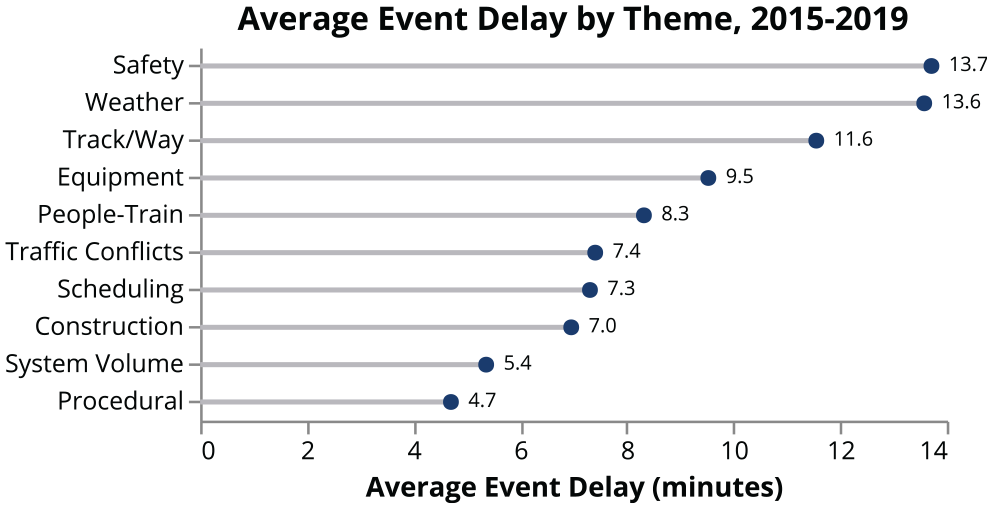
Average delay per event.
Prediction Using Cosine Similarity
The total incident delays of the top
Conclusion
We have introduced a series of data analysis and machine learning techniques that can be used to leverage delay log data collected by railroads to gain insights into their systems, and support delay response by providing historical context and making predictions about larger incident delay from emerging event information. These methods can be applied to a typical set of railway delay logs to learn about how the system functions and to boost institutional memory by providing historical context that may not always be available to a railway dispatcher otherwise. We validated these methods by applying them to a set of delay log data on the GO Rail network in the Greater Golden Horseshoe area of Ontario, Canada.
The methods presented here have some limitations. Although the propagation of delays are captured in the data through connected events, knock-on and network-structure effects are not explicitly captured and modeled by our methods. Future work includes expanding the analysis to include the structure of the network and accommodating the movement of trains from one branch of the network to the other. This work may also be extended by developing branch- or link-level models to provide greater detail and accuracy at specific locations in the rail network. Further investigation on the variance of the modeled delays would also provide dispatchers with a confidence interval, allowing them to make more nuanced decisions based on the model outputs.
With additional data on infrequent incidents, it may be possible to develop prediction models for each topic or theme individually. Many of the longer-delay incidents occur infrequently, necessitating larger data sets that span a larger time frame than the data used in this study. Longer time frames (including the one used in this study) can introduce other challenges, including the need to account for technological, infrastructure, and policy changes that may affect the frequency and duration of delays over time.
Topic modeling can be extended to blend a mixture of rule-based analysis and machine learning methods to look for specific insights as suggested by Noursalehi et al. ( 18 ). This topic modeling could also be extended to examine specific temporal patterns over longer periods of time including seasonal variations in delays at specific locations.
Providing dispatchers and rail planners with the ability to harness their delay log data to improve decision making can lead to better and more confident responses to delay incidents, and clearer communication to passengers about the potential impacts of delays. Improving incident response and minimizing variability in delays is critical to supporting increased capacity, and for establishing trust in the system to attract passengers.
Footnotes
Acknowledgements
Data were generously provided by Metrolinx, and the authors would like to thank Taras Romancyshyn, Kenny Ling, and Patrick Queck for their assistance in providing context and support in the data analysis. We would also like to thank Jess Howell and Steven Flisfeder at the Meteorological Service of Canada for their assistance in accessing historical climate data.
Author Contributions
The authors confirm contribution to the paper as follows: study conception and design: W. Klumpenhouwer, A. Shalaby; data collection: W. Klumpenhouwer; analysis and interpretation of results: W. Klumpenhouwer; draft manuscript preparation: W. Klumpenhouwer. All authors reviewed the results and approved the final version of the manuscript.
Declaration of Conflicting Interests
The author(s) declared no potential conflicts of interest with respect to the research, authorship, and/or publication of this article.
Funding
The author(s) disclosed receipt of the following financial support for the research, authorship, and/or publication of this article: This work was supported by the National Science and Engineering Research Council of Canada (PDF-545762-2020).