
Abstract
The COVID-19 pandemic has caused unprecedented difficulties keeping passenger transport running while social distancing has constrained pedestrian movement. To support railway operation an agent-based simulation validated against UK mainline railway station CCTV footage has been developed. The simulation quantifies train alighting- and boarding flow times for different degrees of distancing, rolling stock types, platform size, and passenger numbers. Real-world social distancing behavior was represented, including compromises people make on distancing to achieve their goals. Flow times modeled and those measured from CCTV were within 10%. Relative to a baseline without social distancing, 1-m distancing was predicted to make only a marginal difference to passenger flow times, primarily because of passenger behavior to compromise on distancing at the rate determining door location. For 2-m social distancing, significantly extended passenger alighting and boarding flow times were predicted for busier services (i.e., 2.2 to 2.8 times baseline depending on rolling stock type). These increases in flow time are only predicted to begin when the combined total of boarding and alighting passengers exceeds 10 to 15 per door. The model has applications in transport systems worldwide in avoiding unmaintainable timetables, and in reducing incentives for social distancing compromise when distancing forms a component of suppressing virus transmission.
Keywords
The global COVID-19 pandemic has caused unprecedented issues in keeping passenger transport running while the necessity of social distancing between passengers has constrained pedestrian movement and stay-at-home orders have caused abnormal fluctuations in the number of passengers using the railways. Preliminary assessment using agent-based modeling ( 1 ) indicated that passenger flow rates at the train doors (the platform–train interface [PTI]) and at ticket gates would be restricted leading to longer train dwell times in stations, or conversely these would be locations with significant incentives for passengers to compromise on social distancing. Although a reduction in demand and reduced network congestion have allowed some extended dwells in stations without knock-on impacts during the pandemic, a return to prepandemic service density would leave little network capacity to accommodate extended flow times resulting from social distancing. To support operational planning to mitigate for these situations research has been undertaken to refine and validate an agent-based passenger movement microsimulation tailored to these highly constrained geometries within railway stations. The research is of relevance to locations making use of social distancing, but also for future preparedness, and to understand the effect of the continuation of distancing by vulnerable or cautious people even when it is no longer mandated. Although not viable as a long-term measure, a better understanding of social distancing’s impact on transport operation remains useful as it is immediately deployable under current or any future airborne pandemic conditions. Moreover, the understanding developed has value in understanding “natural social distancing,” which exists outside the pandemic under all but the most crowded conditions. The work has been developed from earlier (prepandemic) modeling of railway passenger flows ( 2 ) and has been validated against passenger observations for a range of station footfall during the pandemic. The validation was conducted using closed circuit television (CCTV) observation to avoid any influence on passenger behavior, and demonstrated good correlation of predicted and measured flow times for passengers boarding and alighting at the PTI. During the period CCTV footage was collected, the prevailing government guidance was the “1 m +” rule. During this time the desired social distancing was 2 m; however, this could be reduced to 1 m with other mitigations in place, for example, face coverings ( 3 ). Results are presented here for a range of passenger loadings to provide insights into maintaining and recovering urban transport operations and have been shared with industry stakeholders through the Railway Safety and Standards Board ( 4 ). They have application, alongside models of airflow in transport ( 5 ) and epidemiological models of virus transmission (6–11).
Train Dwell and its Relationship to Passenger Flow
The components of time spent by a train, in a station, are illustrated schematically in Figure 1. For most modern rolling stock, the doors are centrally controlled such that they are not released for passenger use until the train has completely stopped. Doors then take time to open, and it is only after this that the flow of passengers on or off the train can take place. Similarly, before departure the train dispatch process must validate that the doors are closed, that nothing is trapped, and that the train is safe to start ( 12 ). Train movement may then be dependent on signals, so can begin sometime after the last passenger flow. The model developed represents only the passenger flow, since this is the element most susceptible to change through social distancing between passengers. When conducting validation, it was therefore important to focus on actual people movement, not on timetables or other information about the train itself.
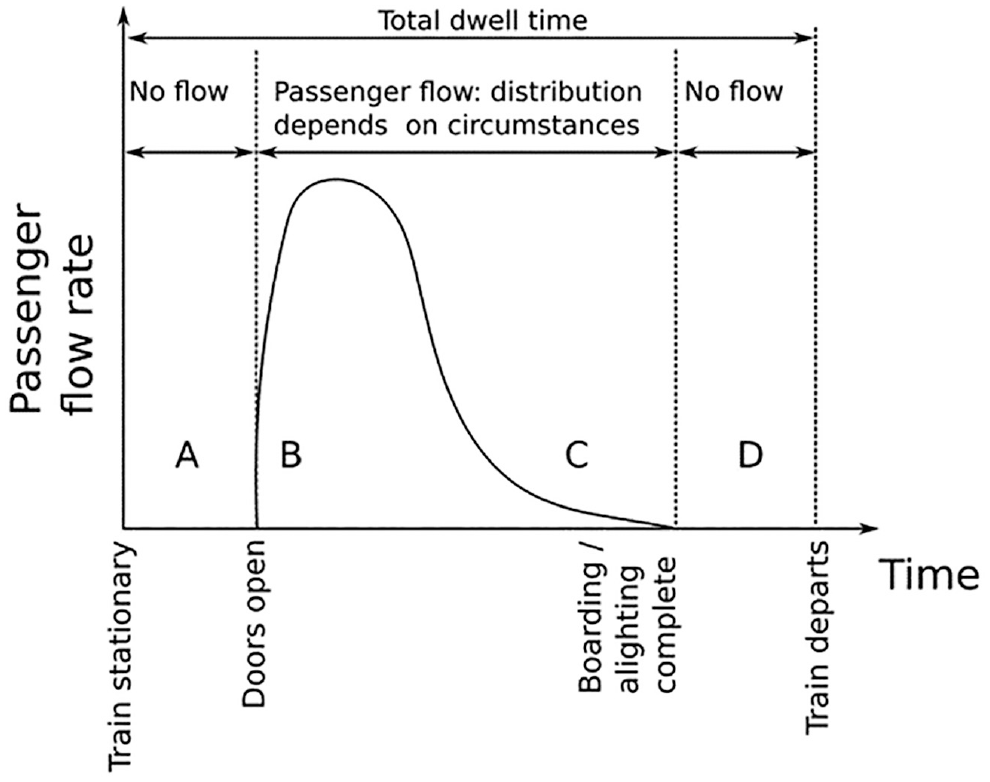
Typical variation of passenger flow and its relationship to dwell of the train in the station. For a typical platform dwell time, A is around 5 to 15 s, and D is around 15 to 30 s. The components B and C are largely set by timetabling, notwithstanding any delays resulting from boarding and alighting, and would be expected to be around 2 to 3 min for long-distance services and around 15 to 30 s for suburban services such as Merseyrail. Special cases, such as trains at the start of a journey where boarding may be allowed, for example 10 min before departure, are not considered here.
Factors to be Explored
Prepandemic application of the agent-based model extended in this research ( 2 ) focused on the design of train interior layouts to maximize boarding and alighting flows. This was achieved by placing the model within a genetic algorithm to programmatically explore the search space of variables (door size, vestibule size, aisle width, seating configurations) with a cost function defined to enable optimization of flow time. The step height/gap between the platform and train was in this case represented as a region of slow movement rather than a technical feature, and validation showed good agreement with observations at a range of stations. Passenger behaviors during boarding and alighting are also considered in research by Zhang et al. ( 13 ), in which agents are given personal characteristics determining their speed of movement, however, the collective behavior of multiple passengers, such as the distribution of passengers across platforms, was not explored. Other factors affecting the PTI, such as door width, step height, and platform–train gap have been considered in previous modeling and experimental studies on passenger flow (14–17). However, the effect of a change in passenger behavior, such as the requirement for passengers to socially distance, was not considered as these studies predate the pandemic. The assessment of passenger boarding at the PTI highlights that concentrations of passengers occur when a train arrives at a platform because of the locations of the train doors ( 18 , 19 ). Also conducted prepandemic, research has identified that influencing passenger behavior during boarding and alighting is a cost-effective method of improving passenger flow at the PTI ( 20 ). With such a range of variables affecting flow at the PTI, it was necessary to restrict the scope of those considered in this research on the impact of social distancing. Within a train, the scope for distancing is limited and the enclosed nature of the space makes airflow modeling an important factor. Station platforms typically offer more space and greater natural ventilation, making distancing a relevant method to restrict virus transmission, so our focus was the station platform including the interaction of alighting and boarding passengers. Modeling of movement inside the train was restricted to that needed to represent interactions at the door, that is, the approach of alighting passengers to the door, transition from alighting to boarding, and movement of boarding passengers sufficiently inside the train that they did not artificially block the door for following boarders. Previous work ( 2 ) has identified door size as a crucial factor in determining passenger flow rate, so two train types with different door sizes were considered. Variation between agents was considered only in their social distancing behavior, whereas mobility (unimpeded speed of movement of 1.3 m/s [ 21 ]) was uniform across the agents. The effect of luggage and group travel was not considered here and is the subject of a separate project.
Modeling Methodology
The movement of pedestrians through a space can be explored using either macroscopic or microscopic modeling. Macroscopic modeling allows for a focus on crowds and high-density pedestrian groups ( 22 ) and tends to be less computationally expensive. Microscopic modeling of pedestrian movement is used when the behaviors of each individual agent are of interest, especially in confined geometries, allowing for agent heterogeneity and quantification of the effects of each individual agent (e.g., traversal speed, travel time) on the population ( 23 ). For the identification of passenger behaviors at the PTI, it was necessary to capture individual behaviors in areas of confined geometry such as at doors and ticket barriers; thus, microscopic modeling was the preferred modeling approach in this work.
Within the context of microscopic modeling, there are a number of potential simulation methods for studying pedestrian movement. These differ based on the discretization of space and time and therefore vary in their accuracy of resolving spatial interactions such as collisions. Approaches to microscopic pedestrian modeling include the following:
Cellular automaton: Discretization of the modeled space through which agents move. In this cellular automaton approach ( 24 ), the agents move between locations of the grid according to specified modeling criteria, however this approach can have poor translation to real-world pedestrian behaviors and fails to represent important spatial relationships and interactions that result in complex emerging behavior.
Social forces: Approximation of each agent as a point particle subject to “forces” resulting from other agents in the modeled space in a social forces model. The forces each agent imparts on other agents are related by the distance between agents; for example, as people move closer together, a repulsive force between interacting people occurs, altering the subsequent pedestrian trajectories. This method provides a necessary mechanism to capture spatial interactions but can result in numerically unstable scenarios within dense crowds (e.g., unrealistic overlapping of pedestrian geometries). Reduction of the time step can alleviate such problems at the expense of overall simulation cost.
Reciprocal velocity obstacle (RVO) models: Agents steer toward a goal while aiming to avoid collisions with other agents in the space, achieving this in a time-discretized simulation at which each agent reviews its neighbors’ position and velocity at each time step. Agents aim to predict where other agents are moving toward and alter their velocities accordingly. The RVO model can be extended using the optimal reciprocal collision avoidance model ( 25 ), whereby the agent velocities are calculated and solved using a linear program solver. The approach is both appropriate for modeling spatial interaction and numerically stable. This model was adopted in the current work and described at high level by the pseudo-code Algorithm 1.
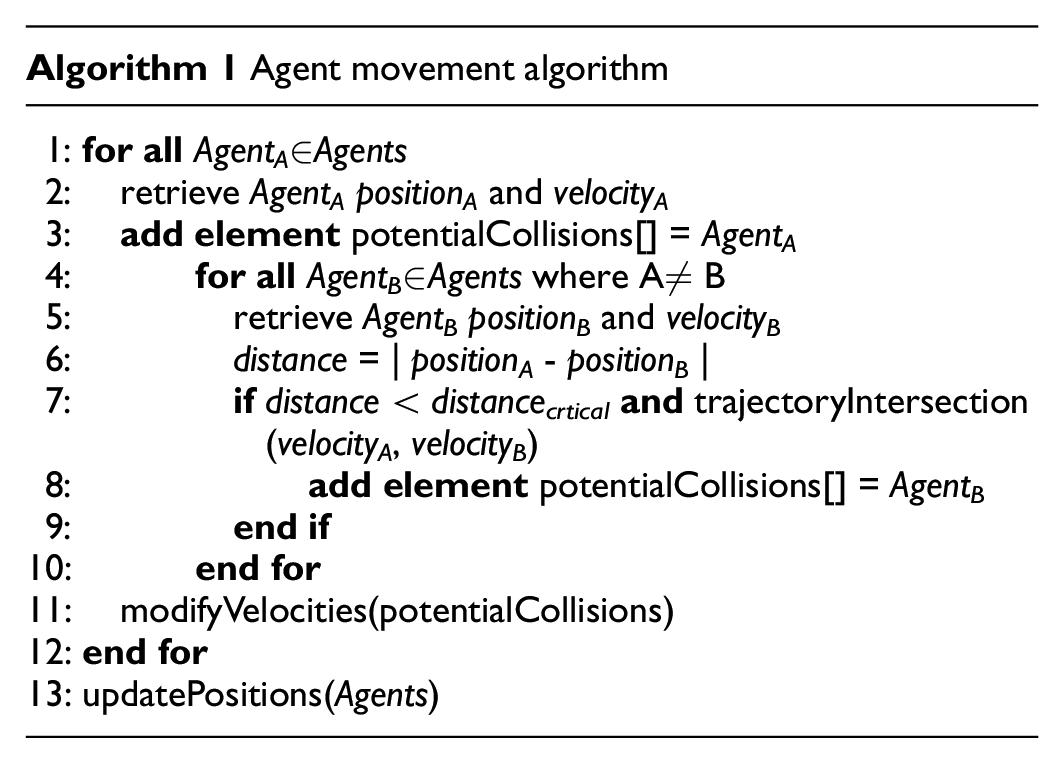
Algorithm 1: For an agent,
Extensions for Real-World Social Distancing
Initial modeling of social distancing behavior ( 1 , 26 ) was refined as observations were undertaken in UK passenger stations, showing how social distancing was maintained and the ways in which it was compromised. Each agent was represented with a core radius of 0.2 m, defining the physical size of the passenger and a social distancing radius representing the surrounding (intended) social distancing space. Where no compromise of social distances occurred, no other agents would enter this outer circle, but it did not restrict agents passing next to structures such as boundary walls or the walls of the train. This region of social distancing between passengers is indicated by a black “skirt” around an agent as can be seen in Figure 2, which shows a semi-plan view of a three-coach train in the lower part of the image, adjacent to a platform with boarding passengers in the upper part of the image. The modeling and visualization of pedestrian movements was performed using a custom configuration of the Steersuite package ( 2 , 27 ), developed to evaluate pedestrian behaviors (see additional data accompanying the paper for the code).
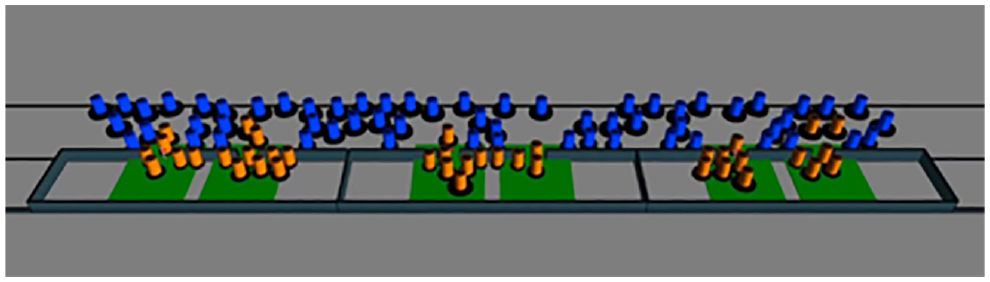
Semiplan view of a three-coach train (front), adjacent to a platform with boarding passengers (blue), and alighting passengers (yellow). Vestibule areas are indicated in green.
In periods when passengers were instructed by government and transport authorities to maintain social distancing to reduce disease transmission, observations of passenger behavior from collected CCTV footage indicated that the actual maintenance of distancing was situation dependent. Before a train arrived at a platform social distancing was typically maintained when there was available space to do so, however, as the train arrived and during passenger boarding social distancing was greatly compromised. This was typically not the result of an individual passenger disregarding distancing, but a behavior across most passengers. Potentially this was driven by knowledge of historically limited dwell times or a desire to reach a “good” location within the train, but the remote CCTV-based observation conducted could not reveal the underlying reason. No data (e.g., screenshots of CCTV or passenger-identifying features) were carried forward from the CCTV to comply with UK General Data Protection Regulations ( 28 ). This behavior was observed even in cases in which there was plenty of time available for more orderly boarding. This aspect of compromise on social distancing is demonstrated by the schematic given in Figure 3.
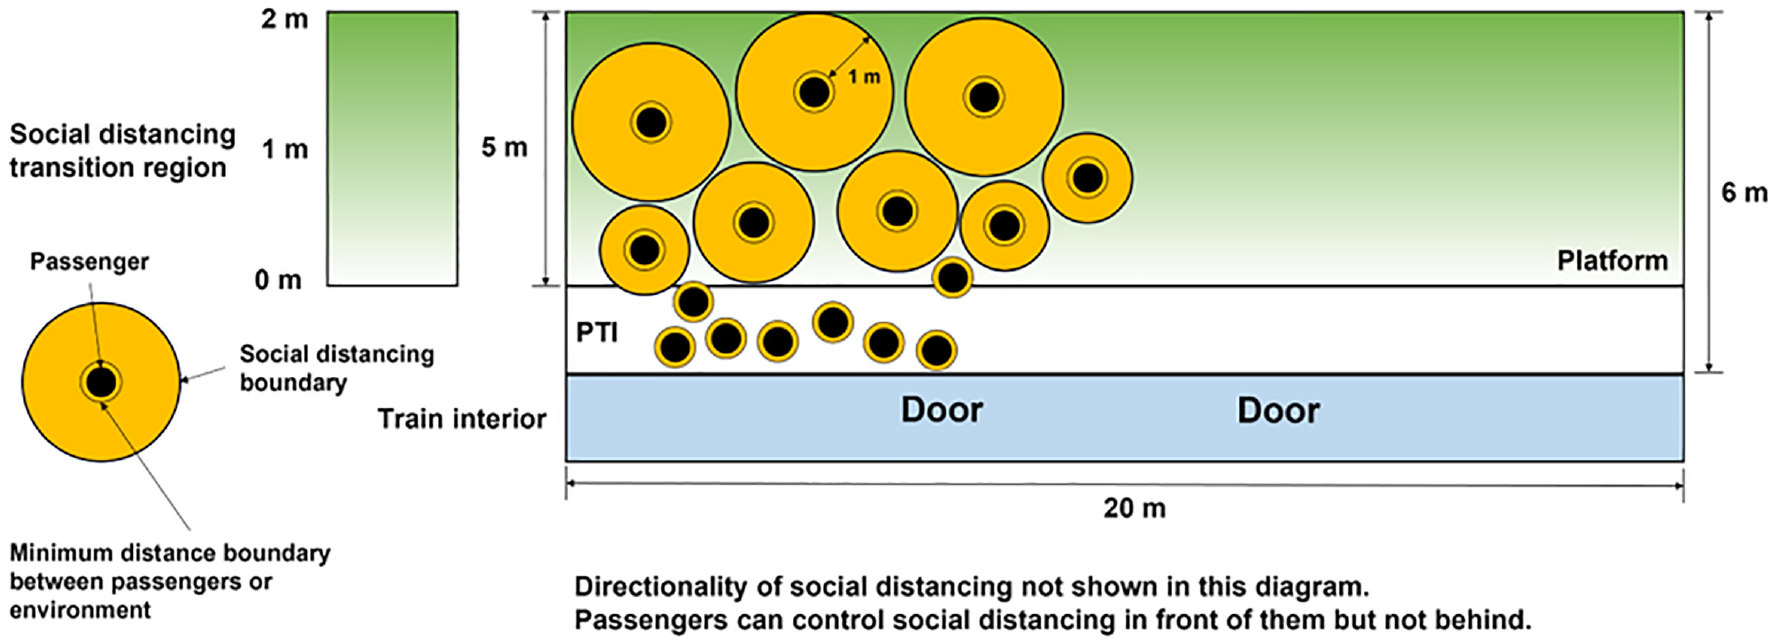
(Not to scale) Plan view schematic of passenger behavior on the platform demonstrating the decreasing distance between agents as they move toward a suburban train door.
CCTV observation also highlighted that passengers did not have full control over distancing, as it is the outcome of reciprocal interactions with other people. Passengers can typically control the distancing between themselves and obstacles in front of them as these are the potential collisions they can see. However, they have little knowledge or control over the distancing behind them. To represent this, we applied the concept of “vision” to the agents. In the case of boarding or alighting a train it was assumed that each agent faced their nearest door, and they were limited to “seeing” only in a forward direction. This resulted in people closer to the door entrance not accounting for the individuals behind them, and similarly people further from the doors taking greater responsibility for steering around those closer to the doors. This capability becomes more valuable when the agents must make decisions at the transition from alighting to boarding behavior during the dwell of the train in the station.
PTI: Transition From Alighting to Boarding
Previous observation on mainline UK rail has shown that, in most cases, passengers wishing to board will wait on the platform in an orderly manner until most passengers wishing to alight have done so, even if the doors are wide enough to facilitate bidirectional flow ( 2 ). Realistic representation of this transfer between boarding and alighting passengers was therefore crucial in the prediction of total flow time. To represent the behavior, an area of the train vestibule was defined that boarding agents could “see” from outside the train, taking account of door size (shown in green in Figure 2). If this area of the vestibule area was clear, a passenger waiting to board would begin to board the train, even if there were other people “hidden” inside the train wishing to alight. However, if the vestibule was not clear of alighting passengers, boarding passengers would continue to wait on the platform. This better represented real passenger behavior than if boarders had to wait until all alighting passengers had left the train. Additional influences on the passenger flow include variation of unhindered walking speeds, individual passenger mobility, behavior of passengers traveling as a group, and the effect on movement of carrying luggage. Luggage and group behavior are the subject of ongoing observation to support modeling their impact on passenger flow, with the research reported here restricted to the impact of social distancing.
Using output from the model, passenger behaviors were quantified, the primary metric being the total flow time for all passengers in the simulation to complete alighting and boarding. The flow time was calculated from the time the train doors opened and passengers began to move, and ended when all boarding passengers had moved 2 m into the train and alighting passengers had reached a goal location at least two-thirds along the depth of the platform (i.e., 2 or 4 m for the 3- and 6-m platform widths respectively). The locations of each agent during the simulations can be visualized to observe agent trajectories and speeds, and to enable time-proximity metrics to be calculated. These metrics are the subject of further development to better understand how representative of risk they may be.
Modeling Runs Undertaken
To quantify the effect of social distancing on the passenger flow the following cases were investigated:
Passengers with no social distancing, representing prepandemic behavior;
Natural distancing between passengers (0.75 m);
Two levels of passenger social distancing (1 and 2 m); and
Varying the region over which passenger social distancing is compromised in the approach to the train.
Two rolling stock types were considered, which are representative of most UK rolling stock that would typically be allocated to a route according to stopping patterns and journey length. The stock types used were
Suburban: Designed for high people flows at the doors and shorter journeys, based on British Rail Class 507/508 rolling stock. These carriages are 20 m in length with doors of width 1.3 m, located one-third and two-thirds along the carriage length.
Intercity: Designed for lower people flow at the doors and longer intervals between stops, based on British Rail Class 390 rolling stock. These carriages are 24 m long with doors 0.95 m wide, placed 2 and 22 m along the length, close to the ends of the carriage.
Platform widths of 3 and 6 m were considered, encompassing those found in a range of UK stations. At each train door, between 2 and 25 passengers for both boarding and alighting were considered. This gave between 4 and 50 agents interacting at each train door. These passenger levels reflected the demand during various times of the day, for example, peak commuter behavior was captured by 50 interacting agents per door, and off-peak travel behavior was captured by four interacting agents per door. For each parameter set, 10 simulations were performed with randomized initial seeding location of agents on the platform and within the train, and the flow times were averaged to account for the seeding of individual agents in each simulation run.
Validation of the Modeling Predictions
Validation of the agent-based model was performed by comparing predicted flow times with the measured flow times observed from CCTV data, summarized in Tables 1–3. Data collection was conducted using preexisting station CCTV systems and received clearance under the remit for their use in ensuring the safety and well-being of railway customers and employees. No identifying or personal information relating to passengers or railway staff was taken into the analysis. Three locations were used for this: Birmingham New Street, Leeds, and London Bridge stations. Data from Birmingham New Street was collected on the 12 October, 2020; Leeds footage was obtained on 26 September, 2020, and on 12 March and 26 May, 2021; and footage from London Bridge was obtained on the 4 May, 2021. The CCTV footage was analyzed by visual inspection, recording the number of passengers boarding and alighting at the PTI and the flow time, which started when the first passenger alighted from the train and ended when the last passenger had boarded. Specific behaviors in relation to the level of social distancing each passenger attempted to maintain were not recorded, nor did the modeling attempt to recreate any specific observed behaviors. The aim was to model the aggregate behavior of a group of passengers at the PTI to represent the real-world situation for passengers attempting to socially distance.
Data From CCTV Observation of Passenger Volumes and Flow Times for Leeds Station, Cases 1 to 8. Each of the Train Dwells Observed in the CCTV Footage is Labeled With a Case Number, 1 to 8, for Reference in the Text
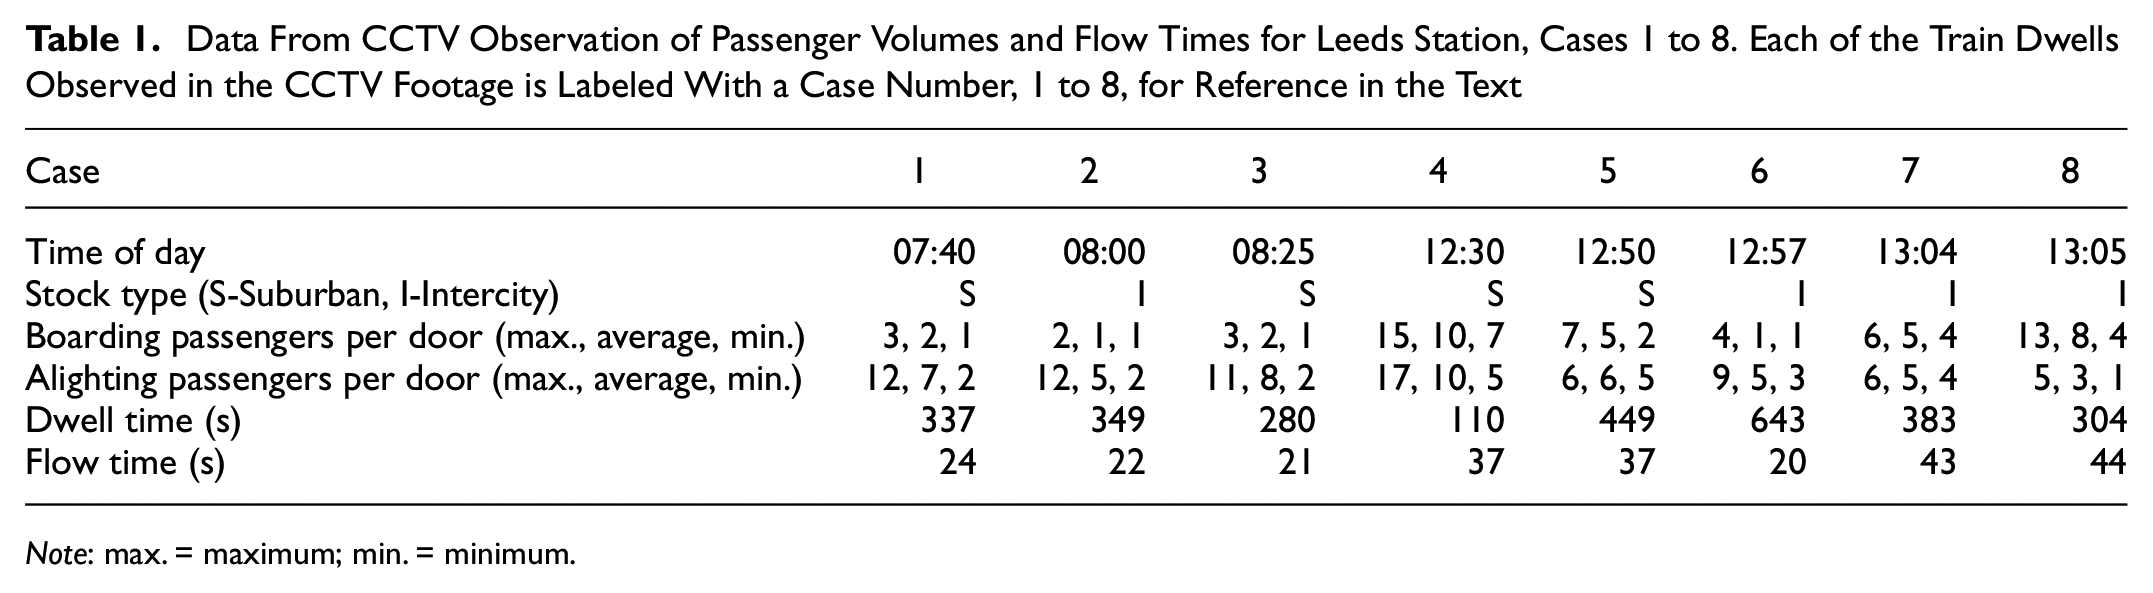
Note: max. = maximum; min. = minimum.
Data From CCTV Observations of Passenger Volumes and Flow Times for Leeds Station, Cases 9 to 17. Each of the Train Dwells Observed in the CCTV Footage is Labeled With a Case Number, 9 to 17, for Reference in the Text
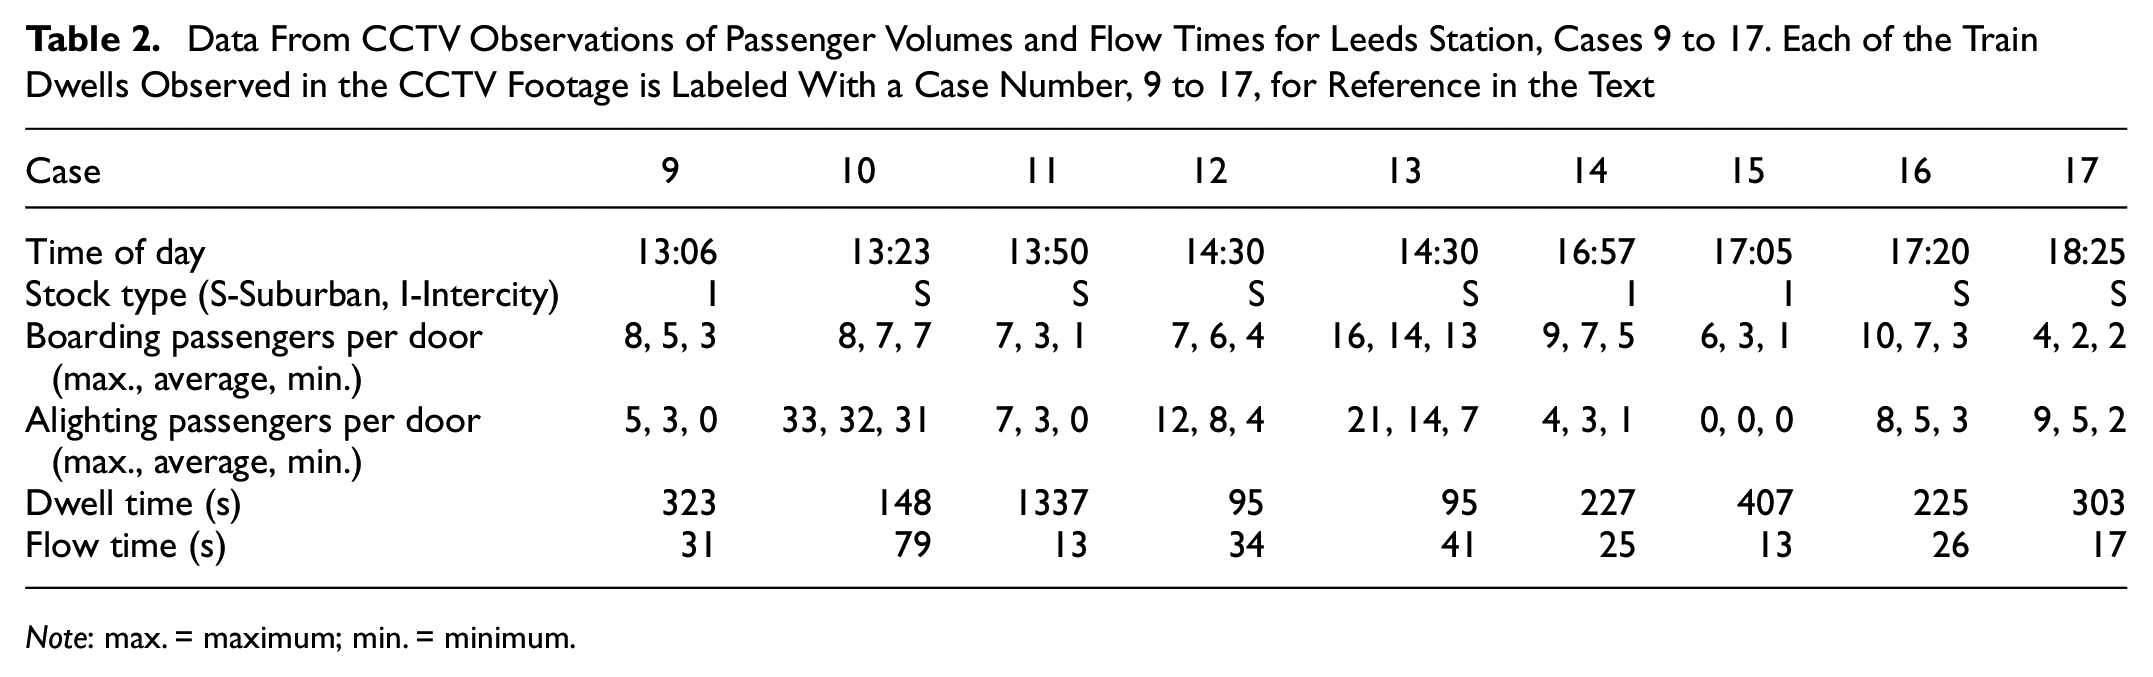
Note: max. = maximum; min. = minimum.
Data From CCTV Observations of Passenger Volumes and Flow Times for Birmingham New Street and London Bridge Station Cases. Each of the Train Dwells Observed in the CCTV Footage is Labeled With a Case Number, 18 to 25, for Reference in the Text
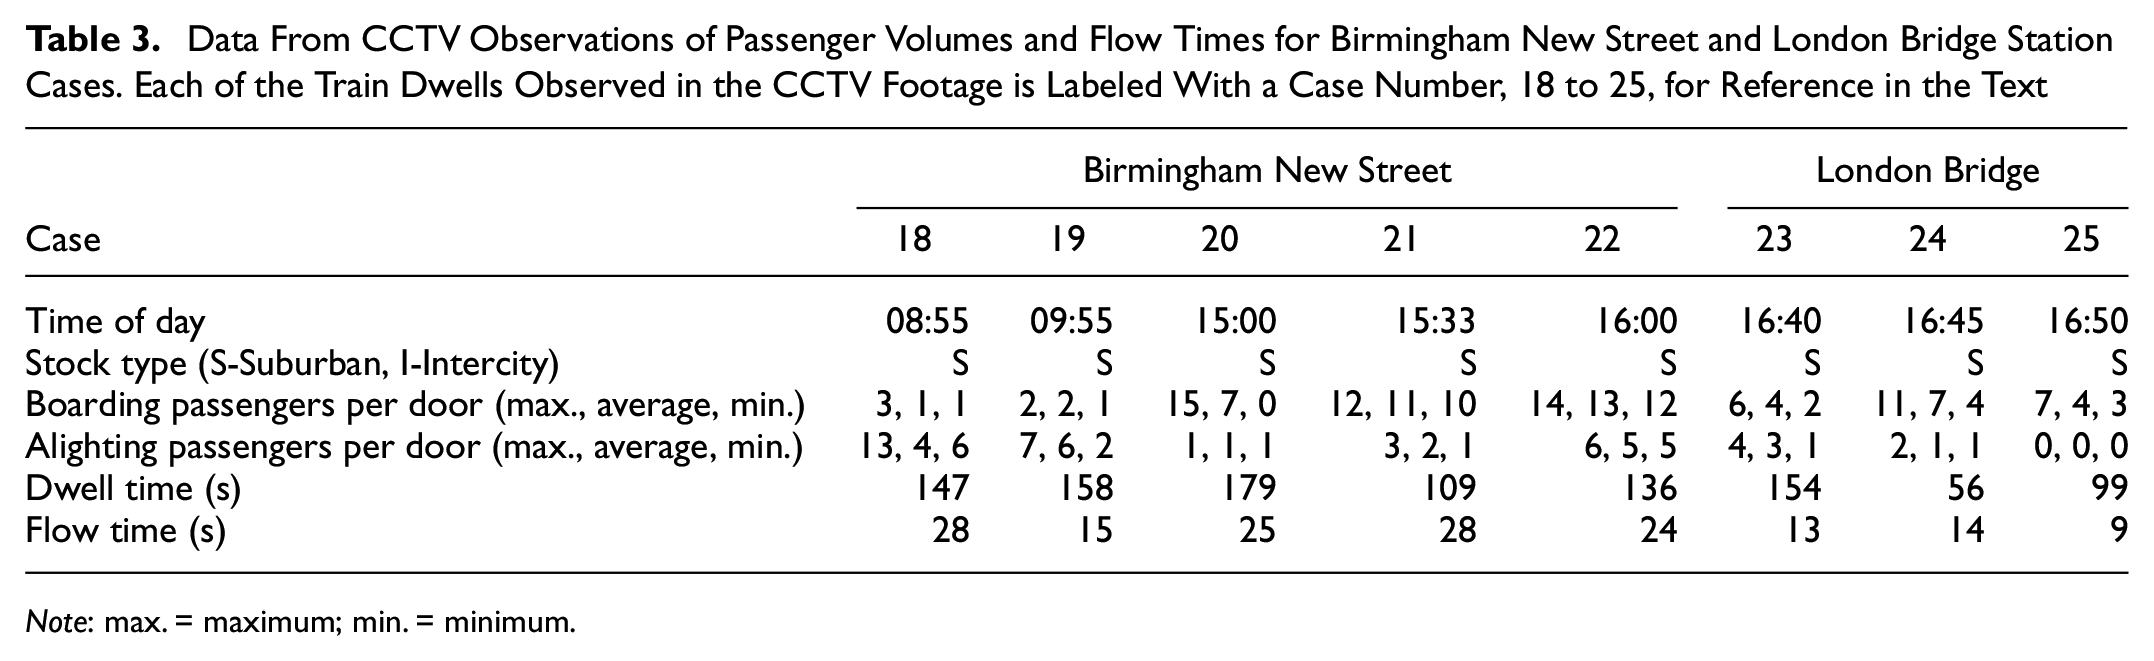
Note: max. = maximum; min. = minimum.
The train stock was also recorded and grouped into either suburban or intercity stock types based on the location of the train doors. For trains with long dwell times that allow for passenger boarding over a prolonged period, only the initial passenger transfer was considered where interaction between boarding and alighting passengers was observed. To avoid artificially inflating flow times, individual passengers arriving late after the main flow period were discounted as arbitrary late arriving passengers are outside the scope of the modeling.
The comparison between the predicted and measured passenger flow times for each of the cases given in the above tables is shown in Figure 4. Good agreement was observed between the predicted and measured flow times, with the largest difference occurring in Case 7. For this case, the larger flow time observed in the CCTV, compared with the modeling output, was the result of four passengers alighting with bicycles. Passengers were also alighting from the adjacent door, so boarding passengers could not bypass the blockage by choosing to board through an alternate route, and thus queued at the original door.
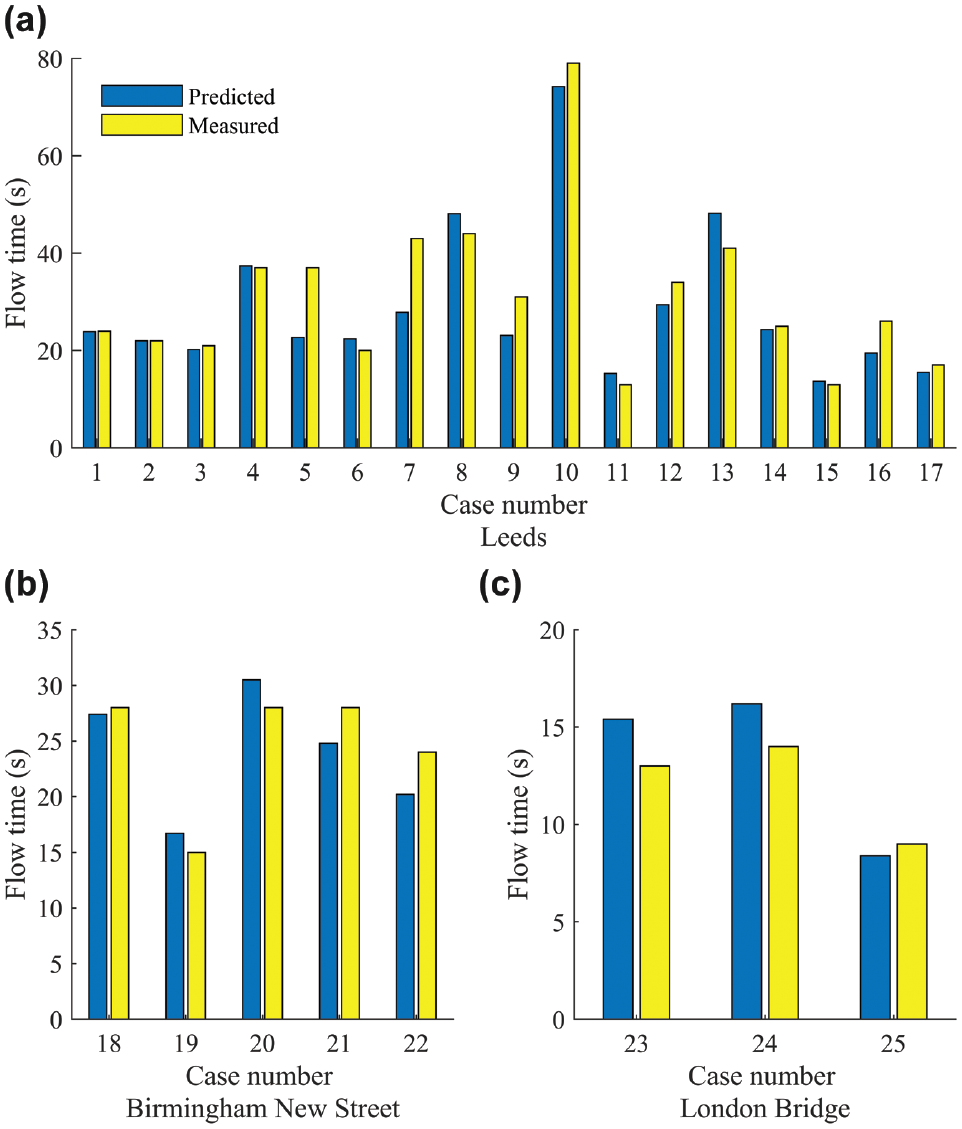
The model predictions were not systematically high or low and the root mean square average gave a variation between the measured and predicted flow times of approximately 1.5 s. Considering only the absolute differences in the flow times, this variation was approximately 3.6 s, and discounting the outlier discussed above, this variation reduced to 2.4 s. When large numbers of passengers were boarding, such as in Case 10 in which an average of 32 passengers boarded per door, the model predictions maintained good agreement with the real flow times. The model prediction in this case was approximately 5 s less than the real time, representing only a 6% variation between the two flow times. Similar variations were present in the other flow times.
Figure 5 shows the correlation of predicted flow times with measured flow times. The dashed line indicates an ideal 1:1 correlation where the model would exactly predict the measured flow times, and the solid line indicates the linear fit to the data. The linear fit was assumed to be of the form
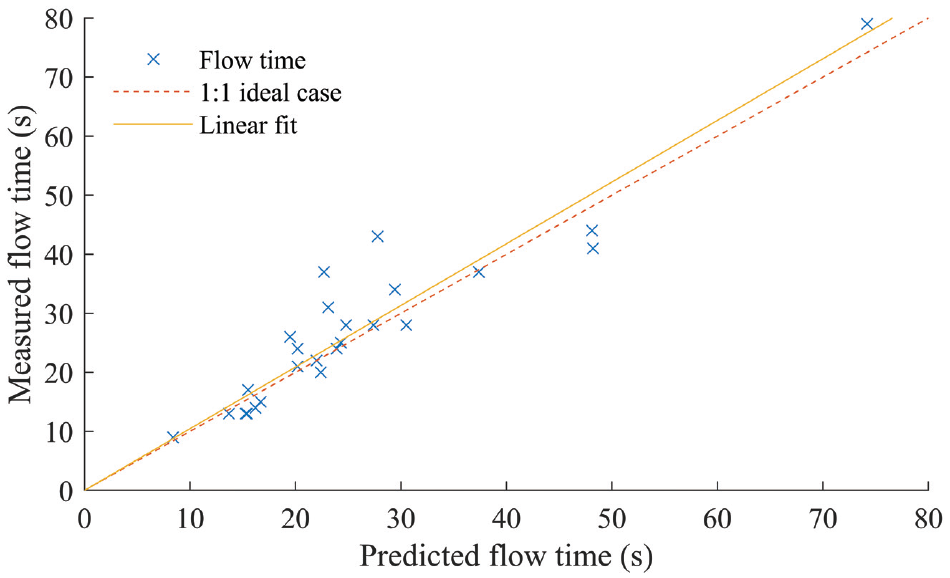
Flow time predictions against measured flow times. The dashed line indicates the ideal case in which modeling perfectly predicts real flow times, and the solid line is the linear fit between simulated and measured data.
Flow Time Predictions and the Effect of Social Distancing
For each of the train stock types and platform widths considered, the predicted flow times for the explored levels of social distancing are shown in Figure 6. Typical flow times for low passenger levels (below 10 passengers boarding and alighting per door), were approximately 20 s for suburban train stock and 25 s for intercity rail stock. As passenger levels increased, the flow times were, as would be expected, predicted to increase, with flow times just under 40 s for intercity rail stock when there was a combined total of 50 passengers boarding and alighting per door. For suburban rail stock, the predicted flow time for the largest passenger volumes was lower than intercity rail stock with maximum flow times around 36 s.
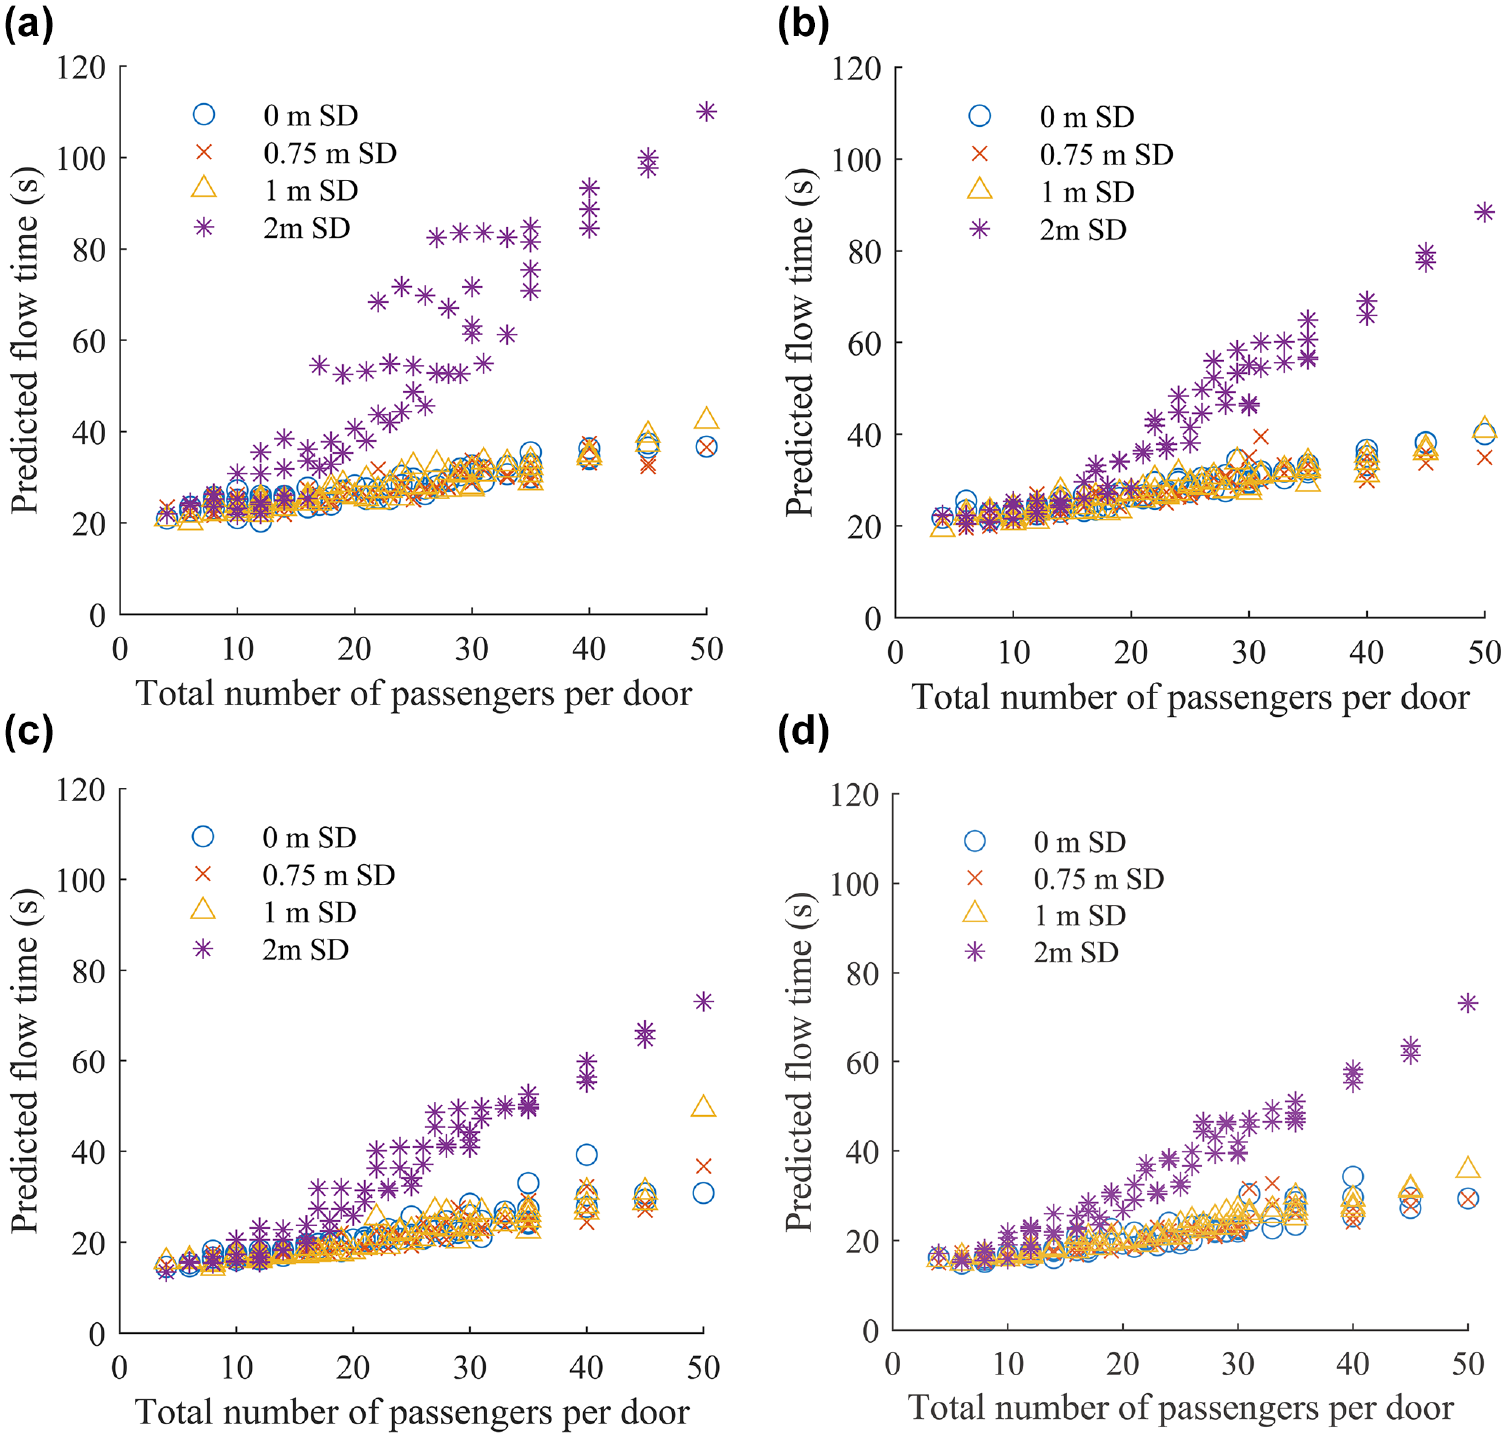
Flow times for intercity train stock for varying levels of social distancing (SD) (0, 0.75, 1, and 2 m) and either (a) an intercity train at a 3-m wide platform, (b) an intercity train at a 6-m wide platform, (c) a suburban train at a 3-m wide platform, and (d) a suburban train at a 6-m wide platform.
Compared with no social distancing, the addition of 1-m social distancing between passengers had only a marginal effect on the predicted flow times. In the 1-m case, there was no significant trend above and beyond the variation between the modeling runs for similar inputs. For each combined total of boarding and alighting passengers under the 1-m social distancing condition, the predicted flow times varied by only approximately 5% to 10% for an intercity train relative to the case without social distancing. The marginal increases were also predicted for a “natural” distancing of 0.75 m between passengers. This indicated that (i) 1-m social distancing was predicted to have little impact on train dwell times relative to the prepandemic situation, and (ii) the multipliers of the flow times predicted were insensitive to the exact mix of boarding and alighting passengers, making this finding robust for real-world application where the proportion of boarders and alighting passengers will vary on different services.
For the intercity rolling stock, the flow time increases were larger for the highest passenger levels, increasing by as much as 50% compared with the case when distancing between passengers was 0 m. Typical increases in the flow time were around 20%, however, with larger increases rare.
The increases in the predicted flow times were typically independent of the train type, with increases for suburban rail stock also marginal. At a 6-m wide platform, the longest flow times were approximately 30 s, and increased by only 2 s with the addition of 1-m social distancing, as shown in Figure 7. For very busy cases on 3-m wide platforms there were slightly greater flow time increases at 1-m social distancing than for the 6-m wide platforms, but for intercity rolling stock the extensions to flow time were in most cases unlikely to be significant to network operation. The influence of platform width is discussed in more depth below.
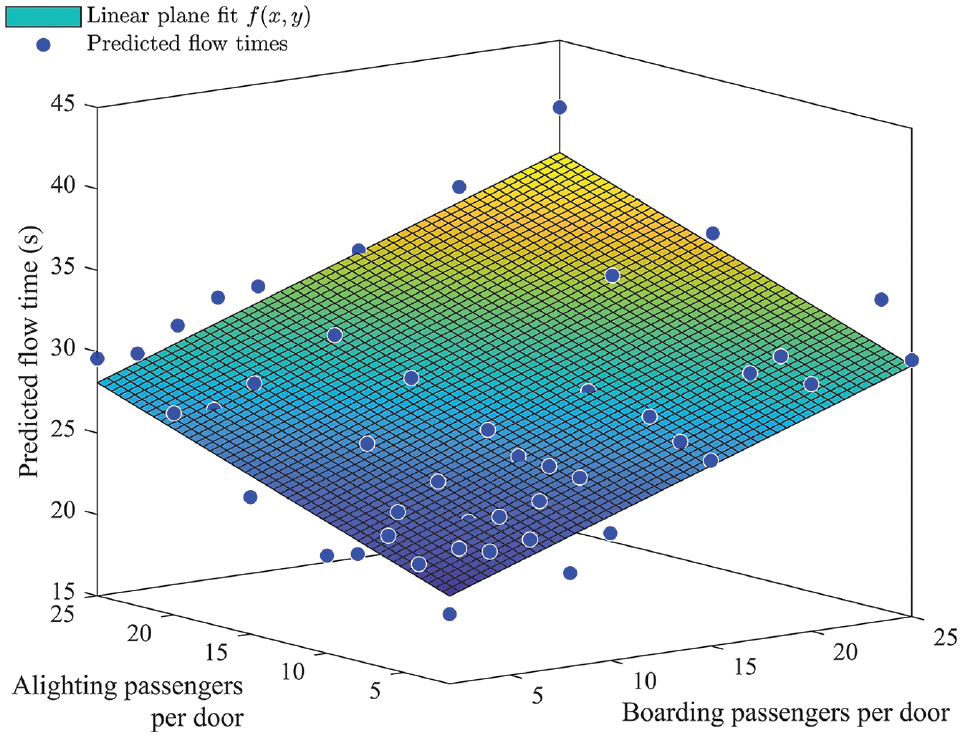
Fitted plane to the predicted flow time data for an intercity train at a 6-m wide platform, when there is an intended level of social distancing of 1 m.
When the level of social distancing was increased to 2 m between passengers, there was a significant increase in the predicted flow times. Compared with no social distancing, flow times may increase by up to 2.8 times for equivalent passenger levels. A passenger flow time extension to this extent would be expected to compromise operation to a standard prepandemic timetable. The passenger levels beyond which flow times extend are dependent on the rolling stock type and platform width, for example, the flow times for intercity stock at a 3-m wide platform began to increase when more than 10 passengers boarded and alighted per door, whereas the extended flow times occurred at approximately 17 passengers per door when the platform width was increased to 6 m.
Suburban rail stock also experienced extended flow times when there was 2-m social distancing between passengers, particularly for higher passenger loads. For low passenger numbers (e.g., 10 to 15 combined boarding and alighting passengers) there was little flow time change from 2-m social distancing. However, a combined total of around 20 passengers was predicted to produce a 40% increase in the flow times, which increased further to approximately 120% compared with the case of no social distancing for the highest passenger numbers considered. The effect of platform width for suburban rolling stock was minimal when there was 2 m of social distancing, with the largest predicted flow times around 65 s in both platform width cases.
From the predicted flow times in Figure 6, a plane was fit to the data according to
Coefficients for Each of the Fitted Planes
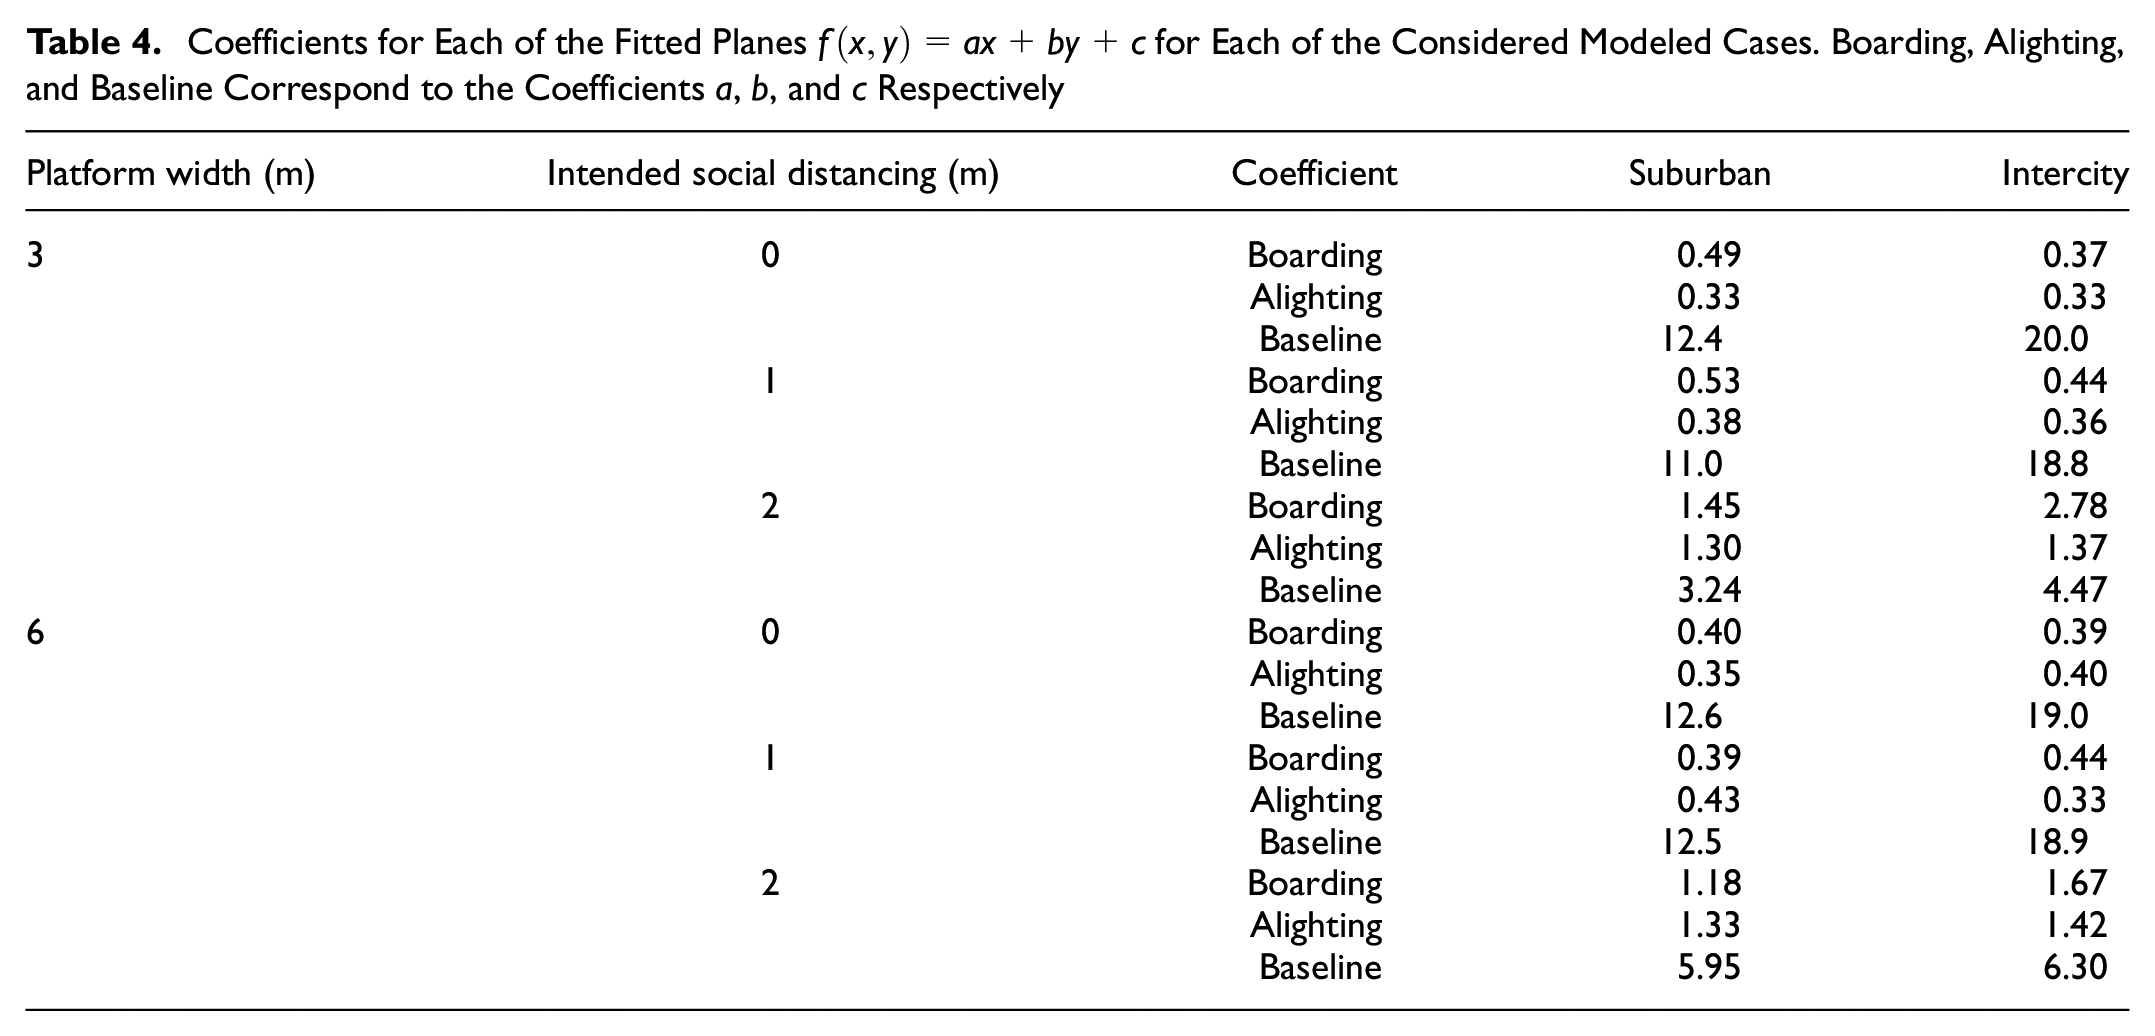
For 0- or 1-m social distancing, whether passengers were boarding or alighting had only a minor effect on the increase of passenger flow times for each extra passenger, with the
The effects of social distancing on flow times observed were predicted for both platform widths, although on the wider platform type, the effect on flow times from the boarding passengers was less pronounced than for equivalent passenger levels: the wider platform relaxed the constraint on passenger movement.
Although the boarding and alighting coefficients were comparable for intercity and suburban trains, intercity flow times grew from a higher baseline compared with suburban trains (owing to smaller doors/longer carriages), and therefore had a typically longer flow time overall. This was indicated by the higher values of the baseline flow time,
Conclusions
This paper presents the results of a study on the effect of differing levels and observances of social distancing on the passenger flow time for boarding and alighting suburban and intercity railway vehicles characteristic of lines in the UK. Predictions were made with agent-based simulations generated using an optimal reciprocal collision avoidance algorithm. Social distancing was implemented such that agents aimed to maintain distance to other agents but without affecting their ability to pass close to platform walls or train bodies. Comparison was made with real-world passenger flow times obtained from observations using CCTV footage and this successfully demonstrated the validity of the simulation outputs for three different UK station locations (Leeds, Birmingham New Street, London Bridge). The validation work encompassed a range of passenger numbers boarding and alighting trains, over a range of times throughout the day, on different rolling stock types. The predicted flow times obtained from the agent-based model showed good agreement, indicating that it predicted passenger behavior at the platform–train interface well. Variation between the predicted and the measured flow time was less than 10%. Crucial to achieving this high level of agreement was representing real-world social distancing in the model, that is, the locations and times at which people typically try to maintain distance, and the situations in which people compromise on distancing to achieve their goals. Observations in the three stations studied showed consistent social distancing compromise at the time of train boarding and particularly when approaching the train doors, even for services in which there was no time pressure to complete boarding. This may be the result of long-term learned behavior that the alighting and boarding process is a time-critical stage in using a train.
Relative to models of a baseline condition without social distancing, the modeling indicated that 1-m social distancing made only a very marginal difference to passenger flow times for the cases considered (3- and 6-m wide platforms, intercity and suburban rolling stock types). This indicated that mandated or informal use of 1-m social distancing is unlikely to have significant impact on rail network operation (primarily because of passenger behavior to compromise on distancing at the rate determining door location).
With 2-m social distancing, it was found that significantly extended passenger alighting and boarding flow times could develop but only for busier services. Intercity style rolling stock (smaller doors at the ends of the carriages) were predicted to need up to 2.8 times the normal passenger flow time, whereas suburban rolling stock (wider doors located one-third and two-thirds along the carriage) needed up to 2.2 times the baseline case without social distancing. The exact passenger loading at which flow times began to extend was dependent on the rolling stock and platform size, but a general conclusion can be reached from the modeling predictions that significant increases in flow time only affected 2-m social distancing cases when the combined total of boarding and alighting passengers exceeded 10 to 15 per door. This knowledge may be used in preparedness for mandated application of social distancing, or to account for the effect of continuation of distancing by vulnerable or cautious people even when it is no longer mandated. This could help avoid the introduction of timetables, which are unlikely to be maintainable, and to reduce incentives for people to compromise on social distancing.
The modeling presented here was developed for a specific case of social distancing applied during the pandemic, however, has wider applicability to situations with “natural distancing” between people, as well as applicability to wider transport issues. In the future, as we transition to a postpandemic world, there may still be those who exhibit a degree of distancing from other passengers, for which the models developed here will be relevant. Also, for existing infrastructure, the model described here could inform changes to management of people flows, for example, one-way systems or allowable dwell times timetabled into the network. For new infrastructure, the model has applicability to overall improvement of passenger flows in the design stage as well as reduction in the effect of pinch-points (e.g., ticket barriers).
Future iterations of the model will take advantage of the massively improved computational speeds afforded by implementation using a FLAME GPU version ( 29 ). The current work considered individual travelers without luggage, although the CCTV observation provided evidence of the increased time of boarding when, for example, passengers needed to load or unload bicycles from the train. Thus, to further the applicability of the modeling output, future work will implement passengers traveling with luggage, and groups traveling together.
Further extensions of the presented model will examine platform management strategies to reduce overcrowding, targeting existing physical infrastructure, as well as investigating how different passengers behave with knowledge of train dwell times, that is, passengers boarding immediately or waiting on the platform until just before departure.
Footnotes
Acknowledgements
The authors thank Giulia Lorenzini, the PTI Good Practice Group, and the wider team at Rail Safety and Standards Board (RSSB) for their support of this research, which began as a proof of concept with RSSB. Thanks are also due to Simon Hardy, James Moy, Stephen Alder, and Max Coventry of Network Rail for facilitating access to Leeds, Birmingham New Street, and London Bridge stations to obtain the required CCTV footage.
Author Contributions
The authors confirm contribution to the paper as follows: study conception and design: David Fletcher, Paul Richmond, John Charlton; data collection: Sam Hayes, John Charlton; analysis and interpretation of results: Sam Hayes, John Charlton, David Fletcher, Paul Richmond; draft manuscript preparation: Sam Hayes, John Charlton, David Fletcher, Paul Richmond. All authors reviewed the results and approved the final version of the manuscript.
Declaration of Conflicting Interests
The authors declared no potential conflicts of interest with respect to the research, authorship, and/or publication of this article.
Funding
The authors disclosed receipt of the following financial support for the research, authorship, and/or publication of this article: This work was supported by UKRI grant ES/W000601/1.
Data Accessibility
The datasets generated during the current study are available from the University of Sheffield Online Research Data repository (ORDA), https://doi.org/10.15131/shef.data.16832710, and the Ratesetter model can be accessed from ![]() .
.