
Abstract
Pick/drop stand road (PDSR) is necessary for specific functions, but it very easily generates congestion and thus results in a less safe and comfortable ride for passengers. The Internet of Vehicles has offered new ideas and technical means to solve the problem. First, this study divides the PDSR into different functional zones and constructs the coordinated control environment of connected vehicles (CVs). A car-following coordinated control strategy (CF-CCS) and a lane-changing coordinated control strategy (LC-CCS) are proposed based on a mixed platoon of CVs and human-driven vehicles. For CF-CCS, this study offers a model for car-following coordinated platoon control based on terminal state prediction of the leading vehicle, with platoon safety and passengers’ comfort as optimization objectives, and solves it using a modified particle swarm algorithm. For LC-CCS, a model for lane-changing coordinated control of platoon is proposed, and a numerical approach is utilized to solve it. It is based on finding the best area for lane-changing location while considering the safety of lane changing and the efficiency of vehicle traffic on the PDSR. Last,
Keywords
Pick/drop stand road (PDSR) is a kind of common congestion section in a city, including schools, shopping malls and hospital roadways, airports and railroad hubs, and other areas where cars pick up and drop off passengers. The PDSR can easily become congested because the vehicles temporarily parked on it will occupy one lane while the section usually has large traffic flow, complex traffic composition, and many conflicts and disorders. Therefore, vehicles need to adjust their speed frequently on the PDSR, making the ride less safe and comfortable for passengers ( 1 ).
To solve this problem, most of the current research focuses on substantive measures to alleviate congestion, such as adding bus lines or opening school buses, parking guidance, adding parking spaces, setting bus platforms, and so on. However, they are often ineffective because of problems in other supporting measures ( 1 ). People’s needs on such roads are also ignored, which makes PDSR unable to function fully, or even meaningless.
The Internet of Vehicles (IoV) is developing steadily, so many scholars have researched coordinated control strategies for connected vehicles (CVs). For example, Ghiasi et al. ( 2 ) proposed the trajectory smoothing concept based on networked autonomous vehicles to coordinate traffic flow and reduce the adverse impact of the frequent stops caused by highway bottlenecks. Their model has made significant progress in mitigating traffic fluctuations and reducing fuel consumption and car emissions. Ma et al. ( 3 ) proposed a multi-factor perceived following model of connected autonomous vehicles (CAVs), which considers multiple factors such as vehicle collaborative optimization speed, speed difference, and spatial headway. In mixed traffic flow composed of human-driven vehicles (HVs) and CAVs, it can effectively improve the average speed and traffic capacity of the system. Zhao et al. ( 4 ) studied the traffic flow of mixed autonomous and manned vehicles at intersections and designed a real-time cooperative ecological driving strategy based on IoV. They proposed a predictive control model to minimize fuel consumption and ensure that vehicles cross the intersection when the light is green. Its simulation results show that their model can effectively smooth the trajectory of HVs and reduce fuel consumption throughout the coordination process. Bian et al. ( 5 ) proposed a coordinated control method for unsignalized intersections where CVs and HVs are mixed. By establishing a task area division framework for task decomposition, the average travel time can be reduced without global coordination.
The research above mainly studied the coordination effect of CVs on traffic flow in the car-following state and paid less attention to the coordinated control strategies (CCS) when multi-lane changes occur. Coordinated control based on multi-lane research aims to improve lane-changing safety and traffic efficiency. For example, Yu et al. ( 6 ) reduced the total vehicle delay at intersections by optimizing car-following and lane-changing behaviors at intersections and coordinating the trajectories of all CVs. Wang et al. ( 7 ) proposed an innovative CAV dynamic cooperative lane-changing model which took into consideration the targeted vehicle and the ones surrounding it, improved the success rate of lane change, and eased traffic disruption caused by lane change with a dynamic and centralized trajectory design. Qu et al. ( 8 ) focused on the new mixed traffic flow under the intelligent CV environment and used the idea of game theory to establish the model for lane-changing behaviors of autonomous vehicles. Autonomous vehicles are non-cooperative when changing lanes. With their own driving state as the game income, the vehicle seeks the lane with better driving conditions. The simulation results showed that the game lane-changing model has higher lane utilization and safety stability than the traditional gap threshold acceptance model. The researches of the above scholars show that IoV has provided new ideas and technical means to solve the problems of the PDSR. The coordinated control technology of CVs can retain the road’s function to the maximum extent, and it is expected to ease congestion and improve driving safety and passenger comfort.
For PDSR mixed with CVs and HVs, a car-following coordinated control strategy (CF-CCS) and a lane-changing coordinated control strategy (LC-CCS) is proposed in this paper. For CF-CCS, this study offers a model for car-following coordinated platoon control based on terminal state prediction of the leading vehicle (MF-CFCC), with platoon safety and passengers’ comfort as optimization objectives, and solves it using a modified particle swarm algorithm. Compared with previous studies, the terminal state cost of MF-CFCC has been fixed and is no longer an optimization item under the coordinated control strategy, and multi-vehicle cooperative lane changing is considered instead of single-vehicle lane changing as well. For LC-CCS, a model for lane-changing coordinated control of platoon (MF-LCCC) is proposed, and a numerical approach is utilized to solve it. It is based on finding the best area for lane-changing location while considering the safety of lane changing and the efficiency of vehicle traffic on the PDSR. Last,
The main contents of this paper are as follows: (i) the characteristics and some basic assumptive scenarios on PDSRs are presented; (ii) the car-following model and lane-changing model are established; (iii) the corresponding solutions for the models are given; (iv) simulations are conducted based on case scenarios and the results are analyzed; and (v) the conclusions and contributions of this study are summarized.
Problem Description
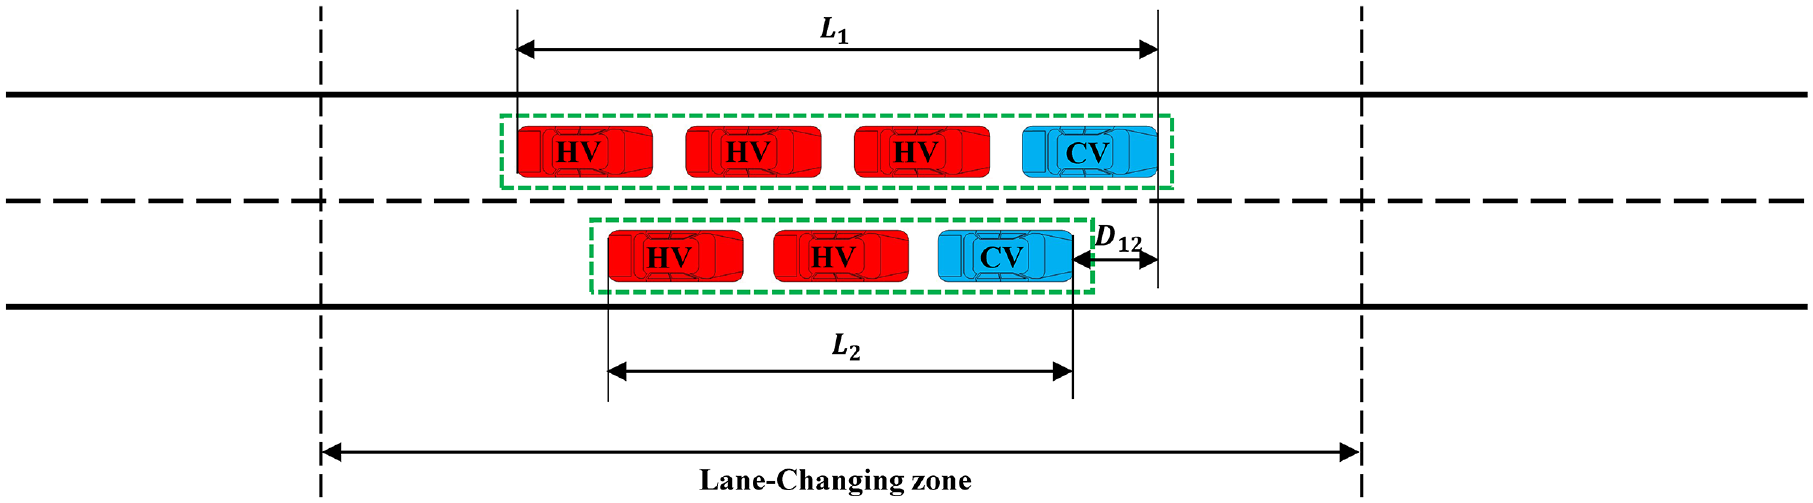
This study considers the one-way two-lane PDSR section in which one of the lanes will be occupied when cars park on the road, and there are CVs driving on the road. The detection unit, which can detect the vehicle information in the section in real time and communicate with CVs in real time, is uniformly set on the roadside. The lane on the right side of the travel direction is called the right lane, and the lane on the left side is called the left lane. Vehicles go through three phases when passing a PDSR. In phase 1, vehicles follow the ones ahead on the road. In phase 2, vehicles on the right lane change their lane before the parking area and the vehicles on the left lane continued following. In phase 3, after entering the parking area, vehicles that need to stop will drive to the parking space from the left lane to drop off the passengers. Then the vehicle starts and pulls away from the parking area. Therefore, the PDSR is divided into three zones along the travel direction: the car-following zone, the lane-changing zone, and the car-parking zone (Figure 1).
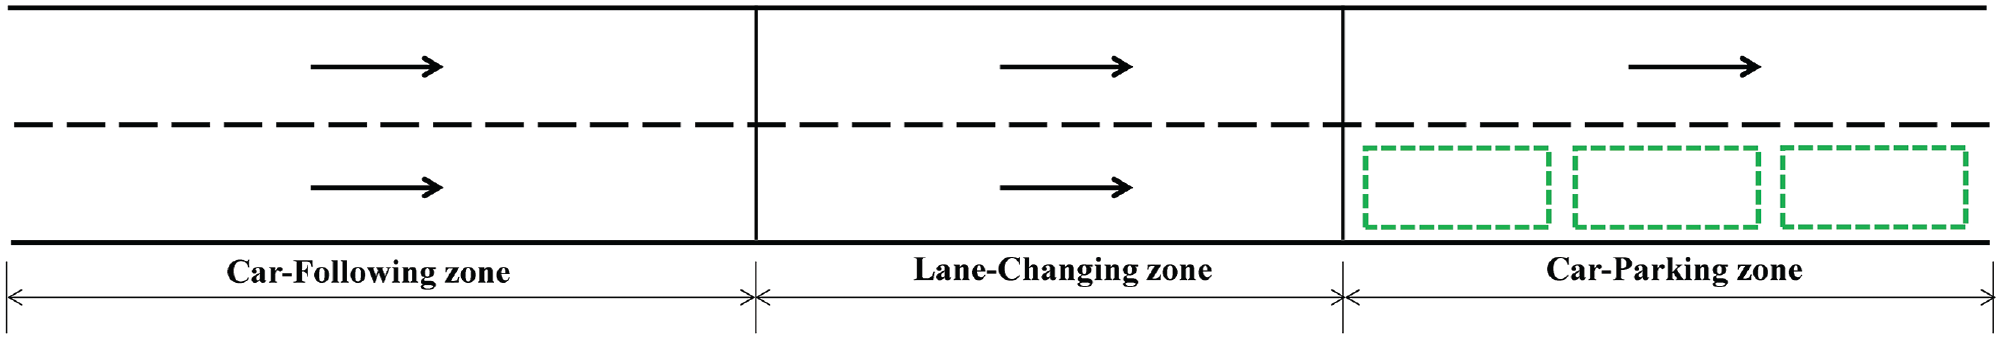
Division of functional zones on pick/drop stand road.
Assumptions
To simplify the formulation for more sensible feedbacks, the following assumptions for the scenario are made:
1) To focus on the PDSR, the traffic flow is set to have reached the steady car-following state before the car-following zone, and vehicles can be promptly dispersed after leaving the parking zone without harming traffic flow in the car-parking zone.
2) CVs use V2V and V2I to exchange real-time information with the outside. The information sent and obtained includes, but is not limited to, the driving speed, acceleration, and location of the vehicle and the surrounding vehicles, and the driving plan in the future period. CVs’ information calculation and transmission time are not considered. CVs will accept the control strategies ( 4 ).
3) The traffic flow is in the form of platoons that have CVs as the lead and HVs following behind. CVs are the vehicles that can get the control instruction from the system whereas HVs cannot. Details are shown in Figure 2. CVs in a platoon know the number of HVs behind and HVs will not interfere with the formation of the platoon. The lane changes in this scenario are carried out for the platoon described above. The assumption that a platoon is mixed by CVs and HVs is inspired by Zhao et al. ( 4 ); this assumption is the key to the coordinated control strategy.
4) In the car-following zone, CVs and HVs are not allowed to change their lane. In the lane-changing zone, each platoon can change lanes under specific rules. In the car-parking zone, the change of lanes is carried out for a single vehicle when the vehicle starts from the parking space.
5) Only cars are involved in the entire traffic flow. The interference of pedestrians, non-motor vehicles, and other factors in the main traffic flow is not considered.
6) The parking space in the car-parking zone is oversupplied, so all parking demands can be met. Therefore, the vehicles that change from the left lane to the right will not affect the following cars in the left lane. The vehicle parking time can be detected by roadside detectors. These three assumptions are for the convenience of the following modeling.
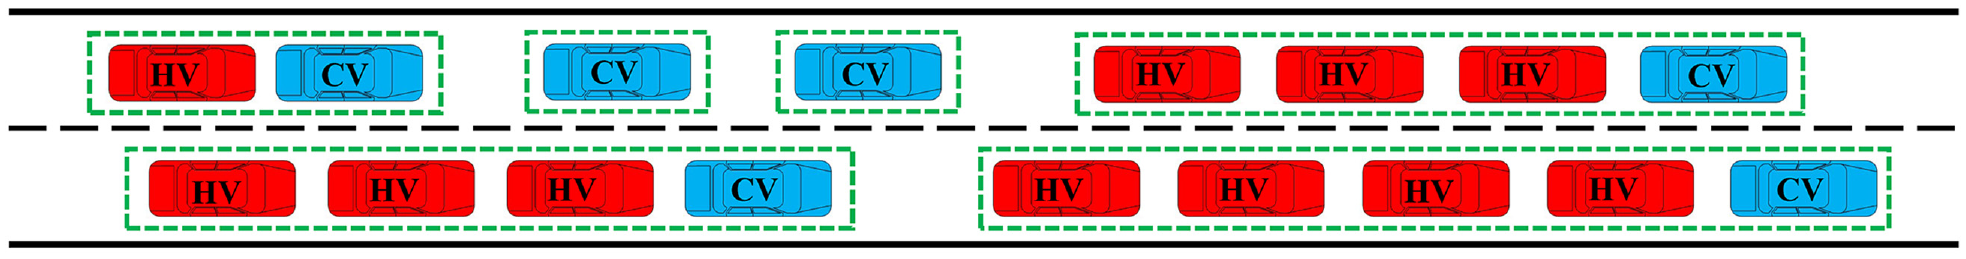
The platoons in the traffic.
Coordinated Control Strategy Based on CVs
We conduct the research when CV ratio in the entire traffic flow is above 0.1. In this scenario, it is common that a platoon is made up of no more than 10 vehicles. Therefore, we choose platoons less than 10 vehicles in length as the research object. We will conduct further research on the situation in which a platoon has more than 10 cars. Based on previous assumptions, the study proposes a car-following coordinated control strategy (CF-CCS) and a lane-changing coordinated control strategy (LC-CCS) based on the platoon consisting of CVs and HVs in the PDSR.
CF-CCS
It is assumed that CVs are at the head of platoons and HVs are following behind. The CVs in the platoon can calculate the speed and position of HVs based on the car-following model, and then calculate the length and position of the entire platoon and the speed of each vehicle. It is noted that the infrastructure can only provide information on already-passed cars whereas the full velocity difference (FVD) model can provide that of vehicles yet to arrive. Therefore, the calculation is needed for CVs to acquire the speed and position of HVs using the FVD model to make decisions. The leading CVs develop a follow-up speed plan and future driving plan for CVs in the platoon according to the platoon’s driving state and transmit the future driving plan of its platoon to the CVs in the following platoons.
LC-CCS
The LC-CCS is made up of the strategy to decide the lane-changing area and the strategy to decide the specific lane-changing position. First, the platoon that needs to change lanes determines whether to change to the area in front of or behind the platoon in the other lane according to the platoon’s speed, position, and other driving states. Then, the platoon calculates the specific time and position to change lanes and transmit the plan to the CVs around.
Different zones should adopt different CCSs. In the car-following zone, CF-CCS is adopted to control the platoon’s following behavior. In the lane-changing zone, CF-CCS and LC-CCS are adopted to control the platoon’s lane-changing and following behavior. In the car-parking zone, CF-CCS is adopted to control the left-lane platoons to ensure that vehicles in the parking space in the right lane can start and change lanes. LC-CCS works based on the CF-CCS while the CF-CCS is influenced by the LC-CCS.
Model Formulations
According to the car-following and lane-changing behaviors in the PDSR, combined with the previously proposed CF-CCS and LC-CCS, the car-following coordinated control model and the lane-changing coordinated control model are established. The main operation symbols are listed in Table 1.
Main Operation Symbols
Car-Following Coordinated Control Model
Traffic engineering type and statistical physics type are two common types of car-following models ( 9 ). The traffic engineering type mainly focused on the microscopic driving behaviors of drivers ( 10 , 11 ). This type is comprehensible but has many parameters that are difficult to calibrate. The statistical physics type focuses on more macroscopical traffic characteristics, including the intelligent driving model represented by the IDM model ( 12 ), and the optimized velocity model represented by the FVD model ( 13 ), and others. In car-following scenarios, Gipps model, IDM model, and FVD model all enable a car to safely adjust its speed state while following. Among them, cars using an FVD model can best react to the driving state of its former car and maintain a high similarity with it ( 14 ). In this study, HVs follow the FVD model while driving after CVs. That combined with the roadside detectors that can acquire the number of HVs in a platoon in real time enables CVs to calculate the positions of HVs. Then CCSs in this study can coordinate the traffic flow by adjusting the speed of CVs in real time and can better characterize the following behavior of an individual vehicle in the platoon using the FVD model.
Aiming at the car-following behaviors in a platoon, the study proposes the model for car-following coordinated platoon control based on the terminal state prediction of the leading vehicle (MF-CFCC). For an individual platoon, the terminal time, position, and speed of the leading CVs of a platoon are predicted first. If the platoon’s average speed during the car-following coordination is the same as its initial speed, the original speed is maintained. If not, an optimal speed curve will be calculated using the model.
Objective Functions
The total cost function of the model in a car-following coordinated control process is defined as

where
The car-following coordinated control aims to prevent the sudden change in the driving state of the vehicles downstream from affecting the driving safety and comfort of the vehicles upstream. Therefore, the driving safety and comfort of platoon
where
Δt is the time step length in one coordination process,
The comfort of each vehicle in the platoon is represented by the root mean square of acceleration in the car-following coordination process, defined as Equation 4 ( 16 ). The unit of CIi is m/s2.

Constraint Conditions
1) The terminal time prediction constraints of the leading vehicle: Equation 5 indicates that in the lane-changing zone and the car-following zone the terminal time of the leading vehicle of platoon


where
2) The terminal position prediction constraints of the leading vehicle: Equation 7 indicates the terminal position prediction of a vehicle that is driving in the car-following zone and the lane-changing zone. It is the summation of the front car’s position and the length of HVs. Equation 8 indicates the terminal prediction of vehicles in the car-parking zone. It is the summation of the final position of a vehicle after changing lanes and the distance it completes when changing lanes and reaching a steady following state. Equation 9 indicates the final position of the vehicle in the car-parking zone. Equations 7 to 9 are as follows:


where
3) The terminal velocity prediction of the leading car: To reach a steady state quickly, Equation 10 indicates that the terminal speed of the leading car of platoon j is the platoon’s driving speed before the terminal time point. Equation 11 indicates the average velocity in the car-following coordinated control process. Equations 10 and 11 are as follows:


4) The speed constraint: Equation 12 indicates the speed of a vehicle should be within the speed limit in the coordinated control process as follows:

5) The acceleration constraint: Equation 13 indicates the acceleration of a vehicle should be within the acceleration limit in the coordinated control process as follows:

Lane-Changing Coordinated Control Model
The lane-changing coordinated control model can be divided into two types: the lane-changing decision model and the lane-changing trajectory prediction model ( 17 ). Lunhui et al. ( 18 ) proposed a mathematical lane-changing trajectory prediction model. It is suitable for the prediction of the microscopic process of the short-time lane change. Lee et al. ( 19 ) proposed a data-driven vehicle lane-changing trajectory prediction model that predicts the future trajectory based on trajectories of previous vehicles. It is suitable for the trajectory prediction of the long-time lane change.
This study intends to perform the short-time lane-changing coordinated control on each platoon. The future trajectory of vehicles will be influenced to some extent by the CCSs and the mathematical lane-changing trajectory prediction model can better show the effect. In this study, vehicles change lanes under coordinated control, so they are aware of the states of surrounding vehicles during the process. This is consistent with the characteristics of the mathematical model of the safe distance type. In reality, a driver first estimates the distance between their vehicle and surrounding ones to see if it meets the safety standard they anticipated. Meanwhile, the safe lane-changing distance is related to vehicle speed and other factors. Therefore, the safe distance type of the mathematical lane-changing trajectory prediction models is used to characterize the lane-changing behaviors of vehicles in this study.
Aiming at the lane-changing coordinated control strategy, the study proposes MF-LCCC. It aims to enable all vehicles in a platoon to change lanes at the optimal position. Two models are involved in the calculation of the optimal lane-changing position: the first model named the model for lane-changing area (MF-LCA) is to decide whether the platoon will be in front of or behind the left-lane platoon after the platoon changes lanes; the second model named the model for lane-changing position decision (MF-LCPD) is to decide the specific position to perform the lane change.
Objective Functions
The MF-LCA is constructed at first. The car-following coordinated control on the platoon in the left lane is influenced by the position the right-lane platoon ends after lane change, so the evaluations are needed according to different conditions to decide the best area for a lane change. Different ending areas mainly influence the passing time of the platoon that performs lane change, the platoon in the left lane, and its following platoons. Therefore, the passing time of the platoons mentioned above is used as the evaluation criterion, the objective function of MF-LCA is defined as

where
The optimal lane-changing strategy is acquired when the total passing time reaches the minimum.
Then the MF-LCPD is constructed. After the best lane-changing area is decided, the specific position to perform lane change needs to be decided. The choice of the position influences the safety of lane changes and the passing efficiency of platoons on the road. Under this circumstance, the lane-changing position decision model is formulated as
where
Constraint Conditions
There are constraints concerning the safety of the lane-changing process. Equation 16 indicates that platoon


where
Model Solution
Solving Method of the MF-CFCC
This study applies the dynamic programming method to solve the MF-CFCC because of its high solution precision when dealing with optimization control models with fewer constraints. The coordinated control period,
There are two optimization objectives in the car-following coordinated control model in this study and the particle swarm algorithm needs to be improved based on the model. The update on speed has two stages: The first stage considers the effect of the recorded best positions of the platoon and the group on the platoon’s speed when the first objective is optimal. The second stage considers the same effect on the platoon’s speed when the second objective is optimal. Repeat the above two stages to update and record the optimal values in each objective, and the birds will end up in the middle of the two food sources. The flow chart of the improved particle swarm algorithm is shown in Figure 3.
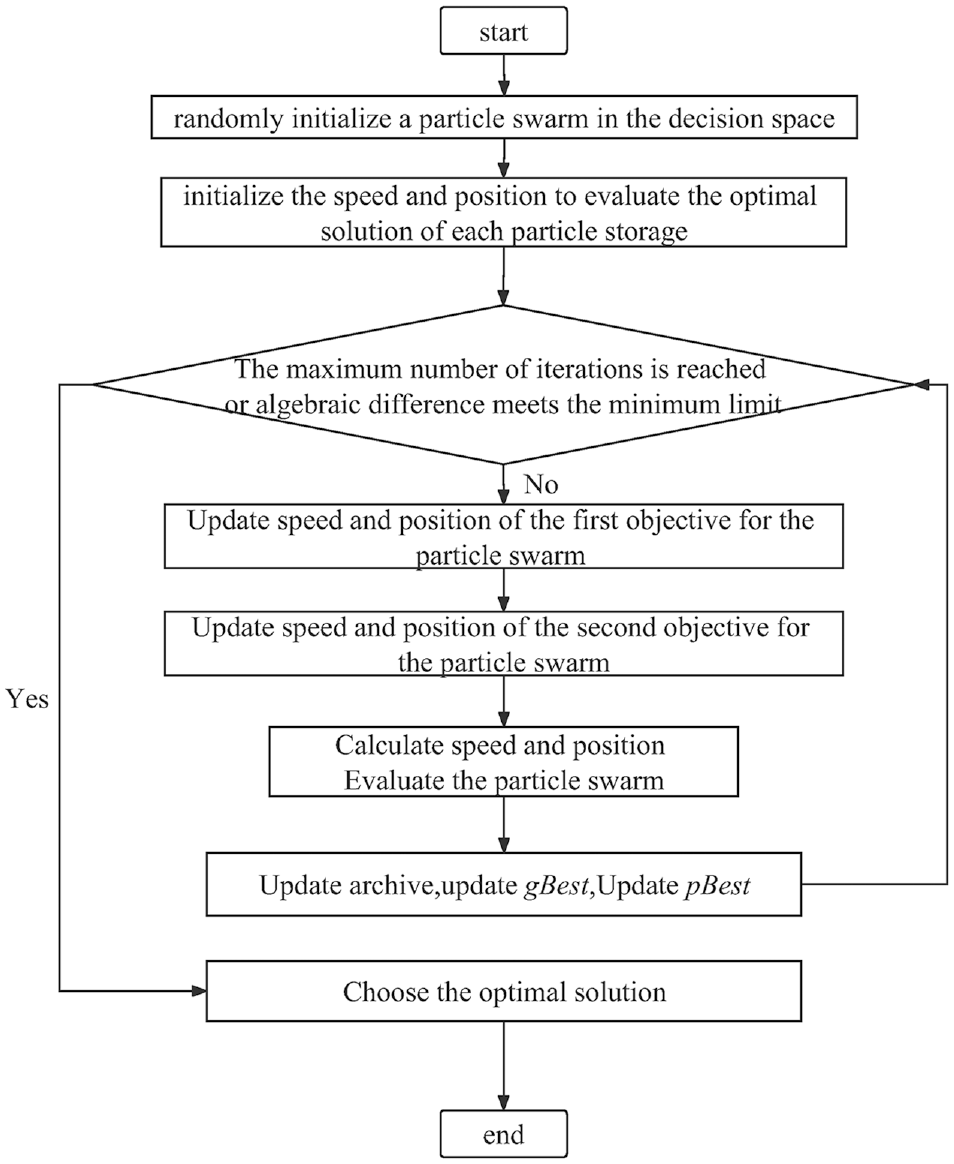
Process of the improved particle swarm algorithm.
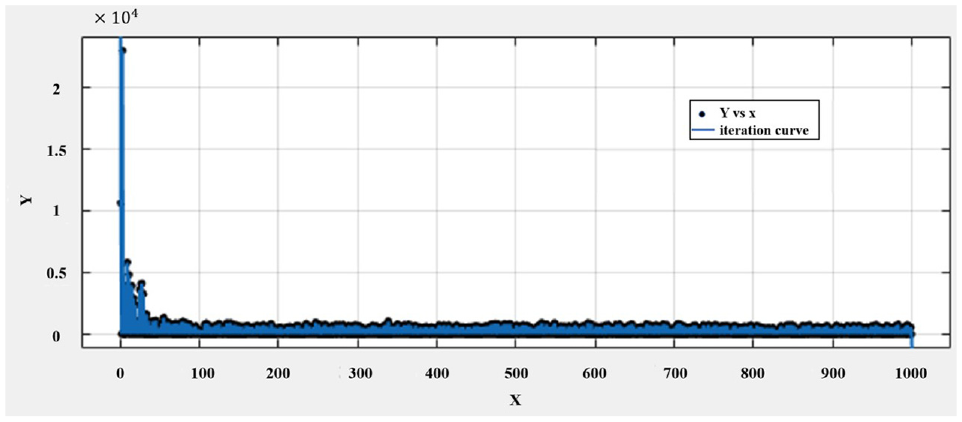
The two objectives are equally considered and speed is updated using safety and comfort as the optimization objectives. The iterative curve is shown in Figure 4.
Two-objective solution convergence curve.
Figure 4 shows that the convergence is reached and the vehicle’s driving speed curves are consistent after 100 iterations because safety and comfort are taken into consideration. It can be assumed that the function has reached its optimal state.
Solving Method of the MF-LCA
The numerical simulation method is used to solve the MF-LCA because there are many scenarios in this study and mathematical methods are unable to solve the many corresponding optimization problems. The numerical simulation method calculates the optimal value with the exhaustive method using
Base scenario of the lane-changing zone.
There are 100 scenarios when the number of vehicles in the platoon in each lane ranges from 1 to 10. In each scenario, the model is solved every time
The number of vehicles in the left-lane platoon (
where


The dependent variable

where
All results of the numerical simulation method are shown in Figure 6.
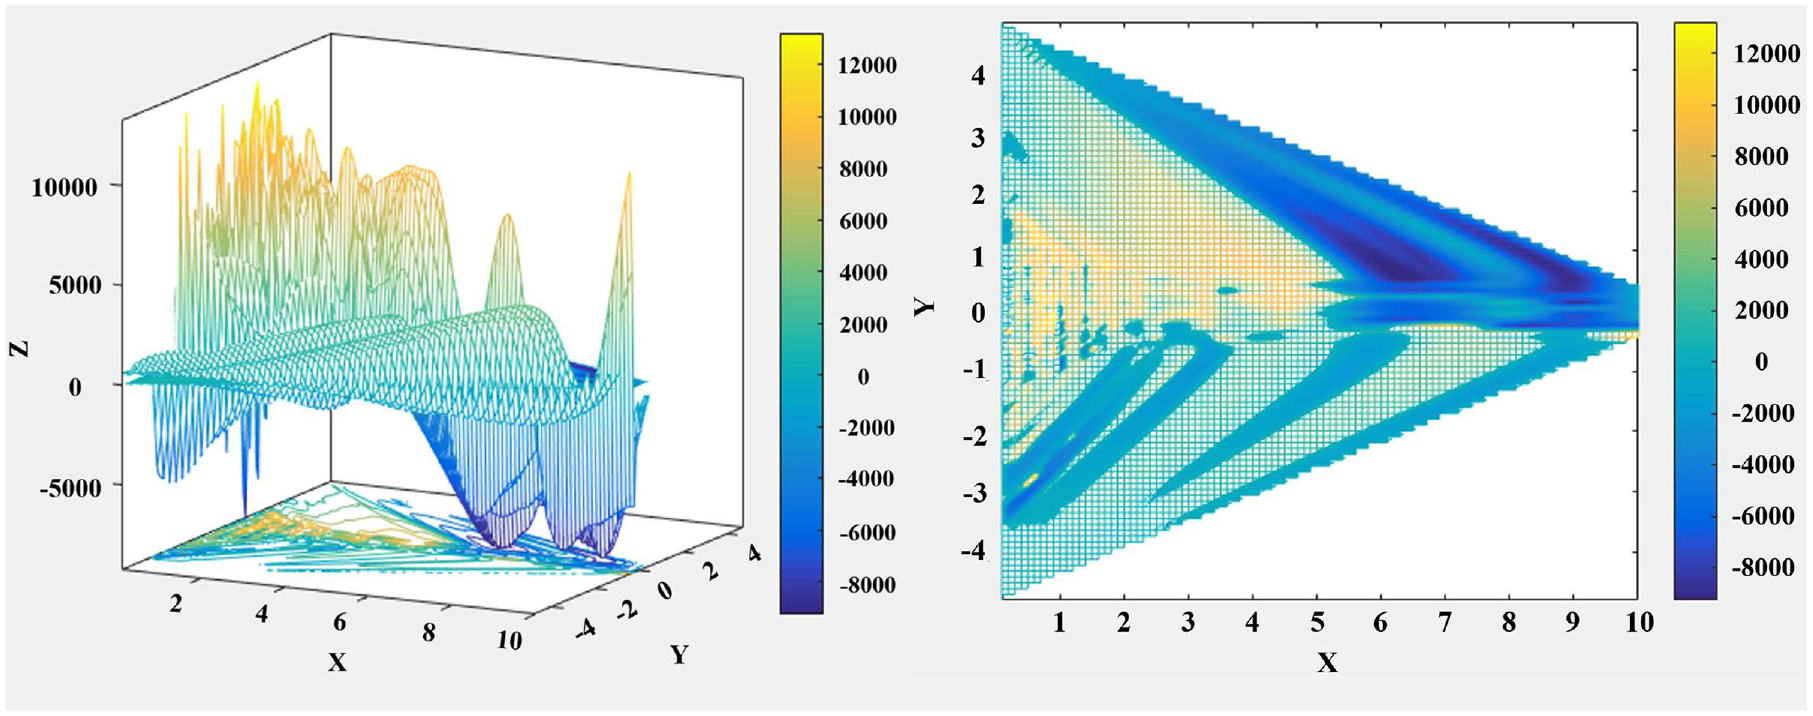
Results of seeking the optimal lane-changing area.
The grid lines indicate that the Z value is greater than 0. The right graph shows that it takes longer for the right-lane platoon to change to in front of the left-lane platoon, so changing to the rear area is the optimal strategy. The top view shows that the effect of the lane-changing strategy changes with the independent variable and it is consistent with reality: There exists a lane-changing critical point where the Z value is 0. The optimal lane-changing area can be decided according to the right graph in Figure 6 based on the current driving state and position when changing lanes.
Solving Method of the MF-LCPD
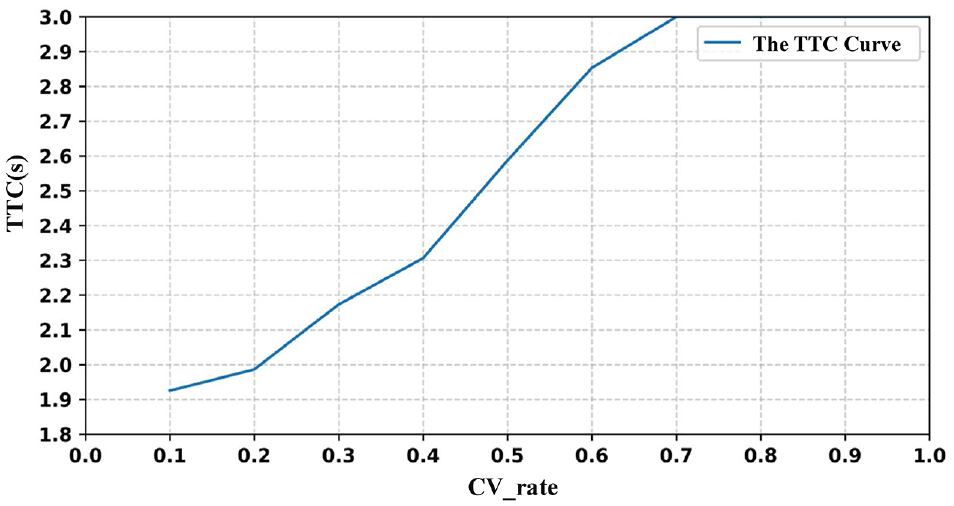
The optimal lane-changing position
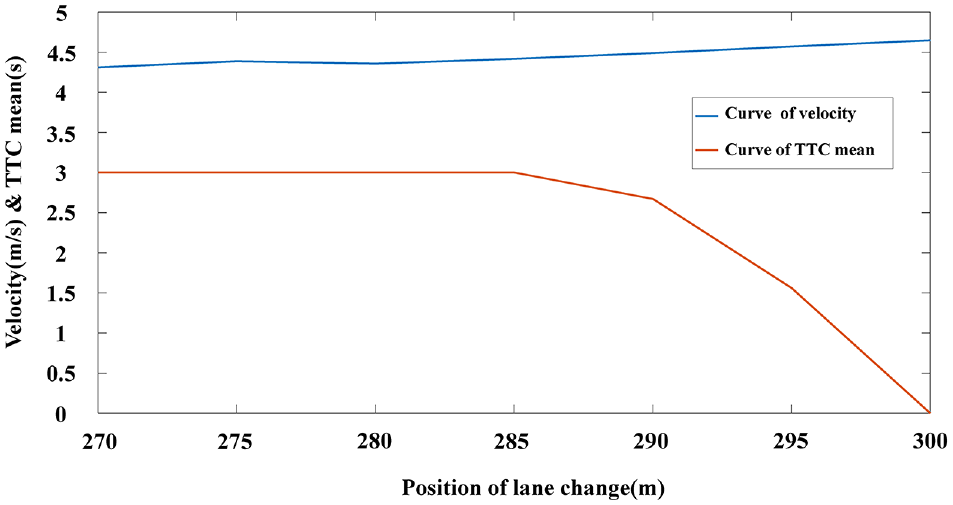
Variation curves of optimization objectives corresponding to different lane-changing positions.
It can be seen from Figure 7 that there is little difference between the slopes of velocity curves corresponding to adjacent positions. It means that the average velocity increases as the lane-changing position approaches the end of the parking zone. The vehicles are safe to change lanes within the first 285 m of a 300 m road because the TTC values are 3 in this section but it becomes less safe as the lane-changing position continues to approach the end of the road. An inflection point with a large slope occurred at 290 m. The simulation result shows that safety and travel time can both be assured when changing lanes at 290 m, and there will be a sharp decline in safety if the changes are made after that. Under this circumstance, the optimal lane-changing position is at 290 m of the road, 10 m away from the end of the lane-changing area.
Numerical Experiment
In this part, this study sets up a PDSR section and compares its performances before and after the implementation of CCSs.
Simulation Parameters Setting
This study sets up a 460 m long, one-way, two-lane PDSR section. The car-following zone is 300 m long, the lane-changing zone 80 m, and the car-parking zone 80 m.
In our setting,
The update frequency of the FVD model:
In
Analysis of Simulation Results
Analysis of Delay and Velocity Simulation Results
The current traffic operation data obtained based on the
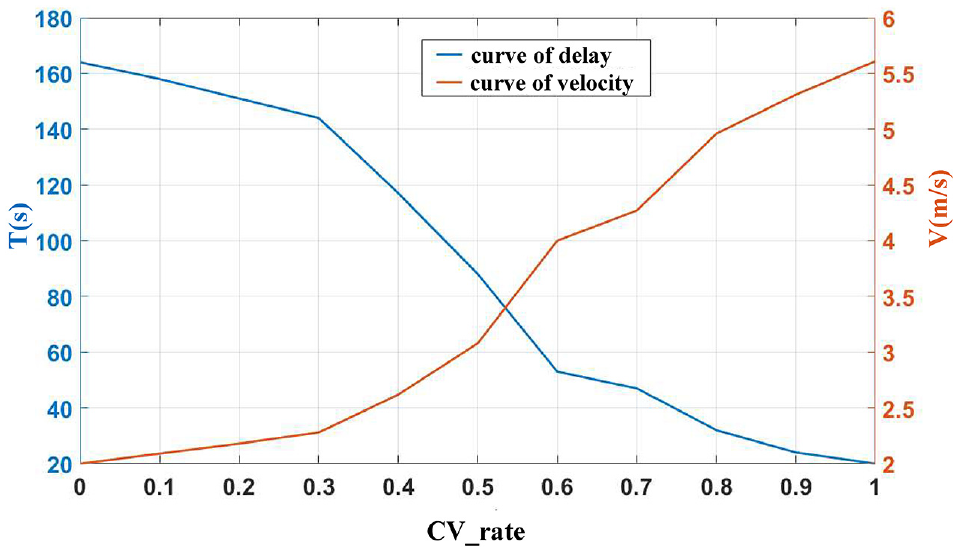
Delay and velocity maps at different proportions of connected vehicles.
The simulation result shows that the CCS reduces delay and improves the passing velocity:
When there are no CVs, the average vehicle delay in the research section is 166 s, and the average velocity of vehicles is 2.03 m/s.
When the proportion of CVs reaches 30%, the CCS begins to show a significant effect.
When the proportion of CVs is between 30% and 60%, the CCS is greatly influenced by the proportion of CVs.
Analysis of Safety Simulation Results
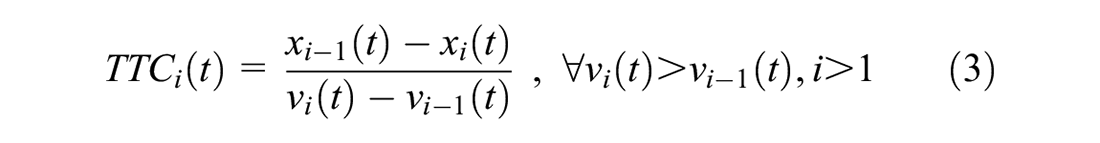
The numerical simulation results based on different proportions of CVs are compared. The average vehicle collision time at different proportions of CVs is shown in Figure 9. The TTC indicates the average collision time of vehicles with the risk of collision. When a vehicle drives at a different speed from its front vehicle, TTC is the time the vehicle takes to collide with the front car when its driving state remains unchanged. When a driver is given 2.5 s ( 15 ) to slow down to avoid a collision, the TTC is taken as 3 s considering the difference in decision-making time of different drivers.
Collision time distribution map at different proportions of connected vehicles.
The following conclusions are drawn by analyzing Figure 9:
Driving safety improves with the proportion of CVs.
The traffic flow reaches a relatively safe state when the proportion of CVs reaches 50%.
The CCS can fully control traffic safety when the proportion of CVs reaches 70%.
Analysis of Comfort Simulation Results
The comparison of driving comfort at different proportions of CVs is shown in Figure 10:
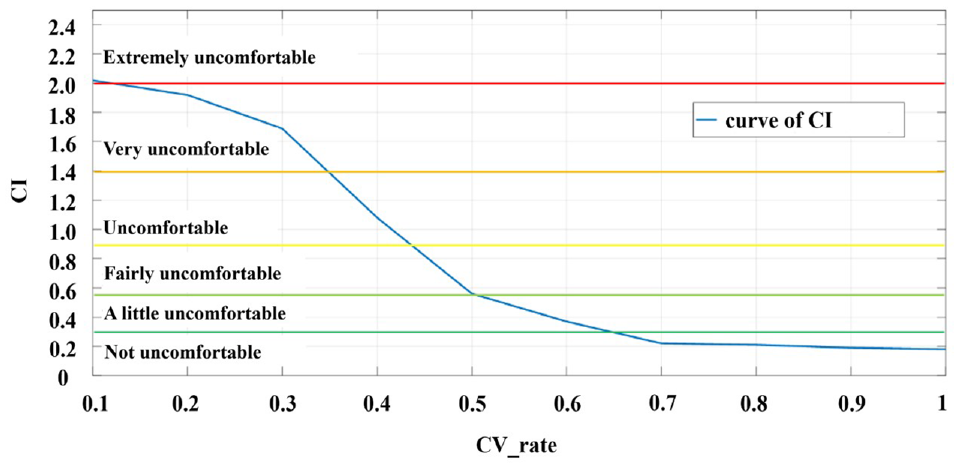
Comfort distribution map at different proportions of connected vehicles.
There are six levels of comfort index (CI) with reference to Zhou and Wan ( 16 ). Figure 10 shows that the proportion of CVs has a great influence on driving comfort. Conclusions are drawn by analyzing Figure 10:
The driving comfort and ride comfort improve with the proportion of CVs. When the proportion of CVs is the smallest, the comfort variation curve is in the extremely uncomfortable zone and it rises to the comfortable zone as the proportion of CVs increases.
There is a critical point when CVs account for 50%. The comfort variation curve lies in the uncomfortable zone when the proportion is under 50% and it begins to approach the comfort zone when after the proportion reaches 50%.
The CCS fully controls comfort when the proportion reaches 70%. The experiment result shows that ride comfort improves with the proportion of CVs. When it reaches 70%, the CI value is less than 0.315, and the comfortable state is reached, indicating that the traffic comfort with CCS at this point is under control.
Conclusion
This study takes the PDSR as the research subject. The traffic operation characteristics and the driving behavior of each functional zone of the PDSR section are analyzed. CCSs based on CVs according to the car-following and lane-changing behaviors on PDSR are proposed. The car-following coordinated control model is established and the improved particle swarm algorithm is used to solve it. The lane-changing coordinated control model is established and the numerical method is used to solve it. Last, the CCSs are proved to be effective through simulation experiments. Results show that the proposed CCSs can effectively mitigate congestion on the PDSR. The traffic passing speed is increased to some extent when the proportion of CVs is larger than 30%. The driving safety and comfort can be fully controlled by controlling CVs when their proportion reaches 70%.
In fact, although the present study focuses solely on congestion mitigation methods for PDSR, the proposed CCSs has potential applications in other contexts. For instance, transportation modelers could use this method to more accurately model and analyze traffic flow. Moreover, airports or commercial shopping centers might be interested in using such CVs to maintain traffic flow better; of course further study should provide means for adjusting such CVs’ behavior accordingly. Additionally, the length of the dedicated parking space also influences the CCSs. The length sensitivity analysis of CV-dedicated parking spaces is worthy of further study. The lane-changing trajectory model in mixed traffic based on CVs can also be further studied. Then the CVs’ coordinated control function can achieve its full potential to make lane changes safer. Moreover, only passenger vehicles are taken into account in this study. It is expected to extend the proposed model to platoons that contain other vehicle types. For example, truck or bus. But note that speed, platoon length, and lane-change coordination might become different when other types of vehicles join in. The changes need to be paid attention to when conducting further research. In addition, humans are not likely to follow strictly behind the head CV while in a platoon, thus a stochastic model for HVs can be further explored.
Footnotes
Author Contributions
The authors confirm contribution to the paper as follows: study conception and design: Yucong Hu, Huaqing Ma; data collection: Huaqing Ma, Xuelong Li, Qingyang Liu; analysis and interpretation of results: Huaqing Ma, Yucong Hu, Xuelong Li; draft manuscript preparation: Huaqing Ma, Qingyang Liu, Xuelong Li,Yucong Hu. All authors reviewed the results and approved the final version of the manuscript.
Declaration of Conflicting Interests
The author(s) declared no potential conflicts of interest with respect to the research, authorship, and/or publication of this article.
Funding
The author(s) received no financial support for the research, authorship, and/or publication of this article.