
Abstract
Disengagement of advanced driver-assist systems (ADAS) has significant safety implications in partially automated vehicles where drivers may not be paying attention; this requires rigorous testing to ensure vehicles can safely transfer control to drivers. Existing testing and regulation on this topic are minimal, and do not address the role of difficult-to-measure but potentially important variables relating to individual vehicle differences or variations in environmental conditions. This study assessed variability in takeover alerting performance in three Model 3 Tesla vehicles in a demanding driving setting on a closed track. Results revealed that once an alerting sequence had begun, the ADAS systems performed as designed, but the vehicles were highly variable in the timing of alert initiation following the loss of lane marking tracking. In addition, luminosity and sun angle were found to potentially have a role in alert initiation, but dashboard-mounted cameras may be insufficient for measuring variations in atmospheric brightness. We recommend that future work studies brightness, as well as more comprehensive sampling guidelines for vehicle test protocols to ensure differences are adequately considered.
Keywords
At least 10% of new cars sold in the United States include features enabling partial automation ( 1 ), defined as Level II Autonomy in SAE standard J3016 ( 2 ). Such vehicles include an advanced driver-assist system (ADAS), which can simultaneously perform automated steering and acceleration. However, these systems require human drivers to be alert and available at all times in case they need to take over. Events requiring the driver to suddenly take over from the automated system are of critical importance in ADAS-equipped vehicles, as changes in human attention and behavior with high levels of automation make this juncture particularly dangerous ( 3 – 5 ). Therefore, many such vehicles employ some type of driver monitoring system for assessing and interacting with drivers during these types of events.
Deployed driver monitoring systems primarily use either cameras that scan a driver’s face or sensors on the steering column to detect driver readiness to take over ( 6 ). The driver monitoring component is paired with an alerting system that presents important updates to the driver, including requests for the driver to take over control of the vehicle. Driver takeovers are more effective when multiple alert modalities are combined, although haptic feedback is often most effective whereas visual feedback is often least effective ( 7 – 9 ). Regardless of the alerting modality, drivers are generally faster in taking control when they anticipate that the vehicle will be unable to perform, when they are less distracted by secondary tasks, and when they experience lower levels of cognitive load ( 10 – 12 ).
Currently, there are no requirements for formal testing of ADAS systems and there are no U.S. regulations addressing how driver monitoring should be implemented or the performance standards such systems should meet. National Transportation Safety Board and other public officials have called for increased scrutiny of this technology owing to the increasing prevalence of highly publicized incidents ( 13 , 14 ). In response, recently the National Highway Traffic Safety Administration (NHTSA) mandated that companies must report crashes involving driver-assistance and automated systems within 1 day of notification ( 15 ).
NHTSA’s New Car Assessment Program (NCAP) does not address driver-assist features, limiting its assessment in relation to collision and rollover survival ( 16 ). The Insurance Institute for Highway Safety (IIHS) covers some ADAS features, such as pedestrian detection and automated emergency braking, but does not address driver monitoring ( 17 ). The European NCAP has a similar scope, but has announced that it will begin assessing driver monitoring in the 2022 revision of its protocols ( 18 ). The South Korean Ministry of Land, Infrastructure, and Transport (MOLIT) is the only major authority regulating driver monitoring, which it has done as of June 2020 ( 19 ), and addresses specific guidance on how the system should handle the engagement and disengagement of automated features.
Even in the few cases in which guidance is provided on how driver monitoring and takeovers should be evaluated, certain aspects of testing are still highly ambiguous. In particular, there is little to no specification as to how differences in vehicles or variations in the operating environment should be considered in the test procedure. None of the NHTSA, IIHS, NCAP, or MOLIT test protocols address how vehicles should be sampled to ensure the test results will generalize to variations in vehicle trim, hardware options, software configurations, or wear-and-tear. Likewise, these test processes either take place in sterile laboratory settings or make assumptions about the generalizability of the results to different atmospheric conditions or road environments. They may especially underestimate the effects that subtle changes in atmospheric conditions have on vehicle performance.
The goal of this research was to characterize how differences in vehicles of the same make, model, and year affect variation in driver takeover alerting in an increasingly uncertain environment. A second goal was to determine whether intravehicle performance variation was related to subtle differences in the operating environment, namely sun altitude and luminosity. We elected to use the Tesla Model 3 as our test platform because at the time of study it was the most widely sold vehicle with Level II autonomy in the United States, and because its ADAS configuration allows for use in a wider range of challenging operating environments than comparable vehicles. Variation between similar vehicles and across successive observations of the same vehicle, particularly when subtle atmospheric variations are implicated, can motivate the use of new techniques for sampling and replicating safety tests for automated vehicle components.
In the next section we discuss our methods, including a description of the vehicles sampled, the alerting sequence under study, the driving scenario, and the data collection instruments. In the Results section, we describe the timing and location of alerts in the driving scenario and present an investigation of the effects of atmospheric lighting on alert behavior. Finally, we discuss the implications and limitations of the work.
Methods
The goal of this experiment was to determine whether there is significant within- and between-vehicle variability in the type and timing of feedback presented to the driver when Autopilot-enabled Tesla vehicles are no longer able to detect lane markings. Given that machine perception systems apply probabilistic reasoning and other forms of nondeterminism with a potentially wide performance range, our hypothesis was that there would be variation in the timing and duration of events in the driver-takeover sequence both between vehicles as well as for successive tests of the same vehicle.
Three 2018 Tesla Model 3s from the Raleigh/Durham metropolitan area of North Carolina were randomly selected for study using a car sharing service over a 1-week period during March 2020. We intended to test more vehicle replicates, but COVID-19-related lockdowns ended our data collection after the third vehicle. The 2018 Tesla Model 3 was chosen as the test platform for multiple reasons. First, unlike other Level II vehicles, the primary ADAS components come as standard on every Tesla Model 3 and therefore have less trim-related variation in functionality across individual vehicles. Second, the 2018 Model 3 was the most widely available Level II vehicle on local car sharing services, allowing us to construct a random sample of vehicles of the same make, model, and year.
Tests were conducted at the North Carolina Center for Automotive Research (NCCAR), a closed test track facility. The NCCAR test track is a 2-mi long, 40-ft wide paved loop with a mix of straightaways and curves of varying angles and radii. All tests were conducted during daylight, between 1:00 and 5:30 p.m., and under similar levels of visibility, cloud cover, wind, air pressure, and humidity.
All vehicles were the Long Range edition of the Tesla Model 3. Car #2 had the Full Self-Driving hardware chip installed but the software was not deployed at the time these tests were conducted. The onboard tire pressure sensors did not report any discrepancies in any of the cars during the trials. The cars had different software versions, including v10.2 (2020.4.1 4a4ad401858f), v10.2 (2020.12 4fbcc4b942a8), and v10.2 (2020.8.1 ae1963092ff8). Software documentation reported that the only driving characteristic affected by these updates was regenerative braking, which was not a subject of these tests, and that they did not affect any core Autopilot functionality. These software updates also affected nondriving characteristics including console fidelity, user interface, navigation functionality, Bluetooth, voice control, and documentation ( 20 , 21 ).
Core Autopilot settings were standardized across vehicles and trials. Since vehicles were privately owned, certain settings were locked and could not be manipulated, including the acceleration style, the appearance of the navigation screen, and whether the built-in dashboard cam was set up to save video. This study focused solely on differences in alerting behavior, and since variation in these settings is not intended to affect alerting, these variations were not confounds and were treated as an acceptable source of individual variation. The same person drove the vehicle for all tests. Before each trial, the vehicle was placed in park, with the driver exiting and using the key card to lock and deactivate the vehicle before entering the car to begin a test.
Tesla Alerting for Driver Takeover
Tesla vehicles use a torque measuring device on the steering column to determine when a driver is touching the steering wheel. Though drivers can operate the vehicle hands-free for short durations while Autopilot is engaged, the driver must resume complete control when the vehicle cannot adequately detect lane markings on the road ( 22 ). When a driver must take over, Tesla Model 3 vehicles present a series of visual and auditory alerts on the 15-in., 1920 × 1080 pixel display centered between the driver and passenger seats. This display also presents other vehicle status information, including speed and navigation data. The Tesla takeover alert manifests as a sequence of three distinct alert phases. First, the console displays an icon and text requesting the driver to grasp the steering wheel (Figure 1a), which is accompanied by a quick pair of beeps.
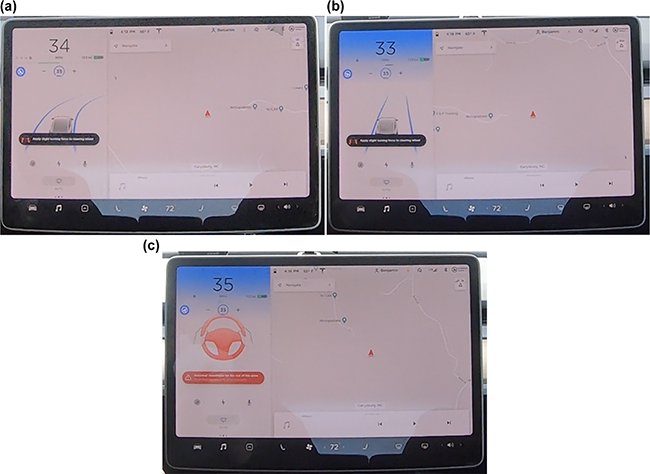
Progression of alerts in the takeover sequence: (a) the first alert includes a black bubble with an icon and the message “Apply slight turning force to steering wheel”; (b) the second alert has the same icon and text, but introduces a flashing blue light at the top of the screen; and (c) the third alert displays a large red icon with hands on the steering wheel and includes a red bubble with the message “Autosteer unavailable for the rest of the drive.”
If the driver does not grasp the steering wheel after the first request, after approximately 10 s the top left of the Autopilot display on the console flashes blue with progressively increasing intensity (Figure 1b), culminating in two pairs of beeps. If the second request for driver control is ignored, after approximately 5 s the small icon and text are replaced with a large red icon and red highlighted text (Figure 1c), accompanied by three pairs of beeps. The hazard lights then activate and the car will slow to a stop. The combined total alert duration from the first to the third alert is 15 s ( 23 ). The car is intended to begin the alert sequence within 400 elapsed milliseconds of the loss of lane markings under these circumstances ( 23 ).
Test Protocol
We created a demanding driving scenario on the NCCAR test track in which the Tesla vehicles encountered the disappearance of lane markings and subsequent extreme curves. The test setup included first a straight, marked section of track during which the vehicle could accelerate and engage automatic lane keeping and acceleration, followed by a series of sharp curves without lane markings intended to degrade the vehicle’s model of the roadway and force initiation of the driver-takeover sequence. To test the driver monitoring system, the driver did not respond to the alerts to take over control, but was ready to do so at any point a trial became unsafe. This test utilized a section of track at NCCAR including an approximately 600-ft straightaway followed by a series of sharp curves, the first with 350-ft radius over 120° and the second with 150-ft radius over 190° (Figure 2). Before data collection, a 330-ft section of straightaway was marked with highway-style white lane lines (10 ft long × 6 in. wide with 30 ft of longitudinal spacing between) to form three lanes 13 ft wide. The dimensions and curved radii were chosen because this test required a straight, painted section of track followed by sharp curves; the section of the NCCAR track illustrated in Figure 2 best matched the desired characteristics.
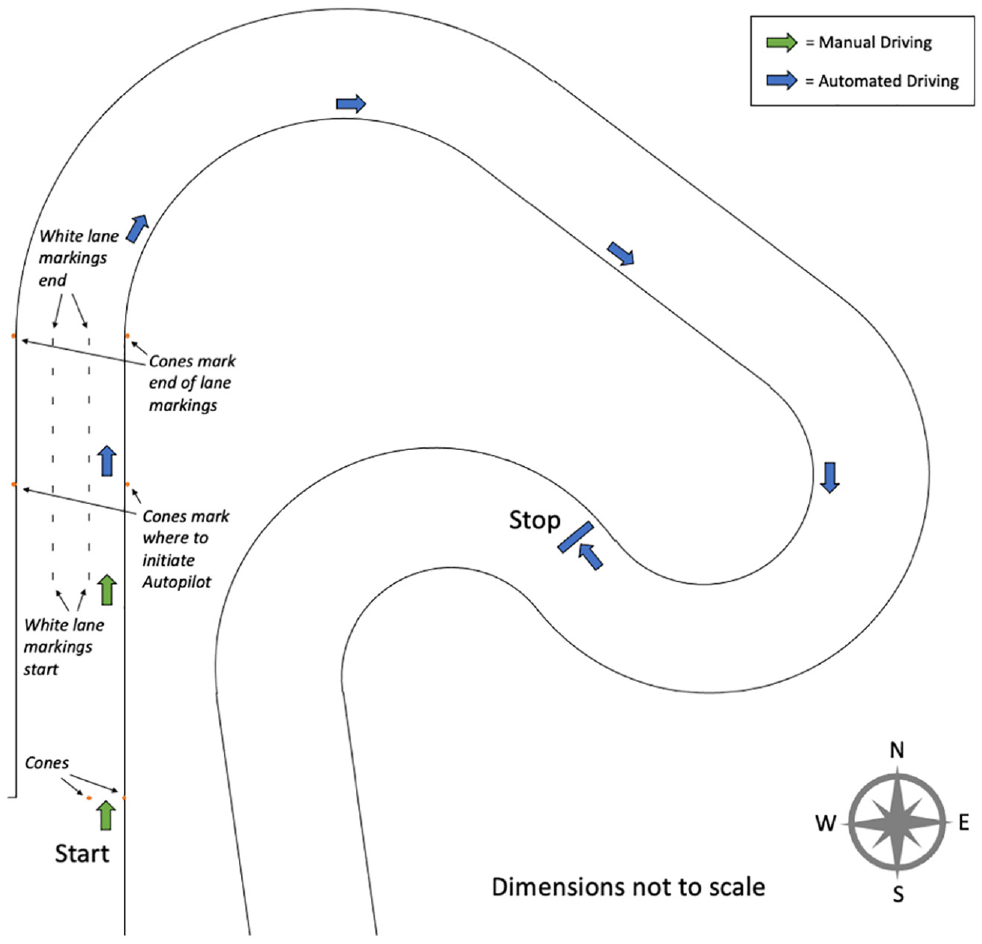
Configuration of test environment.
In each trial the vehicle began between a pair of traffic cones at the position marked “Start” in Figure 2, approximately 250 ft before the painted section of the track. Starting from its inactive, parked state, the vehicle was manually driven toward the painted lane lines in the inner most lane. After accelerating to 35 mph, the car was immediately placed in Adaptive Cruise Control to fix the speed. After passing the cones at the end of the fourth lane marking, Autopilot was activated. Painted lane markings terminated at the end of the straightaway, and the sharply curved portion of the track began immediately after the last painted lane marking to induce loss of lane tracking by the vehicle’s perception system. The car was allowed to operate without driver intervention until the system reached the third alert, which resulted in Autopilot shutting down the vehicle. Each vehicle was subjected to 10 repetitions of this test.
Data Collection and Analysis
Video data were collected using three GoPro Hero 7 Black cameras synchronized with a SyncBac Pro system and mounted at fixed positions in the vehicle interior. The first camera was mounted on the dashboard facing forward to monitor the roadway. The second camera was hung upside down from the sunroof facing forward to monitor the center console. The third camera was mounted behind the steering wheel facing backward to monitor the driver. All cameras were set to 1440 pixels per inch resolution, 25 frames per second, a wide field of view, and automatic stabilization, with Protune off. By turning off Protune, certain camera properties, such as the exposure, adjusted automatically in real-time, based on the light being received by the camera.
Videos were manually scored to identify the first frame at which events of interest occurred, and SyncBac timecode annotations were used to link the corresponding frames taken from different cameras. The events that were scored were the timing of each of the three alert stages and the time at which the vehicle first entered the initial curved portion of the track.
Although all tests were conducted during daylight with occasional cloud cover, the luminosity of the environment could vary during testing owing to the movement of the sun and clouds. Sensitivity to direct sunlight is a known vulnerability of vehicle perception systems (22, 24–26) and so changes in luminosity could theoretically account for some potential observed variation in performance. Therefore, we applied post hoc analysis of video frames to estimate the luminosity experienced by the vehicle’s sensors during the tests.
Luminosity describes the intensity of light emitted by an object, whereas luminance describes the light intensity in a particular area of a visual scene. Luminance is the more important measure that affects vehicle cameras because of its directional properties and can be exactly computed from the observed intensity of red, green, and blue light ( 27 ). Luma is the estimate of luminance that can be computed from digital images that have undergone gamma compression ( 28 , 29 ). To obtain the luma estimate from our data, we converted the videos from RGB to YCrCb color space using the Python OpenCV image processing toolkit ( 30 ), where the “Y” channel encodes the image’s luma. Other color models that encode light intensity, such as HSV, HSI, or HSL, do not match the perceptual qualities of brightness as effectively for certain colors ( 31 ), making YCrCb superior for estimating luminance (and thus luminosity) from images.
We restricted our analysis of brightness to only the top 380 rows of pixels in the images from the forward-facing roadway camera, which corresponded to regions of the visual scene exclusively containing sky. This was done to reduce the influence of observed variation in color intensity, such as from the shifting of the tree line or the appearance of distant objects. Several studies have shown strong results in image processing tasks using luminance-based color models, including for tasks related to perceiving pixels in the sky ( 32 – 36 ).
Results
For each vehicle, in every trial Autopilot presented a takeover alert and then following the driver’s unresponsiveness, successfully executed the risk mitigation maneuver by bringing the vehicle to a stop. The next sections will discuss the variations in the timing of the takeover alert sequence as well as the location at which it was presented.
Timing of Alerts
To determine the consistency of the three stages of alerts within and between cars, two measurements were used to assess the length of the alert sequence stages: the interval between the first and second alerts and the interval between the second and third alerts. Because the third alert coincided with the end of autonomous driving, no time measurements were taken past this point. The total duration of the alert sequence was also measured, which was the total interval between the first and third alerts.
Variation in the interval between the first and second alert was minimal and corresponded with the 10-s specification provided by Tesla, with a mean of 10 s and a standard deviation of approximately 0.1 s across the entire dataset (Figure 3a). A repeated measures analysis of variance (ANOVA) did not reveal any significant differences between or within cars across the different trials.
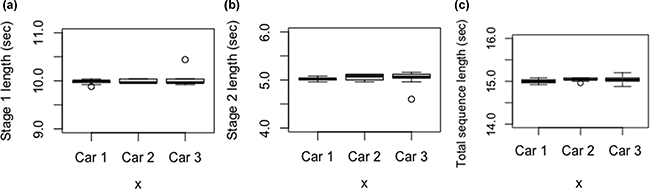
Duration of alert stages across cars: (a) duration of interval between first and second alert; (b) duration of interval between second and third (final) alert; and (c) duration of entire alert sequence.
The variation in the time between the second and third alerts was also small, although in a single trial Car #2 skipped this second alerting stage (Figure 3b), resulting in one significant outlier. Excluding this outlier, all three vehicles had a mean of 5.0 s and a standard deviation of 0.1 s, again matching the 5-s Tesla specification. A repeated measures ANOVA did not reveal any significant differences between or within cars across the different trials.
The variation in the overall duration of the alert sequence was also small, again with the exception of a single outlier in Car #2 (Figure 3c). The data for all three cars again closely matched the Tesla specification with a median duration of 15 s across the dataset. A repeated measures ANOVA did not reveal any significant differences between or within cars across the different trials.
Location of Alerts
Although we did not detect any meaningful variation in the timing of the takeover alert sequence once it was initiated, we did detect significant variation in the location where the first alert was initiated. Figure 4 shows the approximate location where the alert sequence was first initiated for each trial, with each trial represented with a car-specific indicator. As noted previously, all 30 trials began in the same place and at the same speed (35 mph), with Autopilot engaged.
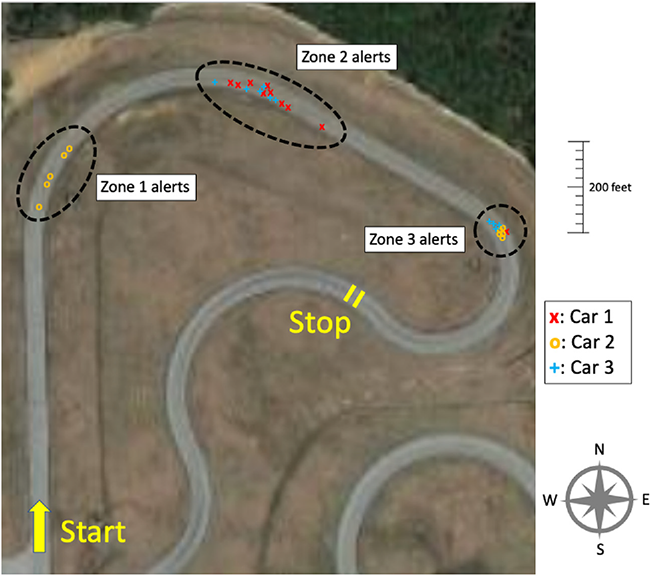
Approximate location of the first alert for each trial. Longitudinal position on the roadway is marked to scale, whereas the lateral variation is included only to aid visibility.
Figure 4 illustrates that there were three distinct areas where the first alert occurred, with separation between cluster centers. An iterative k-means analysis using 1 to 10 clusters and assessed with the Gap statistic yielded K = 3 statistical clusters (Figure 5). The first cluster (Zone 1) was centered at 121 ft after the beginning of the curve, with a range of 43 to 172 ft; the second cluster (Zone 2) was centered at 637 ft with a range of 609 to 768 ft; and the third cluster (Zone 3) was centered at 1,248 ft with a range of 1,240 to 1,255 ft. The distribution of distances for each car is shown in Figure 6a.
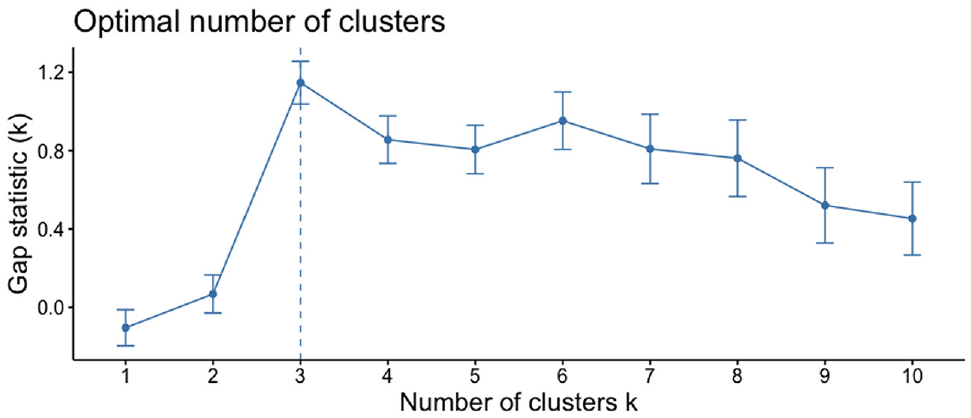
Optimal number of clusters in data for distance from curve to alert sequence initiation based on K-means clustering with the Gap statistic.
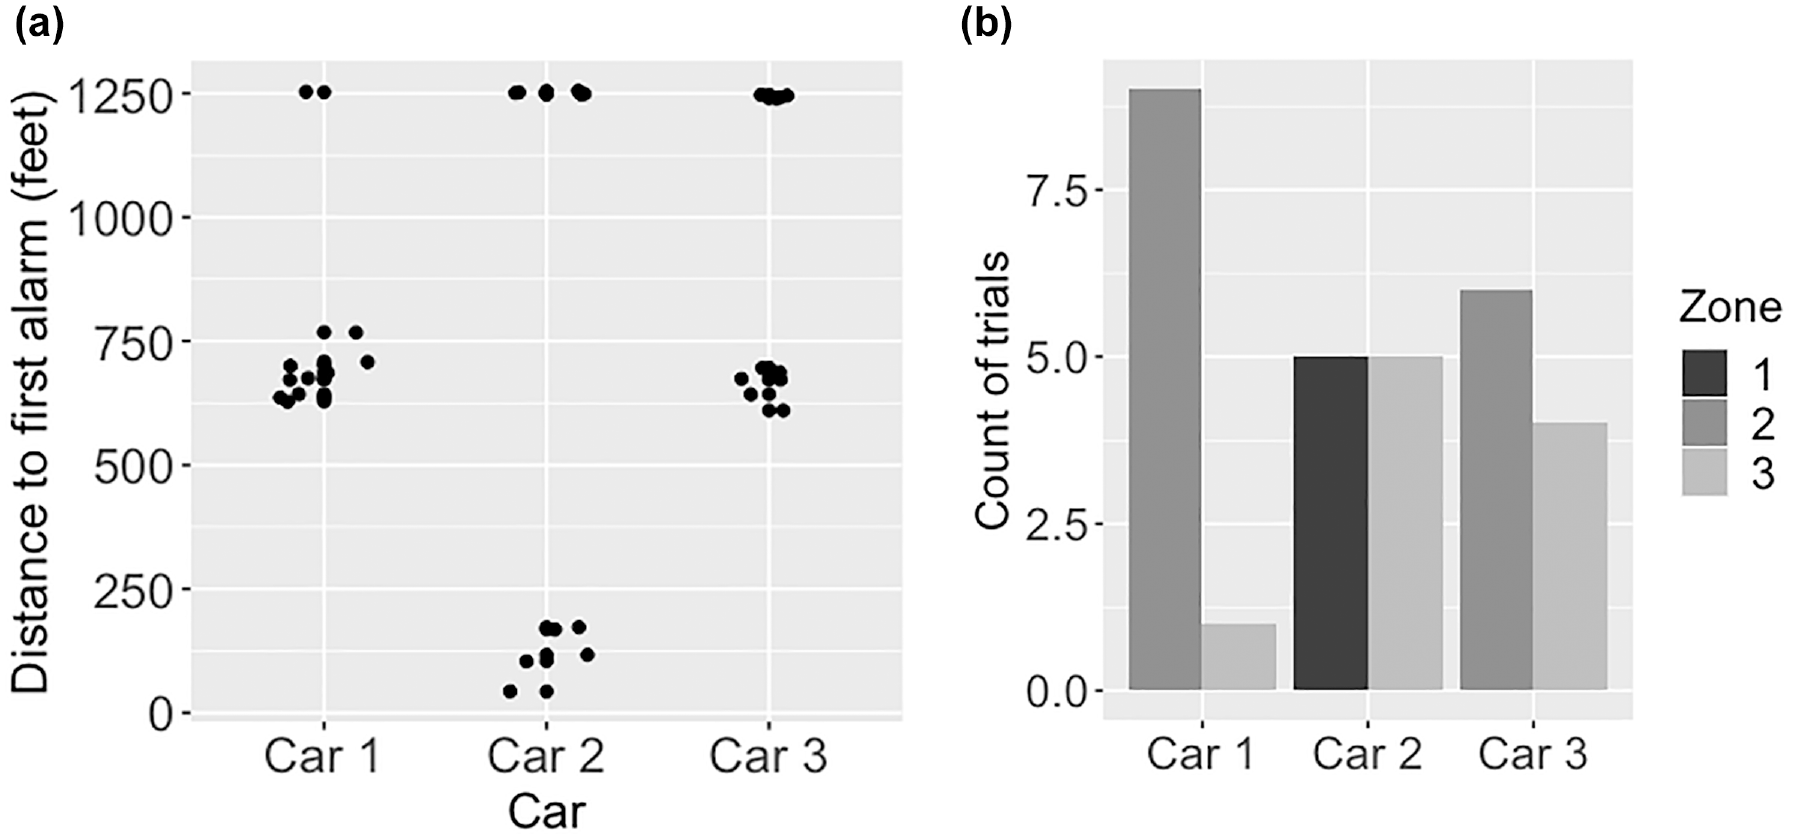
Position on the track for the first alert in the takeover sequence: (a) distribution of distance traveled by each car from the first curve until the first takeover alert is presented; and (b) the number of trials each car experienced an alert in each of the three initiation zones.
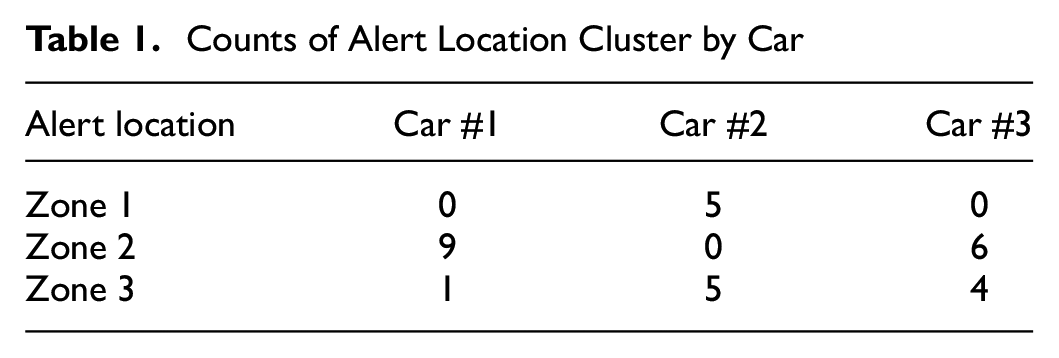
Clusters were not equally represented across cars: Car #1 and Car #3 experienced alert initiation points in Zones 2 and 3, whereas Car #2 experienced alert initiation points in Zones 1 and 3 (Table 1, Figure 6b). A chi-squared independence test revealed a significant difference in the counts between cars (χ2 = 22.4, p = 0.0002).
Counts of Alert Location Cluster by Car
Investigating the Different Initial Alert Locations
Given the statistically significant variation in where the cars first presented the takeover alert (Figure 5), we examined a small set of external variables that could affect vehicle perception and thus the reaction to loss of lane markings. In particular, although trials were balanced for general weather conditions, there was potential for small variations in atmospheric lighting across trials from movements of the sun and clouds.
To this end, we first examined whether there was any difference between the luminosity experienced by cars with and without alerts in Zone 1. To do this, we computed the luma observed by each car as outlined in the Methods section for the 150-ft segment of track immediately preceding Zone 1, a distance corresponding to roughly 3 s of driving before the alert. An analysis of covariance model was developed with the luma as the dependent variable and the alert zone as the main factor. Sun angle (azimuth), based on the date and time each trial was conducted, was included as a covariate because it has been cited as a potential contributor to perception degradation in Autopilot ( 37 ).
The results were marginally significant (F([1,27] = 3.87, p = .06 with an alpha of .05), suggesting that the trials with alerts in Zone 1 may have experienced different brightness levels than those without alerts. The sun angle covariate was marginally significant (F[1,27] = 3.39, p = .08). Cars that presented an alert in Zone 1 observed a mean estimated luma of 178 whereas cars that did not present an alert in that zone observed a mean of 163. The mean sun azimuth was on average 23° less (189° versus 212°) in trials with an alert in Zone 1 compared with trials without an alert in that zone. Thus, one possible influencing factor is not only how much brightness is experienced when lane lines are lost, but also the direction of the sun.
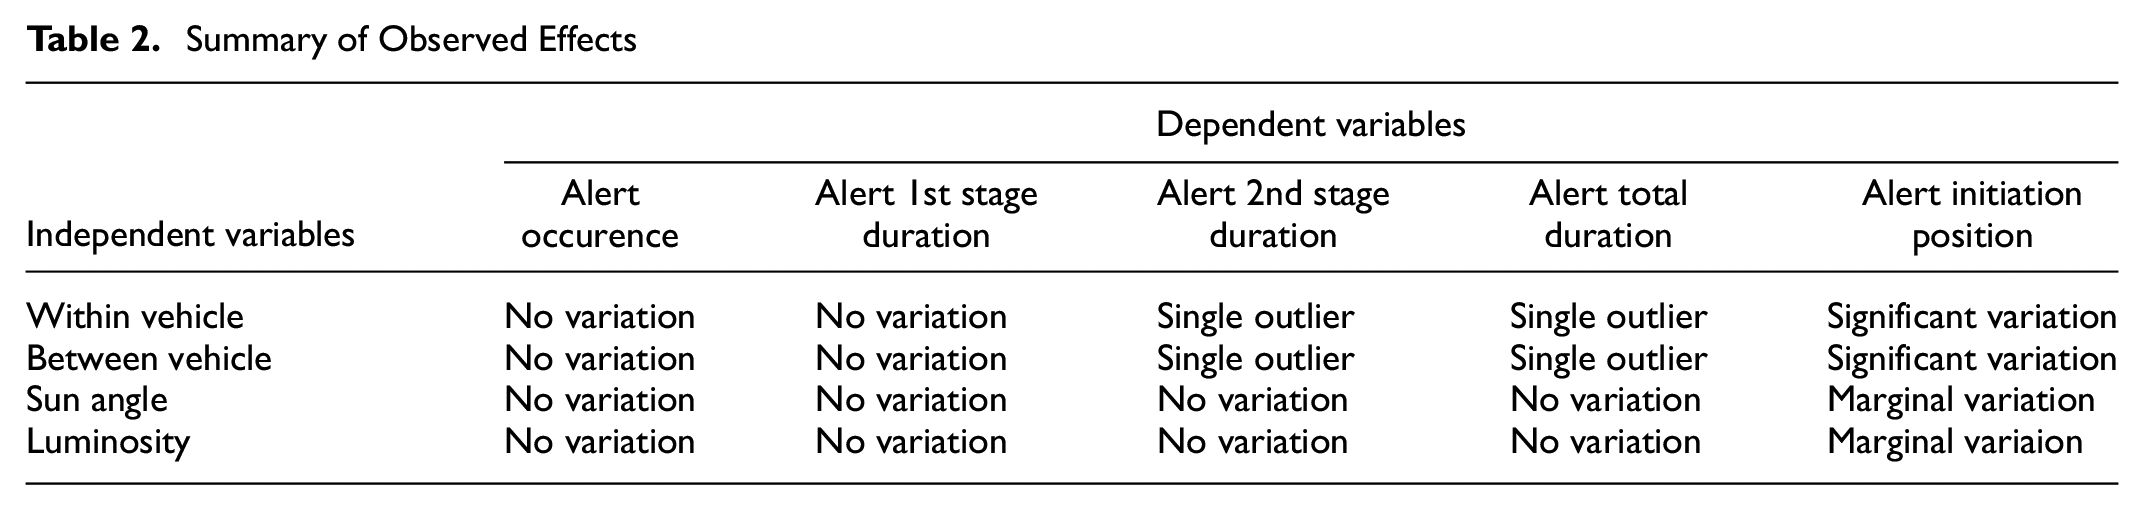
A backward logistic regression (LR) model was used to predict whether the alert occurred in Zones 1 and 2 as a function of sun angle and brightness in the 3 s before each alert. In this model, luma was also marginally significant (p = .06, B =−.176) and sun angle was not (model accuracy = 85%). Because LR models produce regression coefficients for each feature that are log odds, taking the exponential of the coefficient weights estimates the expected change in the log odds of the target variable per unit increase in the corresponding predictor variable, holding the other predictor variables constant. This means that as luma increased by one unit, there was a 12% increase in the likelihood the car would experience a Zone 1 initial alert. Table 2 summarizes the main observed effects.
Summary of Observed Effects
Discussion
This study found that presentation of the takeover alert sequences, once initiated, was consistent between and within vehicles. The takeover alert sequence successfully activated in all 10 trials of the three vehicles studied, and these takeover alerts were nearly identical across every trial and vehicle. In all 10 trials for Cars #1 and #3, the alert sequence contained all three of the expected stages (Figure 1) without any variation in the types of sounds or icons that were presented. For Car #2, the second alert stage was skipped in a single trial whereas in the other nine trials the takeover alert contained all the expected stages.
Although takeover alerting was consistent once initiated, the occurrence of the alerts was neither consistent within a single car nor across all three cars. This is especially noteworthy since all trials were conducted on the same section of track, under standardized conditions, at the same time of day, and under approximately equivalent weather conditions. Distances between the end of marked lanes and the initial alert could be as short as 43 ft (13 m) and as long as 1,255 ft (383 m). Moreover, in 30% of trials, cars traveled for 26 s after the loss of lane markings before warning the driver. Loss of lane markings during Autopilot operation has been cited as a potential failure mode in at least one previous crash ( 23 ).
The significant degree of variability across and within cars is puzzling, as it implies additional external factors beyond the lane markings themselves. In particular, it was not clear whether the alerts in Zone 2 were delayed responses from the loss of lane markings in the straightaway or distinct responses to a different stimulus. It was also unclear what caused the Zone 3 alerts, which occurred 26 s after the loss of lane markings, or why these alerts showed substantially less positional variation than alerts in the other two zones. This phenomenon could be indicative of an interaction between the computer-vision system and steering angle saturation, since these alerts occurred at the most severely curved section of the route, although this was not evaluated in the present study.
Although our study design ruled out the influence of overtly varying weather conditions, we considered whether more subtle atmospheric variation was a contributing factor. There was some evidence of luminosity and sun angle having an influence on alert timing when comparing Zone 1 alerts with Zone 2. Sunlight has been shown to cause anomalies in the perception systems used in autonomous vehicles (22, 24–26), so it is possible that sun angle could contribute to a camera system’s degradation. Although these results suggest that there could be an important connection between luminosity, sun angle, and the triggering of camera vision-based alerts, more work is needed to further investigate these findings and is the focus of future work.
Individual variability within cars was high and there was no consistency in the location of alerts for any of the three cars. Cars #1 and #3 experienced alerts in Zones 2 and 3, whereas Car #2 experienced all Zone 1 alerts and 56% of Zone 3 alerts. It should be noted that Car #2 was equipped with the Full Self-Driving hardware chip whereas the other vehicles were not, though the Full Self-Driving software was not deployed at the time of testing. Additionally, the owner had complained about previous issues in which the vehicle would pull to the right if driven on Autopilot within a few hours of supercharging. These issues had been reported to Tesla, and the vehicle had been brought in for service and ostensibly repaired in the weeks before our tests. This issue highlights that although the vehicles tested were all the same make, model, and year, they were not identical machines. They all had slightly different hardware configurations, and because of Tesla’s over-air update policy, all were running different versions of the Autopilot software.
Limitations
One limitation to our approach is that the camera used to obtain the luma values automatically adjusted its exposure to equalize the appearance of images despite differences in available light. Although we did detect variations in luma of up to approximately 20% across images, this this post hoc analysis may not have captured the true variation in light across the different scenes. Assessment with standardized light meters is the focus of future work. In addition, the vulnerability of lane tracking systems to different sun angles deserves further scrutiny, as well as the interaction between computer-vision systems and steering wheel angle saturation.
A second limitation is that this study relied on a relatively small sample of a single automobile. Our objective was to demonstrate the possibility of inter- and intravehicle variation affecting performance outcomes, not to robustly characterize the parameters of this variation. Therefore, although we do hope to explore variation in other Level II vehicles as they become more widely available, we believe that the evidence provided here should still encourage regulators to review their sampling and replication methodologies to ensure that safety tests are representative of larger vehicle populations.
Conclusions
Although there is significant potential for ADAS systems that rely on computer visions to improve safety, fatal accidents continue to occur when vulnerable perception systems fail, especially when combined with inattentive drivers and use outside of intended operational driving domains ( 23 , 38 ). This study assessed the behavior of Tesla Model 3 vehicles during the transition from automated to manual driving when human drivers were alerted that they needed to take control after the loss of lane markings. We investigated whether there were differences in the takeover sequence between different cars as well as within cars and examined whether subtle variations in atmospheric lighting could have played a role in performance variation.
This study demonstrated that once vehicles initiated the three-stage driver-takeover alerting sequence in response to loss of lane markings, all cars reliably executed a highly similar takeover alert sequence and stopped the car when the driver did not respond to the alerts. However, there were significant differences across the cars as well as between trials of the same car as to how quickly the vehicle responded to loss of lane markings before initiating this alert sequence. Since vehicles were consistent on all Autopilot- and alert-related settings and since vehicle software did not vary between successive trials of the same car, it is unlikely that any other internal vehicle differences contributed to the observed effect.
In the 30 trials, the first alert requesting handover of control from the car to the driver occurred up to 0.25 mi from the loss of lane markings and could take up to 26 s. A previous accident demonstrated that fatal accidents can occur with as little as 6 s of driver inattention once vehicle lane tracking has failed ( 23 ). Though the Tesla vehicles in this study did successfully avoid catastrophic outcomes, they nonetheless operated outside their design specifications for periods long enough to potentially jeopardize the safety of an inattentive driver. Manufacturers of ADAS systems need to be vigilant in ensuring perception systems reliabily recognize when they are operating outside of their competency boundaries and immediately notify the driver.
This study also demonstrated that there might be important relationships between luminosity and sun angle and when a car may alert drivers to a loss of lane markings. This reflects the larger issue of brittleness in computer-vision systems and the need to determine how changes in the environment can degrade outcomes. To this end, future research should include dedicated measurement devices for assessing brightness, as consumer-grade video cameras may not have adequate perceptual power to discriminate between different light intensities. Also, more dedicated, realistic testing is needed for both the cameras and the integrated systems to ensure that such wide variability as seen in this study is understood and mitigated.
More broadly, this research highlights the potential for significant variability between individual vehicles of the same make, model, and year, as well as the inconsistent behavior of a single vehicle. Current practices for certifying vehicle safety generally rely on testing only a single car, and generally limit testing to major design changes, rather than testing all unique vehicle variants. For complicated components like ADAS systems, this practice may fail to identify the full range of possible behavior in vehicles as it may not detect flaws that are either latent or inconsistent. Moreover, individual vehicles may not behave consistently across repeated observations and incorrect conclusions may be drawn from relying on a single vehicle and software configuration. The important roles of individual vehicle differences and intravehicle consistency should be considered as testing standards for ADAS and associated alerting continue to develop.
Footnotes
Acknowledgements
We were assisted by Sam True, the director of the North Carolina Center for Automotive Research, and Matthew Seong, Kausthub Ramachandran, and Vishwa Alaparthy in the collection of the data.
Author Contributions
The authors confirm contribution to the paper as follows: study conception and design: B. Bauchwitz, M. Cummings; data collection: B. Bauchwitz; analysis and interpretation of results: B. Bauchwitz, M. Cummings; draft manuscript preparation: B. Bauchwitz, M. Cummings. All authors reviewed the results and approved the final version of the manuscript.
Declaration of Conflicting Interests
The authors declared the following potential conflicts of interest with respect to the research, authorship, and/or publication of this article: At the time of this research, Professor Cummings was a member of the Veoneer Board of Directors, a Tier 1 automotive supplier. She currently holds no positions or stock in this company.
Funding
The authors disclosed receipt of the following financial support for the research, authorship, and/or publication of this article: This research was funded by a U.S. Department of Transportation’s University Transportation Center grant through the University of North Carolina’s Collaborative Sciences Center for Road Safety. Aspects of this work have previously been disclosed in a technical report issued to the Sponsor, which is available here: ![]() .
.