
Abstract
The increasing accessibility of mobility datasets has enabled research in green mobility, road safety, vehicular automation, and transportation planning and optimization. Many stakeholders have leveraged vehicular datasets to study conventional driving characteristics and self-driving tasks. Notably, many of these datasets have been made publicly available, fostering collaboration, scientific comparability, and replication. As these datasets encompass several study domains and contain distinctive characteristics, selecting the appropriate dataset to investigate driving aspects might be challenging. To the best of the authors’ knowledge, this is the first paper that performs a systematic review of a substantial number of vehicular datasets covering various automation levels. In total, 103 datasets have been reviewed, 35 of which focused on naturalistic driving, and 68 on self-driving tasks. The paper gives researchers the possibility of analyzing the datasets’ principal characteristics and their study domains. Most naturalistic datasets have been centered on road safety and driver behavior, although transportation planning and eco-driving have also been studied. Furthermore, datasets for autonomous driving have been analyzed according to their target self-driving tasks. A particular focus has been placed on data-driven risk assessment for the vehicular ecosystem. It is observed that there exists a lack of relevant publicly available datasets that challenge the creation of new risk assessment models for semi- and fully automated vehicles. Therefore, this paper conducts a gap analysis to identify possible approaches using existing datasets and, additionally, a set of relevant vehicular data fields that could be incorporated in future data collection campaigns to address the challenge.
Keywords
Connected and automated vehicles (CAVs) have been posited to make mobility safer, and more environmentally friendly, accessible, and efficient. However, objective evidence, or data, to support these claims often proves difficult to obtain. The reasons are many—customer privacy, business privacy, intellectual property, cost, or ethical considerations. This paper critically reviews the existing literature and open data sources concerning distinct vehicular automation levels. The datasets are analyzed concerning their primary data characteristics, availability, and study domains, enabling scientific comparability and replication. In the spectrum of the state-of-the-art of vehicular automation, two principal datasets categories are identified: naturalistic driving datasets covering traditional driving, and training datasets for autonomous driving tasks.
Naturalistic driving studies (NDS) are on-road empirical investigations undertaken to provide insight into traditional driving aspects, such as driver behavior during everyday trips, by recording driving data through unobtrusive data acquisition systems (DAS) and without experimental control. In these studies, the participants drive as normal while the system continuously monitors their driving maneuvers (e.g., speed, acceleration, yaw), driver behavior (e.g., eye, head, and hand movements), and external conditions (e.g., road, traffic, and weather characteristics) ( 1 ). Similarly, field operational tests (FOTs) are another methodology commonly used for transportation research. The difference lies in that FOTs assess intelligent transportation systems in real-world conditions according to their acceptance, efficiency, quality, and robustness. Furthermore, FOTs follow a certain methodology for the study design and their respective experiments, generally the FESTA methodology ( 2 ). Both NDS and FOT are designed to investigate essential research objectives, such as improving road safety, transportation planning, and eco-driving ( 3 – 8 ). Since their ultimate objective is similar to this research’s scope, the terms are used interchangeably throughout the paper.
Because of the significant advances in software and hardware for driving automation, a proliferation of vehicles with self-driving features has been observed in the last decade. This has completely changed the sense of NDS since the main goal of performing those studies is no longer to understand the interaction between the driver and the vehicle, but to collect significant amounts of in-vehicle and contextual data to evaluate the performance of automated driving tasks. Even though full autonomy is still a few years away, semi-automated features are already deployed in some vehicles, and promising prototypes of higher autonomy levels are being tested in some cities ( 9 ). Alliances between transportation organizations, software companies, and original equipment manufacturers (OEMs) continue to develop, accelerating the process. Therefore, having access to comprehensive large-scale datasets constitutes a major factor in training self-driving tasks. More importantly, challenging scenarios that might affect driving performance and safety (e.g., adverse weather conditions) become essential to ensure the self-driving task’s robustness and generalization. Intending to share research efforts, both the research community and commercial stakeholders have been actively collaborating to make such datasets publicly available. As a result, an increasing number of datasets have become available for research teams worldwide, enabling innovation, collaboration, scientific comparability, and replication.
The wide variety of datasets for distinct automation levels and study domains makes selecting the most appropriate dataset for investigation a time-consuming process. Having a description of them in a single place would be a significant resource for the research community. This research paper addresses this problem by systematically reviewing 103 vehicular datasets with their principal characteristics and study domains. The naturalistic driving datasets included in this paper cover traditional driving characteristics, mainly centered on studying road safety, although some also focus on transportation planning and eco-driving domains. As for autonomous driving, a variety of study domains is covered according to the target self-driving tasks of the datasets. These study domains include object tracking and detection, computer vision (stereo and 3D vision), semantic segmentation, driver behavior and human-machine interaction (HMI), lane and road detection, simultaneous localization and mapping (SLAM), optical flow, and end-to-end learning.
Importance is also attached to a particular field of usage for this data—the motor insurance market. The proliferation of telematics platforms and access to vehicular datasets have provided insurers with valuable information to build risk profiles. Usage-based insurance (UBI) frameworks have enabled detailed policyholders’ segmentation, and, thus, more accurate and competitive insurance pricing. Nevertheless, in a vehicular ecosystem transitioning to autonomous vehicles (AVs), the predictive power of such frameworks is being challenged because of the emerging risk factors. Therefore, the need for a framework covering different levels of automation becomes increasingly relevant for a successful adaptation to the vehicular transition. To address this need, this paper assesses data-driven risk assessment methods for various levels of automation. However, while there have been numerous publicly available datasets for training self-driving vehicles, there exists a lack of datasets to study driving aspects on the intermediate level of automation, such as the interaction with automation systems and the response to take-over requests. Therefore, the paper suggests desirable trip features for future data collection campaigns of intermediate-to-high automation levels and proposes alternative approaches for using the surveyed datasets in risk assessment modeling for CAVs.
The remainder of the paper is organized as follows. The next section presents related works reviewing naturalistic driving datasets and training datasets for autonomous driving. The section after that introduces the methodological approach to extend on previous reviews and build the surveyed datasets list. The following section elaborates a comparison of naturalistic driving datasets and datasets for autonomous driving tasks, covering their primary information and study domains. The penultimate section proposes applications of these datasets for the data-driven risk assessment domain and sets up the basis for future work in the topic. The paper is concluded in the final section.
Related Work
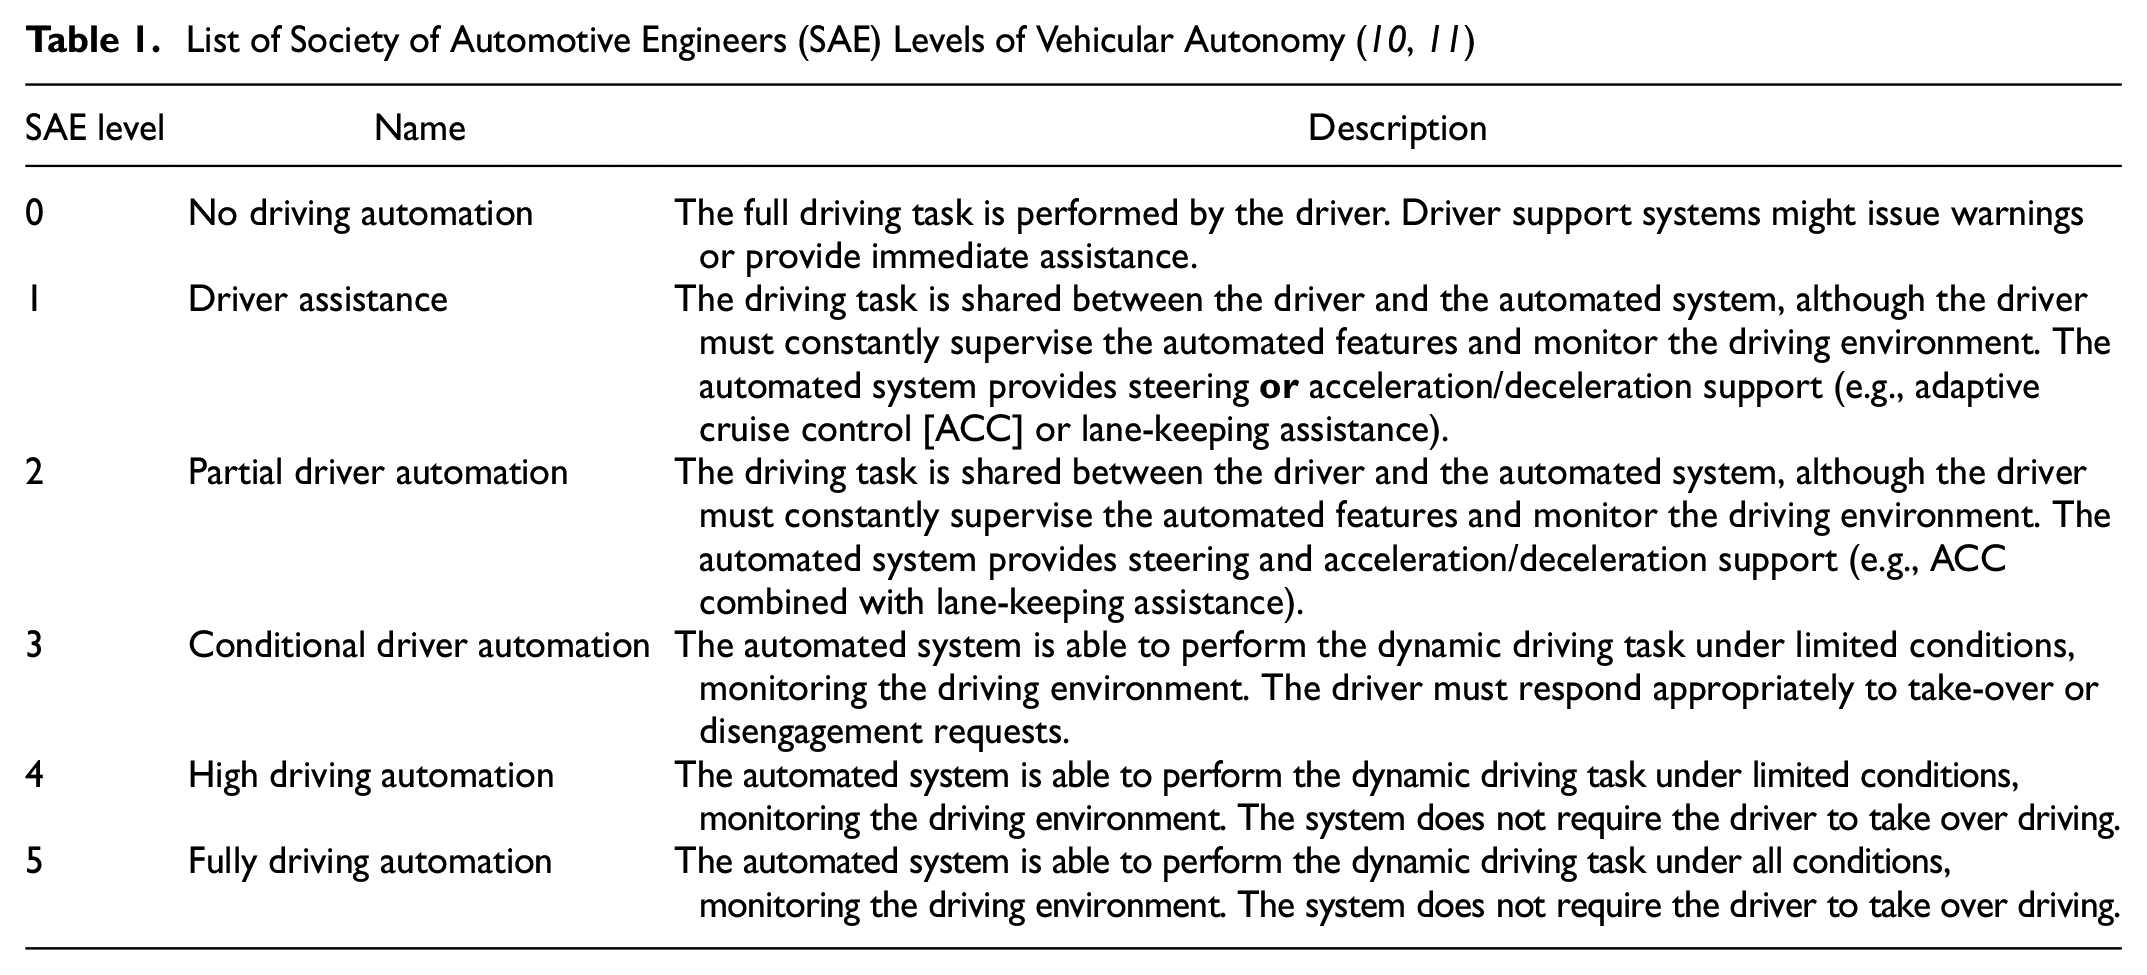
Aiming to standardize the different levels of vehicular automation, the Society of Automotive Engineers (SAE) has defined six levels of automation, ranging from no automation or fully manual (Level 0) to fully autonomous (Level 5) ( 10 , 11 ). This definition has guided automotive stakeholders in the deployment of CAVs and become the de facto global standard. The level of automation is defined based on the role of the primary actor performing the driving task (i.e., based on the required human supervision and intervention). A description of each level is presented in Table 1. Throughout the paper, traditional driving and autonomous or self-driving refer to SAE level 0 to 1 and SAE level 4 to 5, respectively.
The accelerated progress in CAV technology innovations has been accompanied by a profusion of NDS covering a broad spectrum of research topics oriented to traditional driving. Grimberg et al. performed a comparative review of 26 of such studies using five study domains: (i) crash and near-crash analysis, (ii) driving style, (iii) driver inattention, (iv) exposure, and (v) environmental factors ( 12 ). The authors focused on the advantages and disadvantages of using smartphones and in-vehicle DAS in naturalistic driving campaigns, although they did not provide descriptions of each dataset. NDS published between 2006 and 2014 were systematically reviewed in the work of Simmons et al. ( 13 ). The authors conducted the review focusing on driver distraction using mobile phones, filtering out other studies, and as a result, six NDS were investigated and compared. Driving distraction was also included in a comprehensive review by Singh and Kathuria ( 14 ). The study assessed NDS carried out before September 2020 with a focus on the effects of driver distraction, driver characteristics, road infrastructure, weather, vehicle features, and law enforcement.
In parallel, the variety of endeavors involved in self-driving tasks has motivated the collection of datasets in multiple study domains, such as in computer vision and motion prediction. Yurtsever et al. surveyed self-driving software and hardware practices and presented a summary of simulation tools and available datasets ( 15 ). In total, 18 datasets were compiled, including three naturalistic driving datasets. The authors compared the datasets in relation to data features with train CAV algorithms such as availability of images, lidar data, and 2D annotations. Yin and Berger performed a more comprehensive survey of publicly available CAV datasets ( 16 ). The study included an overview of 27 datasets useful for training autonomous-driving algorithms, containing open data collected by sensors (e.g., camera, lidar, radar) on public roads since 2009. The authors compared them in relation to (i) time and venue, (ii) size, (iii) traffic conditions, (iv) sensors, (v) data format, (vi) provided resources, (vii) number of citations, and (viii) software license. Kang et al. extended this study by adding 10 more datasets, and one more layer of comparison: typical application scenarios ( 17 ). Moreover, the authors performed an extensive discussion of the 37 resulting datasets, and, as future work, they proposed to perform a standardized representation of the datasets to enable comparison of a system using several datasets. Guo et al. presented a comparative overview of 54 publicly available datasets intended for training autonomous driving algorithms ( 18 ). The datasets were classified according to the following autonomous driving tasks: (i) stereo/3D vision, (ii) optical flow, (iii) object detection, (iv) object tracking, (v) lane/road detection, (vi) semantic segmentation, (vii) localization/SLAM, (viii) end-to-end learning, and (ix) behavior analysis. The authors also highlighted the datasets that capture complicated and hazardous driving conditions, which can be useful for training robust self-driving models.
To the authors’ knowledge, this is the first systematic review of datasets covering the whole spectrum of vehicular automation, from naturalistic driving datasets focusing on traditional driving (SAE level 0–1) to training datasets for autonomous driving (SAE level 4–5). This research extends previous reviews through a systematic review of 18 NDS carried out with instrumented vehicles, 17 carried out with smartphones or dash-cams, and 68 datasets intended for training autonomous driving tasks. Furthermore, the accessibility of the data is analyzed for their potential use in various transportation research domains. In particular, this research focuses on the datasets’ application to data-driven risk assessment and proposes approaches to fill the risk modeling gap for different vehicular automation levels.
Methodology
A systematic methodology for acquiring datasets for review enables reproducibility and transparency. The rapid advance of vehicular technologies and the demand for telematics data indicate that the number of vehicular datasets will continue growing in the coming years. While results in web searches may vary, inclusion and exclusion criteria remain deterministic. The main objective of this section is to describe the methodology used to collect both naturalistic driving datasets and datasets for autonomous driving, highlighting the studies taken as initial references and the process to extend them.
Naturalistic Driving Datasets
The NDS selection has been performed following a methodological approach comprising four phases, as shown in Figure 1. The first phase has consisted of collecting the NDS found in peer-reviewed surveys. The works of Grimberg et al., and Singh and Kathuria have been taken as a reference, since they contained a detailed comparison of 26 NDS and seven large-scale NDS, respectively ( 12 , 14 ). To reduce publication bias, the second phase has extended this list through separate academic searches, using Google Scholar, Semantic Scholar, and ResearchGate databases. The main objective has been to cover studies that were not included in former surveys. Analysis of the main characteristics of the preliminary list has been performed to find the proper search keywords. Since the list included studies conducted mostly in the U.S., Europe, and Australasia, and no FOT, this phase has paid more attention to naturalistic FOT projects and NDS in areas with little evidence of such studies, for example, South America and South Africa. In total, three more datasets have been added to the list with this step. The third phase has aimed at finding citations to other datasets in the respective publications or websites of the collected datasets, yielding three more datasets.
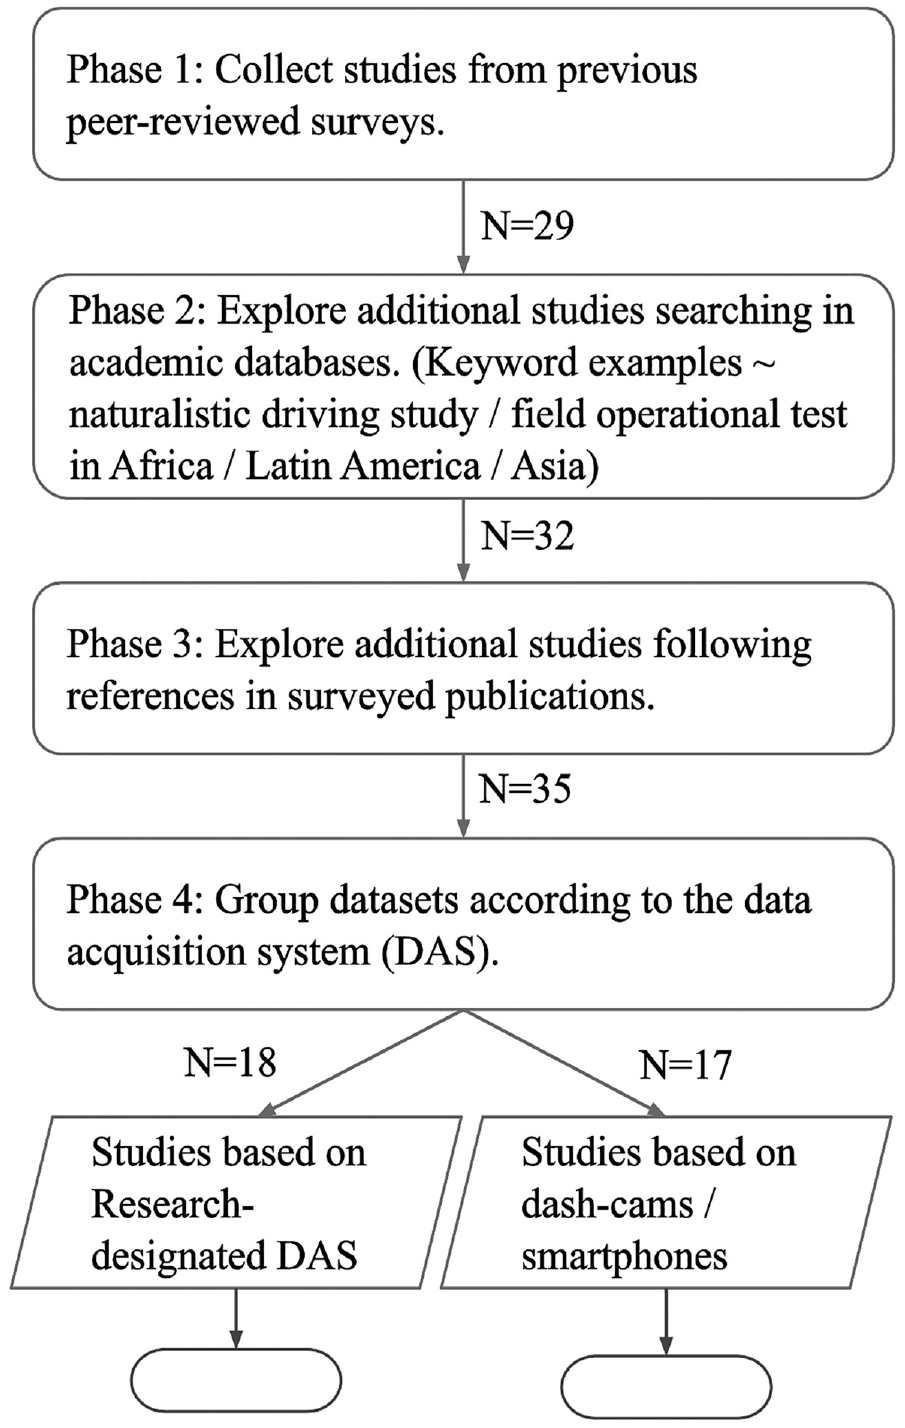
Flow chart of the naturalistic driving datasets selection.
The fourth phase has focused on grouping studies according to their DAS, namely, research-designated and dash-cam or smartphone DAS. The data collection campaigns conducted with research-designated systems generally acquire a considerable number of data types and encompass programs supported by transportation organizations or consortia that focus on multiple transportation domains (e.g., environmental impact, transportation planning, road safety). Thus, studies carried out with dash-cams or smartphones (N = 17) have been analyzed separately because of their niche research objectives. As a final filtering criterion, the datasets have been verified for the availability of information on the number of participants or vehicles, although all of them met this criterion.
Datasets for Autonomous Driving Tasks
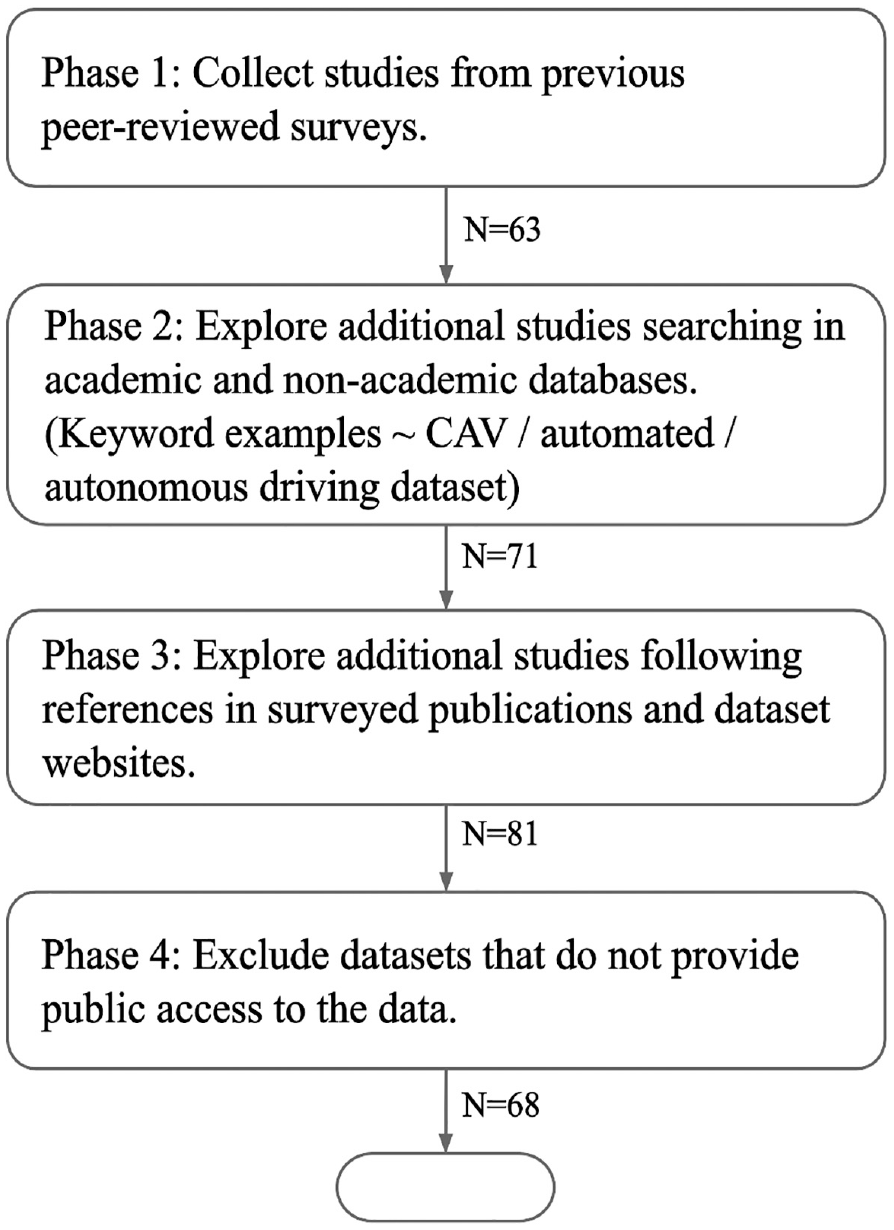
Figure 2 presents the process of selecting datasets focused on training self-driving tasks. The methodology has been like the naturalistic driving datasets selection described previously. In this case, the works of Kang et al. and Guo et al. have been taken as the reference for the datasets selection, since they have been the most recent and comprehensive reviews ( 17 , 18 ). Then, additional search phases have been included to reduce publication bias. After surveying the datasets presented in those reviews and collecting new datasets, the list included 81 datasets. Those datasets which did not provide public access or did not collect data from a vehicle have been excluded, resulting in 68 final datasets.
Flow chart of the process of selecting datasets for autonomous driving tasks.
Out of the 36 datasets reviewed by Kang et al., 27 have been covered by Guo et al. ( 17 , 18 ). Therefore, the first phase has consisted of building a preliminary list with the union of both reviews, accumulating 63 datasets. The second phase has focused on extending this list through web searches. Since many of the published datasets have been provided by commercial stakeholders, academic and non-academic search engines have been considered (Google, Google Scholar, Semantic Scholar, ResearchGate). Eight more datasets have been included as a result of this step, with all of them published between 2019 and 2021. References or citations to other datasets have been considered while assessing the preliminary list. Because of the rapid advance of self-driving technology, several research teams have released updated versions of the published datasets or even new data collection campaigns. Furthermore, many of the surveyed datasets are accompanied by publications that often included benchmark comparisons with other datasets. Assessing such publications has helped discover 10 more datasets.
The last step has excluded datasets that did not provide public access to the data or whose data were not recorded from a vehicle. In some cases, the dataset sites were obsolete, inaccessible, and had broken links or no information to get the data, and were, therefore, discarded. As a result, 68 datasets have remained in the final list, 14 more than the most extensive review so far ( 18 ).
Review of Datasets and Use Cases
The proliferation of telematics solutions has enabled data-driven research on transportation fields such as traffic optimization, eco-driving, road safety, and, more recently, automated driving. Research teams have been publishing their datasets characteristics, which have served as a benchmark and inspiration for a growing number of researchers. Nevertheless, performing data collection campaigns remains limited to the community because of their complexity and the substantial number of resources needed. While many of these datasets are private, there is an increasing effort to distribute access to such datasets, and several organizations and researchers have started making them publicly available.
This section presents a review of two types of vehicular datasets along with their study domains and data availability: on one hand, naturalistic driving datasets focusing on traditional driving, and, on the other hand, datasets for training autonomous driving tasks. Many of the datasets conducted for training self-driving tasks have been conducted with traditional vehicles in human-driven mode. The criteria for deciding whether a given dataset belongs to the AV category have been: (i) the main research goal mentioned in the respective publications or official websites pointed to autonomous driving tasks, or (ii) the dataset contained only data from cameras or lidar.
Naturalistic Driving Datasets
NDS have been an object of study in transportation research since the deployment of telematics solutions. The analysis of driving patterns, driver behavior, and contextual information has enabled insights in essential transportation domains. For instance, insights into road safety led to measures that helped decrease road fatalities considerably ( 19 ). This section presents an overview of such studies, along with a comparative analysis of their main characteristics and study domains. As these studies focus on fully manual vehicles with no automation, or with limited driving support, they can be classified as SAE level 0 and 1 datasets.
Datasets Collected in the U.S
The first large-scale and comprehensive NDS was the 100-Car study in the U.S. ( 20 ). It consisted of 108 instrumented vehicles and 241 primary and secondary drivers between 18 and 71 years old. The drivers were monitored for 12–13 months, accumulating around 3 million km, 69 crashes, 761 near-crashes, and 8,295 safety-relevant incidents (i.e., a maneuver less hazardous than a near-crash). The driving data have been collected using the Virginia Tech Transportation Institute (VTTI) DAS, which included data from the Global Navigation Satellite System (GNSS), Controller Area Network (CAN-bus), radar, in-vehicle and external video recordings, lane tracking system, accelerometer, and gyroscope. Remarkably, the dataset has been made publicly available ( 21 ).
The Second Strategic Highway Research Program (SHRP2) NDS has emerged as a continuation of the 100-Car study and has been the largest open database for naturalistic driving data ( 22 , 23 ). It collected around 50 million km and 2 petabytes of driving data from 3,239 drivers and 3,370 vehicles between 2010 and 2013. Volunteers participating in the study were people from six regions across the U.S. (Florida, Indiana, New York, North Carolina, Pennsylvania, and Washington), ranging from 16 to 90 years old. The collected features encompassed time-series data (e.g., acceleration, turn rates, location), video recordings (e.g., driver’s face, forward roadway), driver questionnaires, vehicle information, trip summaries, and context information for crashes, near-crashes, and conventional-driving events. Similar to the 100-Car, the dataset has been made publicly available, although it requires the applicant to apply for qualified research status ( 24 ).
Fitch et al. have performed the first research that merged naturalistic driving data recorded with the VTTI DAS with mobile phone activity ( 25 ). The authors tracked 204 drivers who reported using the mobile phone while driving at least once per day. The data collection took place between February and November 2011, covering around 31 days per driver on average in Virginia and North Carolina.
Between 2009 and 2014, the University of Michigan Transportation Research Institute conducted two FOTs: the Integrated Vehicle-Based Safety Systems (IVBSS) and the Safety Pilot Model Deployment (SPMD). The former was a data-collection program that assessed the safety performance and acceptance of in-vehicle crash warning systems for light vehicles and heavy commercial trucks ( 26 ). In particular, the study focused on forward-collision warning (FCW), lateral-drift warning, lane change-merge warning, and curve speed warning. The data collection took place between February 2009 and December 2009 for heavy trucks, and between April 2009 and May 2010 for light vehicles. The research included 10 heavy vehicles and 20 drivers who collected driving data over 10 months, and 16 instrumented light vehicles and 108 drivers that were monitored for 40 days. On the other hand, the SPMD focused on connected vehicle safety technologies ( 27 ). This large-scale study collected data from approximately 2,800 highly instrumented vehicles and 29 instrumented road sites between 2012 and 2014 in Michigan. In particular, the study contained a wide variety of data types, including vehicle-to-vehicle (V2V) and vehicle-to-infrastructure (V2I), telematics, collision warning systems, and contextual data such as weather conditions and traffic flow. Two months of this dataset have been made publicly available under the Creative Commons Attribution-ShareAlike 3.0 license ( 28 ).
The Naturalistic Teenage Driving Study (NTDS) has been the first study that followed teenage drivers continuously for 18 months after acquiring their driving license ( 29 , 30 ). The study has aimed at investigating crash and near-crash exposure and comparing it with national trends. It collected data from 42 novice teenage drivers and one of their parents, using the DAS developed by VTTI used in the 100-Car NDS. Between 2006 and 2008, the campaign collected approximately 102,000 trips, accumulating around 800,000 km and 5.1 terabytes (TB) of driving data. The results were consistent with the hypothesis that novice teenage drivers have a higher crash risk than more experienced drivers, mainly attributed to inexperience and risky driving behavior (e.g., aggressive driving, secondary task engagement).
Datasets Collected in the EU
Several NDS and field operational tests have been performed in Europe. The European Naturalistic Driving and Riding for Infrastructure & Vehicle Safety and Environment (UDRIVE) has been its first large-scale NDS ( 31 , 32 ). The project comprised approximately 4 million km of driving data and focused on road safety and eco-driving. It also included the investigation of driver behavior models, traffic simulations, and commercial transport applications. The program took place between 2012 and 2017 and included 287 participants, 192 of which were assigned to light vehicles, 48 to trucks, and 47 to motorcycles. Light vehicles were distributed in France, Germany, the Netherlands, Poland and the UK, motorcycles in Spain, and trucks in the Netherlands.
Saving Lives through Road Incident Analysis Feedback 1 (SVRAI 1) has been another project performed in France ( 33 – 35 ). The campaign consisted of recording driving data from 51 vehicles and 221 participants over 12 months, starting in 2012, through a custom DAS. This device collected CAN-bus, accelerometers, gyroscopes, and GNSS data, and recorded high-frequency data around abnormal events such as harsh braking. In parallel, GNSS data were collected every minute to allow exposure analysis without the precise travel route. In total, the campaign recorded around 300 hazardous events and 1,200 moderate events.
The European Large-Scale Field Operational Tests on In-Vehicle Systems (EuroFOT) project has been the first large-scale FOT on safety systems ( 36 ). The project started in 2008 within a consortium of 28 organizations, including multiple stakeholders from vehicle manufacturers and suppliers to universities and research institutes. The project aimed to assess the performance, usability, and acceptance of advanced driver-assistance systems (ADAS) and their impact on traffic safety, efficiency, and the environment. In particular, the following functions were evaluated: FCW, adaptive cruise control (ACC), speed regulation system (SRS), blind-spot information (BLIS), lane departure warning (LDW), curve speed warning (CSW), fuel efficiency advisor (FEA), and safe human-machine interface (SafeHMI). The campaign consisted of 972 vehicles (light vehicles and trucks) and 1,068 drivers, collecting data for over 12 months which accumulated around 35 million km of driving data.
Similarly, TeleFOT has been another FOT carried out in Europe between 2008 and 2012 which covered northern Europe (Finland and Sweden), central Europe (France, Germany, and the UK), and southern Europe (Italy, Greece, and Spain) ( 37 , 38 ). The campaign focused on the impact of in-vehicle after-market mobile devices (e.g., portable navigators, smartphones) on driving patterns. It involved 2,800 participants, 452 of which performed detailed tests using highly instrumented vehicles (e.g., lane departure sensors, eye-gaze monitoring). The remaining vehicles used unobtrusive instrumentation to log trip data based on GNSS-derived measurements.
Datasets Collected in Other Regions
Apart from being the basis for numerous transportation research studies, 100-Car and SHRP2 have motivated naturalistic data collection campaigns in other parts of the world. The Australian 400-Car NDS (ANDS) has been the first large-scale NDS undertaken in that country and might be considered an extension of SHRP2 ( 39 , 40 ). It covered the geographical area of New South Wales and Victoria with a total distance driven of approximately 1.95 million km over 4 months. The campaign utilized the VTTI data acquisition equipment and the Mobileye sensor to collect machine-vision-based ADAS data. In contrast to SHRP2, the sample size was smaller, comprising 346 vehicles along with 379 participants. Similarly, the Canadian NDS (CNDS) has been another extension of SHRP2, and access to the dataset requires an application for qualified research status ( 41 , 42 ). The study covered the area of Saskatoon from 2013 to 2015, collecting approximately 1.8 million km from 150 vehicles (87 cars, 22 pick-up trucks, and 41 sport utility vehicles [SUVs]) and 149 participants. The VTTI DAS has also been used for the first NDS in China, the Shanghai Naturalistic Driving Study (SH-NDS) ( 43 , 44 ). It monitored 60 drivers over 3 years, using five instrumented vehicles. The study collected around 160,000 km and served as input to analyze several aspects of driver behavior.
Between 2006 and 2008, the Japan Automobile Manufacturers Association (JAMA) carried out an NDS in Japan analyzing the relationship between driver behavior and safety-relevant road incidents ( 45 ). The study collected 1,124 near-crashes using 60 vehicles equipped with a custom DAS. This system included a driver-facing camera, a pedal-facing camera, three forward-facing cameras (left-side, right-side, centre), a GNSS antenna, CAN-bus data related to brakes, indicators, steering angle, and throttle position, and an accelerometer. Every time a given kinematic threshold was reached, the system recorded 40 s of data which was then manually labeled based on near-crash events.
Similarly, the NDS from the Council for Scientific and Industrial Research (CSIR) in South Africa recorded anomalous kinematic events, logging video, acceleration, and GNSS-derived values in a time window manner ( 46 , 47 ). The project monitored four drivers over 6 months using a DAS consisting of an accelerometer and GNSS antenna, a driver-facing camera, and a forward-facing camera. In total, the pilot collected 1,755 video recordings leading to 255 h of driving data.
In Latin America, the first NDS to be performed in Brazil (BNDS), monitored six drivers between 19 and 38 years old in Curitiba for 2 weeks ( 48 ). In total, the study comprised 207 trips, 1,350 km, and 61.32 driving hours between August 2019 and November 2019. The study used a low-cost DAS as a minimum viable product, including a laptop, a voltage inverter, a GNSS, a driver-facing camera, and two front-facing cameras. The laptop served as a controller, activating the devices and recording images that were then manually analyzed.
In an effort to collect naturalistic driving data across different geographical regions, the International Large-Scale Vehicle Corpora (ILSVC) has been a comprehensive collaboration carried out in Japan, Turkey, and the U.S. ( 49 ). Each area contained a vehicle equipped with a highly instrumented DAS. The names of the projects for each region have been “NUDrive,”“UTDrive,” and “UYANIK” for Nagoya, Dallas, and Istanbul, respectively. The vehicles collected audio and video, brake, throttle, and steering-angle information, GNSS-derived data, accelerometer data, and data from distance sensors. Even though the campaign used only three vehicles, it collected data from 497 drivers on routes between 15 km and 28 km long, accumulating approximately 24 TB of driving data.
In Australia, Canada, and New Zealand, the Candrive II/Ozcandrive project has monitored 1,230 drivers aged more than 70 years old over 4 years ( 50 ). Even though no thorough information has been found about the program, the focus of the campaign resided on observing driving patterns of the elderly for their application in road safety. The data collection has been carried out through a research-designated DAS that collected data from CAN-bus and a GNSS receiver.
Comparative Analysis
Table 2 summarizes the meta-information of the described datasets with respect to: (i) data access or availability, (ii) data collection period, (iii) number of vehicles and participants, (iv) driving distance and time, (v) target vehicle types, and (vi) data features.
Overview of Surveyed Naturalistic Data Collection Campaigns
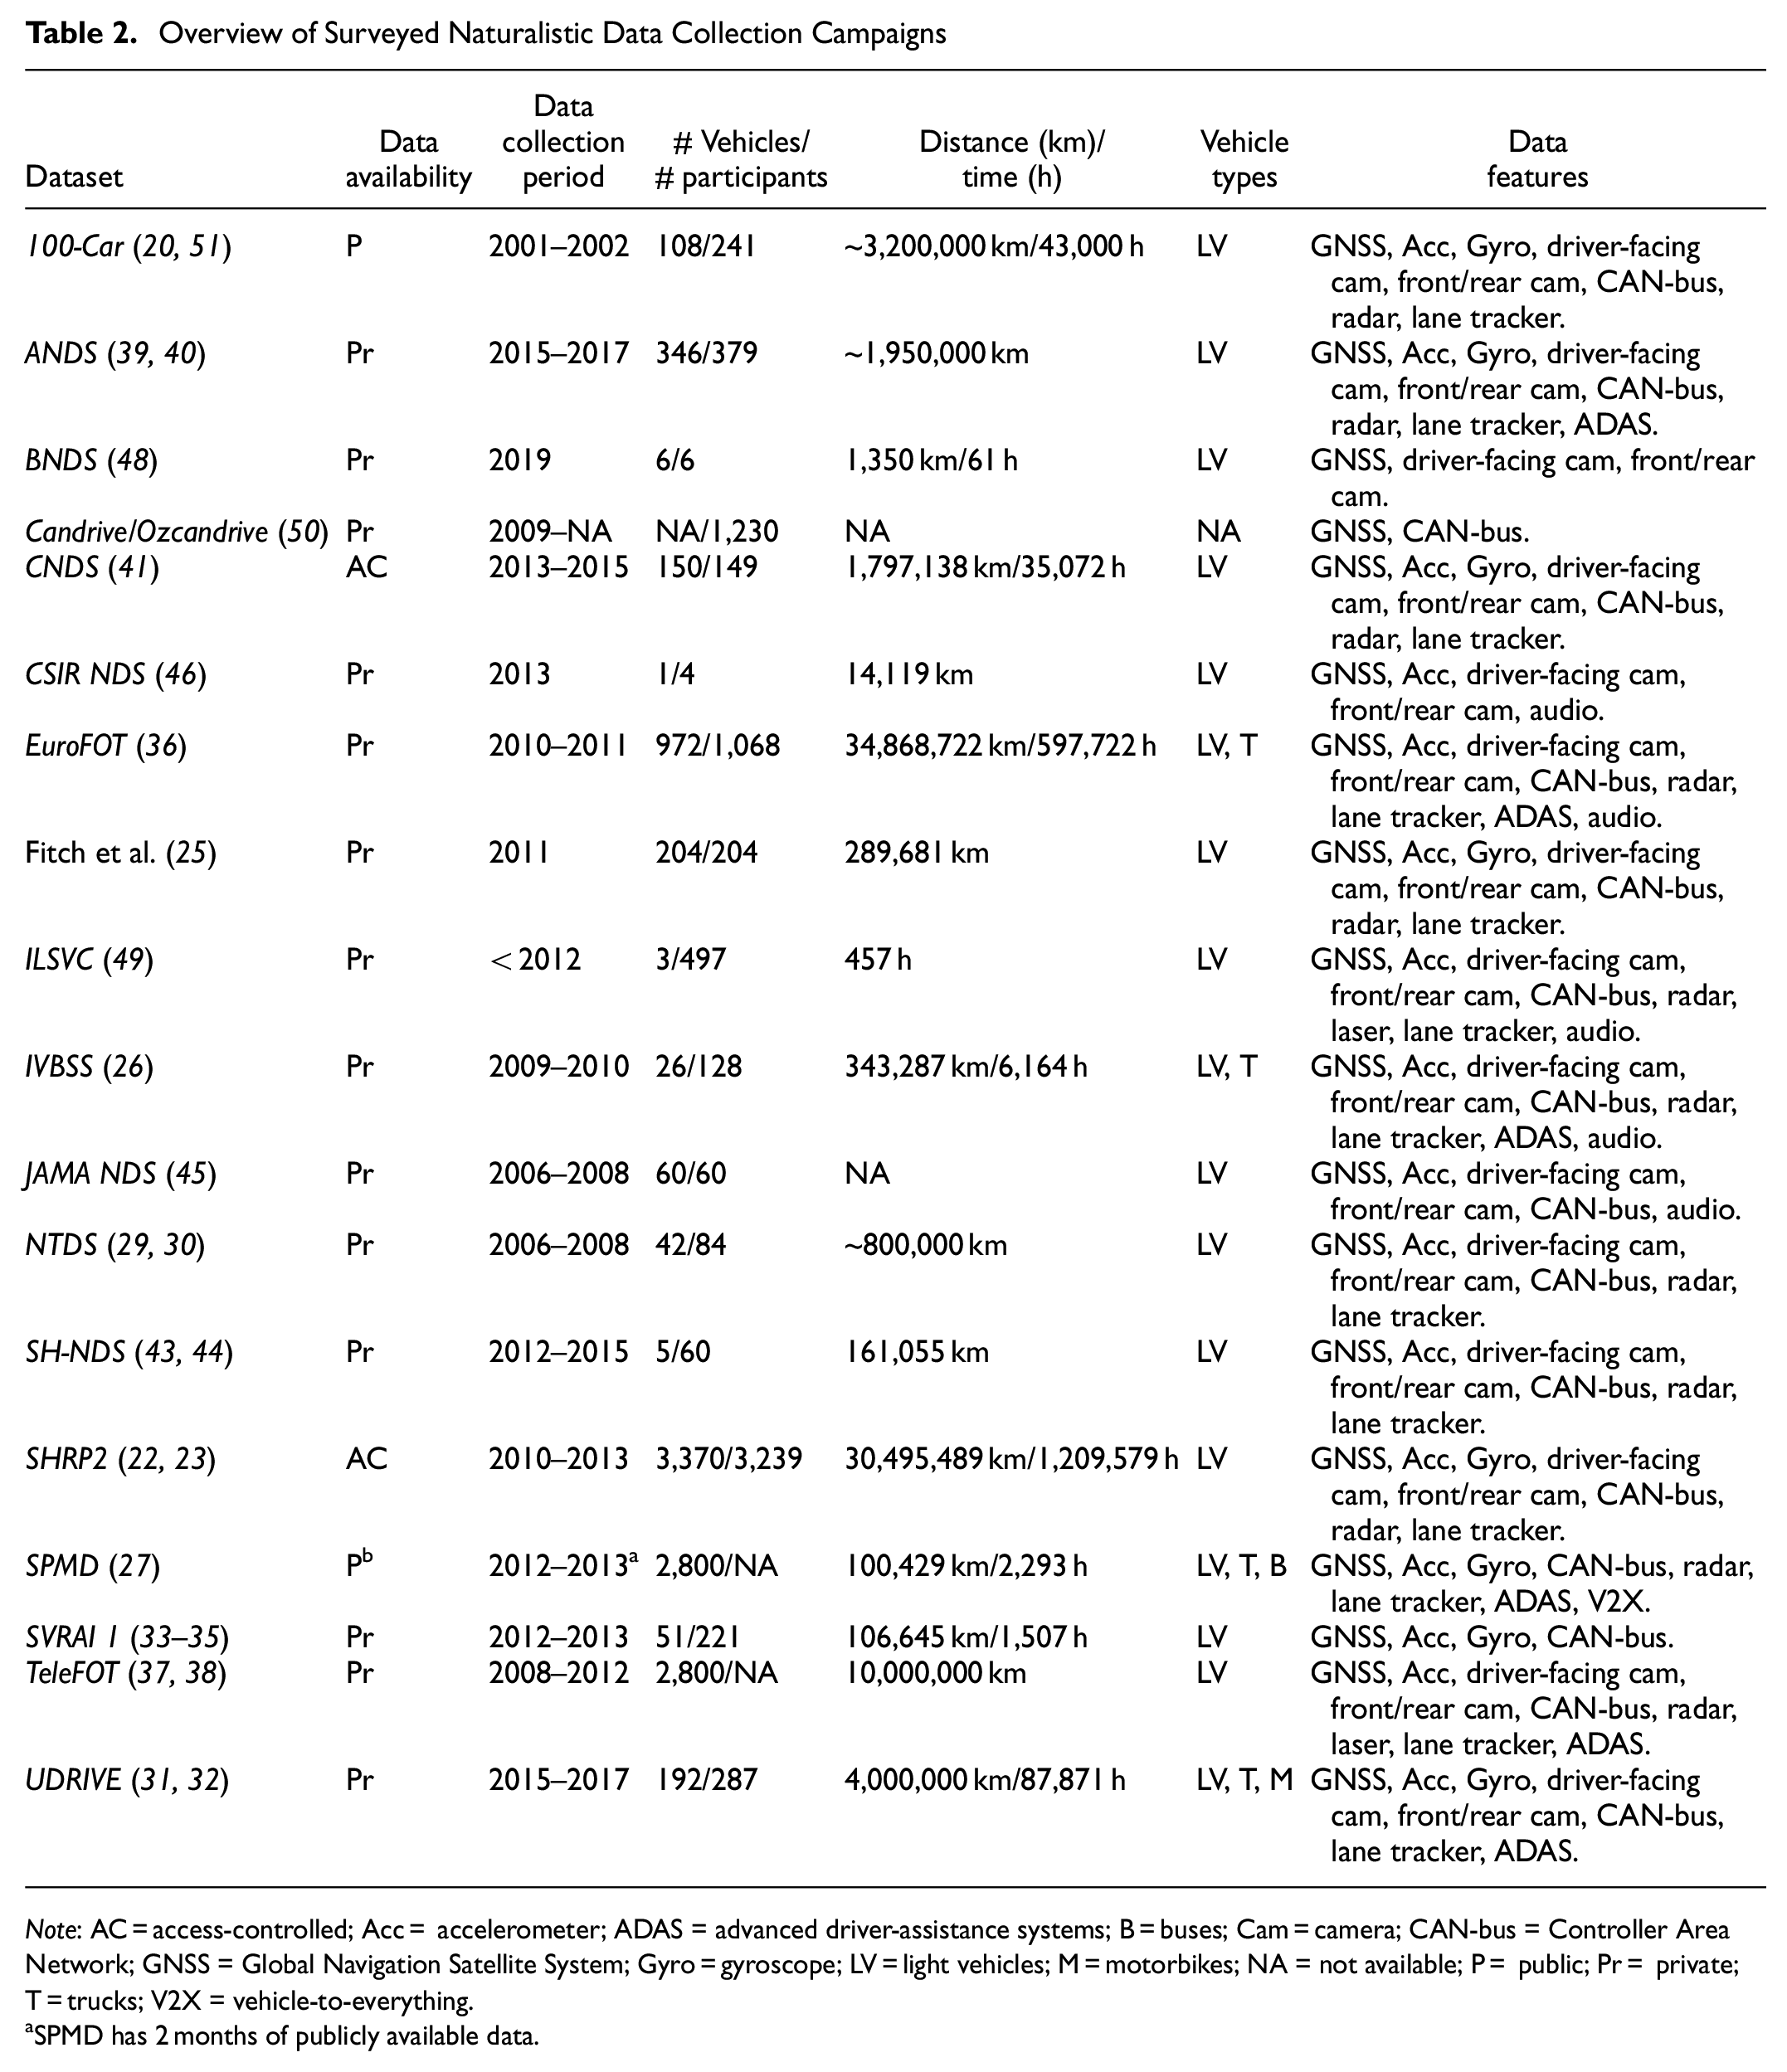
Note: AC = access-controlled; Acc = accelerometer; ADAS = advanced driver-assistance systems; B = buses; Cam = camera; CAN-bus = Controller Area Network; GNSS = Global Navigation Satellite System; Gyro = gyroscope; LV = light vehicles; M = motorbikes; NA = not available; P = public; Pr = private; T = trucks; V2X = vehicle-to-everything.
SPMD has 2 months of publicly available data.
Public accessibility of naturalistic driving datasets has resulted in a shortage, with only two datasets that made data publicly available (one of which publishing a partial version). Two datasets have been marked as access-controlled, which means that they require an intermediate step to access the data. It consists of obtaining a certificate related to research ethics and then applying for qualified researcher status. The remaining datasets have been marked as private, although, in some cases, access could be granted by presenting a request to the authors pointing out the intended purpose.
As the potential use of vehicular datasets has become apparent, an increasing number of research organizations and/or consortia have started performing data collection campaigns worldwide. This can be observed in the number of data collection campaigns carried out before 2010 (N = 6) and during or after 2010 (N = 12). Figure 3 shows the geographical coverage of the surveyed studies. Remarkably, there is a presence of such studies in all five continents. However, there exists a stark disparity amongst them in relation to the number of driving data collection campaigns. While in Europe and North America there have been 12 large-scale campaigns with at least 100 vehicles or participants, in the rest of the world there have been only three (ANDS, Candrive/Ozcandrive, and ILSVC). This work highly encourages better cooperation between the transportation departments of different countries. Such collaborations might allow the research community to study driving patterns and road infrastructure across various parts of the world as observed by Takeda et al. in the ILSVC study that covered Japan, Turkey, and the U.S. ( 49 )
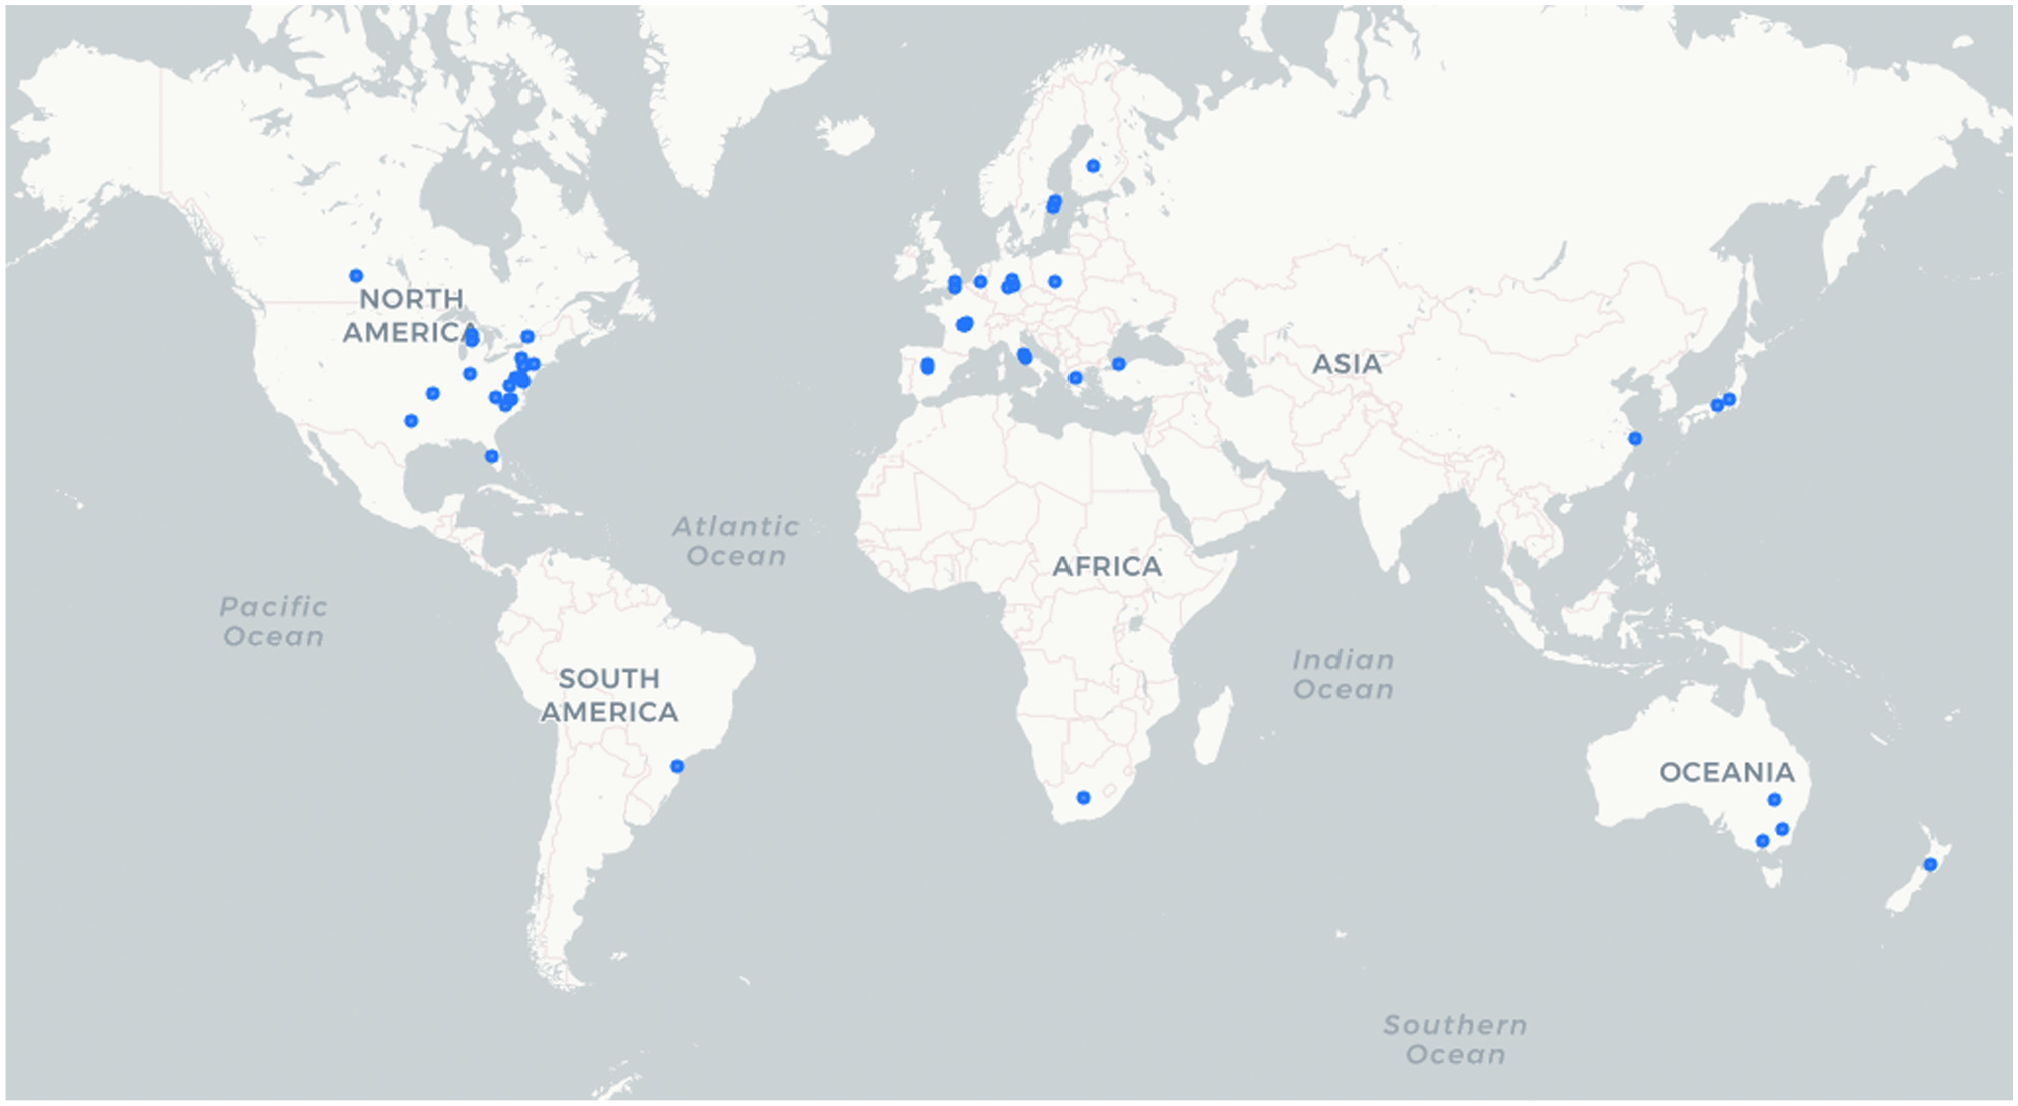
Geographical coverage of naturalistic driving studies (NDS).
A wide variety of dataset sizes and number of vehicles or participants has been observed. SHRP2 has resulted in being the dataset with the highest number of vehicles and participants, followed by SPMD and TeleFOT. In relation to number of kilometers traveled, the list is led by EuroFOT, followed by SHRP2, TeleFOT, UDRIVE, and 100-Car. In all cases, the datasets focused on light vehicles (e.g., conventional car, SUV), although, in particular cases, trucks, buses, and motorcycles have also been analyzed.
The use of research-designated DAS has the benefit of including plenty of data features, which are of prime importance for transportation analysis. To provide a better understanding of the differences between the surveyed datasets, Figure 4 presents a scatter plot of the datasets by level of instrumentation and dataset size, measured from the number of vehicles involved. The level of instrumentation has been considered according to the number of sensors or data types acquired in the data-collection campaign. From the most common to the least common, these are GNSS, accelerometer, gyroscope, CAN-bus, driver-facing camera, front/rear camera, lane tracker, radar, ADAS warnings, laser scanner, and vehicle-to-everything (V2X) data. Almost all the datasets included a combination of GNSS, accelerometer, CAN-bus, and cameras. Other features have been studied in particular campaigns, such as V2X communications in SPMD, laser scanner in ILSVC and TeleFOT, and ADAS warnings in ANDS, EuroFOT, IVBSS, TeleFOT, SPMD, and UDRIVE. Remarkably, two datasets in the range of highly instrumented and large-size, SHRP2 and SPMD, provide public access to the data. The underlying difference between them in relation to instrumentation is the availability of V2X data in SPMD and videos in SHRP2.
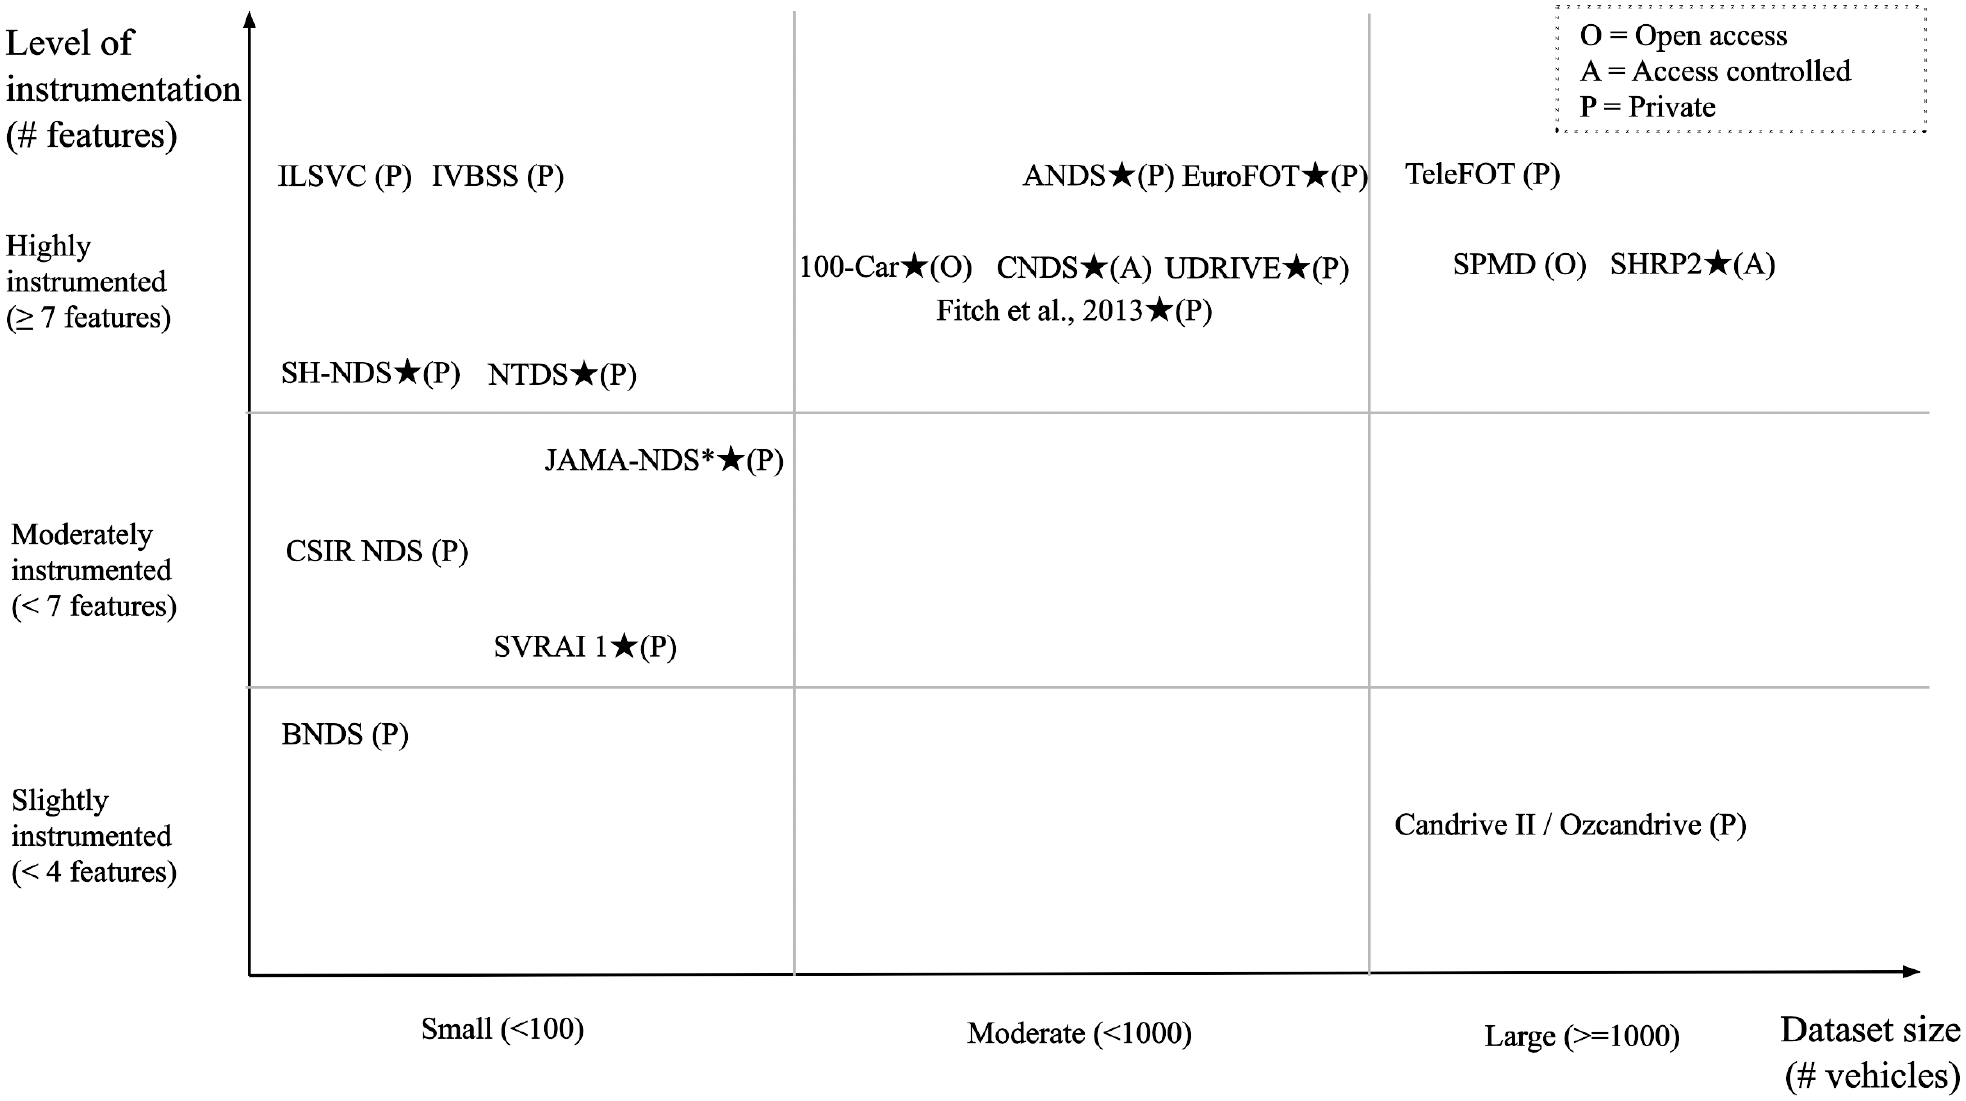
Dataset comparison by level of instrumentation (number of data features) versus dataset size (number of vehicles involved in the data collection campaign).
Table 3 presents evidence of the naturalistic driving campaigns in three essential transportation domains—eco-driving, road safety, and transportation planning. Most of the surveyed naturalistic datasets have been performed with a special focus on road safety and driver behavior. A common characteristic of such datasets is the presence of safety-relevant events like crash and near-crash events and can be observed highlighted with the symbol ★ in Figure 4. The study of this type of event has the potential to trigger insights into road safety measures and hazardous behavior identification. Other study domains of the surveyed datasets comprise transportation planning and eco-driving. The former involves, but is not limited to, studies of traffic optimization, capacity analysis, and road infrastructure, for instance, analysis carried out in EuroFOT, SPMD, and TeleFOT ( 5 , 6 , 52 ). Finally, eco-driving pays particular attention to reducing the environmental impact of vehicular technologies. It typically involves analysis of fuel economy, greenhouse gas emissions, and energy consumption. Examples of the surveyed datasets containing such studies are SPMD, UDRIVE, and TeleFOT ( 8 , 53 , 54 ).
List of Naturalistic Driving Campaigns Grouped per Evidence in Study Domains
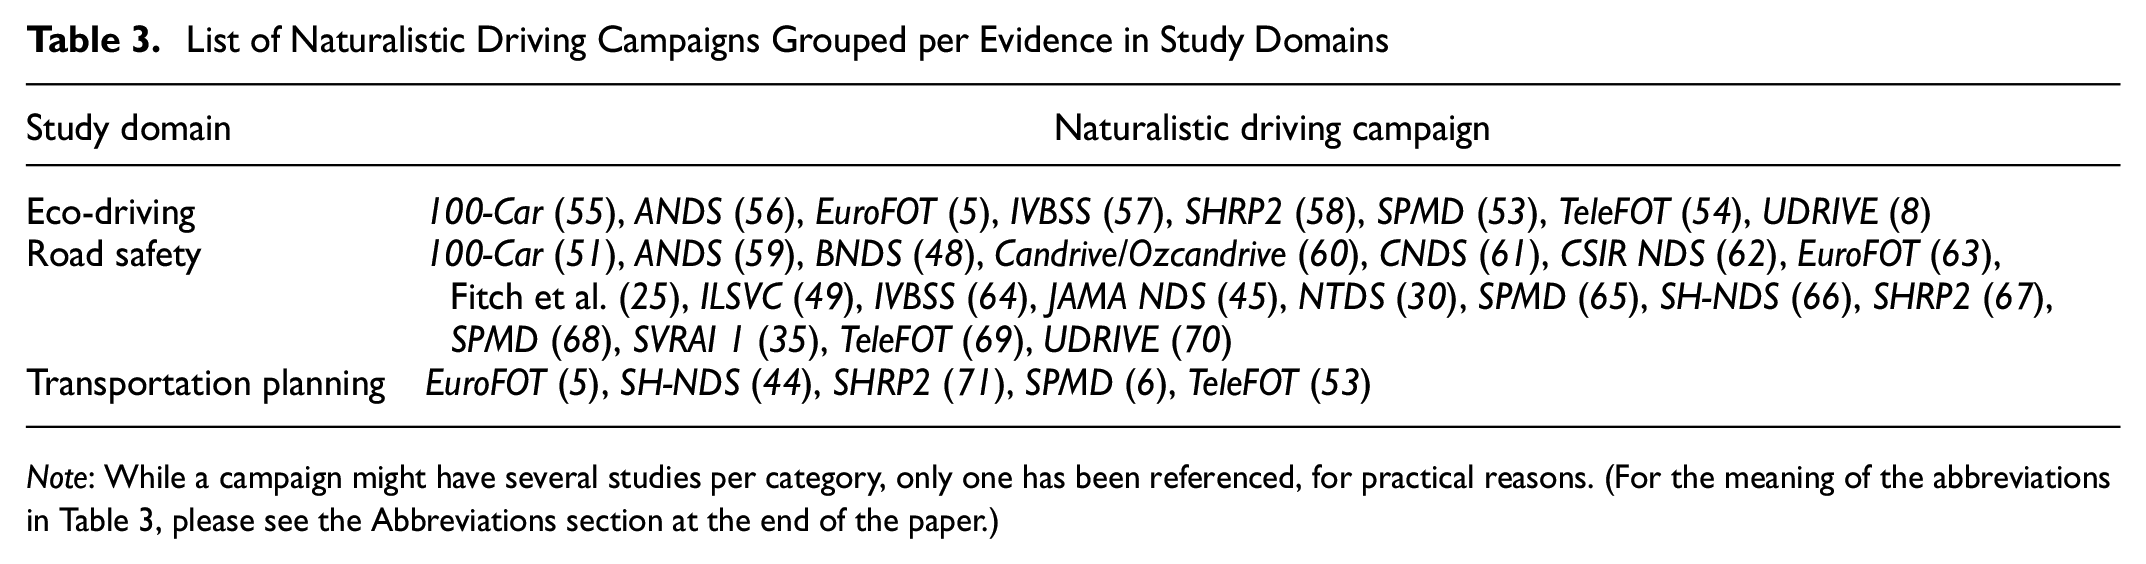
Note: While a campaign might have several studies per category, only one has been referenced, for practical reasons. (For the meaning of the abbreviations in Table 3, please see the Abbreviations section at the end of the paper.)
Dash-Cam and Smartphone-Based Studies
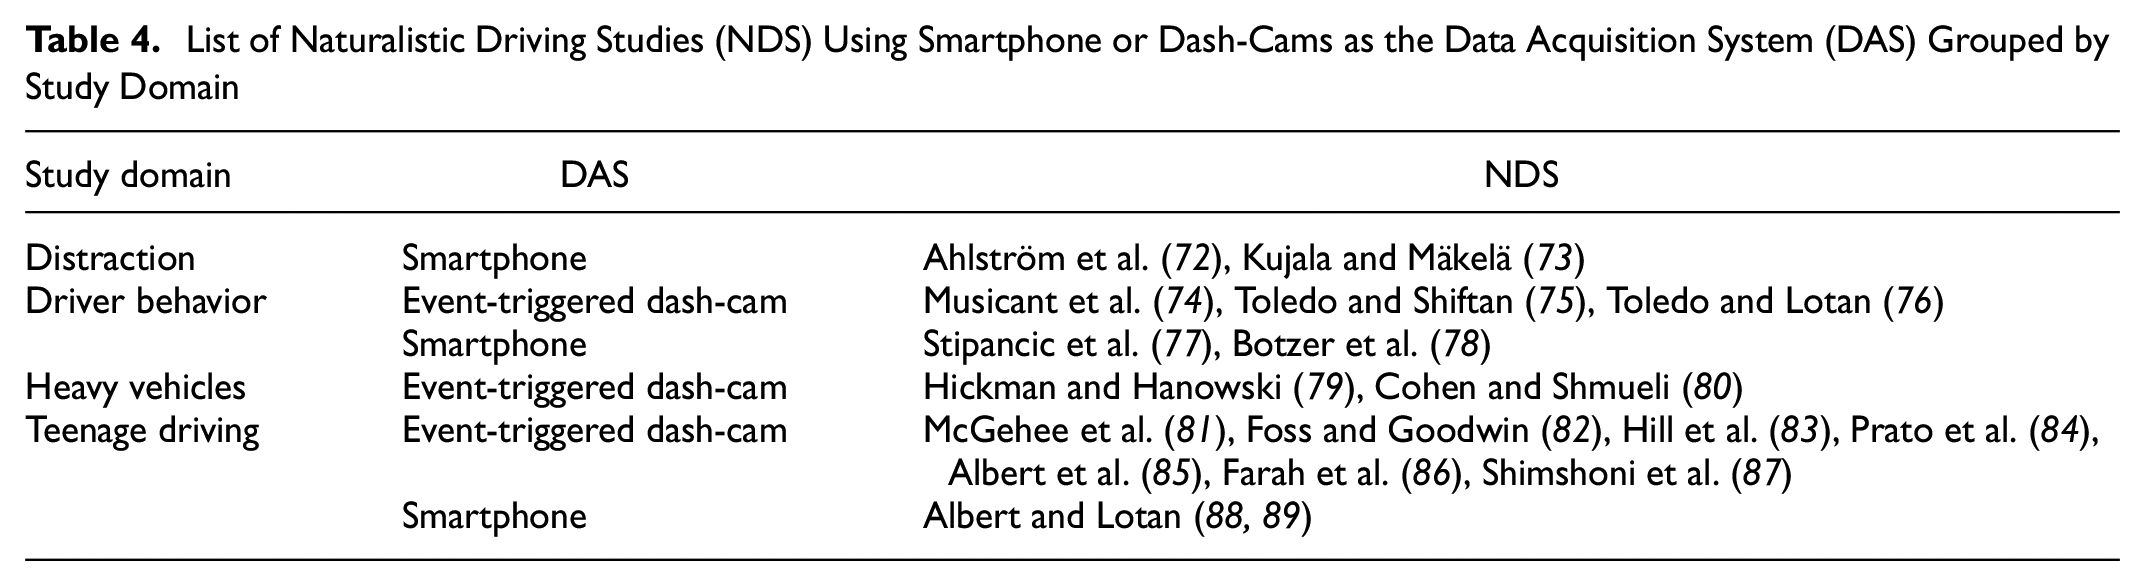
This section presents an overview of 17 NDS that used either dash-cams or smartphones as the DAS. Table 4 introduces a list of these studies by study domain and DAS, and the sections below provide further details about them.
List of Naturalistic Driving Studies (NDS) Using Smartphone or Dash-Cams as the Data Acquisition System (DAS) Grouped by Study Domain
Dash-Cam-Based Studies
The usage of off-the-shelf DAS (e.g., dash-cams) has been a widespread practice for NDS pilots because of their low-cost and low complexity compared with the research-designated DAS presented in Table 2. McGehee et al. used this type of system to analyze teenage driving in Iowa, U.S., over almost one year, particularly drivers between 16 and 17 years old ( 81 ). The project’s goal consisted of reducing risky driving by introducing video recordings of critical events during the driver training phase, paired with parental feedback. The dash-cam was a commercial-event-triggered video system called DriveCam, which contained a forward-facing camera, a driver-facing camera, and a two-axis accelerometer. The device recorded 20 s of audio and video when an abnormal kinetic value exceeds a certain threshold. Foss and Goodwin used the same event-triggered camera system to study teenage drivers from North Carolina between 2008 and 2010 ( 82 ). The authors monitored driver behavior for 6 months, with a special focus on distraction events. Around 30,000 30 s driving clips were collected, out of which three corresponded to collisions, 30 to near-crashes, and 19 to other hazardous maneuvers (e.g., roadway departure). Hill et al. analyzed 97 newly licensed young drivers in Australia ( 83 ). Driving data were collected using the event-triggered dash-cams Lukas Pro LK-7700 and Ace LK-7900 that recorded video from a forward-facing camera, 3-axis accelerometer, and GNSS data. On average, each driver drove 1,618 km (SD = 1,095) and triggered 9.62 (SD = 14.46) harsh-braking events.
Several studies focusing on studying driving behavior with dash-cams have been performed in Israel. Prato et al. analyzed 62 newly licensed young drivers’ driving patterns using an off-the-shelf device called DriveDiagnostics ( 84 , 90 ). The study also included driving data of the parents to examine the influence of parental driving behavior. Over 12 months, the project collected 8,000 and 10,000 driving hours of teenagers and their parents, respectively. Young drivers accumulated around 41,000 safety-related maneuvers, whereas adults accumulated 30,000. Albert et al. extended this study analyzing the behavior of 32 of these drivers after 3 and 4 years using the same DAS (in this study, the DAS was called GreenRoad IVDR) ( 85 ). In total, the study collected approximately 6,500 trips in 8 months. Farah et al. and Shimshoni et al. also investigated young drivers, using the aforementioned dash-cam, although in a larger-scale study ( 86 , 87 ). It comprised the monitoring of 217 teenage male drivers and their parents over 11 months and collected approximately 350,000 trips and 123,000 driving hours. Similarly, DriveDiagnostics was also used for other NDS focusing on a broader spectrum of drivers ( 74 – 76 ).
Naturalistic driving campaigns with dash-cams have also examined heavy vehicles. Hickman and Hanowski performed a large-scale study that consisted of 13,306 heavy vehicles (2,617 trucks with three or more axles, 8,509 buses, and 2,180 tractor-trailer/tankers) which were monitored over 3 months in California ( 79 ). Driving data were collected through the aforementioned DriveCam event-triggered dash-cam. The device recorded 12 s of events data, triggered by anomalous measurements of the accelerometer. In total, the dataset collected 1,085 crashes, 8,375 near-crash events, 30,661 crash-relevant maneuvers, and 211,171 non-safety-triggered events that served as baseline events. In Israel, Cohen and Shmueli investigated a dataset composed of 60 bus drivers monitored for 5 months ( 80 ). The authors covered two bus lines with similar driving routes and equipped with the same DAS: Integrated Systems Research, and Traffilog. The former device collected metadata about the drivers’ shift, whereas the latter recorded safety-relevant driving events and fuel consumption reports. In contrast to previous studies, the recorded data only consisted of alerts concerning sharp turns and abrupt braking or acceleration.
Smartphone-Based Studies
The proliferation of smartphones has made smartphone-based DAS a cost-effective solution for telematics projects ( 91 ). Although the accuracy and sampling rate are lower than dedicated DAS, their high penetration rate and reduced complexity made them the solution for several naturalistic studies. Ahlström et al. logged transportation data of 143 participants and monitored cell-phone usage for 3 months in Sweden ( 72 ). A custom-made application called Apparat-VTI recorded cell-phone metadata and high-level activity logs (i.e., only logging active applications without their contents). The application was linked with a commercial application called Moves that recorded GNSS data and the transportation mode. The study recorded 4,270 trips from cars, 51 from trucks, and 655 from bicycles. Kujala and Mäkelä also investigated the use of smartphones while driving ( 73 ). In this case, the authors studied 30 drivers from Finland from June to September 2016, recording the frequency of smartphone screen interactions, geographical location, and speed. The DAS consisted of two smartphones running software from Ficonic Solutions Ltd. The application recorded continuous 3-axis accelerometer data and GNSS data, and map-matched the locations to locate the vehicle on the road. Every time the user interacted with the screen, the system recorded a photo of the road ahead. The Drive Mode project studied novice drivers in Israel ( 88 , 89 ). The project analyzed the driving behavior of 167 young newly licensed drivers for 4 months in 2016, collecting approximately 23,000 trips equivalent to 6,633 h. An application called ProtextMe captured GNSS data and the frequency at which the driver touched the smartphone’s screen.
Apart from driving distraction, driver exposure and behavior have also been studied with smartphone-based solutions. Papadimitriou et al. collected naturalistic driving data from 100 drivers, using a smartphone application in Greece ( 92 ). An application developed by OSeven Telematics monitored the drivers for 4 months, collecting data from the smartphone sensors: GNSS, 3-axis accelerometer, 3-axis gyroscope, and magnetometer. Based on these parameters, the platform processed the data to compute several exposure and driver behavior measurements such as distance, type of road, speeding, hazardous kinematic events, and distraction because of smartphone usage. Stipancic et al. collected the driving data of 4,000 drivers for 3 weeks in 2014 in Canada ( 77 ). Raw GNSS data were submitted to map-matching and filtering processes. The resulting data were composed of geographical coordinates, speed, longitudinal acceleration, and road links. These variables served as input to compute two surrogate safety measures: harsh braking, and aggressive acceleration events. Furthermore, the authors included historical collision data in the studied area to perform correlation analysis with the surrogate safety measures. Botzer et al. analyzed 26 drivers over 2 weeks ( 78 ). The study recorded data from the smartphone’s GNSS, motion sensors, and camera, using the IonRoad application. Remarkably, this solution also computed the time-to-collision with leading vehicles.
Datasets for Autonomous Driving Tasks
Robust performance of self-driving tasks is positively associated with the variety of learned scenarios. However, the acquisition of relevant large-scale datasets covering a wide spectrum of such scenarios is an endeavor that requires considerable time and resources. With the unified goal of advancing the state-of-the-art in CAV research and innovation, research institutes and commercial stakeholders have been collecting datasets oriented to different self-driving tasks (i.e., for SAE level 4–5) and making them publicly available. However, since there is no common standardization in data types and formats, the analysis of each separate dataset remains a complex process.
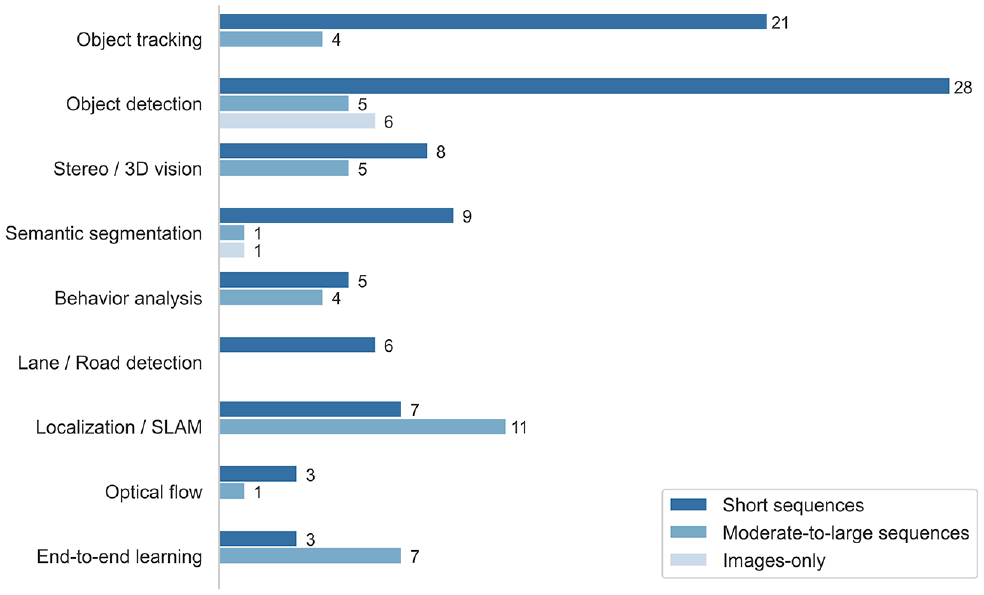
As mentioned in sections Related Work and Methodology, there have been studies surveying publicly available datasets. The most recent of them, performed in 2019, included 54 datasets ( 18 ). This section updates the lists of these surveys and complements them with additional information such as the type of driving data and instrumentation details. Following the process described in Section Methodology, the resulting list consisted of 68 datasets. The main distinction presented in this paper is a categorization in relation to the length of driving sequences. Three main groups have been identified in this aspect: (i) short driving sequences (39 datasets), (ii) moderate-to-large driving sequences (22 datasets), and (iii) independent images (7 datasets).
Short driving sequences refers to driving scenes with a length of less than 5 min and corresponds to most of the datasets. They are typically intended for the study of automated driving tasks that do not require a long driving history, computer vision being the most common application. A variety of driving conditions that might challenge the performance of the algorithm are usually involved. Examples of these conditions are poor road infrastructure, adverse weather, and lighting. Complementary, moderate-to-large driving sequences correspond to those datasets with driving scenes longer than 5 min. These are generally complete trips recorded in a pseudo-naturalistic manner and suitable for algorithms that analyze whole portions of trips. The third category encompasses datasets that provide images isolated from a continuous sequence, and are mainly intended to train algorithms for object detection, such as detection of traffic signs.
Grouping by length of driving sequences has motivated dataset comparisons by similar characteristics and study domains. This section introduces the autonomous driving tasks covered by the surveyed datasets to analyze the main trends in self-driving domains. Subsequently, a detailed comparison of the datasets is presented, along with an overall analysis of their primary features.
Autonomous Driving Tasks
The ultimate goal of driving a vehicle safely and dynamically without any human intervention has motivated comprehensive research and development for decades, both in academia and industry. Profound advances in robotics and engineering led to different approaches to achieve autonomous navigation. These approaches fall into two main domains: an engineering-based modular approach, and a data-driven end-to-end learning approach ( 93 , 94 ).
The modular approach has matured with advances in computer vision, engineering, and robotics. Because of its robustness, it is the approach typically used in the self-driving industry ( 93 , 94 ). The tasks involved in this approach consist of object detection, object tracking, lane or road detection, stereo or 3D vision, optical flow, semantic segmentation, SLAM, driver behavior analysis, and HMI. In contrast, end-to-end driving has gained popularity with relevant advances in machine learning, particularly in imitation learning. In this approach, all the driving task submodules are trained jointly instead of separately. Neural networks are fed with sensor information to perform a specific task, generally to control steering and acceleration ( 95 ). This work builds on these concepts as described and explained comprehensively by Janai et al. ( 94 ).
Figure 5 presents the number of datasets that are used for the aforementioned autonomous driving tasks. Note that the figure uses the dataset categorization posited by Guo et al. as a baseline and the classification by length of driving sequences ( 18 ). Even though the datasets might be used for several autonomous driving tasks, this paper selects the main tasks for which the datasets were carried out, which is typically mentioned in their respective documentation. Short driving sequence datasets (N = 39) are typically intended for object detection and tracking. Moderate-to-large sequences datasets (N = 22) are suited to localization/SLAM and end-to-end learning. Images-only datasets (N = 7) are appropriate for object detection.
Dataset type per autonomous driving task.
Object detection and tracking are the main topics of the surveyed datasets. Their goal consists of using computer vision for detecting certain objects in an image (e.g., cars, pedestrians, traffic signs, obstacles) and following them through time (i.e., tracking them). Similarly, the concept can be applied to lane/road detection. Stereo or 3D vision aims at extracting 3D information from images without the need for additional devices such as lidar. Optical flow encompasses the analysis of the apparent motion in a 2D image through the analysis of brightness patterns between images. Semantic segmentation is another topic in computer vision, the objective of which is to assign each pixel in an image a given label from a predefined set. The result is an image containing semantic regions (e.g., an image segmented by road lane, pavement, pedestrians, and vehicles). The role and behavior of the human driver is an area of research for the transition toward automated vehicles, since they have a direct impact on HMI ( 96 ). Analysis of examples of driver behavior such as distraction and drowsiness captures driver features such as the hands’ position and glance regions, usually through camera systems ( 97 , 98 ). Simultaneous localization and mapping is a task the goal of which consists of estimating the vehicle’s position and orientation in a map with high accuracy. It uses the input from different types of sensors in combination with a metric or semantic map. The sensors involved are typically GNSS, inertial sensors, lidar scanners, and cameras.
Comparative Analysis
Using the grouping by driving sequences described above, Tables 5–10 introduce the datasets comparison. Tables 5–7 contain the comparison for short driving sequences datasets, Tables 8 and 9 for moderate-to-large sequences, and Table 10 for images-only datasets. The comparison perspectives are: (i) year of publication or data collection, (ii) countries where the data collection took place, (iii) size of the dataset in gigabytes (GB), (iv) number and brand of the vehicles involved, (v) total number of driving hours and/or kilometers representing the collected data, (vi) licensing scheme, (vii) DAS details, and (viii) main self-driving tasks encompassed by the dataset, as described in the previous section. The year variable corresponds to the following criteria: year of the corresponding scientific publication, the year when the dataset was published, or year of collected data. (If the data collection took place in more than one year, the most recent year has been considered.) In cases where the dataset has been updated after scientific publication, the year of the update has taken prevalence. For multiple sets, the year of the largest one has been chosen. Furthermore, each dataset has been accompanied by their corresponding publication or website if there has been no publication.
Overview of Short Driving Sequences Datasets Ordered by Most Recent Year and Dataset Size in Gigabytes (GB)
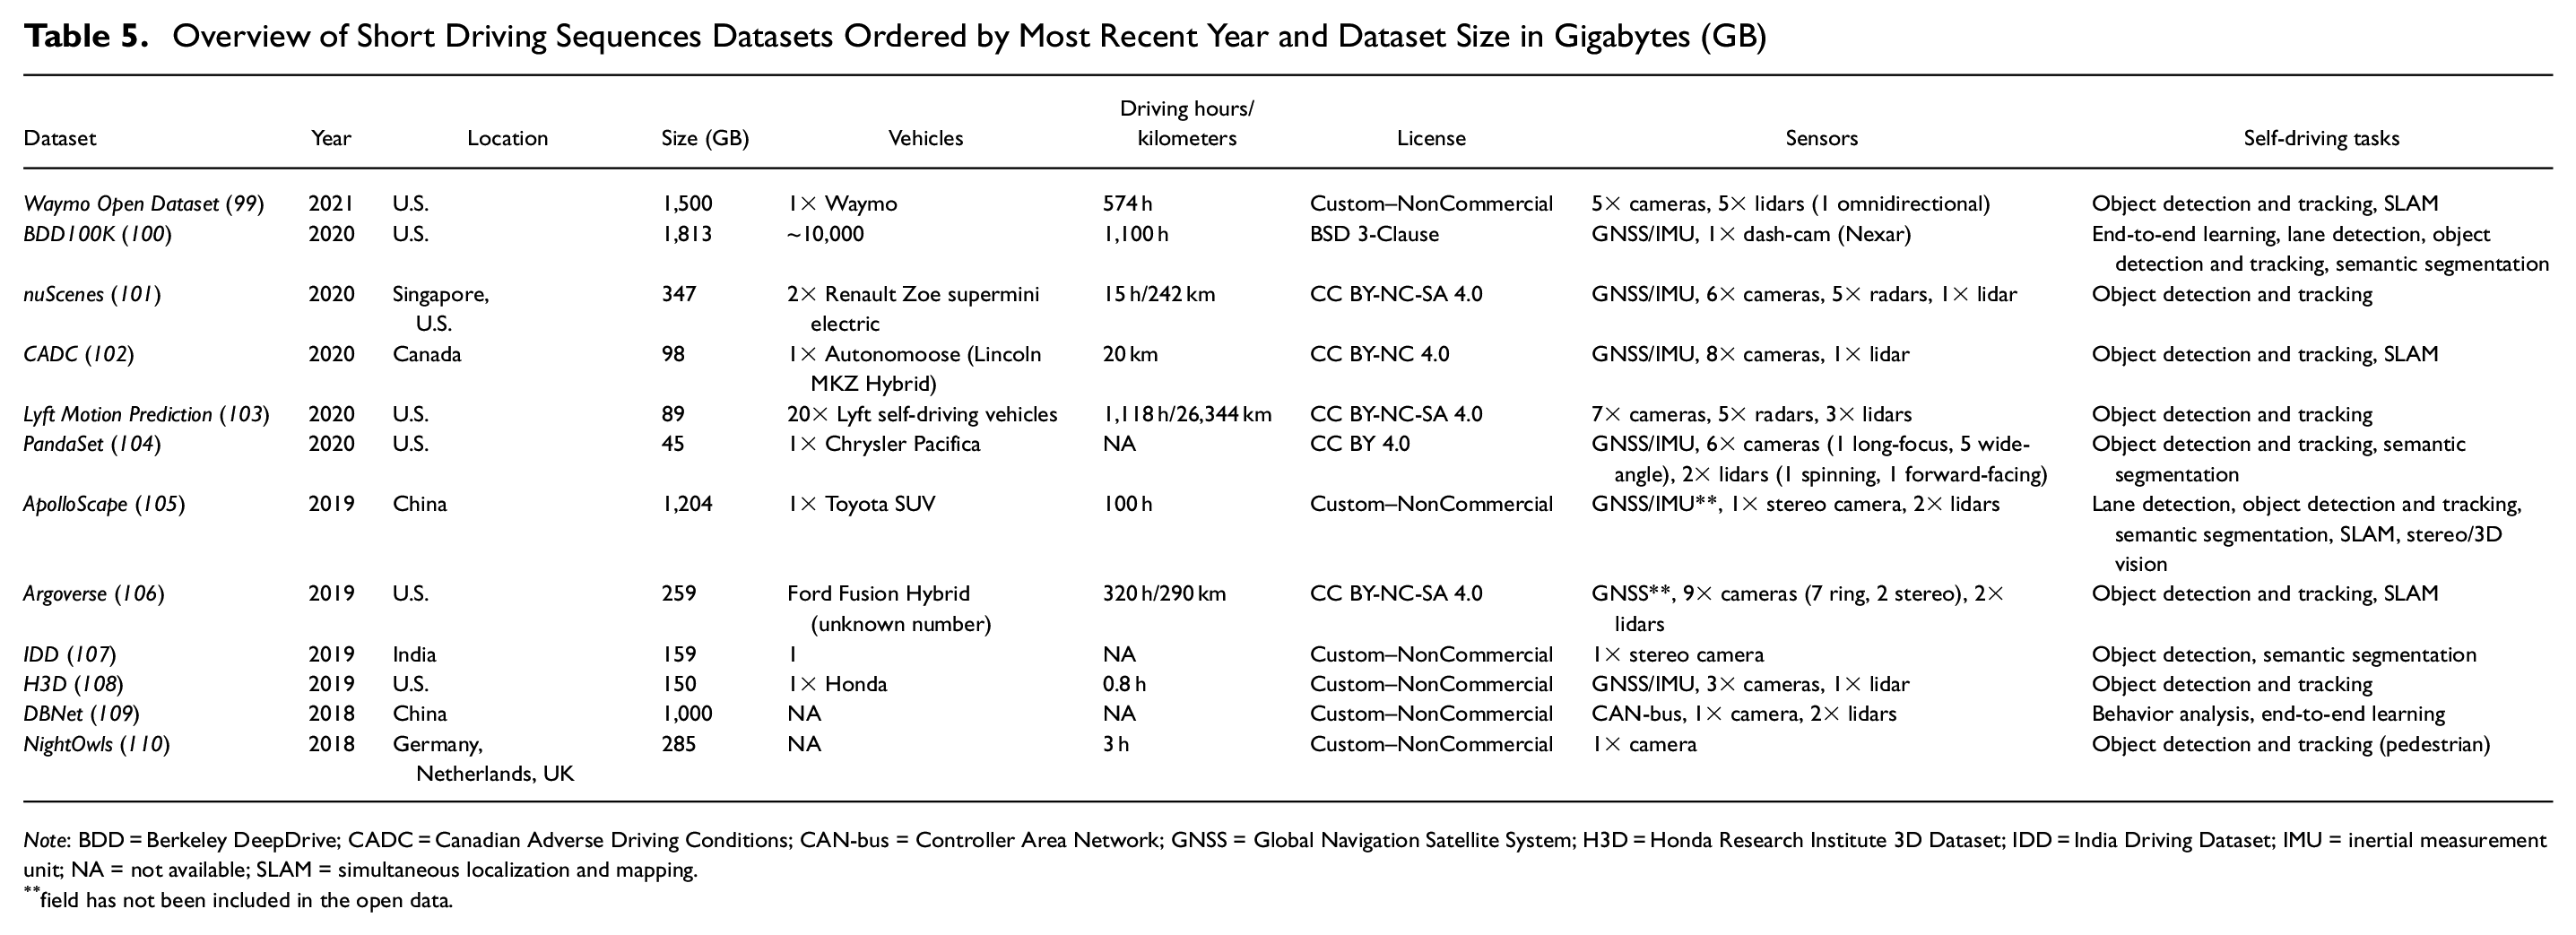
Note: BDD = Berkeley DeepDrive; CADC = Canadian Adverse Driving Conditions; CAN-bus = Controller Area Network; GNSS = Global Navigation Satellite System; H3D = Honda Research Institute 3D Dataset; IDD = India Driving Dataset; IMU = inertial measurement unit; NA = not available; SLAM = simultaneous localization and mapping.
field has not been included in the open data.
Overview of Short Driving Sequences Datasets Ordered by Most Recent Year and Dataset Size (Gigabytes [GB]) (Continuation of Table 5)
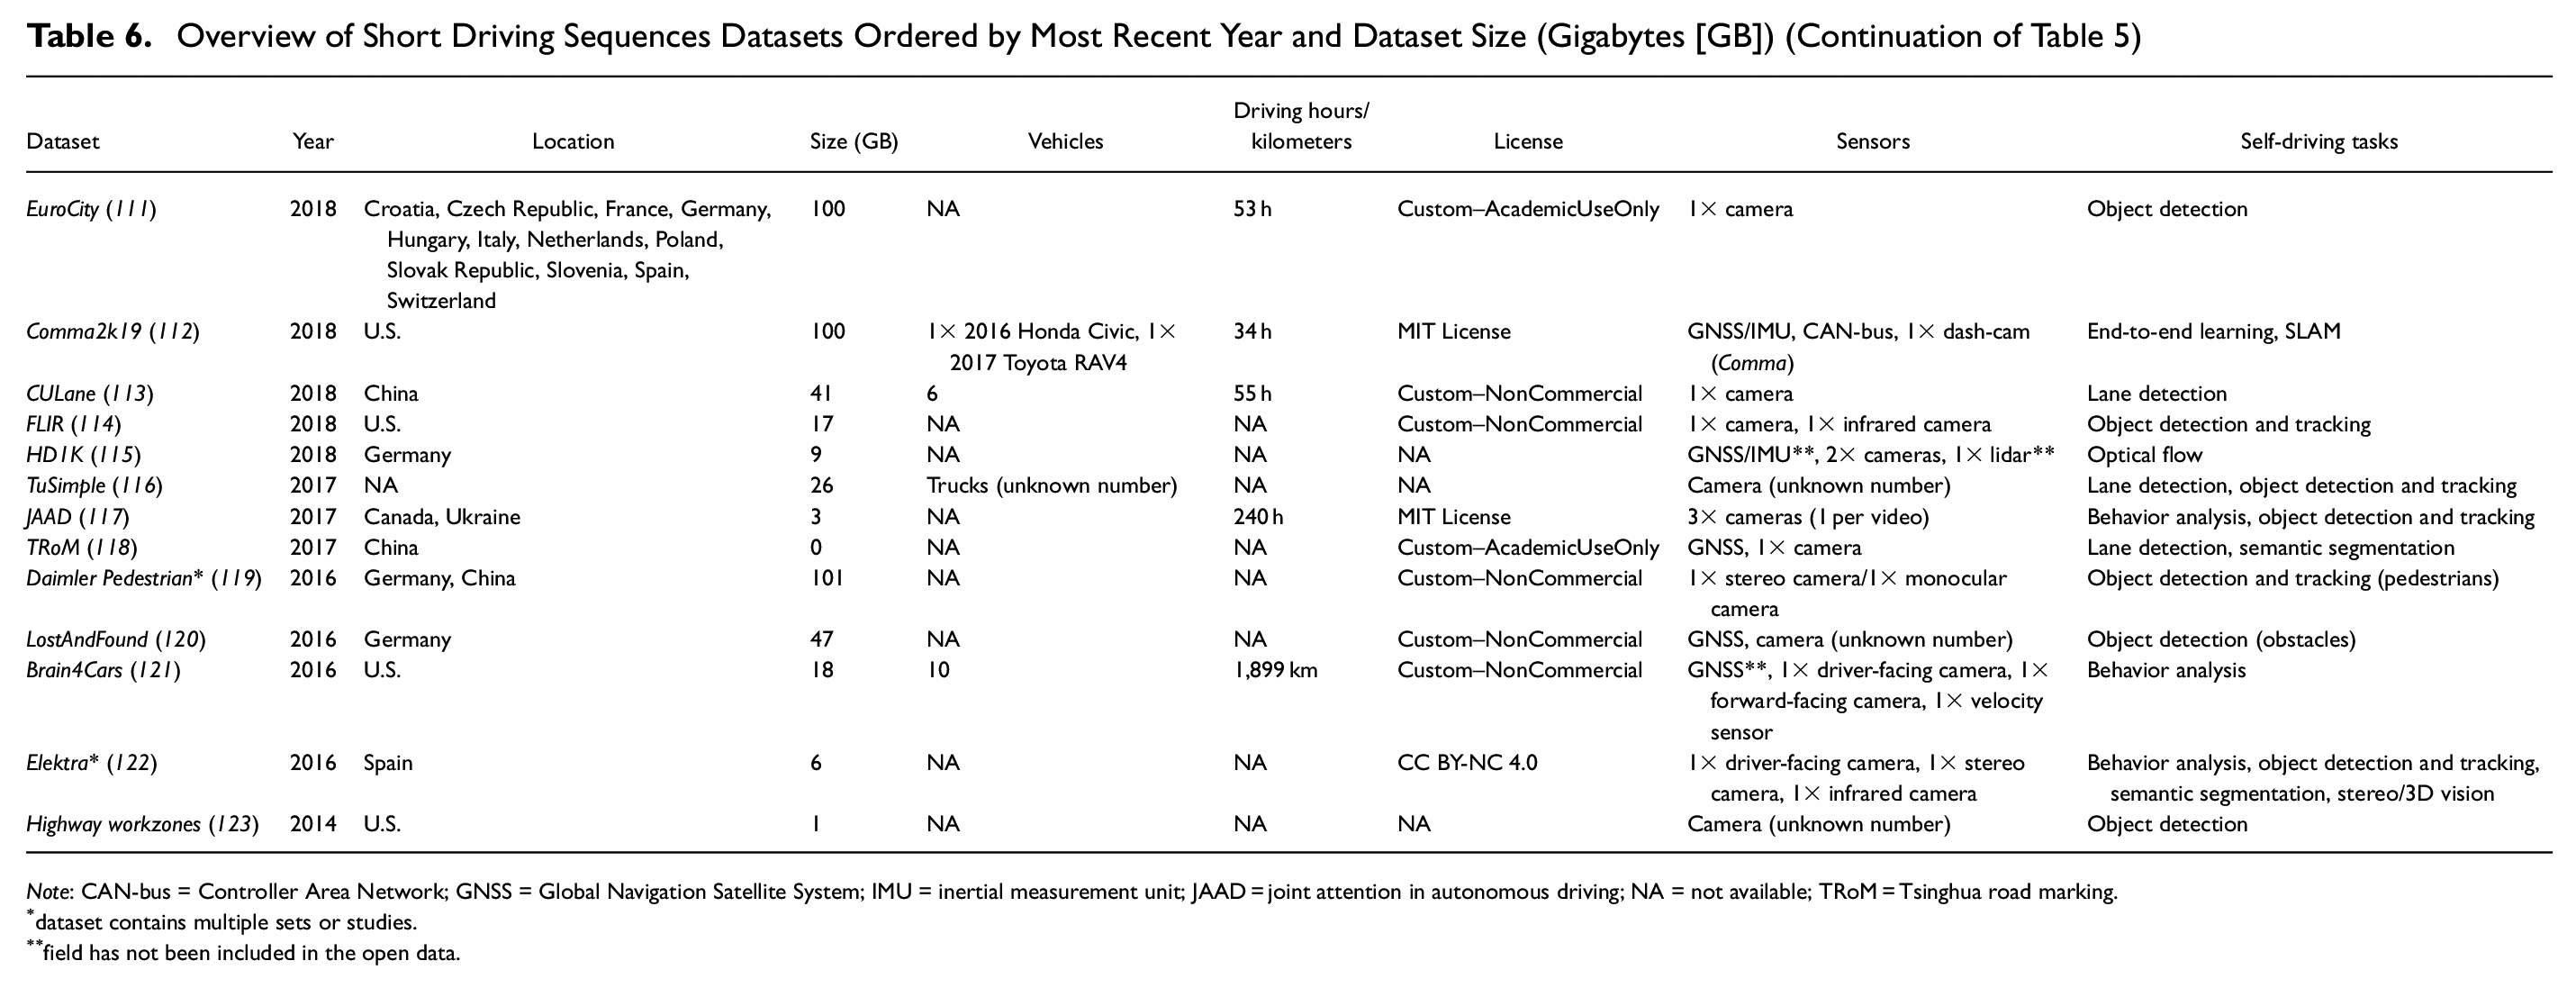
Note: CAN-bus = Controller Area Network; GNSS = Global Navigation Satellite System; IMU = inertial measurement unit; JAAD = joint attention in autonomous driving; NA = not available; TRoM = Tsinghua road marking.
dataset contains multiple sets or studies.
field has not been included in the open data.
Overview of Short Driving Sequences Datasets Ordered by Most Recent Year and Dataset Size (Gigabytes [GB]) (Continuation of Table 6)
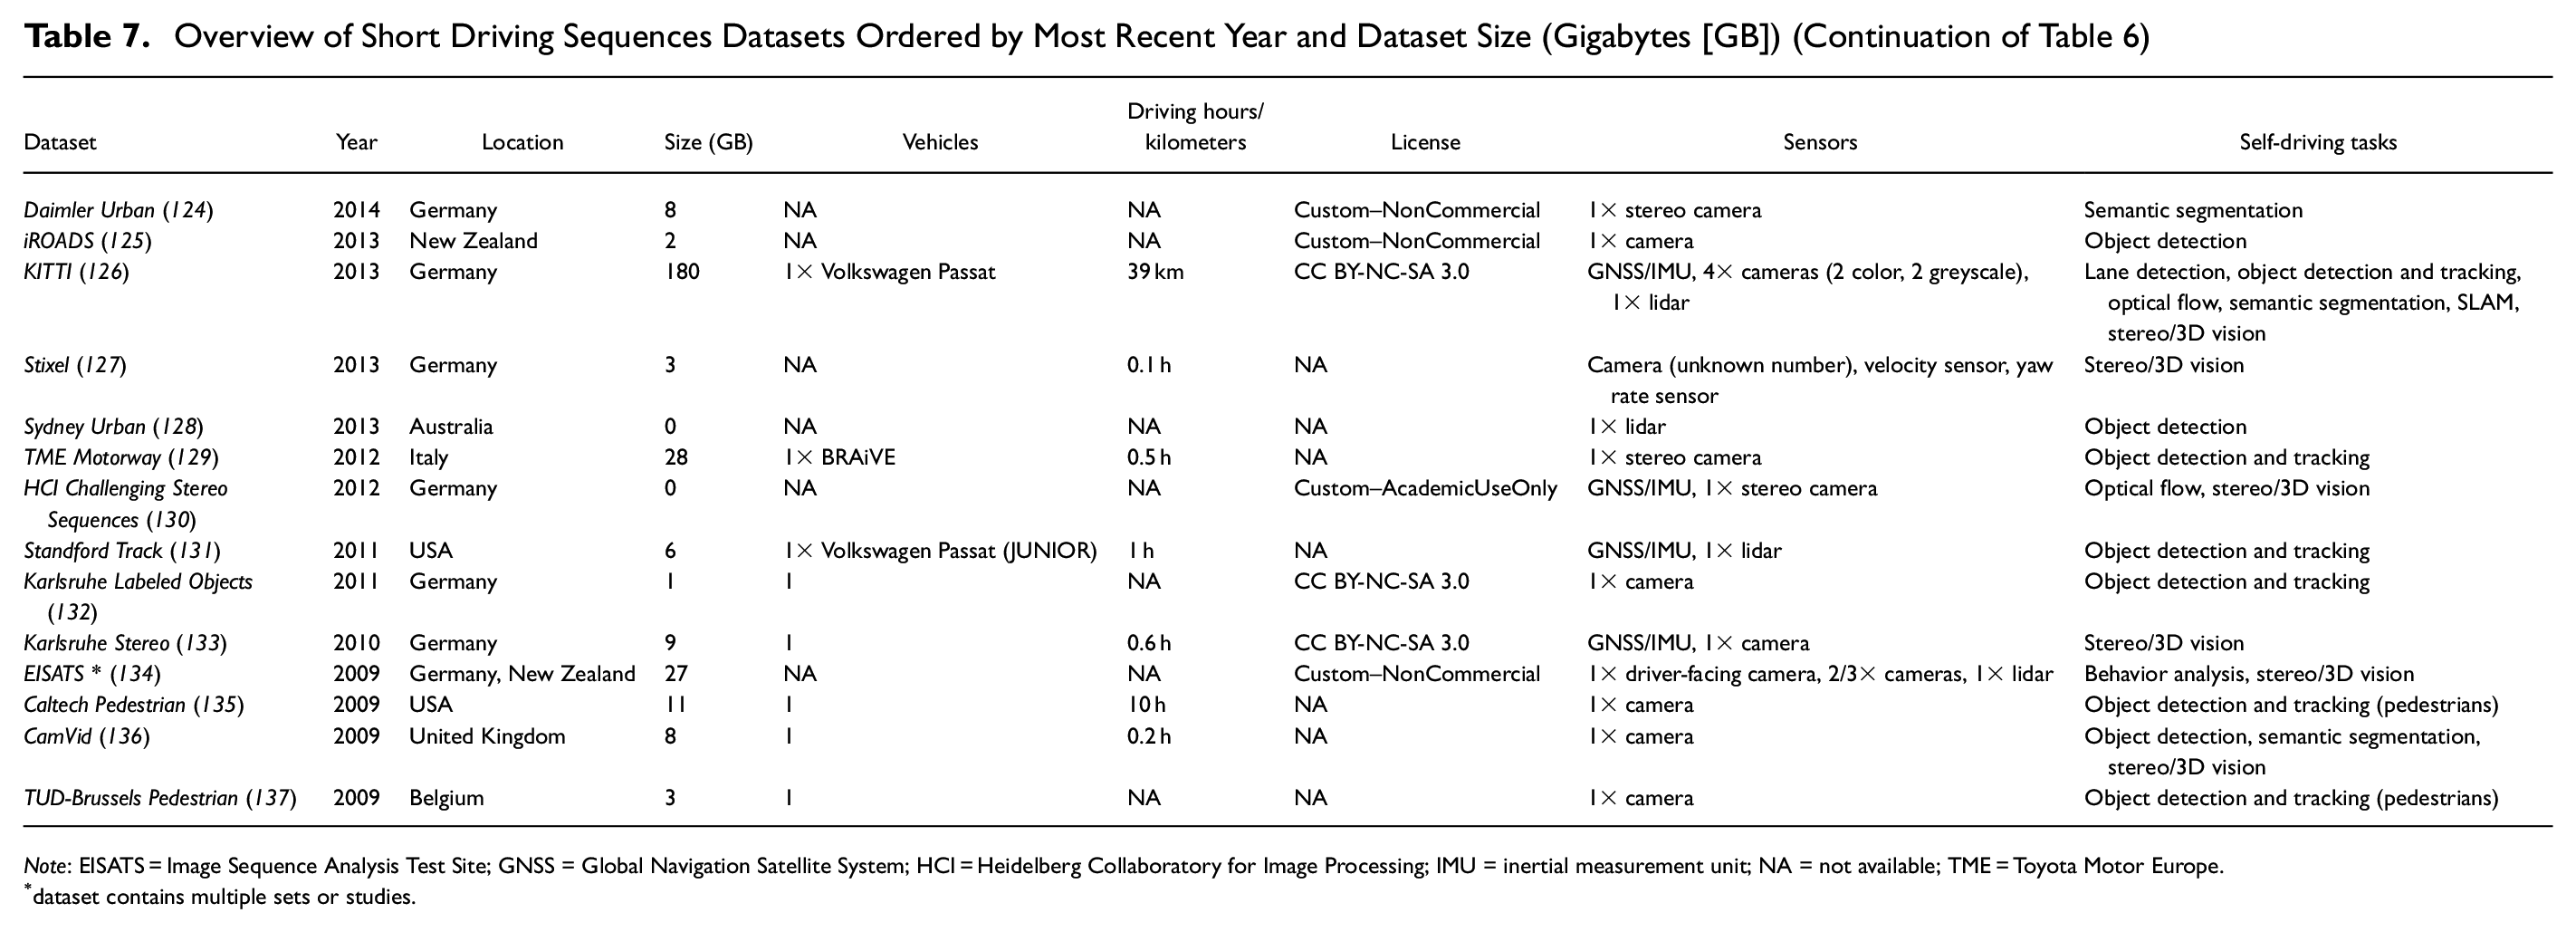
Note: EISATS = Image Sequence Analysis Test Site; GNSS = Global Navigation Satellite System; HCI = Heidelberg Collaboratory for Image Processing; IMU = inertial measurement unit; NA = not available; TME = Toyota Motor Europe.
dataset contains multiple sets or studies.
Overview of Moderate-to-Large Driving Sequences Datasets Ordered by Most Recent Year and Dataset Size (Gigabytes [GB])
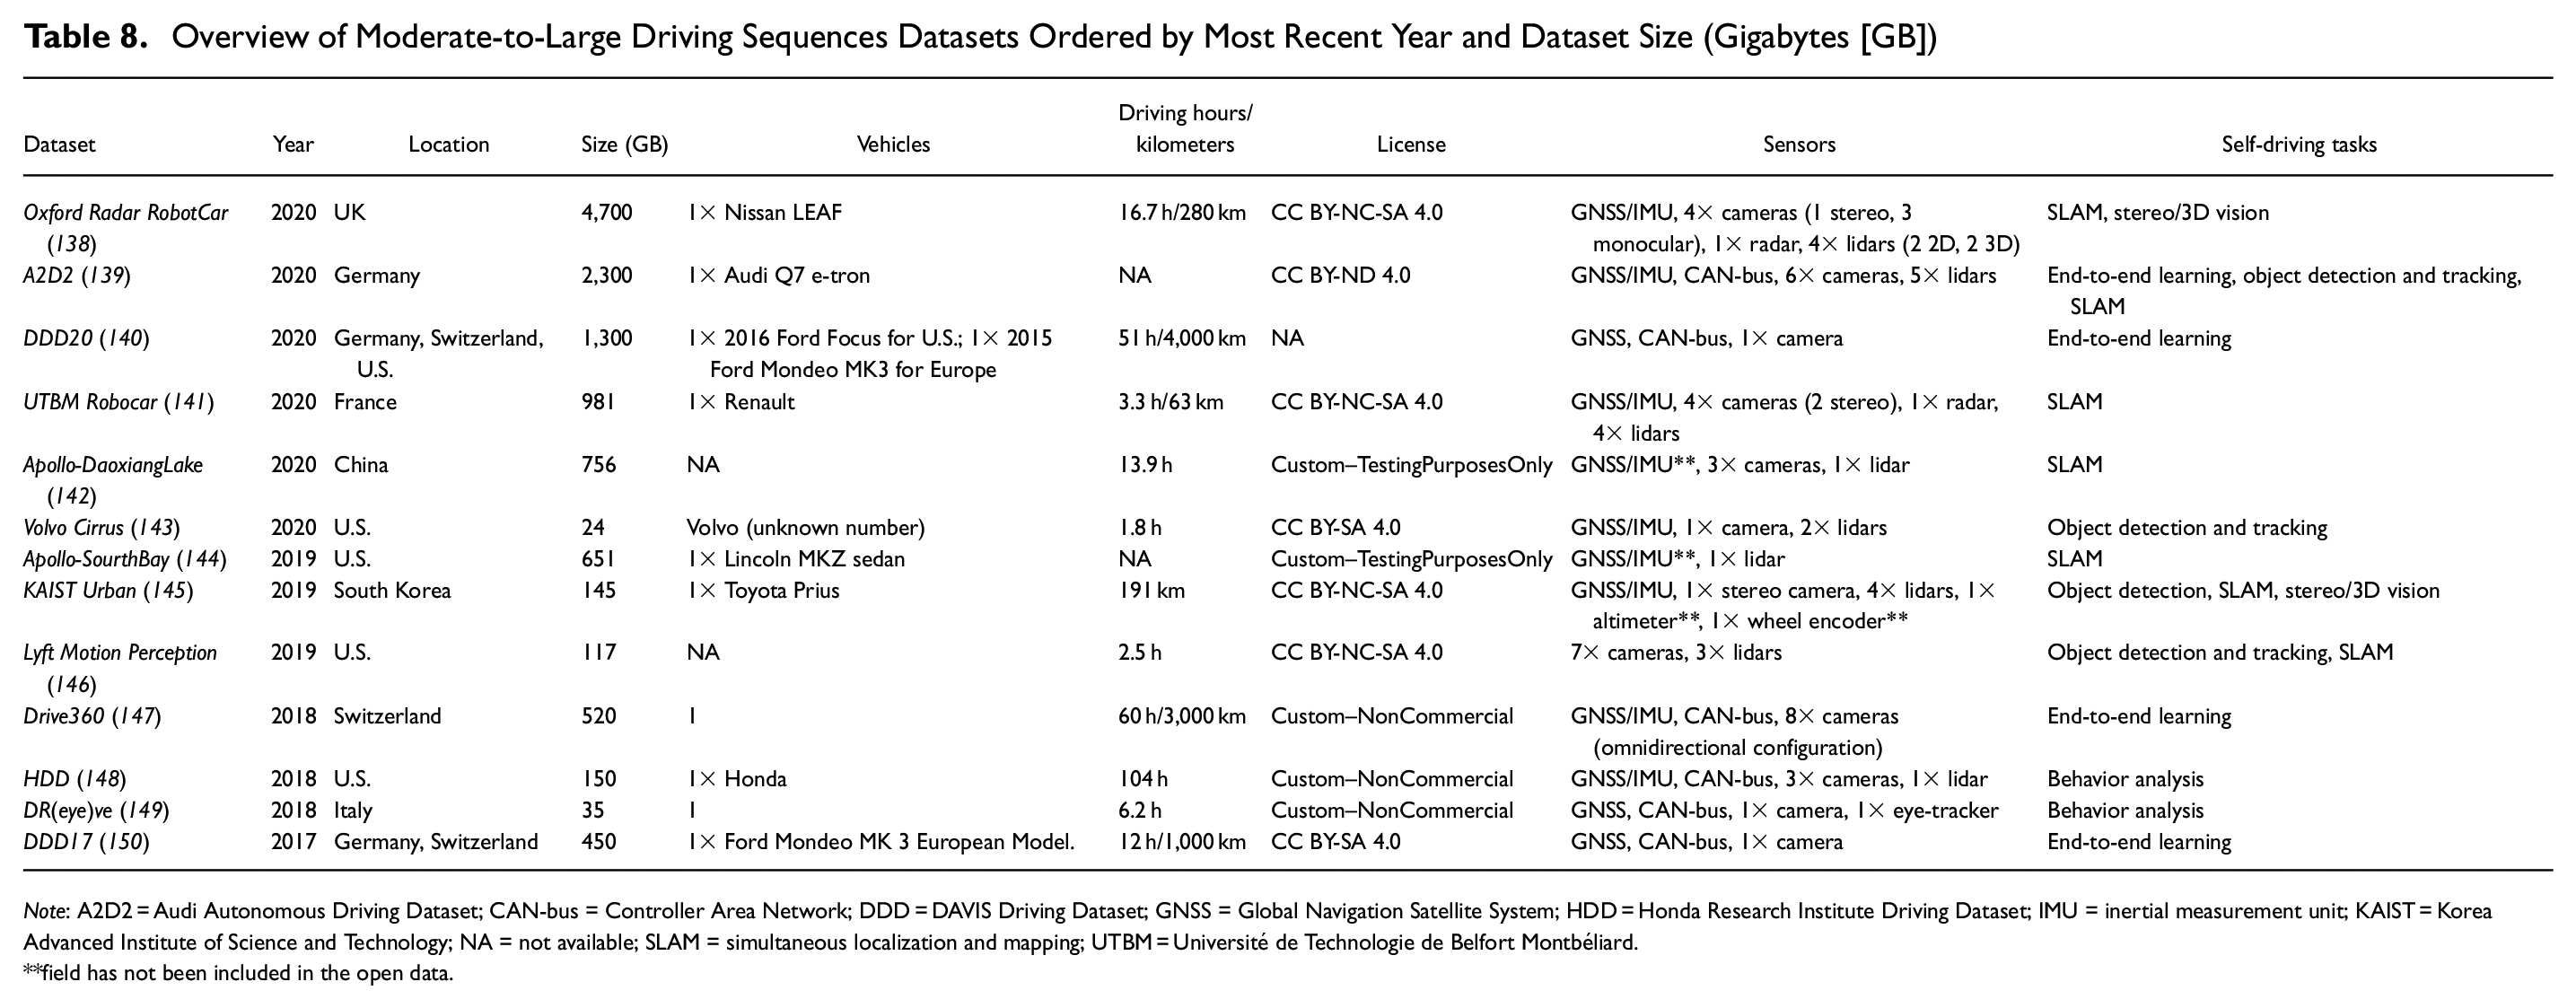
Note
field has not been included in the open data.
Overview of Moderate-to-Large Driving Sequences Datasets Ordered by Most Recent Year and Dataset Size (Gigabytes) [GB]) (Continuation of Table 8)
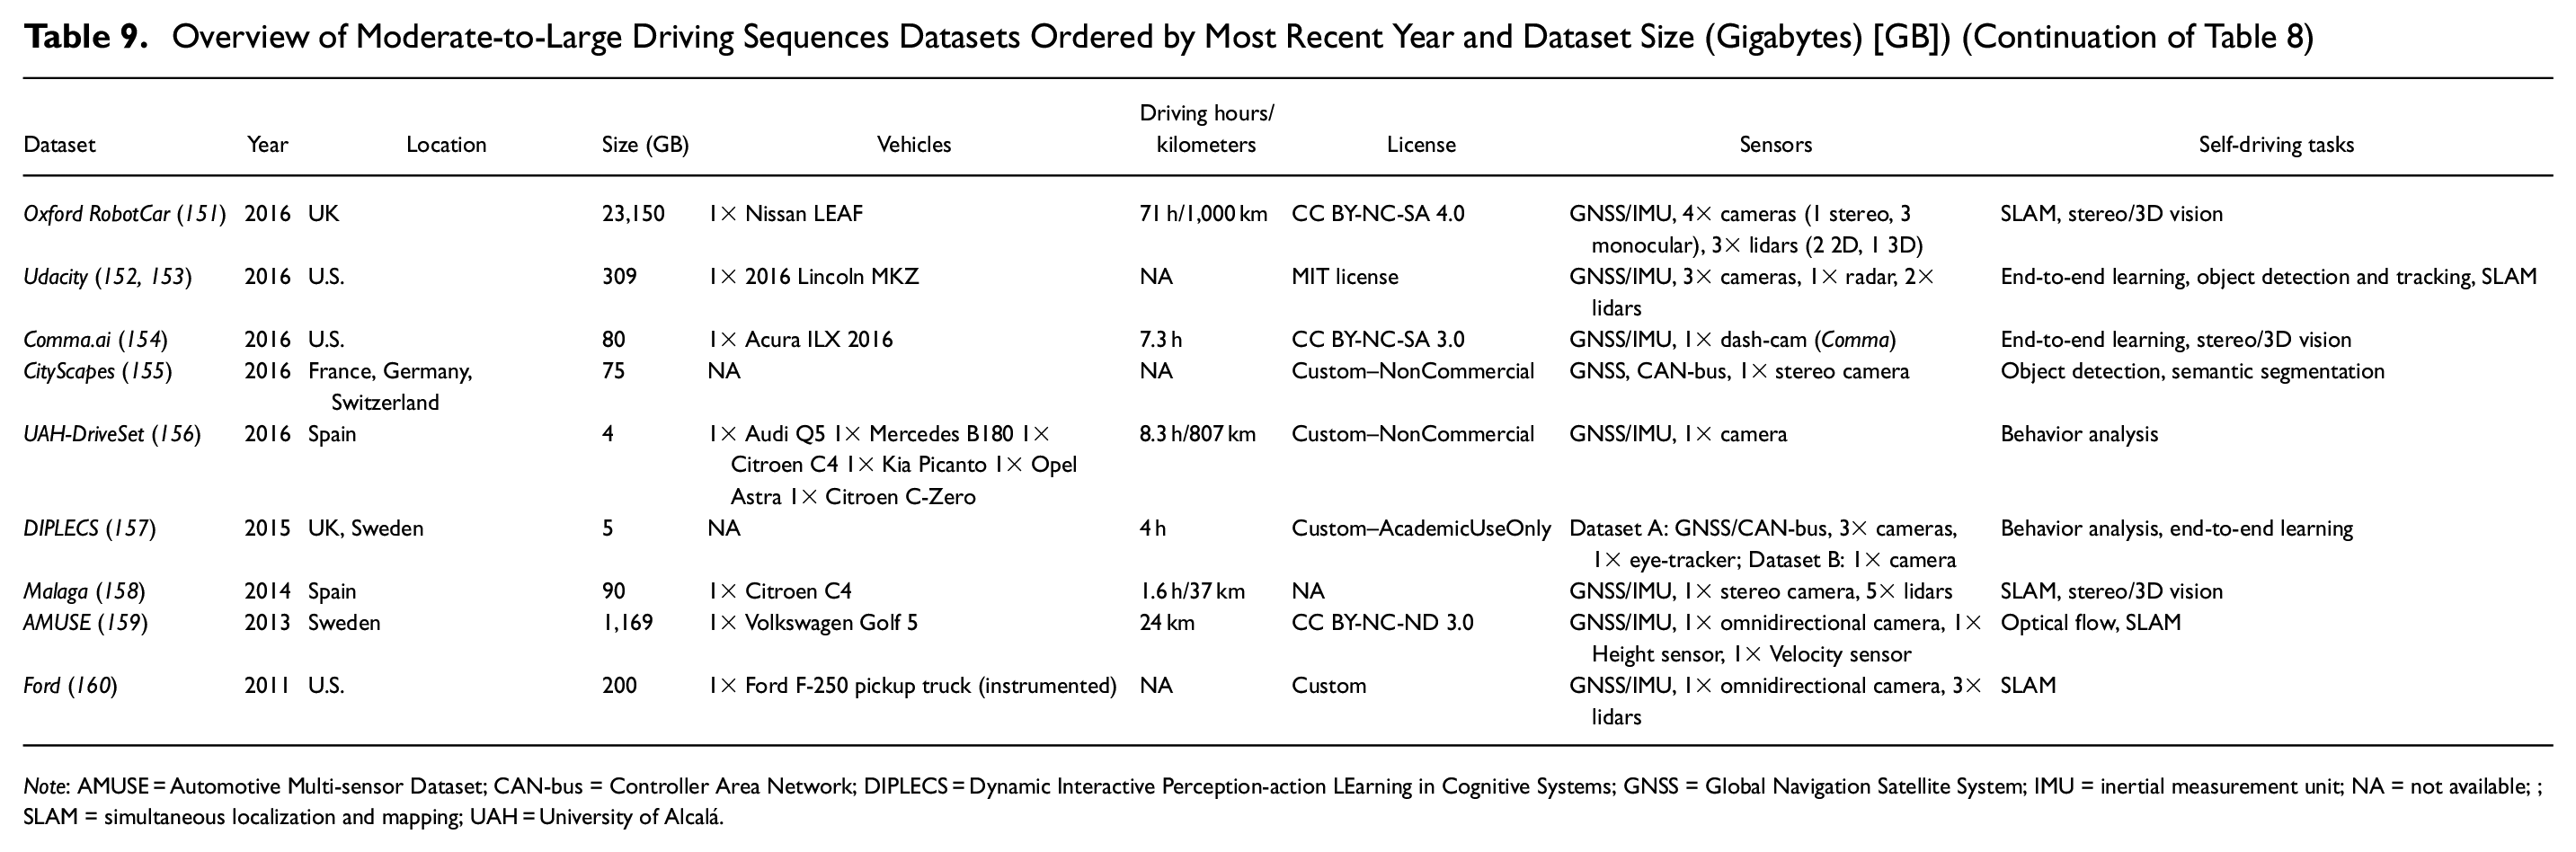
Note
Overview of Images-Only Datasets Ordered by Most Recent Year and Dataset Size (Gigabytes [GB])
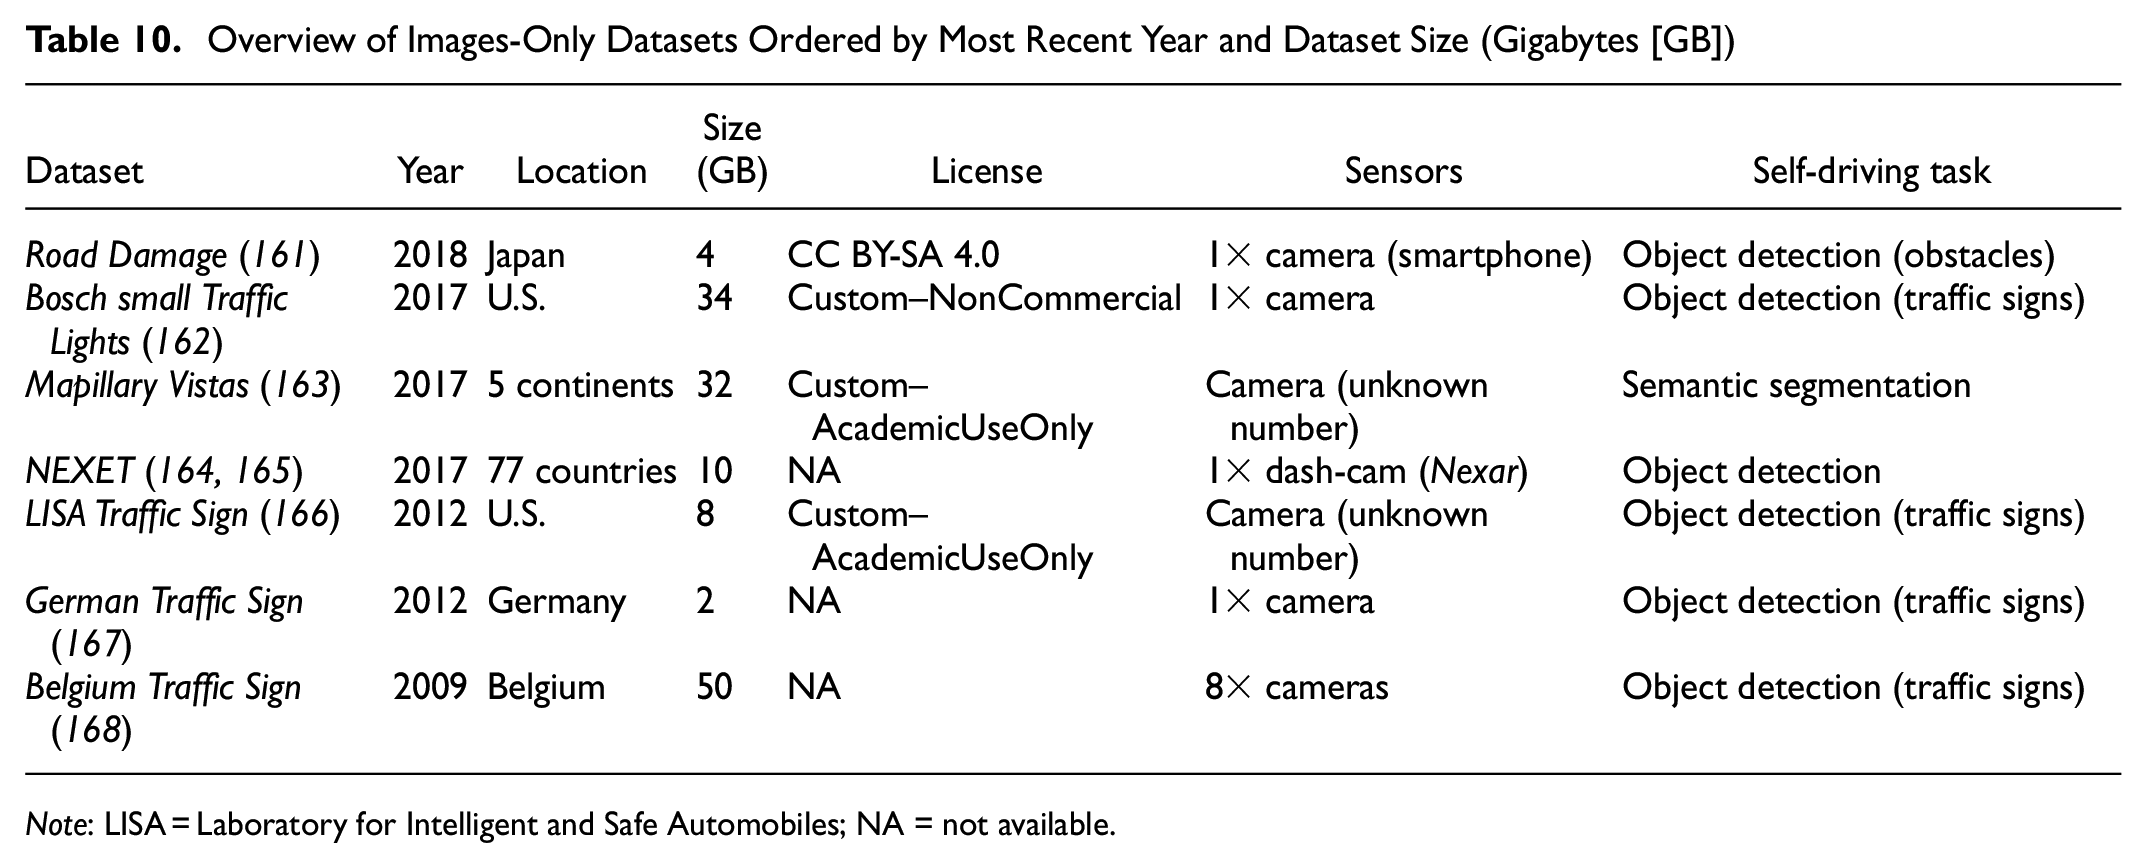
Note
There has been an increase in the number of publicly available datasets since 2016, resulting in 14 more datasets than the latest review ( 18 ). Not only has the number of datasets increased in recent years but so has the size of the data collected. This relationship can be observed in Figure 6 along with its respective trend on a logarithmic scale. Before 2018, only two datasets comprised more than 1 TB of data (Oxford RobotCar and AMUSE). Since then, eight datasets have already reached the TB scale, mainly attributable to the collection of a wide variety of data in distinct scenarios and to increased attention on end-to-end learning and SLAM algorithms. These datasets are: ApolloScape, A2D2, BDD100K, DDD20, DBNet, Oxford Radar RobotCar, UTBM Robocar, and Waymo Open Dataset. Each of these numbers can be observed in Tables 5–10.
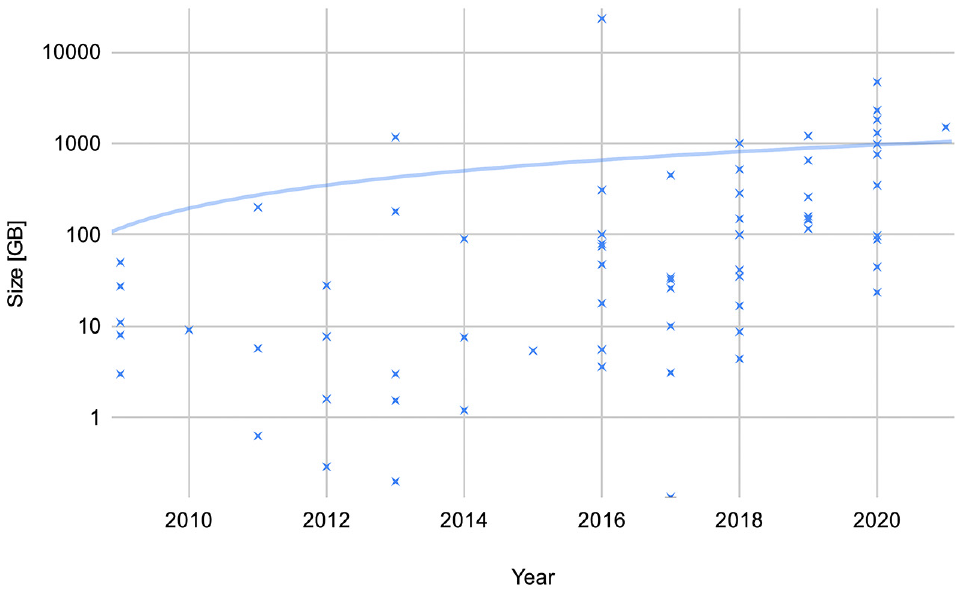
Size (gigabytes [GB]) of publicly available datasets for autonomous driving tasks by year of data collection on a logarithmic scale.
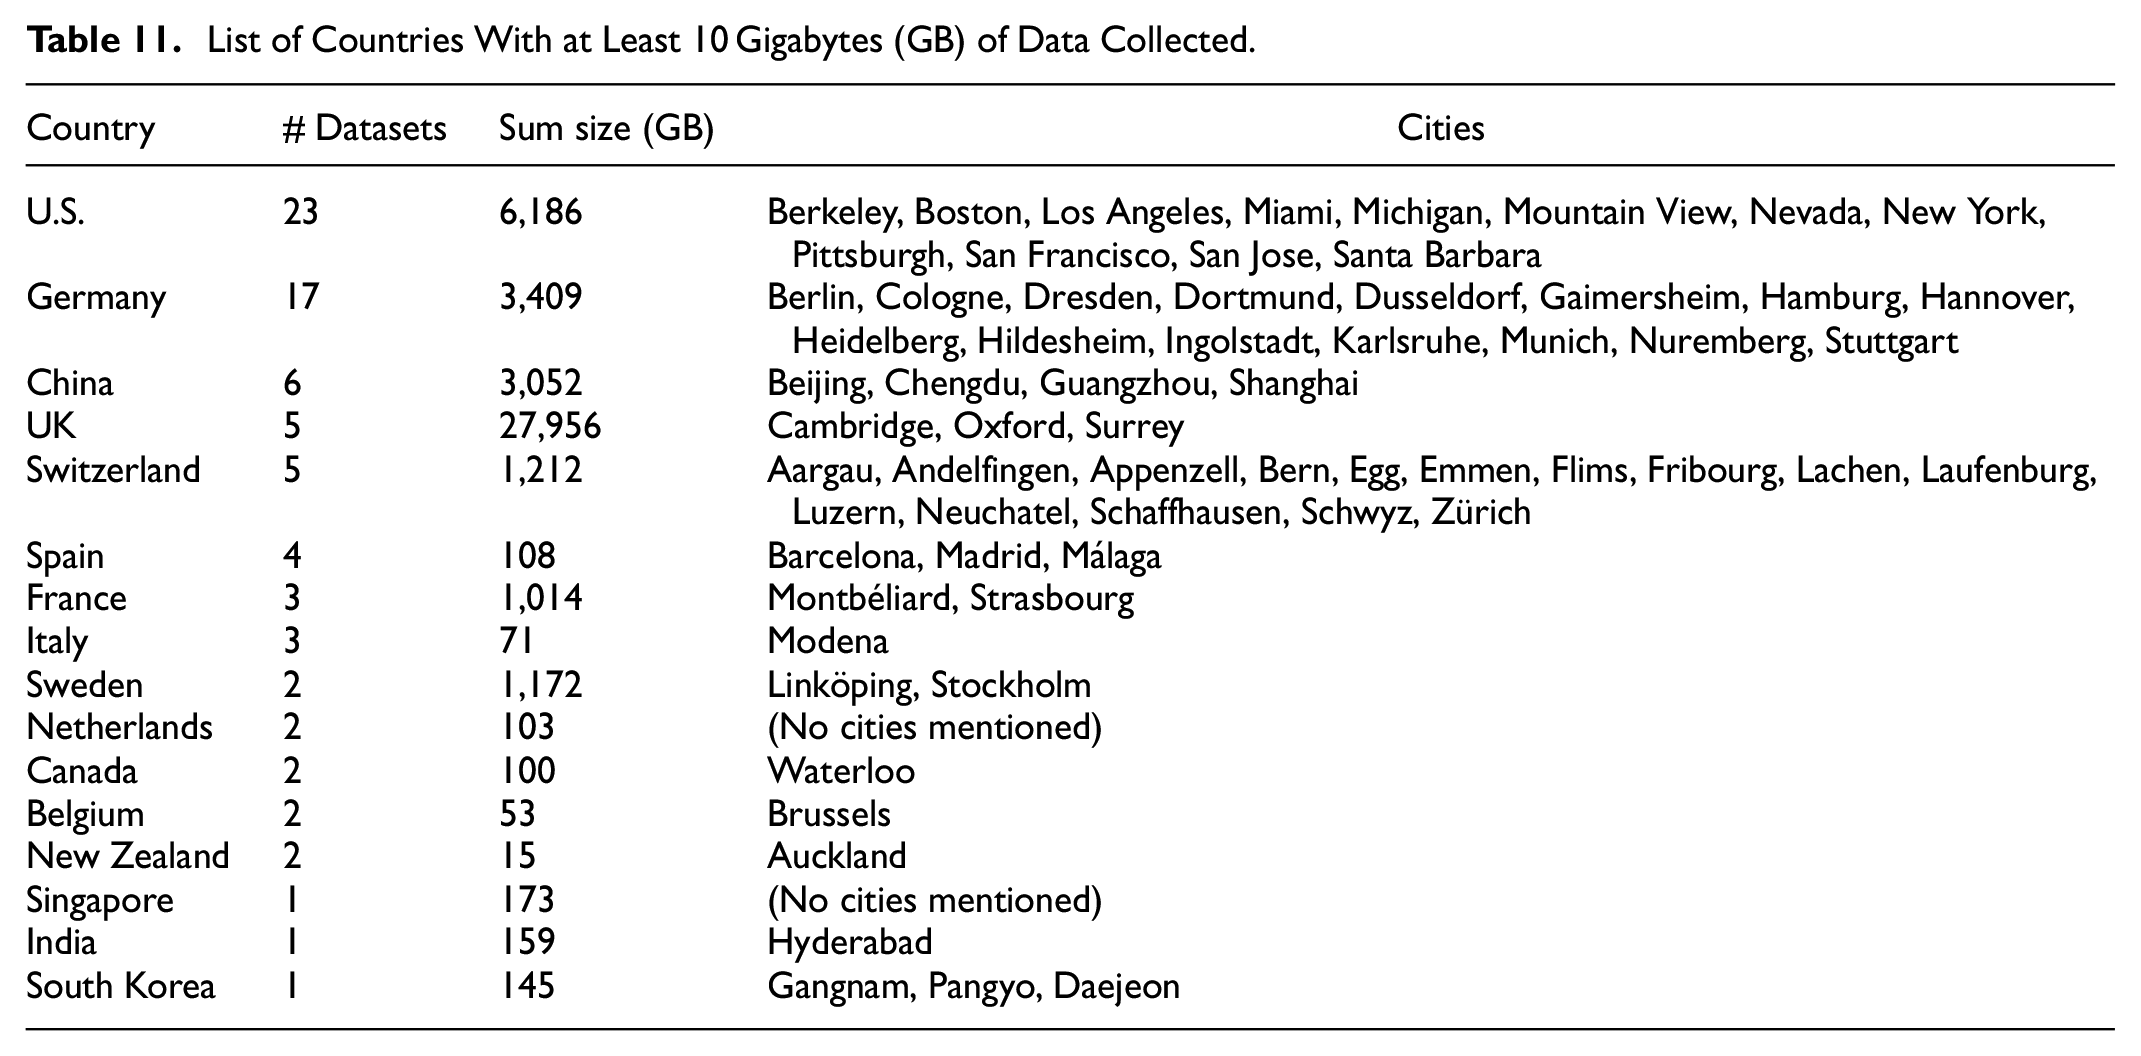
Table 11 shows the list of countries with at least 10 Gigabytes (GB) of data collected. The table presents the number of occurrences in datasets, the sum of dataset sizes, and the cities involved, according to the datasets publications. China, Germany, the UK and the U.S. are the countries with the largest number of data collection campaigns for self-driving tasks. These four countries have appeared in 51 datasets for autonomous driving tasks, collecting around 90% of the total publicly available data (40.6 TB out of 44.9 TB). Similar to the naturalistic driving datasets, there exist clear deficits of autonomous driving data globally. This could result in omissions of driving settings that might affect the robustness of the self-driving vehicle. As these areas might encompass unique features in areas like road infrastructure, driving regulations, and traffic patterns, the authors therefore encourage researchers to consider it for future data collection campaigns.
List of Countries With at Least 10 Gigabytes (GB) of Data Collected.
A variety of driving conditions is a desired dataset characteristic to capture diverse and realistic scenarios. A self-driving algorithm trained using different environments and adverse conditions is more likely to achieve a better generalization and performance than another trained using only ideal conditions. To picture the distribution of driving contexts in the surveyed datasets, Figure 7 lists the number of occurrences in relation to road types, diverse weather, time of day, seasons, and road conditions (e.g., tunnels, adverse lighting, heavy traffic). A considerable difference has been observed in the number of datasets carried out in urban roads in comparison with rural ones. Moreover, while there has been a satisfactory level of attention in diverse weather, road conditions and time of day, not many datasets have incorporated the season factor, which is expected because of the effort and resources required in such data collection campaigns.
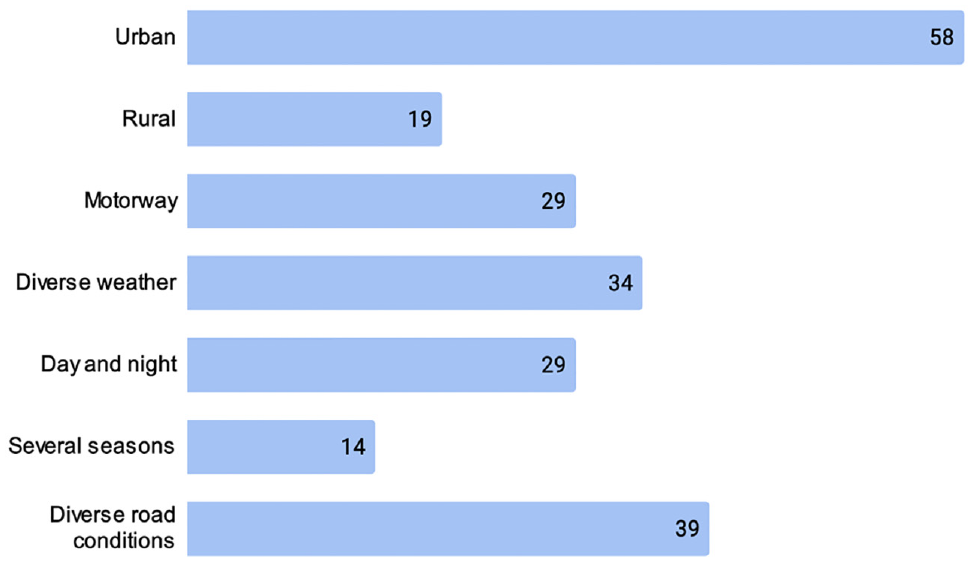
Number of surveyed datasets per driving context.
Several vehicle brands from different markets has been observed. Even though there has been no unified number of vehicles used in these campaigns, most of them consisted of only one instrumented vehicle. Three datasets (BDD100K, Mapillary Vistas and NEXET) utilized a crowd-sourcing method to gather many images or short driving sequences. A principal characteristic of this method is that a large group of people outside the research organization collects and submits the driving data independently. Thus, it has the potential to cover a wide variety of geographical scenarios. Nevertheless, there might be limitations in the type of data that can be transferred. As highlighted by Kang et al., this approach might work with GNSS/IMU, images, or short videos, but it would be unfeasible to use it with lidar, radar, or other high-frequency data ( 17 ).
Many of the datasets listed in Tables 5–10 are publicly available under non-commercial licensing, allowing their use for research purposes. A total of 20 use the Creative Commons (CC) licensing, with the Attribution-NonCommercial-ShareAlike (CC BY-NC-SA) 4.0 and 3.0, as the most adopted (N = 12). As for industrial stakeholders, nine datasets have been released under licensing schemes that allow commercial use: Cirrus, DDD17, and Road Damage (CC BY-SA 4.0); A2D2 (CC BY-ND 4.0); PandaSet (CC BY 4.0); Comma2k19, JAAD, and Udacity (MIT license); and BDD100K (BSD 3-Clause). Other datasets have been released under their own custom licenses and are generally intended for non-commercial or academic-only use. Datasets with missing or unclear licensing terms have been marked in Tables 5–10 as “NA” (not available).
The data features of each dataset can be inferred by the sensors involved. For instance, datasets containing cameras provide videos or isolated snapshots, depending on their target self-driving task. Similarly, datasets that use lidars to sense the environment, report lidar scans or point clouds. Most of the data collection campaigns have been carried out using vehicles instrumented with cameras, lidar, GNSS, and IMU, or with a combination of them. Five are the datasets that included radar measurements: Lyft Motion Prediction, nuScenes, Oxford Radar RobotCar, Udacity, and UTBM Robocar. Datasets that target specific analyses also used particular data acquisition devices such as driver-facing cameras in Elektra and EISATS, eye-tracking devices in DR(eye)ve and DIPLECS, and infrared cameras in Elektra and FLIR. Cameras have been observed as the most common data acquisition device, with a presence in 65 out of the 68 datasets. They encompass a variety of camera types, including monocular, stereo, and omnidirectional, in color or greyscale. Concerning lidar devices, Velodyne, Sick, and Riegl have been the most common brands, used in 76% of the datasets with lidar (26 out of 34). Table 12 presents a more detailed list containing dataset presence by lidar brand and model.
Lidar Brands and Models Used in the Surveyed Datasets
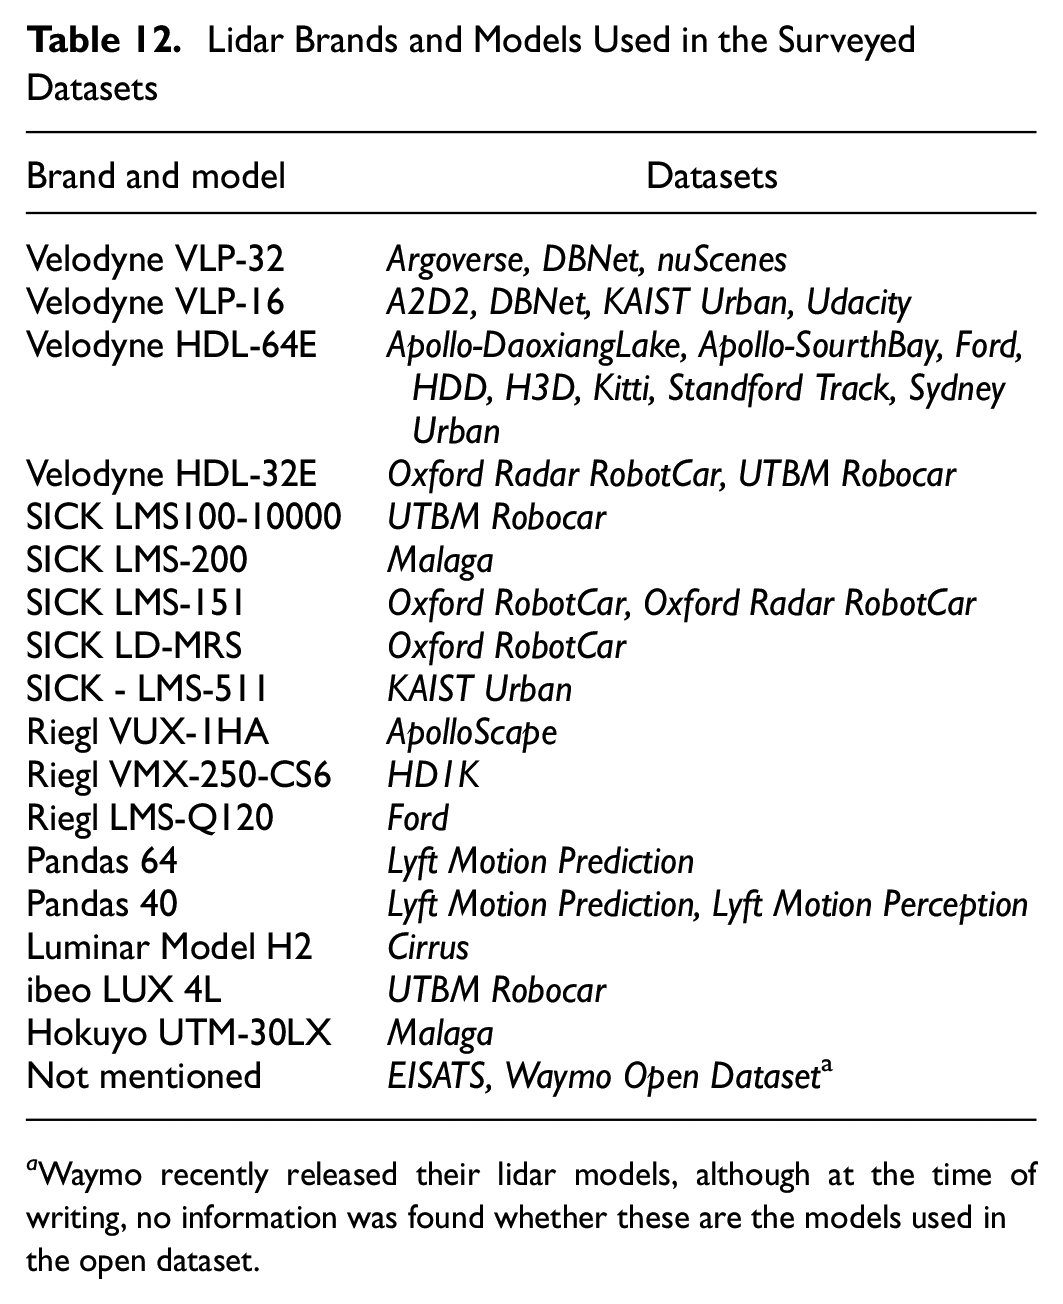
Waymo recently released their lidar models, although at the time of writing, no information was found whether these are the models used in the open dataset.
Use Case: Data-driven Risk Assessment in Connected and Automated Vehicles (CAVS)
Vehicular technologies and telematics platforms have been advancing at a considerable pace. As described in Section Review of Datasets and Use Cases, telematics solutions not only have the ability to identify driving patterns and behavior but also can use the driving context to make inferences about the driver’s risk profile. Motor insurers have been leveraging this information to enhance the predictive power of their actuarial models, in a market that represents approximately 140 billion euros in Europe and 290 billion dollars in the U.S. ( 169 ). However, the penetration of CAV technologies is expected to cause a potential reduction of 71% of total losses by 2050 ( 170 ). Therefore, insurers need to study emerging CAV trends for a successful adaptation to the transitioning vehicle ecosystem. This section introduces the evolution of risk assessment models in the motor insurance sector and highlights the current pain points in the insurance industry’s transition toward CAV. Furthermore, it proposes possible approaches to using the datasets presented in Section Review of Datasets and Use Cases for risk assessment in various levels of autonomy.
The motor insurance sector has been focusing on driving information to build accurate pricing models that address drivers’ different risk profiles with distinct premiums ( 171 ). If an insurer was to charge a single premium for the entire portfolio, low-risk drivers would pay higher prices to compensate for the losses of the risky ones. As a result, these low-risk customers would eventually move to the insurer that offers a premium that best matches their level of risk, typically reflected in cheaper premiums. Thus, there is a need to provide appropriate segmentation in the entire portfolio to offer risk coverage efficiently. Grouping policyholders by their risk profiles allows insurance companies to have different tariffs that reflect each group’s risk level. However, having many groups would make insurance products complicated and challenging to communicate with the customer. Importance is then attached to determining a proper segmentation level and using risk factors to classify drivers’ risk, something that requires diversity on the data the insurer collects from the policyholder.
With the integration of CAVS, the predictive power of traditional and telematics-based insurance schemes is being challenged. Since more than 90% of road accidents are caused by human errors, the risk of being involved in an accident is expected to shrink ( 172 , 173 ). However, risk factors are emerging with the upcoming vehicular technologies, which are expected to affect not only road accidents’ frequency but also the severity. There is, therefore, a need to study driving risk in each SAE level of autonomy, from level 0 (i.e., conventional vehicles) to level 5 (i.e., full autonomy) to allow a fair transition in insurance programs. This section focuses on this challenge and presents a perspective of the potential usage of datasets identified in Section Review of Datasets and Use Cases to overcome it.
Limitations and Research Gaps in Motor Insurance Schemes
To cover traditional driving risks, vehicle insurers have proposed statistical models for premium schemes based on a defined set of explanatory variables focusing on vehicle information (e.g., brand, model, year of vehicle), driver demographics (e.g., driver age, place of residence) and historical claims data ( 171 , 174 ). The main drawback of these models is that they are static or predictably dynamic (e.g., age, number of years licensed). Moreover, it is challenging to separate traditionally expensive segments, like young drivers, into safe and unsafe categories. This limitation is addressed via UBI frameworks, which incorporate dynamic driving variables such as behavior and context into the driver’s risk and, thus, the insurance’s tariff ( 175 ). For instance, Klauer et al. showed that risky drivers exhibit harder deceleration, acceleration, and swerve maneuvers during baseline driving than safe drivers ( 176 ). Ayuso et al. took this fact and presented improvements to a traditional insurance model by incorporating dynamic variables based on driving behavior, context, and exposure (e.g., speeding, road type, mileage) ( 177 ). Other data-driven risk assessment studies were able to leverage telematics data to segment drivers ( 178 ). Nevertheless, they have been limited to driving scoring to trigger specific insurance premiums’ variability without modifying the underlying insurance products’ actuarial basis. The reason is mainly associated with the lack of models explaining the correlation between telematics data and claims’ frequency and severity. However, there have been alternatives to claim data like the one proposed by Castignani and Masello ( 179 ). The authors proposed using public road safety statistics and around 30 dynamic driving variables associated with the leading causes of reported accidents.
With the growth in CAV technologies, there has been an increasing number of studies investigating emerging driving risks factors. As in risk assessment for conventional vehicles, driving dynamics have been the focus of research in the literature ( 180 – 184 ). Motion prediction and real-time risk assessment methods have been developed to foster safe decision-making when the vehicle is in automated mode ( 185 , 186 ). In parallel, a strong focus has been placed on driver behavior and HMI. Fridman proposed a human-centered approach where the driver’s state is considered at every moment, even for highly automated vehicles ( 97 ). Having situational awareness about the driver’s behavioral features such as the glance region, hands and body position, and fatigue enhances the human-machine pair’s safety. Depending on these features, the vehicle could take over some driving tasks when the human is in control. In automated mode, the driver should always be aware of the confidence level and the estimated risk of the automated functions (i.e., share the perception task) to ensure safety and enhance trust in the system. Similarly, Morando et al. and Reimer et al. studied the behavior of drivers under different automation levels ( 98 , 187 ). The authors found that drivers divert their vision off the road more frequently at higher levels of automation, although the user manual states that drivers are required to remain attentive while using the autopilot feature.
Other emerging risks are related to external factors such as cyber-security, the neighboring vehicles’ influence, and weather conditions. With the increasing penetration rate of connected vehicles, the potential for cyber-related losses has been a focus in industry and research. Sheehan et al. presented a methodology to classify cyber-risk of using Bayesian networks (BN) based on expert opinion along with quantitative and qualitative information from the National Vulnerabilities Database (NVD) ( 188 ). Security attacks have also been studied by Cui et al. ( 189 ). In particular, the authors listed the different attacks along with their respective countermeasures. The categories involved were: (i) availability (e.g., malware, denial of service), (ii) data integrity (e.g., masquerading, data alteration), and (iii) confidentiality/policy (e.g., eavesdropping, data interception). Katrakazas et al. and Wang et al. investigated the risk associated with the surrounding vehicles by leveraging the ego and neighboring vehicles’ driving patterns and their interaction ( 190 , 191 ). Another external factor that could affect driving performance and ADAS functionalities is the weather condition. For instance, Yue et al. studied this impact on the forward collision warning (FCW) performance under fog conditions ( 192 ). Nevertheless, further research is needed to cover adverse weather conditions and a variety of ADAS components.
In particular automated driving situations, the driving responsibility might shift from the vehicle to the human driver. This situation is known as a disengagement event or takeover request, which could be triggered by the human driver or because of the machine’s inability to perform a given task. For machine-initiated disengagements, sufficient time must be given to the driver to regain control of the vehicle, and, at the same time, the driver must be able to react appropriately. A driver who fails to respond to a takeover request while the vehicle is in control will increase the likelihood of being involved in a hazardous situation. In an effort to make the deployment of automated vehicles more transparent, the California Department of Motor Vehicles (DMV) mandated that manufacturers testing AVs on California public roads must provide reports concerning disengagement events and accidents that involve these vehicles. Among these reports, road infrastructure was found to be a relevant cause for disengagements, mainly attributed to poor road conditions and improper traffic light detection ( 193 , 194 ). Furthermore, driver reaction time presented changes according to the roadway type, with quicker times found on local roads than on motorways ( 193 , 195 ). Concerning AV accidents, in the majority of the cases, the reported accidents occurred at an intersection, with the AV being rear-ended, and no instances in which the vehicles involved were traveling in opposite directions ( 196 , 197 ).
A key observation from the surveyed studies is that, regardless of the level of automation, the driving context plays a crucial role in the exposure to an accident. In conventional vehicles, the context influences the driver’s attitude toward the driving task (i.e., driver behavior). Zhu et al. showed that incorporating the driving context leads to a better performance in risk assessment models ( 198 ). With the addition of automated features (i.e., SAE level 1–3), the context affects not only the driving performance but also the use of automated features. A study of a fleet of 132 Volvo SAE level-two vehicles analyzed the automated features’ usage and perception along with the driving context ( 199 ). The results showed that the traffic condition was the most relevant factor influencing ADAS usage, more than weather conditions and road layout. In the highest level of automation (i.e., SAE level 4–5), where the driver does not participate in the driving task, the context still influences the accident’s exposure. Even though driver behavior and HMI are taken out of the equation, the driving performance and the proper execution of autonomous driving tasks are subject to the driving context.
As the vehicular ecosystem evolves toward higher automation levels, so must insurance schemes. However, the pain point in the link between the risk factors and claims or safety-relevant data remains and constitutes a major challenge for the deployment of different automation levels. The following section presents approaches and possible uses of publicly available datasets to overcome the main challenges in risk assessment for CAVs.
Risk Assessment Approaches
The vehicular ecosystem transition from traditional vehicles to fully autonomous vehicles (i.e., from SAE level 0–5) has introduced several risk factors presented in the previous section. These risk factors could be grouped into the following categories: (i) risks related to vehicle dynamics and HMI, (ii) risks associated with the potential failure of automation components (hardware and software), and (iii) risks related to external factors such as cyber-risk. This section discusses possible approaches to assess these risk categories.
A limited number of comprehensive analyses infer the risk score in the aforementioned categories holistically. In particular, two studies introduced relevant approaches to this problem: Sheehan et al. and Bhavsar et al. ( 200 – 201 ). In the former, the researchers proposed a conceptual framework using a BN to model expected claims losses with telematics data gathered from vehicles with different automation levels. In particular, the authors modeled the two principal factors of traditional actuarial schemes, namely, the frequency and severity of claims. The components used by the framework were related to driver behavior (speeding, harsh braking, harsh acceleration, and sharp steering), driving context (weather conditions, time of day, road type), and driving exposure (distance, speed, and time-to-collision). The latter, Bhavsar et al. posited an approach that computes the AV’s failure probability using a fault-tree model ( 201 ). The authors used two main categories: vehicular components threats (hardware, software, V2X, and HMI) and external threats (surrounding vehicles, weather conditions, road type, and road infrastructure). Each category had its fault-tree, allowing various statistical models to capture independent failure probability distributions (i.e., each leaf having a failure probability distribution). Then, the overall failure probability was estimated based on the number of times the autonomous tasks could be stopped during the vehicle’s lifetime because of the occurrence of one or more basic failures.
Even though the works of Sheehan et al. and Bhavsar et al. are relevant to the vehicular ecosystem transition, they have limitations for their use outside academia ( 200 , 201 ). The fault-tree model proposed by Bhavsar et al. computes threats from external components using crash records and vehicular components’ failure probabilities from the literature. Among other limitations mentioned by the authors are the assumption of independence between the events and that the failure rate remains constant over time. The Bayesian approach of Sheehan et al. presented a novel method toward the transition in the insurance market, technically and timely speaking. Nevertheless, the network could be augmented, incorporating emerging risk factors mentioned in the previous section. For instance, including: (i) aspects of driver behavior and HMI (e.g., driver attention, driver’s reaction time to take over requests), (ii) more contextual variables such as road topology or presence of traffic signs, (iii) failure probabilities of automation components as prior probabilities, and (iv) external factors related to cyber-risk or the interaction with surrounding vehicles (e.g., using behavioral hot-spots detection, as studied by Ryan et al.) ( 202 ).
The sections below present alternatives to infer risk in the vehicular ecosystem. These approaches comprise the analysis of surrogate safety measures, counterfactual simulations, scene driveability and publicly available road safety reports.
Surrogate Safety Measures and Counterfactual Simulations
To assess each risk factor’s importance, there is a need to find an association with vehicular accidents or claims. As described in previous sections, having access to such databases linked with vehicle telematics might be challenging. Even though accidents are infrequent, most of them are predictable with the history of driving patterns and driver behaviors. Based on this fact, researchers have posited using near-crashes as a proxy to vehicular accidents ( 203 ). Surrogate safety measures arose as a widely used approach to compute these safety-relevant situations. Typically, they comprise variables related to time proximity (e.g., time-to-collision) and evasive maneuvers (e.g., lane changing conflicts, critical jerks) ( 204 ). For instance, Zhao and Peng presented an evaluation process that filters out uneventful driving data to infer risk, processing only potentially dangerous situations ( 205 ).
Determining what “safe” means in relation to the automated vehicle is not straightforward ( 206 ). AVs would have to be driven hundreds of millions of miles to give statistical evidence about their safety in relation to traffic injuries and fatalities ( 207 ). This is an impossible proposition if the objective is to provide evidence about their safety performance before their general deployment on public roads. The development of AVs needs innovative methods to demonstrate safety. One such method is counterfactual simulation (i.e., what-if scenarios), where the focus is on understanding how the vehicle would have reacted if it had continued in the automated driving mode under hazardous situations. Following this approach, Webb et al. collected safety-relevant situations that require the driver to take over the driving task and analyzed them using counterfactual scenarios ( 208 ). In particular, this approach is relevant since these counterfactual simulations are generally more realistic than synthetically generated events.
A viable alternative for risk assessment in a variety of automation levels might involve a combination of the previously mentioned surrogate safety measures and counterfactual simulations. For every safety-relevant or disengagement event, simulations could be performed to analyze alternative outcomes if the driver or the automated vehicle had not reacted appropriately. This might be an appropriate approach, since it relies on real-world driving situations (i.e., relevant scenarios from naturalistic data) and not purely on simulated conditions produced in a controlled manner. Furthermore, it is possible to compare the outcomes based on the different automation levels. In a vehicular ecosystem with multiple automation levels, an automated vehicle is expected to reduce the frequency of safety-relevant situations. However, HMI gains more importance as the driver reaction time’s profile influences the exposure to an accident after a disengagement.
Driveability of a Scene
For higher levels of automation (i.e., SAE level 4–5), determining how easy it is in a given driving situation for the vehicle to perform the automated driving task correctly could be a significant component when assessing the exposure to an accident. This concept is known as the “driveability” of a scene and has been used in recent studies. Hecker et al. proposed a framework to compute scene driveability scores through an end-to-end learning approach ( 209 ). The framework used video data from the front-facing camera to predict steering and speed values. The predicted values were compared with the ground-truth human driving values, and the difference determined the driveability score. Then, this score constituted the input of another network that predicted hazardous situations. Even though the model was based on video data, the authors mentioned that it could be extended to other sensors such as lidar and radar. Similarly, Scheel et al. proposed a method to assess safe lane-change maneuvers ( 210 ). However, in this case, the model was based on neighboring vehicles’ motion information.
Future research should investigate whether these driveability models could be combined, or extended with more driving maneuvers to produce a comprehensive driveability assessment. Further, a robust driveability assessment model could serve as an additional component of the BN presented by Sheehan et al., taking relevance when the vehicle is driven in automated mode ( 200 ).
Road Safety Reports
Public data usage arises as a significant factor in promoting transparency and objectivity when weighing risk factors in a connected and automated ecosystem. The California DMV initiative to promote AV safety-relevant incident reports is a relevant approach toward this end. However, AV accident reports are not yet sufficiently statistically significant to weigh risk objectively. At the same time, there is a need to have similar reporting campaigns in other parts of the world, hopefully, in a standardized or unified manner.
Disengagement reports might also be a useful reference to weigh the relevance of risk factors. Manual disengagements might indicate a lack of trust in the system, influencing human-machine interface factors ( 193 ). Variables such as the driving context, driver-reaction time, and the autonomous miles in different environments might be matched against these reports’ statistics to provide an objective risk assessment score. Nevertheless, there are some of limitations to this proposition. There is a lack of context and standardization concerning contributory factors’ categories among different manufacturers. Also, a disengagement does not necessarily lead to an accident, with an average of only 1 out of 178 disengagement occurrences resulting in an accident or other injury to people or property ( 194 ). Another drawback is that these reports are static images of dynamic vehicular technologies in one place at particular moments. Therefore, a disengagement event reported for a given vehicle model in a particular year might have triggered a software or hardware update, deprecating the disengagement’s relevance in relation to risk. Similarly, manufacturers could be testing a given model in California while running production-ready models in other states or countries. Therefore, disengagements that apply for the testing vehicle cannot be generalized to the manufacturer’s fleets.
Using Publicly Available Datasets in Risk Assessment Approaches
The substantial number of resources and the vast complexity involved in large-scale NDS like SHRP2, SPMD, and UDRIVE mean that they cannot be done and supported frequently (i.e., more than once in a decade) ( 32 ). Therefore, combinations of datasets containing safety-relevant events, such as those presented in Section Naturalistic Driving Datasets and virtual environments emulating automated driving, constitute a potential alternative to assess differences in risk for different automation levels. This section proposes a mapping to use the publicly available datasets surveyed in this paper to implement the approaches introduced in the previous section.
The SHRP2 dataset has been extensively used because of its driving data granularity and the presence of near-crash and crash events. Abdelrahman et al. used this dataset to compute driver risk profiles expressed in relation to the probability of being involved in a safety-relevant situation ( 211 ). In particular, the authors built a model with supervised machine learning that consisted of 13 surrogate safety measures that served as a proxy for driver behavior (e.g., aggressive driving, excessive speeding, slow driving). The output probability was then given by the sum of the proportion of crashes and near-crashes, considering all recorded events for each driver. Although this model has relevance for the current ecosystem of pay-how-you-drive (PHYD) models, the concern about its use on higher levels of vehicle automation remains. The benefits of ADASs have been evaluated by Bärgman et al. using counterfactual simulations of 34 lead-vehicle collisions from SHRP2 ( 67 ). In particular, the authors have studied the safety benefits of FCW and automatic emergency braking. Surrogate safety measures have also been used with SPMD. He et al. studied road segment safety by analyzing the relationship between crash records and surrogate safety measures obtained from that dataset ( 212 ).
Many of the datasets for AVs studied in Section Datasets for Autonomous Driving Tasks could be used to train driveability assessment models. Datasets containing sequences of camera images and IMU data could replicate the model of Hecker et al., for instance, Berkeley DeepDrive (BDD100K) ( 209 ). The more relevant data types used to train the model, the more comprehensive the driveability assessment would be. Therefore, to capture more situations using the surrounding information, the model could be extended with data from lidars, radars, or omnidirectional cameras. The nuScenes dataset is an example of the datasets that could be used for such a purpose, containing 1,000 20 s driving sequences with a wide granularity of data.
Nevertheless, as Guo et al. highlighted, an existing drawback of end-to-end learning approaches is that there is a significant dependency on the training set ( 18 ). A proper model needs to capture various driving situations to perform reliably in a production-ready environment. To make a step toward this end, Guo et al. reviewed the driveability factors that might negatively affect the performance of the driving task and highlighted the datasets that might be useful to cover them ( 18 ).
The approaches mentioned above propose future work in risk assessment for different automation levels based on the publicly available datasets surveyed in this paper. However, the resulting model would lack objectivity, since there are no links with claims data yet. While pay-as-you-drive (PAYD) and PHYD schemes have been widely studied in recent years, there is room for innovation in insurance schemes for semi- and fully automated vehicles. A risk methodology capable of providing accurate scores for the evolving vehicular ecosystem would enable a fair transition in the insurance market with premiums that accurately reflect the policyholders’ level of exposure. To achieve such a stage, this paper encourages further collaborations in the research community for gathering semi- and fully automated vehicle telematics datasets that capture safety-relevant events.
Recommendations for Future Data Collection Campaigns
As presented in Section Review of Datasets and Use Cases, there has been a significant effort in the vehicular industry and research community to promote driving data for different use cases. Naturalistic driving datasets have been beneficial to understanding underlying factors in the driving task, mainly related to driving patterns and driver behavior using conventional vehicles (i.e., SAE level 0–1). On the other hand, public datasets concerning semi- and fully automated vehicles are generally intended to train automated driving tasks and have been performed in manual driving. To the authors’ knowledge, there is a current lack of publicly available naturalistic datasets focusing on partial and conditional driving automation (i.e., SAE level 2–3), analyzing the usage of the automation system and their disengagement events. This constitutes a pain point for research in the dynamic vehicular ecosystem. Naturalistic data collection initiatives with, initially, semi-automated vehicles are encouraged to investigate further the transition toward automated vehicles in transportation domains such as the insurance market. For instance, a recent campaign using semi-automated vehicles was presented by Fridman et al. ( 213 ). It consisted of a large-scale NDS focused on driver behavior and HMI. However, the dataset is not publicly available.
In an effort to encourage data collection campaigns for semi-automated vehicles in a lightweight manner, Table 13 presents an example of desirable trip features. Reporting uneventful data should be avoided to reduce possible constraints to data collection, complexity, and transfer. Thus, it is suggested that features such as time-to-collision, distance to the front vehicle, and IMU data are recorded only within a time window around safety-relevant situations or disengagement events. However, this does not apply to the trip path, since having this information sampled at a considerable rate makes it possible to perform driving exposure analyses (i.e., when and where the vehicle is driven). Other data types provide information about events or status changes, and therefore they might be recorded as discrete events. Examples of this category include ADAS events, safety warnings, disengagement events and responses, and driver behavior events. The availability of such data would be beneficial for risk assessment approaches, since it allows the analysis of the automation system usage and naturalistic situations where automated features fail. Finally, for risk assessment in higher automation levels, the presented list could be augmented with lidar, radar, or camera data sampled in a time window manner around safety-relevant events.
Desirable Trip Features for Connected and Automated Vehicle (CAV) Data Collection Campaigns Focused on Risk Assessment.
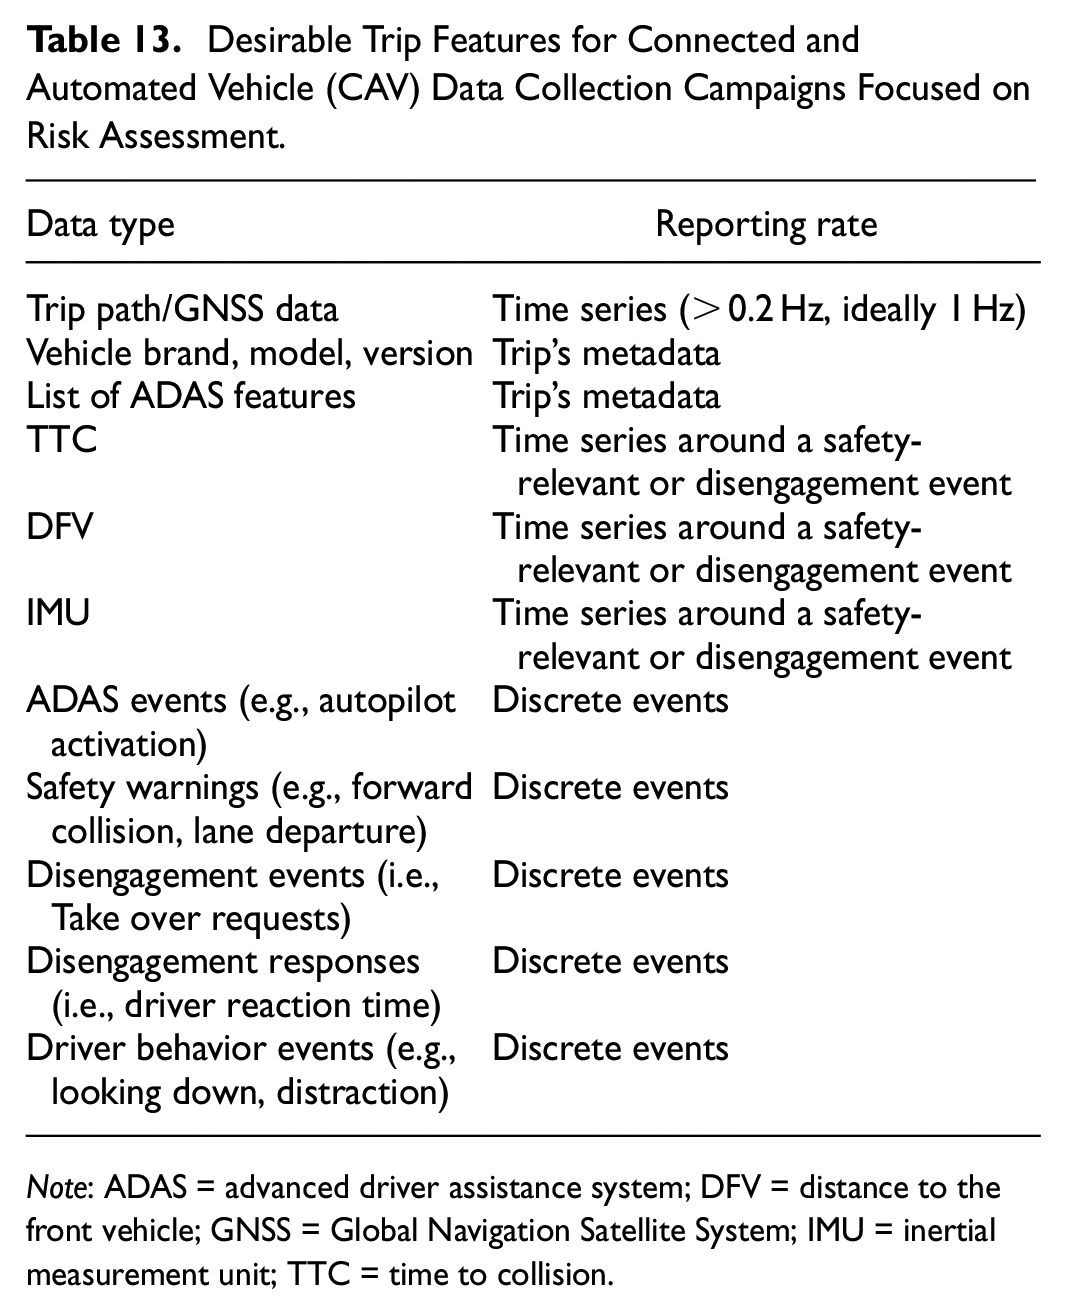
Note: ADAS = advanced driver assistance system; DFV = distance to the front vehicle; GNSS = Global Navigation Satellite System; IMU = inertial measurement unit; TTC = time to collision.
The availability of this type of information represents a critical factor for insurers in the transition to CAVs. It would help them understand their policyholders’ exposure by analyzing how and where they interact with automated features. Complementarily, matching this understanding with severity and loss information of different automation levels would help them provide fair premiums for the whole portfolio. Such a process might eventually determine their successful adaptation to the vehicular transition. A risk assessment capable of offering accurate scores for a wide variety of policyholders might enable sustainable development, transparency, trust, and regulation in the insurance market.
Conclusion
This paper has been the first systematic review of the available vehicle telematics sources covering the complete range of vehicular automation, from naturalistic driving campaigns using traditional driving to training datasets for autonomous driving tasks. The review has combined previous surveys in distinct automation levels and extended them with new datasets. In total, 103 datasets have been reviewed—18 naturalistic driving datasets performed with research-designated DAS, 17 with smartphones or dash-cams, and 68 datasets for training self-driving tasks. A detailed description and comparison has been performed, highlighting the instrumentation levels and open data availability. In all cases, it has been observed that there exists a stark disparity in the number of vehicular datasets by geographical area, with the majority of studies performed in Europe and North America. This could limit transportation development in less-studied areas and affect self-driving tasks’ robustness because of omissions of driving settings with unique features such as road infrastructure, driving regulations, and traffic patterns. Thus, more cooperation between the transportation departments of different countries is encouraged.
Furthermore, the review has analyzed dataset applications in several study domains. Naturalistic studies have been analyzed by their evidence in eco-driving, road safety and transportation planning, whereas datasets for autonomous driving by self-driving tasks. The major areas of study have been road safety in naturalistic driving datasets, and object detection and tracking in self-driving datasets. The paper has also performed a comprehensive study of data-driven risk assessment for CAVs, highlighting the existing challenge in the transition toward higher automation levels. It has been observed that there exists a lack of publicly available naturalistic driving datasets using automated vehicles in self-driving mode and datasets that focus on the usage of automation features and their associated safety-related events such as take-over requests. This constitutes a key room for improvement to enable collaboration, innovation, and transparency in risk assessment methods for CAVs. Therefore, this paper has suggested desirable trip features for future data collection campaigns and proposed alternative approaches to leverage the reviewed datasets for risk assessment modeling for CAVs.
Future research on geographical areas with little-to-no publicly available vehicular datasets is encouraged to understand a wider range of driving settings. Further studies could also investigate standardizations in data fields and format for scientific benchmarks and replication. Simultaneously, this paper promotes future research on publicly available naturalistic CAV datasets, including features related to the interaction between the human driver and the automated features, and ADAS data, ideally covering a wide variety of adverse scenarios. Such future work will complement this paper’s contributions, which provide the research community with a comprehensive description of a significant number of vehicular datasets, at different automation levels, together with a mapping to their study domains.
Footnotes
Abbreviations
A2D2 = Audi Autonomous Driving Dataset;
ADAS = advanced driver assistance systems;
AMUSE = Automotive Multi-Sensor Dataset;
ANDS = Australian 400-car naturalistic driving study;
AV = autonomous vehicle;
BDD = Berkeley DeepDrive;
BN = Bayesian network;
BNDS = Brazil naturalistic driving study;
CADC = Canadian Adverse Driving Conditions;
CAN = controller area network;
CAV = connected and automated vehicle;
CC = Creative Commons licensing;
CC BY-NC-SA = creative commons licensing, with the attribution-noncommercial-sharealike;
CNDS = Canadian Naturalistic Driving Study;
CSIR = Council for Scientific and Industrial Research;
DAS = data acquisition system;
DDD = DAVIS driving dataset;
DFV = distance to the front vehicle;
DIPLECS = Dynamic Interactive Perception-action LEarning in Cognitive Systems;
DMV = Department of Motor Vehicles;
EISATS = Image Sequence Analysis Test Site;
EuroFOT = European large-scale field operational tests on in-vehicle systems;
FCW = forward collision warning;
FOT = field operational test;
GB = gigabytes;
GNSS = global navigation satellite system;
GPS = global positioning system;
H3D = Honda Research Institute 3D Dataset;
HCI = Heidelberg Collaboratory for Image Processing;
HMI = human-machine interaction;
Hz = Hertz;
IDD = India Driving Dataset;
IMU = inertial measurement unit;
ILSVC = international large-scale vehicle corpora;
IVBSS = integrated vehicle-based safety systems;
JAAD = joint attention in autonomous driving;
JAMA = Japan Automobile Manufacturers Association;
LISA = Laboratory for Intelligent and Safe Automobiles;
NDS = naturalistic driving study;
NTDS = naturalistic teenage driving study;
NVD = National Vulnerabilities Database;
OEM = original equipment manufacturer;
PAYD = pay-as-you-drive;
PHYD = pay-how-you-drive;
SAE = Society of Automotive Engineers;
SD = standard deviation;
SLAM = simultaneous localization and mapping;
SH-NDS = Shanghai Naturalistic Driving Study;
SHRP2 = Second Strategic Highway Research Program;
SPMD = safety pilot model deployment;
SUV = sport utility vehicle;
SVRAI 1 = Saving Lives through Road Incident Analysis Feedback 1;
TB = terabytes;
TME = Toyota Motor Europe;
TRoM = Tsinghua road marking;
TTC = time to collision;
UAH = University of Alcalá;
UBI = usage-based insurance;
UDRIVE = European Naturalistic Driving and Riding for Infrastructure & Vehicle Safety and Environment;
UK = United Kingdom;
USA = United States of America;
UTBM = Université de Technologie de Belfort Montbéliard;
VTTI = Virginia Tech Transportation Institute;
V2I = vehicle-to-infrastructure;
V2V = vehicle-to-vehicle;
V2X = vehicle-to-everything.
Author Contributions
The authors confirm contribution to the paper as follows: study conception and design: L. Masello, B. Sheehan, G. Castignani, F. Murphy, K. McDonell, C. Ryan; data collection: L. Masello; analysis and interpretation of results: L. Masello, B. Sheehan, G. Castignani, F. Murphy, K. McDonell, C. Ryan; draft manuscript preparation: L. Masello, B. Sheehan, G. Castignani. All authors reviewed the results and approved the final version of the manuscript.
Declaration of Conflicting Interests
The author(s) declared no potential conflicts of interest with respect to the research, authorship, and/or publication of this article.
Funding
The author(s) disclosed receipt of the following financial support for the research, authorship, and/or publication of this article: This project was supported by the Fonds National de la Recherche, Luxembourg (Project Code: 14614423)