
Abstract
Background
The diagnosis of migraine currently relies on clinical criteria based on expert consensus. Despite advances in neuroimaging, a sensitive and reliable morphological biomarker for episodic migraine (EM) remains elusive. Fractal dimension (FD), a novel morphometric metric, offers promise for detecting minor cortical alterations and may offer more precise quantification of cerebral folding than conventional cortical thickness (CT) analysis.
Methods
This study compared 50 EM patients and 50 matched healthy controls (HC) using both FD and CT analyses of magnetic resonance imaging (MRI) across hemispheres, cerebral lobes and 68 cortical regions. After evaluating data normality, group differences were assessed using false discovery rate-corrected t-tests and validated through permutation testing. Unsupervised k-means clustering was applied to evaluate classification performance.
Results
FD showed lower variance and narrower data distribution, revealing more significant cortical alterations than CT, especially in the temporal lobe. Notably, FD uniquely identified structural changes in the insula, a region implicated in high-frequency migraine attacks, where CT showed no differences. The FD-based classifier achieved 81.62% accuracy in distinguishing EM from HC, significantly outperforming CT (54.03%).
Conclusions
FD-based analysis of structural MRI shows greater sensitivity than conventional method in detecting migraine-related cortical changes, effectively distinguishing EM from HC, even in low-frequency cases with minor alterations previously undetectable by MRI. This approach may hold promise for supporting clinical diagnosis and enabling future automated screening.
This is a visual representation of the abstract.
Introduction
Brain morphological changes associated with migraine may provide meaningful insights into its underlying pathophysiology, with potential to support diagnosis and guide treatment strategies (1). Previous studies have utilized magnetic resonance imaging (MRI) to investigate structural alterations in migraine, primarily through voxel-based morphometry to examine cortical grey matter volume (2). These investigations have revealed a spectrum of cortical grey matter alterations within the pain circuitry of individuals with migraine, spanning regions such as the somatosensory, motor, premotor, prefrontal, posterior parietal, orbitofrontal and cingulate cortices, alongside the insula and the caudate nucleus (3). Notably, chronic migraine (CM) patients exhibit focal grey matter reduction within various areas of the central pain network compared to episodic migraine (EM) patients (4). Morphological brain changes, specifically reductions in cortical thickness (CT), surface area and volume in pain-processing cortical regions, are increasingly studied as potential features for classifying migraine subtypes (5–8). Thus, these morphological brain changes hold promise as potential classifiers within the migraine spectrum.
Schwedt et al. (5) have proposed significant alterations in CT within regions such as the temporal pole, anterior cingulate cortex, superior temporal lobe, entorhinal cortex, medial orbital frontal gyrus and pars triangularis, suggesting their utility in distinguishing between CM, EM and HC. However, these regions exhibit lower sensitivity in discriminating EM from HC (5). Additionally, the findings regarding cortical changes in EM have been somewhat inconsistent, suggesting a need for further research. While some investigations report thicker cortices in individuals with migraine compared to controls, others observe thinner cortices or no cortical abnormalities in individuals with migraine at all (9–11). These disparities may arise from various factors, including diverse patient demographics and methodological variations. A recent study on a substantial EM cohort identified areas of thinned cortex in the bilateral central sulcus, left middle-frontal gyrus, left visual cortices and right occipitotemporal gyrus (12). In addition, disparities in cortical thickness within the parietal lobe may further differentiate between EM patients with and without aura.
Quantifying structural alterations in complex brain regions, such as cortical sulci and gyri, presents significant challenges. Traditional morphological metrics, including gray matter volume, CT and surface area, have been widely used in MRI-based studies to assess brain structural changes. However, these measures exhibit considerable variability and are strongly influenced by sex differences (13).
Fractal dimension (FD) (14) has emerged as a promising and increasing applied metric for quantifying brain morphological complexity (15,16). Unlike traditional measures, FD integrates multiple structural features such as shape complexity, CT, sulcal depth and folding area, while demonstrating lower variance and reduced sex effects (16). Compared with conventional volumetric methods, FD offers greater sensitivity and reliability in detecting both gray and white matter changes (16). Higher FD values indicate increased cortical complexity, whereas lower values suggest atrophy or degeneration (15,16). FD has been widely used in MRI studies to detect minor cortical alterations across various neurological and psychiatric disorders (16–18). Its high sensitivity and low variability support its potential as a reliable imaging biomarker for assessing brain structural integrity, particularly in neurodegenerative and psychiatric conditions (19).
To date, no sensitive or reliable morphological measure has been established for distinguishing EM from HC, and studies applying FD to assess cortical alterations in EM are lacking. To address this gap, we applied FD and CT to investigate morphological changes in EM. The resulting data was analyzed identically to create a baseline and evaluate the comparative discriminating power of the two metrics. Additionally, we utilized results from both FD and conventional CT measures to develop unsupervised classifiers for distinguishing EM, hypothesizing that FD may offer a more sensitive and accurate approach than CT.
Methods
Healthy control participants and patients with EM
Table 1 summarizes the demographic characteristics of the participants involved in the present study. We recruited 50 HC and 50 patients with EM from the Headache Clinic at Shin Kong Wu Ho-Su Memorial Hospital in Taiwan between 2018 and 2022. Inclusion criteria required patients to be aged 20–60 years old and diagnosed with EM according to the International Classification of Headache Disorders, 3rd edition (ICHD-3) (20), based on clinical assessment and confirmation with headache diary records. Patients were excluded if they had any concomitant physical, psychiatric or neurological conditions. In addition, we recruited HC without primary headaches, who met the same eligibility criteria as the patients. The cohorts were balanced for age (EM: 45.08 (SD 10.29) years; HC: 44.70 (SD 9.46 years); p = 0.86) and sex (EM: 27 female/23 male; HC: 25 female/25 male; p = 0.6592), ensuring comparability for subsequent analyses.
Demographic characteristics of study groups.

The Migraine Disability Assessment (MIDAS) total score was the sum of all five items used to represent the overall headache-related disability, following the standard scoring method recommended by the original MIDAS questionnaire, p-values = two-tailed t-tests, NA = not applicable.
All potential participants underwent clinical assessment by two migraine specialists to ensure eligibility. All participants with incidental or abnormal findings (e.g. significant white matter hyperintensities, structural lesions or other pathology not related to migraine) were excluded from the study to ensure that the reported structural differences were attributable only to the EM condition. This study was conducted in accordance with the guidelines of the Declaration of Helsinki and was approved by the Institutional Review Board of Shin Kong Wu Ho-Su Memorial Hospital (IRB No. 20191213). Written informed consent was obtained from all participants before their inclusion.
Image processing
Figure 1 illustrates the image acquisition, FD/CT measures and discriminating analysis procedures employed in this study. First, a 3-T Vision scanner (Philips Medical Systems, Eindhoven, The Netherlands) was used for all individuals to acquire axial brain MRI scans covering the entire cerebrum and cerebellum. T1-weighted images were obtained using a circularly polarized head coil, with the following parameters: repetition time, 8.875 ms; echo time, 4.079 ms; matrix size, 384 × 384; 0.9-mm sagittal slices; field of view, 256 × 256 mm; voxel size, 0.67 × 0.67 × 0.9 mm3. Second, the acquired structural T1-weighted (T1w) MRI datasets underwent a rigorous, multi-stage postprocessing pipeline. Initially, to account for inter-subject anatomical variability, each T1w volume was subjected to non-linear registration and normalization using the DiffeoMap software package (MRI Stuido, San Francisco, CA, USA), aligning it to a pre-segmented and validated volumetric template. Following normalization, the image volume was segmented into its three primary tissue classes: Grey matter (GM), white matter (WM) and cerebrospinal fluid (CSF). This segmentation was performed using the Statistical Parametric Mapping (SPM12) toolbox (Welcome Centre for Human Neuroimaging, UCL Queen Square Institute of Neurology, London, UK) and applied within the native space of each subject utilizing the previously determined transformation parameters. Finally, for subsequent morphometric analyses, the resulting GM tissue probability maps were used to generate binary masks, typically employing a threshold of ≥0.5 probability, thereby precisely isolating the cortical and subcortical GM.Third, the cortex of GM was parcellated into hemispheres, cerebral lobes and 68 distinct sub-regions (regions of interest (ROIs)) utilizing the Desikan-Killiany cortical atlas (DK atlas) (21) within the FreeSurfer toolbox implemented in MATLAB R2020a (MathWorks, Natick, MA, USA). The ROIs from the DK atlas were reorganized based on their respective lobes, resulting in the frontal lobe, limbic, temporal lobe, parietal lobe and occipital lobe. Table 2 summarizes the cortical parcellation sub-regions and their index numbers according to the DK atlas. Index numbers 1–34 correspond to the left hemisphere sub-regions and index numbers 35–68 correspond to the right hemisphere sub-regions.

Image processing, FD/CT measures, significant difference and discriminating analysis procedures in this study. EM = episodic migraine; HC = healthy control subjects; FD = fractal dimension measure; CT = cortical thickness; DK atlas = Desikan-Killiany cortical atlas.
FD(CT) value of DK atlas sub-regions between individuals with EM and HC.
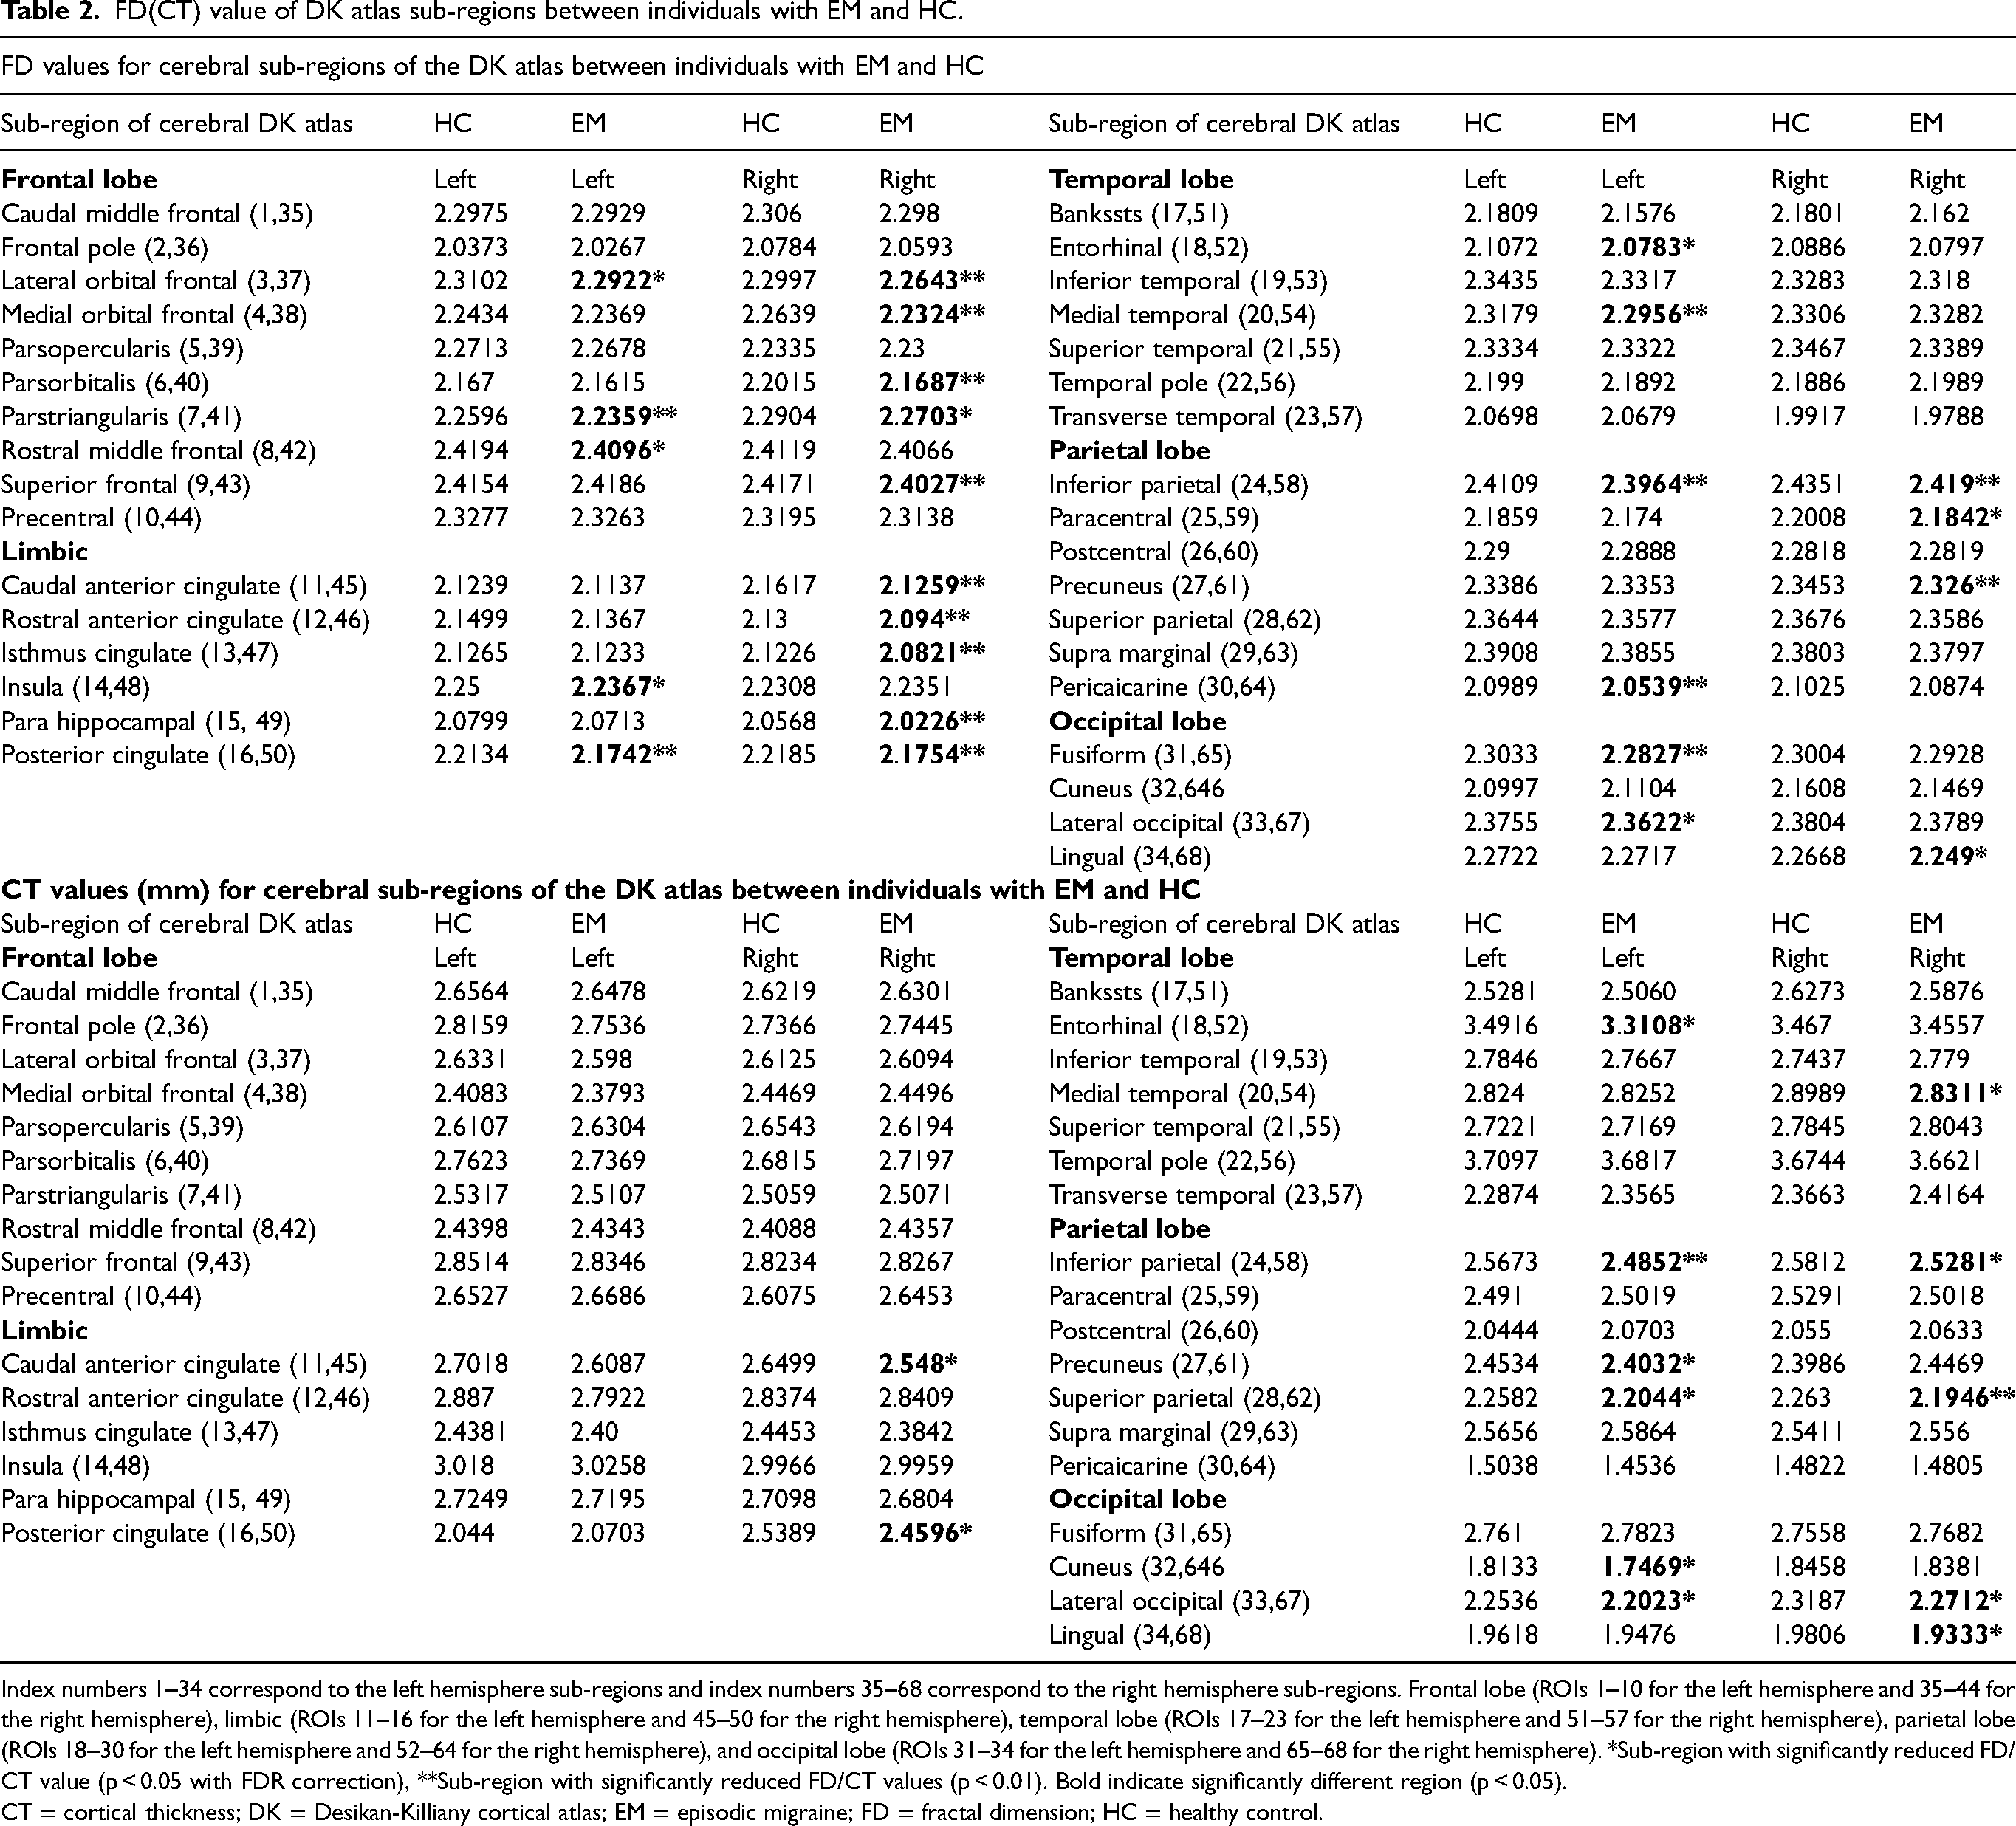
Index numbers 1–34 correspond to the left hemisphere sub-regions and index numbers 35–68 correspond to the right hemisphere sub-regions. Frontal lobe (ROIs 1–10 for the left hemisphere and 35–44 for the right hemisphere), limbic (ROIs 11–16 for the left hemisphere and 45–50 for the right hemisphere), temporal lobe (ROIs 17–23 for the left hemisphere and 51–57 for the right hemisphere), parietal lobe (ROIs 18–30 for the left hemisphere and 52–64 for the right hemisphere), and occipital lobe (ROIs 31–34 for the left hemisphere and 65–68 for the right hemisphere). *Sub-region with significantly reduced FD/CT value (p < 0.05 with FDR correction), **Sub-region with significantly reduced FD/CT values (p < 0.01). Bold indicate significantly different region (p < 0.05).
CT = cortical thickness; DK = Desikan-Killiany cortical atlas; EM = episodic migraine; FD = fractal dimension; HC = healthy control.
Fourth, we applied 3D-FD and CT measurements to evaluate the morphological complexity of each ROI, cerebral lobes, and hemispheres in each participant. As illustrated in Figure 1, the CT measurement involved calculating the distance between the grey–white matter boundary and the corresponding pial surface for each ROI, ollowed by determining the mean thickness for each ROI. Subsequently, the normality of the dataset for each group specifically, the average FD and CT values for the left and right hemispheres, cerebral lobes and 68 sub-regions using the Jarque–Bera test (22). We first compared the hemispheres, lobes and 68 sub-regional features (CT and FD) between study groups using independent samples t-tests. The resulting p-values were treated as a multiple comparison family, which was corrected using the false discovery rate (FDR) procedure (23). A corrected FDR p-value of 0.05 was the threshold for significant difference, allowing us to identify regions with significant alterations between individuals with EM and HC. Finally, we employed an unsupervised discrimination method known as k-means clustering, using FD and CT of left and right hemispheres as clustering features, to assess and compare the discriminating accuracy of these measures. Furthermore, all analyses were conducted across 100 to 1000 permutations to evaluate the statistical robustness and discriminatory power of FD and CT measures in differentiating EM patients from healthy controls.
FD measure procedure
FD was precisely calculated using the 3D Box-Counting Method, a validated and widely accepted algorithm for quantifying the complexity of structures (24–26). This method is based on the power law relationship that defines the FD (D) of a fractal object:
To derive the FD (D), we take the logarithmic operation (to the base 2) on both sides of Equation (1). This transforms the power law relationship into the equation of a straight line:
In this form, the FD (D) is directly given by the slope of the linear regression line when
The FD calculation followed these precise steps:
Initial setup: as illustrated in FD measure of Figure 1, we selected cubic boxes with an initial side length r as the box size (set box size=10 pixels for the first iteration). These boxes were stacked to completely cover the whole 3D fractal object. Counting: a count was registered as ‘1’ if the box contained any pixels belonging to the fractal object and ‘0’ otherwise. The total number of non-empty boxes was calculated and recorded as N(r). Iteration: the counting process was repeated by gradually decreasing the size r of the boxes, generating a series of N(r) values. We obtained N(r) for box sizes ranging from r = 10 pixels down to r = 2 pixels. Log-log plot: The resulting series of N(r) and (1/r) values were logarithmically transformed (base 2). A scatter plot of Slope determination: we determined the range of box sizes that corresponds to the linear portion of the regression line (as illustrated by the red and blue lines in Figure 1). The goal was to identify the fit that achieved the highest slope correlation coefficient (6vi Final FD value: finally, the FD was derived from the slope of the regression line corresponding to the highest correlation coefficient value (R2 of the red line in Figure 1). Selecting the correct box size range is critical, as the cerebral cortex only exhibits self-similarity within a specific scale, unlike a perfect fractal. The data in FD measure of Figure 1 demonstrates that the optimal box size range was 2–8 pixels, yielding the highest R2 of 0.9998. This highly linear region's slope provided the definitive FD value of 2.2886, ensuring a precise and reliable measure of cortical complexity.
To evaluate cortical complexity, we applied FD and CT analysis to each ROI and cortical lobe for all participants. CT was measured by calculating the distance between the inner and outer cortical surfaces at each point (illustrated by cyan dots in Figure 1), with the mean thickness computed for each ROI. FD and CT values were compared between the EM and HC groups to identify significant structural differences. Additionally, FD and CT values from the left and right hemispheres were used as paired features in k-means (27) clustering to assess the discriminative accuracy in distinguishing individuals with EM from HC.
Statistical analysis
First, the normality of the data for each group was assessed using the Jarque–Bera test (22). This evaluation was conducted separately for the average FD and CT values across the left and right hemispheres, lobes and cortex sub-regions. We used a two-tailed t-test to compare the left and right hemispheres, lobes and focal regions between EM and HC groups regarding the 3D-FD values and CT of each cortical region. The significance of the results was determined based on a false discovery rate-corrected (p = 0.05) (28).
In addition, the study aimed to assess the discriminative potential of FD and CT measures for differentiating EM patients from HC, as well as to compare the performance of these two metrics. To this end, scatter plots were generated for each participant to visualize the distribution and separability of FD and CT features. The averaged FD values (and CT values) across all subregions in the left and right hemispheres of each subject were used as paired parameters for the scatterplot's x- and y-axis data. An unsupervised clustering method (k-means clustering, with K = 2) was then applied to automatically classify all participants into two groups. Each participant was assigned to the cluster whose centroid was closest to their data point, serving as the prototype for clustering. The clustering performance was evaluated using three metrics: accuracy, sensitivity, and specificity. These metrics were calculated as follows: accuracy = (true positives + true negatives) / (true positives + true negatives + false positives + false negatives); sensitivity = true positives / (true positives + false negatives); and specificity = true negatives / (true negatives + false positives). These metrics offered a comprehensive evaluation of the clustering algorithm's performance in accurately identifying EM cases and excluding controls, highlighting the comparative value of FD and CT as discriminative tools for EM classification.
To assess the statistical and discriminatory power of FD and CT measures for differentiating individuals with EM from HC, we conducted a permutation test (29). This procedure involved randomly selecting 40 subjects from both the EM and HC groups to create new test subsets. Statistical and discriminatory analyses were then performed across 100 to 1000 permutations. This number of permutations was selected after a stability analysis, which demonstrated that key performance metrics (accuracy, sensitivity and specificity) remained highly stable when increasing the permutation count from 100 to 1000. Key metrics, including p-values and discriminatory accuracy, were computed for each permutation and subsequently averaged. This approach provided a robust comparison of the performance of FD and CT measures in detecting EM-related cortical differences and their potential as diagnostic tools.
Results
FD's superiority over CT in assessing EM cerebral alterations
First, the FD and CT datasets for both groups, including hemispheres, cerebral lobes, and cortical sub-regions, passed the normality test (Jarque–Bera, p > 0.05). Figure 2 illustrates the averaged FD values for the left and right hemispheres in EM and HC groups (Figure 2A), along with corresponding CT comparisons (Figure 2B). Individuals with EM showed significantly reduced FD values in both hemispheres compared to HC (p < 0.01). CT analysis also revealed a significant reduction in the left hemisphere (p = 0.0123); however, the right hemisphere exhibited a less pronounced decrease (p = 0.0216), indicating lower sensitivity than FD. These findings were further supported by a 1000-iteration permutation test, which confirmed significantly lower FD values in both hemispheres (p < 0.01). In contrast, CT showed a significant reduction only in the left hemisphere (p = 0.037), with no significant change in the right hemisphere (p = 0.0572). These results highlight the superior sensitivity of FD in detecting bilateral cortical alterations in EM. The significantly lower coefficient of variation (CV, SD/mean) observed for the FD measure suggests it is a more stable and less variable metric compared to CT when quantifying minor changes in cortical morphology.

(A) Averaged FD values for the left and right hemispheres in EM and HC groups. (B) Averaged CT values for the left and right hemispheres in EM and HC groups. HC_LH = healthy control left hemisphere; EM_LH = episodic migraine left hemisphere; HC_RH = healthy control right hemisphere; EM_RH = episodic migraine right hemisphere; p-value = two-tailed t-test with FDR correction. In (A), the FD value (mean + SD, STD) is 2.2443 + 0.0115 for HC_LH, 2.2467 + 0.0121 for HC_RH, 2.2252 + 0.0144 for EM_LH and 2.222 + 0.0138 for EM_RH. In (B), the CT value is 2.5734 + 0.0795 for HC_LH, 2.2467 + 0.0121 for HC_RH, 2.2252 + 0.0144 for EM_LH and 2.222 + 0.0138 for EM_RH. The FD measure exhibited a significantly lower coefficient of variation (CV, STD/mean), consistently below 1% (0.51% (LH) and 0.54% (RH) for HCs; 0.65% (LH) and 0.62%(RH) for EM), while the CTs measure revealed a substantially higher variance ratio exceeding 3% (3.09% (LH) and 3.25% (RH) for HCs; 3.5% (LH) and 3.32% (RH) for EM. CT = cortical thickness; EM = episodic migraine; FD = fractal dimension; FDR = false discovery rate; HC = healthy control.
Figure 3(A) and (B) illustrate the FD values of cerebral lobes in both hemispheres of the HC and EM groups. The EM group exhibited significantly lower FD values in the left hemisphere's frontal (p < 0.001) and temporal lobes (p < 0.001). In the right hemisphere, significant reductions were observed in the frontal (p < 0.001), limbic (p < 0.001), parietal (p < 0.001) and occipital lobes (p = 0.02), with a trend toward significance in the temporal lobe (p = 0.088).

FD values of cerebral lobes of EM and HC groups. (A) FD values of cerebral lobes of EM and HC groups. (B) CT values of cerebral lobes of EM and HC groups. HCF = healthy control frontal lobe; EMF = episodic migraine frontal lobe; HCL = healthy control limbic; EML = episodic migraine limbic; HCT = healthy control temporal lobe; EMT = episodic migraine temporal lobe; HCP = healthy control parietal lobe; EMP = episodic migraine parietal lobe; HCO = healthy control occipital lobe; EMO = episodic migraine occipital lobe; p-value = two-tailed t-test. CT = cortical thickness; EM = episodic migraine; FD = fractal dimension; HC = healthy control.
Figure 4(A) and (B) illustrate the CT values of cerebral lobes in both hemispheres of the HC and EM groups. In the left hemisphere, the EM group exhibited significantly reduced CT values in the temporal (p = 0.0012) and parietal (p = 0.02) lobes. In the right hemisphere, significant reductions were observed in the temporal (p = 0.032) and parietal (p = 0.042) lobes.

CT values of cerebral lobes of bilateral hemispheres in EM and HC groups. (A) CT values of cerebral lobes of left hemispheres in EM and HC groups. (B) CT values of cerebral lobes of right hemispheres in EM and HC groups. HCF = healthy control frontal lobe; EMF = episodic migraine frontal lobe; HCL = healthy control limbic; EML = episodic migraine limbic; HCT = healthy control temporal lobe; EMT = episodic migraine temporal lobe; HCP = healthy control parietal lobe; EMP = episodic migraine parietal lobe; HCO = healthy control occipital lobe; EMO = episodic migraine occipital lobe; p-value: two-tailed t-test. CT = cortical thickness; EM = episodic migraine; HC = healthy control.
FD reveals cortical sub-regional reductions missed by CT
Table 2 summarizes the mean values of FD and CT for the 68 sub-regions, along with comparison results between the HC and EM groups. Figure 5 illustrates cortical sub-regions with significantly reduced FD (A) and CT values (B) in the EM group compared to HC. Patients with EM exhibited significantly decreased FD values in 11 sub-regions of the left hemisphere and 14 sub-regions of the right hemisphere. In the left hemisphere, sub-regions with reduced FD values included the posterior cingulate, pericalcarine, fusiform, entorhinal, insula, rostral middle frontal, pars triangularis, lateral orbitofrontal, middle temporal, inferior parietal and lateral occipital regions. Similarly, in the right hemisphere, the affected regions included the frontal (medial orbitofrontal, lateral orbitofrontal and superior), cingulate (rostral anterior, caudal anterior, posterior and isthmus), paracentral, para-hippocampal, lingual, inferior parietal, pars orbitalis and pars triangularis regions.

Cortical sub-regions with significantly reduced FD and CT in the EM group. (A) Locations of cortical sub-regions with significantly decreased FD values in the EM group. (B) Locations of cortical sub-regions with significantly decreased CT values in the EM group. HC = healthy control (N = 50); EM = episodic migraine (N = 50), p-value = two tailed t-test with false discovery rate (FDR) correction. Regions marked in blue indicate moderate significance (p < 0.05), blue–purple represents greater significance (0.01 < p < 0.05), and purple highlights the most significant alterations (p < 0.01). CT = cortical thickness; FD = fractal dimension.
Compared to FD measurements, EM patients showed fewer sub-regions with significantly decreased CT values, with six affected sub-regions in the left hemisphere and eight in the right hemisphere. In the left hemisphere, the six affected sub-regions included the cuneus, precuneus, entorhinal, superior parietal, inferior parietal and lateral occipital. In the right hemisphere, the eight affected sub-regions comprised the posterior cingulate, caudal anterior cingulate, para hippocampal, lingual, superior parietal, inferior parietal, middle temporal and lateral occipital regions.
EM patients exhibited significantly decreased FD and CT values in many overlapping sub-regions. In the left hemisphere, these included the entorhinal, inferior parietal, and lateral occipital regions. In the right hemisphere, reductions were observed in the posterior cingulate, caudal anterior cingulate, para hippocampal, lingual and inferior parietal regions. Notably, the overlapping regions in the FD measure exhibited a more intense purple coloration compared to those in the CT measure. This phenomenon suggests that FD analysis may offer greater sensitivity in detecting migraine-related cortical changes, as evidenced by smaller p-values and more pronounced alterations in these key regions.
FD-based discriminator outperforms CT in identifying EM
The discriminative results in Figure 6(A) and (B) illustrate the effectiveness of cortical FD and CT, respectively, in differentiating EM patients from HC.

The discriminating results of cortical FD-based and CT-based discriminators. (A) The discriminating results of the cortical FD-based discriminator. (B) The discriminating results of the CT-based discriminator. HC (N = 50) are represented by blue stars and EM (N = 50) are represented by red stars. Cluster 1 is indicated by black squares in the cyan region and cluster 2 is indicated by black circles in the yellow region. Discriminating was performed using the k-means clustering method. In (A), the x- and y-coordinates correspond to feature 1 (mean cortical FD of all sub-regions in the left hemisphere) and feature 2 (mean cortical FD of all sub-regions in the right hemisphere). In (B) the same discriminative analysis is presented using the mean CT of all sub-regions in both hemispheres. CT = cortical thickness; EM = episodic migraine; FD = fractal dimension; HC = healthy control.
In Figure 6(A), the FD-based discriminator reveals distinct clustering patterns, with most HC (blue stars) positioned in the upper right quadrant and EM subjects (red stars) clustered in the lower left quadrant. Cluster 2, marked by black circles in the yellow region, predominantly consists of EM patients (HC/EM = 13/44), whereas cluster 1, represented by black squares in the cyan region, comprises mainly HC (HC/EM = 37/6). A discernible boundary (black line) separates clusters 1 and 2, demonstrating the robust discriminatory capability of the FD-based classifier. It achieved a discriminating accuracy of 81.62%, with sensitivity of 84.69% and specificity of 79.05, respectively.
In contrast, Figure 6(B) illustrates the results of the CT-based classifier, where the distribution ranges of HC (blue stars) and EM (red stars) are intermixed and overlap. Cluster 2, denoted by black circles in the yellow region, includes 25 EM patients and 21 HC (EM/HC = 25/21), while cluster 1, depicted by black squares in the cyan region, comprises 25 EM patients and 29 HC (EM/HC = 25/29). Unlike the FD-based classifier, the boundary between clusters 1 and 2 in the CT-based discriminator is less distinct, leading to inferior discriminating performance. The CT-based discriminator achieves an accuracy, sensitivity and specificity of 54.03%, 54% and 54.05%, respectively, underscoring the superior discriminative power of FD over CT in identifying EM patients. The permutation test for the FD-based discriminator achieved a highly promising average accuracy of 82.24%, with a sensitivity of 84.59% and a specificity of 80.44%. In contrast, the CT-based cluster yielded a much lower performance, with an average accuracy of 55.03%, a sensitivity of 55.06% and a specificity of 55.02%.
Discussion
The present study introduces the innovative use of FD analysis to detect cortical structural complexity changes in EM. Our key finding is that structural MRI, when utilizing FD analysis, outperforms conventional CT assessments in distinguishing EM from HC. FD values were significantly reduced across hemispheres, lobes and cortical subregions, identifying more affected areas with stronger statistical significance (lower p-values). Moreover, FD measurements showed narrower distributions and lower standard deviations than CT, indicating greater sensitivity and consistency. The denser and more stable FD data exhibited improved diagnostic precision for detecting brain morphological changes within this cohort, suggesting its potential to be a more sensitive and stable measure than standard methods. Future studies employing larger and independent validation cohorts will be essential to confirm the generalizability of these promising results and establish its broader utility as a sensitive diagnostic tool.
A key finding in our statistical analysis is the marked difference in inherent variability between the two structural measures. The FD measure exhibits a significantly lower CV, approximately one-third that of CTs which indicates its superior stability and precision and a fundamentally narrower data distribution. This reduced variability is highly advantageous for successful clinical translation, potentially enhancing both statistical power and diagnostic reliability. Computationally, this lower variance may contribute to increased statistical power, thereby aiding the detection of true biological effects and promoting higher reproducibility across independent cohorts. For machine learning applications, data with less intrinsic variability tend to facilitate models in capturing the core biological signal over noise, which is valuable for achieving robust generalization to new populations and helping to mitigate overfitting. Biologically, the enhanced precision of the FD measure suggests the potential for isolating a more homogeneous anatomical signature within a disorder, which may maximize the signal-to-noise ratio by minimizing the influence of non-biological artifacts. Clinically, this improved consistency underpins the suitability of FD for individual clustering and pattern recognition, offering a more stable foundation for normative modeling and reliable patient classification than more variable metrics.
The temporal lobe plays a key role in migraine pathophysiology, serving as a crucial component of the pain matrix and salience network involved in the emotional and cognitive aspects of headache (30). Consequently, its structural characteristics may be a useful classifier for EM (31). In the left hemisphere, both FD and CT detected temporal lobe changes, but FD showed a more significant reduction (p < 0.001). Notably, only FD identified a significant decrease in the left middle temporal region, but not by CT. Conventional CT often overlook minor structural alterations, whereas FD analysis captures fine-grained cortical folding changes (32), offering greater sensitivity and diagnostic value in EM.
EM patients exhibited significant reductions in FD within the bilateral cingulate cortex, whereas CT showed more limited changes, primarily confined to the left hemisphere. The affected regions included the caudal and rostral anterior cingulate cortex and the posterior cingulate cortex that are key nodes in migraine pathophysiology (33). The anterior cingulate cortex, involved in emotional and cognitive pain processing, has been linked to gray matter loss and abnormal activation in migraine (34). Posterior cingulate cortex alterations, associated with pain memory and self-referential processing, may contribute to chronification (35). Our finding of altered cingulate structure in individuals with EM, particularly those with higher attack frequency, is conceptually supported by prior work (36), which has demonstrated structural changes such as reduced cingulate volume associated with similar patient sub-groups. Our FD results show a significantly decrease in the cingulate cortex, supporting its critical role in the complex network of migraine pathophysiology, particularly in the modulation of pain and symptom persistence.
Notably, only FD analysis detected significant structural differences in the insula between EM patients and HC, while CT failed to reveal such alterations. The insula is a key cortical hub in migraine, integrating pain processing, interoception, autonomic control and sensory modulation (37,38). Insular abnormalities have been widely linked to migraine-related symptoms, particularly in chronic and high-frequency EM cases (36,38–40). Supporting this connection between structure and clinical manifestation, a recent study in chronic migraine patients further observed a correlation between the cortical thickness of the right insula and clinical severity (8). The lack of significant CT findings in our study may be attributed to the low attack frequency (average six days/month) in our EM cohort. In contrast, FD analysis captured alterations in cortical complexity, demonstrating greater sensitivity to minor morphological changes. These results suggest that FD may be more effective than CT in identifying cortical abnormalities in low-frequency EM, a sub-group often indistinguishable from healthy individuals using traditional metrics. Furthermore, identifying specific regions such as the insula enhances the potential for targeted therapies and neuromodulation (41). In this study, we systematically quantified FD and CT across hemispheres, lobes and cortical sub-regions. Our results demonstrate that FD is more sensitive and robust than CT in detecting migraine-related cortical alterations, particularly in capturing localized structural changes in EM. These results highlight the potential of FD as a supportive tool for aiding the diagnosis of EM in future clinical settings.
Morphological brain changes have shown potential in classifying migraine subtypes (5–7). Schwedt et al. (5) were among the first to utilize support vector machines with structural features (cortical surface area, thickness and volume) to achieve high accuracy in distinguishing CM from EM (84.2%) and CM from HC (86.3%), but substantially lower for differentiating EM from HC (67.2%). Mitrović et al. (6), employing cortical thickness, reported exceptionally high accuracies (up to 98%) when distinguishing between simple and complex migraine with aura subtypes, highlighting the prognostic value of specific cortical regions like the temporal pole and lingual gyrus. Siddiquee et al. utilized deep learning (3D ResNet-18; pytorch.org/hub/pytorch_vision_resnet/) on structural MRIs for classification, achieving 75% accuracy for migraine vs. healthy controls, demonstrating the utility of end-to-end deep learning (7). The classification accuracy of these conventional models for distinguishing EM from HC remains a significant challenge, with reported accuracy still at a low level (e.g. 67.2% in) (5) requiring substantial improvement. To this end, our FD-based classifier achieved an accuracy of 81.62%, significantly outperforming the CT-based classifier (54.03%). FD demonstrated better sensitivity and reliability in this study, suggesting its potential as an imaging biomarker for EM diagnosis. Future studies with larger, diverse patient cohorts are necessary to confirm these findings and establish its true diagnostic utility and reliability.
This study has several limitations. The relatively small sample size and recruitment from a tertiary hospital may limit generalizability. Future research should involve larger, multi-center cohorts with diverse populations and external validation of FD as an imaging biomarker. Comparative studies with established imaging markers and longitudinal designs are needed to assess FD's diagnostic value and its potential for tracking disease progression or treatment response. Further investigation into FD's clinical utility in early diagnosis and treatment monitoring is also warranted. Although the cluster analysis (e.g. k-means) demonstrated good discriminative performance within the current sample, the lack of an independent, held-out testing set suggests the identified clusters may be overfit to the sample's specific noise. Therefore, external validation in an entirely new and independent cohort is essential to confirm the robustness and clinical applicability of these findings and establish their generalizability.
Conclusions
In conclusion, FD analysis outperforms CT by offering lower variance, greater statistical sensitivity and finer morphological detection. FD detected more cortical alterations in EM, including insular changes associated with high-frequency attacks, which were not identified by CT. The FD-based classifier achieved 81.62% accuracy, significantly exceeding the 54.03% accuracy from a CT-based approach. These findings position FD as a more sensitive and precise method for detecting migraine-related cortical changes that even in low-frequency EM cases and may serve as a useful tool to support clinical diagnosis.
Clinical implications
Quantitative, image-based diagnostic tools are urgently needed for episodic migraine. Fractal dimension-based structural MRI analysis is more sensitive to cortical changes than cortical thickness, even in low-frequency migraine. Achieves higher accuracy than cortical thickness (81.62% vs. 54.03%) in distinguishing episodic migraine from healthy individuals. This analytical approach is well-suited to aid precise clinical diagnosis and may support automated screening.
Footnotes
Author contributions
The authors confirm contribution to the paper as follows: Conceptualization: Chi-Wen Jao, Chi Ieong Lau, Yu-Te Wu and Vincent Walsh; Data curation: Wei-Hung Chen, Jiann-Horng Yeh and Chi Ieong Lau; Formal analysis: Chi-Wen Jao and Chi Ieong Lau; Methodology: Chi-Wen Jao, Yu-Te Wu and Chi Ieong Lau; Resources: Yu-Te Wu and Jiann-Horng Yeh; Software: Chi-Wen Jao and Chi Ieong Lau; Visualization: Chi-Wen Jao and Chi Ieong Lau; Writing – original draft: Chi-Wen Jao; Writing – review & editing: Chi-Wen Jao and Chi Ieong Lau.
Consent to participate
Written informed consent was obtained from all participants before their inclusion.
Data availability
The data are not publicly available due to privacy concerns raised by our IRB. All experimental codes used in the study are available from the corresponding author upon reasonable request.
Declaration of conflicting interests
The authors declared no potential conflicts of interest with respect to the research, authorship and/or publication of this article.
Ethical considerations
This study was conducted in accordance with the guidelines of the Declaration of Helsinki and was approved by the Institutional Review Board of Shin Kong Wu Ho-Su Memorial Hospital (IRB No. 20191213).
Funding
This work was supported by grants from Shin Kong Wu Ho-Su Memorial Hospital and National Yang Ming Chiao Tung University to Chi Ieong Lau (2021SKHADR016; 111-SKH-NYCU-01; 111GB006-0; 107GB006) and Chi-Wen Jao (111GB006-0, 111-SKH-NYCU-01, 113A140059, 114A140025 and NSTC 114-2221-E-A49-159).