
Abstract
Introduction
Retinal vessel dynamics analysis has proven to be a viable, non-invasive surrogate marker for increased intracranial pressure. We aimed to test this method in patients with suspected idiopathic intracranial hypertension.
Methods
Patients with suspected idiopathic intracranial hypertension were prospectively enrolled for hand-held fundus-videography during diagnostic lumbar puncture. After extracting optic disc images, peripapillary arteriole-to-venule-ratios were measured using machine-learning algorithms with manual identification control. A general linear model was applied to arteriole-to-venule-ratios and corresponding lumbar opening pressures to estimate cerebrospinal fluid pressure.
Results
Twenty-five patients were included with a significant difference in arteriole-to-venule-ratio between patients with (n = 17) and without (n = 8) idiopathic intracranial hypertension (0.78 ± 0.10 vs 0.90 ± 0.08, p = 0.006). Arteriole-to-venule-ratio correlated inversely with lumbar opening pressure (slope regression estimate −0.0043 (95% CI −0.0073 to −0.0023), p = 0.002) and the association was stronger when lumbar opening pressure exceeded 15 mm Hg (20 cm H2O) (slope regression estimate −0.0080 (95% CI −0.0123 to −0.0039), p < 0.001). Estimated cerebrospinal fluid pressure predicted increased lumbar opening pressure >20 mm Hg (27 cm H2O) with 78% sensitivity and 92% specificity (AUC 0.81, p = 0.02). A stand-alone arteriole-to-venule-ratio measurement predicting lumbar opening pressure >20 mm Hg (27 cm H2O) was inferior with a 48% sensitivity and 92% specificity (AUC 0.73, p = 0.002).
Conclusion
Retinal vessel dynamics analysis with the described model for estimating cerebrospinal fluid pressure is a promising non-invasive method with a high sensitivity and specificity for detecting elevated intracranial pressure at follow-up assessments of patients with confirmed idiopathic intracranial hypertension if initial lumbar opening pressure and arteriole-to-venule-ratio data are available.
Keywords
Introduction
Idiopathic intracranial hypertension (IIH) is a severe condition of increased intracranial pressure (ICP) without known cause but with the signs and symptoms of a brain tumor. High ICP can cause permanent damage to the axons of the optic nerve, and thereby visual loss. The disease often results in chronic headache, cognitive impairment and low quality of life (1–4). The criteria for definite IIH include lumbar opening pressure (LOP) ≥25 cm cerebrospinal fluid (CSF) equivalent to 18.4 mm Hg (5). Thus, a lumbar puncture (LP) is necessary for diagnosis. Reference values for LOP are 7.2 to 16.8 mm Hg (9.8 to 22.8 cm H2O) in the lateral recumbent position and are influenced by body position (6,7). Gold standard for measuring ICP is by a probe in the intraventricular compartment but LOP is a well correlating surrogate marker for ICP with less risk of bleeding and neuro-infection (8–11). For all invasive procedures, however, specialized personnel and facilities are required, and patients often experience discomfort. Therefore, monitoring of patients with IIH is primarily based on visual acuity and fields, optic disc appearance, and patient reported symptoms. These are all unspecific parameters of ICP status. Visual field deficits are a delayed response to increased ICP as they are a result of axonal damage and swelling of the optic nerve head – it takes time for the pressure to induce damage; conversely, both axonal damage and swelling may persist for weeks after ICP has been normalized. Therefore, a reliable non-invasive and real-time approach for measuring ICP before damage occurs is needed. Increased ICP affects intracranial venous hemodynamics and subsequently the vessels of the eyes (12,13). Ceased pulsation in the retinal veins, venous distension, and torsion along with retinal bleedings are all clinically relevant findings that indicate high ICP (14,15). The largest study of retinal vein diameter in IIH was performed in the IIH treatment trial, where at baseline retinal arteriole-to-venule diameter ratio (AVR) was inversely associated with measures of papilledema on fundus photography (16). The association suggests a relationship between prolonged increased ICP and AVR (17).
Previously, a proof-of-concept study was published using non-invasive fundus videography to assess ICP based on retinal AVRs and retinal vessel dynamics analysis (RVDA) in patients undergoing conventional intraparenchymal ICP-monitoring. The study showed a correlation between pathological ICP and AVRs in healthy eyes (18). The purpose of the present study was to investigate the use of RVDA in an acute clinical setting on patients with suspected IIH. We hypothesized that RVDA could be used as a surrogate marker for raised ICP in patients with IIH.
Materials and methods
Study population and ethics
Consecutive patients aged 18 to 65 years with clinically suspected new onset IIH were prospectively enrolled from May 2020 to September 2021 at two Danish, regional, tertiary hospitals with specialized IIH function: Rigshospitalet (RH) and Odense University Hospital (OUH). Inclusion criteria were all of the following: suspicion of papilledema, symptoms of raised ICP (visual disturbances, aggravating headache, nausea and vomiting etc.) and normal head CT including venography. Exclusion criteria were severe ophthalmological disorders hindering clear visualization of the retina and optic disc (e.g., vitreous hemorrhage, cataract, and corneal dystrophy). Included patients underwent hand-held fundus videography during diagnostic LP including LOP measurement. All new onset patients also had an ophthalmological examination (visual acuity, color vision, visual fields, fundoscopy, optical coherence tomography [OCT], intraocular pressure [IOP]), blood pressure and a neurological examination performed before LP. Magnetic resonance imaging (MRI) of the orbits and brain were performed within 48 hours to exclude secondary causes to papilledema and intracranial hypertension. In all cases LOP was visually assessed by JJK for the RH cohort and MSA, MJN and ABN for the OUH cohort using a single-use spinal manometer. Prior to data analysis, the patients with confirmed IIH according to the revised Friedman criteria (5) were allocated to the IIH group, and the remaining patients, not fulfilling the criteria for IIH, were allocated to the non-IIH group for comparison. Demographic data included: age, sex, and past medical history collected bedside or from the patients’ medical records (Sundhedsplatformen, Epic Systems Corporation, USA and COSMIC, Cambio Healthcare Systems, Sweden). Study size (ngroup = 16) was based on a power analysis (alpha = 0.05, power =0.80) with a mean AVR set to 0.75 for increased ICP (>20 mm Hg [27.2 cm H2O]) and 0.9 for normal ICP (<15 mm Hg [20.4 cm H2O]). The study was approved by Committee on Health Research Ethics, Capital and Southern Region of Denmark (H-19029542, S-20170038,) and The Danish Data Protection Agency (18/16,859) and conducted according to the tenets of the declaration of Helsinki. Patients provided written informed consent prior to participating. Data reporting adhered to the tenets of the STROBE statement (19).
Experimental setup
LOP was measured with simultaneous fundus video recording in three situations, all in left lateral recumbent position in a relaxed patient. An observation period (at least two minutes) was allowed before each measurement to increase accuracy: S1. neck, back and legs in flexed position (fetal position). S2. neck, back and legs in extended, relaxed position (this measurement was used for diagnostic purposes according to the consensus guidelines [20]). S3. after CSF drainage with neck, back and legs in extended, relaxed position.
Situations are illustrated in Figure 1. Fundus videos were captured with the EpiCam M (Epipole Ltd., Rosyth, UK), a handheld retinal fundus camera with a monochromatic image sensor and manual adjustable focus (±15 diopters). Fundus videos were recorded in EpiCam Viewer software v2.1.1 (Epipole Ltd., Rosyth, UK) and saved in .avi-file format. Fundus videos were obtained bilaterally or in the right eye only for easy access in the left lateral recumbent position. Patients enrolled at RH served as the experimental group with bilateral fundus videos in all three situations. In addition, optic nerve sheath diameter (ONSD) was measured using transorbital sonography (TOS) before and after CSF drainage, as previously described (21). Papilledema grade was measured from the fundus photos in the IIH-group using Frisén grading (22). Optic disc elevation (ODE) was measured in the thickness map function using spectral-domain optical coherence tomography (OCT, Heidelberg Spectralis, Heidelberg Engineering GmbH). OCT segmentation was assessed and manually adjusted if needed. Patients enrolled at OUH served as a clinical validation group with unilateral fundus video in the clinically relevant S2 and S3. Pupil dilation is generally not necessary for the fundus video recordings with the EpiCam M when the light in the room is dimmed, yet the majority of pupils (pupil dilated n = 19, non-dilated n = 6) were dilated prior to the fundus examination, optic disc imaging and before OCT examination and fundus video recording.

Situations of lumbar opening pressure (LOP) measurement and fundus video. S1: LOP measurement and fundus video with body in a curled position with flexed neck, back and legs allowing for a temporary increase in LOP. S2: The clinically accepted body position for LOP measurement with body relaxed in the left lateral recumbent position with extended neck and legs. S3: Same as S2, but after withdrawal of cerebrospinal fluid.
Fundus video analysis and vessel diameter assessment
Fundus videos were processed and analyzed as previously described (18). In brief, the fundus videos were exported, blinded, and anonymously imported into the image processing software for image sequencing (StatuManu ICP ApS, Glostrup, Denmark). Fundus images with a visible optic disc were then extracted using a deep learning algorithm (“Is fundus”, StatuManu ICP ApS, Glostrup, Denmark) (Figure 2a). The diameter of the peripapillary arterioles and the paired venules one optic disc diameter from the rim of the optic disc were semi-automatically segmented using an image software program (HALCON, MVTec, Munich, Germany) and a deep learning algorithm (Microsoft Cognitive Toolkit, Microsoft Research, Washington, USA) (Figure 2b and c). The arteriole and venule segmentations were assessed and corrected if necessary, by a technician at StatuManu ICP ApS, Glostrup, Denmark, blinded for the aim of study, the subject ID as well as LOP and situation of the video recording.

Retinal vessel dynamics analysis using machine learning algorithms. (a) The reference image with the highest quality score extracted from the fundus video. Remaining images were rotated according to the reference image to improve subsequent vessel recognition. (b) Arteriole and venule pairs were manually selected (blue lines) for the reference image and the vessel diameters (white markings) were automatically measured using image analysis software with a gaussian function for edge detection approximately two optic disc radii from the center of the optic nerve head and (c) A deep learning algorithm was applied to automate the selection of the correct arteriole and venule pairs on remaining images for measuring vessel diameters.
AVRs were calculated from the paired arteriole-venule diameters for both superior and inferior vessel branches. Every fundus video led to a set with a variable count of AVRs depending on video image quality and anatomical conditions of the peripapillary vessels. The median AVR from each superior vessel set was used for further statistical analysis. The median AVR from the inferior vessel set was used if the superior vessel set were unavailable for vessel tracking (e.g., anatomical variations and/or vessel obscurations).
Inferred from our proof-of-concept study (18), which suggested intra-patient AVR variability with parallel regression slopes, we used a simple linear relationship between the LOP and the AVR for calculating estimated CSF pressure (eCSFP):

Statistical analysis
All descriptive statistics, group comparisons, and receiving operator characteristic (ROC) curve analyses were performed and visualized in GraphPad Prism v9.3.1 (GraphPad Software, LCC, San Diego, US). The normality of distribution for continuous variable data was tested with the Shapiro-Wilk test. Normal and non-normal distributed continuous data are displayed as mean with standard deviation (SD) and median with inter quartile range (IQR) respectively. For normally distributed continuous data the Welch’s t-test was used for unpaired group comparison and the paired t-test and 2-way ANOVA for before-and-after comparison. For non-normal distributed continuous data, the Mann-Whitney test was used for unpaired group comparison. The right eye AVRs were chosen for unifying the AVR comparison between IIH and non-IIH groups and for comparing AVR measurements before and after CSF withdrawal. A linear mixed model (LMM) with random intercepts including IOP as a fixed effect and subject and eye nested within subject as random effects was performed in R v4.2.1 (R Core Team [2022], Vienna, Austria) with the “lme4-package” for assessing the relationship between AVR and LOP. The eCSFP model was derived from the SAS (SAS Institute, Cary, US) GLM procedure performed on S1 and S3 in the RH cohort with AVR as the dependent variable. The derived model was verified with the AVRs and LOP values from the clinical LOP measurement (S2) in the RH and OUH cohorts. P-values less than 0.05 were considered statistically significant.
Results
Twenty-five patients with suspected IIH met the inclusion criteria and were included for fundus videography and AVR assessment during diagnostic LP. Seventeen patients (RH, n = 14; OUH, n = 3) received a final diagnosis of IIH and were allocated to the IIH-group. The remaining 8 patients (RH, n = 5; OUH, n = 3) did not fulfill the diagnostic criteria for IIH and were allocated to the non-IIH-group. The non-IIH-group included patients with LOP <18.4 mm Hg (25 cm H2O) and: pseudo-papilledema and headache (n = 2), normal optic disc appearance with migraine-like headache and a typical IIH phenotype (n = 2), and normal optic disc appearance with an MRI scan of the brain performed in suspicion of other pathology, showing radiologic signs of intracranial hypertension (n = 3). Finally, one patient in the non-IIH-group had optic disc edema in the right eye due to optic disc drusen associated nonarteritic anterior ischemic optic neuropathy (ODD-AION) and pseudopapilledema in the fellow eye due to a crowded optic disc; hence, the left eye was used for further analysis for this patient.
In the IIH-group, the median papilledema Frisén grade in the worst eye was 3 (IQR 2 to 3) and the mean ODE in the worst eye was 1103 ± 231 µm. The mean LOP was elevated in the IIH-group compared to the non-IIH-group (S2, 28.0 ± 8.6 mm Hg (38.1 ± 11.7 cm H2O) versus 15.0 ± 3.1 mm Hg (20.4 ± 4.2 cm H2O), p < 0.001). The group difference in LOP was equally reflected in the mean AVR during LOP measurement in S2 (Figure 3a, 0.78 ± 0.10 vs 0.90 ± 0.08, p = 0.006). Group demographics and clinical characteristics are displayed in Table 1. An overall 5.2% increase in AVR occurred after CSF drainage (Figure 3b, mean of differences 0.04, CI 95% [0.01 to 0.06], p = 0.003). In S2, before CSF drainage there was a statistically significant mean difference between the non-IIH-group and the IIH-group (2-way ANOVA, 0.122 [95% CI 0.019 to 0.225], p = 0.02), that subsided in S3, after drainage (Figure 3c). There was no significant difference in AVR between right and left eye (p > 0.1) and between the superior and inferior vessel set (p > 0.5). The data showed no indication that AVR was affected by the dilation of the optic nerve sheath (ONSD in S2, Pearson r = −0.02, p > 0.9), axonal swelling (ODE in S2, Pearson r = 0.25, p = 0.5), and papilledema grade (Frisén grade in S2, Pearson r = −0.04, p = 0.9). A moderate, but not statistically significant, negative correlation was observed between AVR and papilledema grade after CSF drainage (Frisén grade in S3, Pearson r = −0.49, p = 0.09). Scatterplots with correlations are available in online Supplementary Figure 1.

Patients with idiopathic intracranial hypertension (IIH) have a lower arteriole-to-venule ratio (AVR) and there is an overall significant increase after cerebrospinal fluid (CSF) drainage. (a) AVR was lower in the IIH diagnosed group compared to the non-IIH diagnosed group measured simultaneously with LOP (Welch’s T-test, p = 0.006). (b) Overall the AVR significantly increased after CSF drainage reducing the LOP (paired T-test, p = 0.003). Blue symbol = non-IIH. Lilac symbols = IIH and (c) Before CSF drainage there was a statistically significant difference between the non-IIH-group and the IIH-group (2-way ANOVA, 0.122 [95% CI 0.019 to 0.225], p = 0.02). After drainage the mean difference was decreased (2-way ANOVA, 0.096 [95% CI −0.007 to 0.199], p = 0.07).
Patient characteristics divided into groups according to final diagnosis.
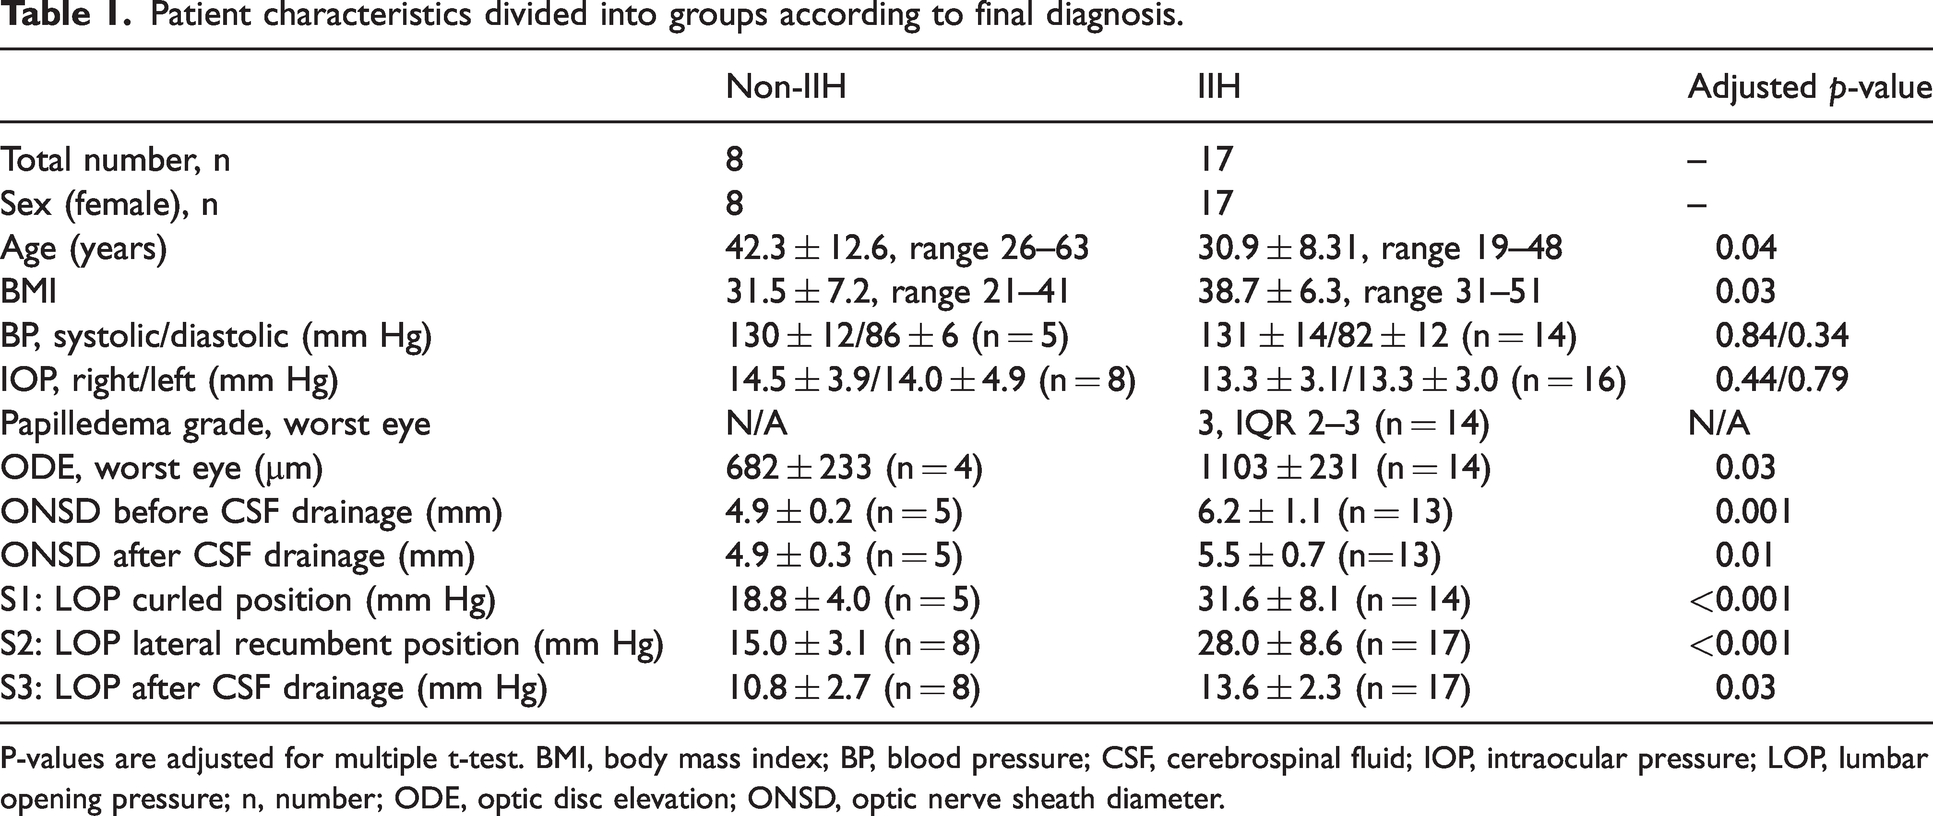
P-values are adjusted for multiple t-test. BMI, body mass index; BP, blood pressure; CSF, cerebrospinal fluid; IOP, intraocular pressure; LOP, lumbar opening pressure; n, number; ODE, optic disc elevation; ONSD, optic nerve sheath diameter.
Median AVR correlated inversely with LOP (Figure 4a, LMM slope regression estimate −0.0043 [95% CI −0.0073 to −0.0023], p = 0.002). This means for every increase of 10 mm Hg (13.6 cm H2O) in LOP the AVR decreases by 0.043. A stronger negative correlation was noted when LOP was above 15 mm Hg (20.4 cm H2O) (Figure 4a, LMM slope regression estimate −0.0080 [95% CI −0.0123 to −0.0039], p < 0.001). No relationship between AVR and LOP was observed when LOP was below 15 mm Hg (20.4 cm H2O) (Figure 4a, LMM slope regression estimate −0.0016 [95% CI −0.0369 to 0.0058], p = 0.2). The data fits a LMM with random intercepts and the negative slope regression estimate confirms that the AVR changes in relation to the LOP with a parallel trend among the patients with an inter-patient AVR heterogeneity expressed by the different Y-axis intercepts (Figure 4b), similar to our proof-of-concept study (18).

The arteriole-to-venule ratio (AVR) is affected by lumbar opening pressure (LOP). (a) Scatterplot (including data from both eyes (in S1, S2 and S3) with pooled regression lines based on linear mixed models with random intercepts adjusted for intraocular pressure and inter-eye correlations. AVR correlated inversely with the LOP ranging from 8 to 40 mm Hg (LMM slope regression estimate −0.0043 (95% CI −0.0073 to −0.0023), p = 0.002). In the low LOP range (<15 mm Hg [20.4 cm H2O]) there was no statistically significant correlation between AVR and LOP. When LOP exceeded 15 mm Hg (20.4 cm H2O) the negative correlation increased (LMM slope regression estimate −0.0080 (95% CI −0.0123 to −0.0039), p < 0.001) and (b) Scatterplot with individual LMM regression lines for patients having three AVR measurements (n = 17).
Based on a ROC analysis the most optimal AVR cut-off value to determine if LOP of a subject is above 20 mm Hg (27.2 cm H2O) was calculated to <0.71 with a sensitivity of 48% and a specificity of 92%, with a positive likelihood ratio of 6.24 (Figure 5a and AUC 0.73 [95% CI 0.60 to 0.86], p = 0.0021). Using the GLM derived eCSFP to determine if the actual LOP was above or below 20 mm Hg (27.2 cm H2O) an optimal eCSFP cut-off value was calculated to >22.50 mm Hg (30.6 cm H2O) with a sensitivity of 78% and specificity of 92% with a positive likelihood ratio of 9.33 (Figure 5b, AUC 0.81 [95% CI 0.59 to 1.00], p = 0.02). Two patients were excluded from the GLM procedure due to missing AVR in S1 and imprecise LOP measurement in S1 respectively. Individual plots for the GLM procedure are presented in online Supplementary Figure 2.

Receiver-operation-characteristic (ROC) curves to test if lumbar opening pressure (LOP) is above 20 mm Hg (27.2 cm H2O). (a) Using the median arteriole-to-venule ratio (AVR) for testing if LOP is above 20 mm Hg (27.2 cm H2O) is a fair test (AUC = 0.73, p = 0.002) with an optimal AVR cut-off below 0.71 and (b) The estimated cerebrospinal fluid pressure (eCSFP) derived from a previous LOP measurement and the corresponding AVR is a good test (AUC = 0.81, p = 0.02) to determine if LOP is above 20 mm Hg (27.2 cm H2O) when the eCSFP is above 22.50 mm Hg (30.6 cm H2O).
Discussion
In the present study we found RVDA and AVR convincing for screening patients with suspected IIH. In addition, we provide a model for eCSFP as a tool for detecting increased LOP at a later stage based on an initial AVR and LOP measurement. Our results demonstrate that AVRs are decreased in patients diagnosed with IIH compared to non-IIH patients with normal LOP. We observed an instant and significant increase in AVR after CSF withdrawal. Across all measuring points our data showed a statistically significant inverse - correlation between AVR and LOP using an LMM with random intercepts. We have verified that AVR expresses intra-patient variability with a parallel downward trend with decreasing CSF pressure. The reason for this variability is currently unknown. Also, we confirm that RVDA is applicable in patients with suspected IIH and papilledema emphasizing the value of AVR as a biomarker for acute changes in CSF pressure. The observed AVR dynamics support a cut off value for increased LOP > 20 mm Hg in (27.2 cm H2O) patients with suspected IIH to be AVR <0.71, but with an enhanced sensitivity (78% versus 48%) using the model for eCSFP. The LMM carried out in this study was unable to prove that IOP had a statistically significant effect on AVR as suggested in our proof-of-concept study (18).
Currently, retinal vessel dynamics are proposed to be directly correlated to changes in ICP. Reduced AVR and dilation of the retinal venules are associated with increased ICP both in the clinical and preclinical setting (13,23,24). AVRs have earlier shown to change after one hour from CSF withdrawal dependent on initial ICP(25). Retinal arteriole and venules are easy to differentiate in the peripapillary area. RVDA, a semi-automated image analysis method for gauging peripapillary vessel diameters in patients with elevated optic discs has shown to be a feasible and reliable method with minimal interobserver variability (26). However, RVDA has not yet been tested in a clinical setting with simultaneous LOP measurement in patients with papilledema. To improve RVDA for conditions with papilledema and intracranial hypertension, it is necessary to identify clinically relevant cut off values for AVR and eCSFP.
A decrease in retinal venule diameter has earlier been reported to correlate to the absolute change in optic disc area and volume in treatment of IIH (24). Increased AVR has shown a modest correlation with decreased ODE, which suggested an association to ICP (25). Our study was not able to demonstrate a significant correlation between AVR and ODE. This could be explained by inconsistent timing of the OCT and ODE measurement relative to the AVR measurement and the small number of patients.
Papilledema, absence of spontaneous retinal venous pulsations and peripapillary retinal vein engorgement are clinical hallmark signs of increased ICP. These signs are formed by mechanical mechanisms where increased CSF pressure in the subarachnoid space compresses the ON fibers within the ON sheath when passing through the retrobulbar space of the orbital cavity (intraconal space) (27). Also, there is a general belief that raised CSF pressure in the subarachnoid space of the ON is compressing the central retinal vein. Our study was not able to show any association between AVR and ONSD. This could indicate that the intra-optic nerve sheath CSF pressure is not accountable for the peripapillary retinal venule dilation. This emphasizes the theory that retinal venule dilation is a result of the upstream increased cerebral venous pressure (13). Interestingly, we found that the non-IIH case with ODD-AION had significantly lower AVR on the affected eye compared to the fellow eye without ODD, but with no dynamical change to ICP. We have previously reported an analogue observation using laser speckle flowgraphy measuring decreased blood flow in eyes with ODD compared to fellow eyes (28).
IIH serves well for validating peripapillary vessel dynamics in light of papilledema due to the homogeneity of the patient phenotype including young age, female sex, elevated BMI, and absence of other eye disorders. The combination of a systematic setup in a clinical setting on a homogenous group of patients representing the spectrum of suspected IIH is a strength of the study. IIH is a unique clinical condition with a mild to severely increased ICP in the awake state e.g., in contrast to severe TBI and intracerebral hemorrhage. Study subjects were young, mobile, and therefore easy to examine. Eye movements were voluntary, and the transparent corneas and lenses made it easy to assess the optic disc and peripapillary vessels. The study setup allowed simultaneous LOP and AVR recordings minimizing errors associated with changing posture and ICP lowering medication influencing ICP and/or AVR. Furthermore, the strengths include the use of multiple images of the peripapillary vessels for measuring arteriole and venule diameters in order to minimize measuring errors due to movement artifacts and vessel pulsations and machine learning algorithms collecting images for vessel tracking and gauging eliminates inter- and intra-observer variability. The vessel tracking used in this study was semi-automated and the automated arteriole and venule distinction was assessed by a completely blinded external assessor. Although the method to some extent mitigates inter- and intra-observer variability a future optimization of the machine learning algorithm will aim to completely automate the vessel tracking and gauging procedure and eliminate variability. To alleviate variations in focus and magnification of the retinal structures we used the ratio between arterioles and venules instead of using the direct vessel diameters. It could be of clinical interest to report individual vessel dynamics, but this requires improved fundus cameras including better focal length, autofocus capabilities and eye tracking than the one used in this study.
The most important limiting factor in this study was the correlation of a median AVR to single LOP values instead of direct correlation to a synchronized continuous ICP measurement. Despite LOP being proven to reflect ICP well it remains a surrogate marker susceptible to several factors and it is strongly determined by body position during measurement (6,7). This study focused on suspected IIH in its acute state, as patients diagnosed with IIH all had a degree of acute papilledema. The study did not include a healthy control group for comparison, therefore a normal AVR interval was not introduced. Our study did not cover cases with chronic papilledema. However, we suggest that the highly dynamic changes of the retinal venules are much more versatile than, for example, changes in papilledema size. Thus, AVR may predict increased LOP directly with an increasing sensitivity using the presented model, but its long-term capabilities were not evaluated. Pupillary dilation was only obtained when clinically indicated. Data from the OUH cohort were limited to right eye recordings in S2 and S3 only which may have resulted in a reduced precision of the eCSFP model. Although this study was well powered to show a difference in AVR when ICP is above or below 20 mm Hg (27.2 cm H2O), it was limited by the small number of patients and, hence multivariant analysis were unattainable.
We found median AVR derived from non-invasive fundoscopic image sequences combined with machine learning image analysis viable to reflect increased ICP. The simplest method to assess elevated ICP > 20 mm Hg (27.2 cm H2O), in the follow-up of a patient with confirmed IIH, is the direct AVR measure. This requires a fundus video from a patient positioned in the left lateral recumbent position, equal to the position for LOP measurement. This measure yields a high specificity, but a rather low sensitivity for increased ICP. If AVR <0.71 we recommend that the patients are ruled in for fast tracked head CT, MRI of the brain, and LP with LOP measurement to facilitate diagnosis and treatment. We also present a more robust model for ICP estimation accounting for the AVR inter-patient variability, but this requires a preceding paired LOP and AVR measurement. This model provides a stronger sensitivity and equal specificity. We recommend this model when monitoring treatment effect over time in patients diagnosed with IIH. eCSFP above 22.50 mm Hg (30.6 cm H2O) should warn clinicians to perform a confirmatory invasive ICP measurement (e.g., LOP measurement). However, it is crucial that further evaluation is performed before AVR can stand alone when estimating elevated ICP.
As for ONSD, AVR should theoretically not be influenced by ganglion cell axon loss or optic nerve atrophy since retinal vessel size are predominantly influenced by the intracerebral blood flow. This hypothesis was not addressed in the study, however, and reliability in long-term longitudinal validation studies are needed to ensure that LOP can be predicted, from initial paired LOP and AVR measurement, in later disease stages including post papilledema optic atrophy. ICP waveforms have been suggested originating from changes in intracranial blood flow velocity fluctuations (29). We speculate that the highly dynamic vessels in the peripapillary retina reflecting rapid changes in ICP potentially can distinguish ICP waveforms in the future. This requires better image quality and optimized machine learning algorithms in combination with continued ICP recordings. We suggest that the implication of RVDA should not be limited to patients with suspected IIH, as other disorders (e.g., sinus venous thrombosis and hydrocephalus) could widely benefit from non-invasive ICP monitoring.
In conclusion, we found AVR highly dynamic in response to acute changes in LOP. We present a practical model for detecting increased LOP (>20 mm Hg [27.2 cm H2O]) by measuring AVR in the acute state of IIH based on a paired baseline measurement of LOP and AVR. The setup is simple-to-use, low-cost and can easily be incorporated in the clinical setting.
Key findings
The retinal arteriole-to-venule diameter ratio (AVR) is decreased in patients with idiopathic intracranial hypertension (IIH) compared to non-IIH patients with normal lumbar opening pressures (LOP). AVR reflects acute changes in LOP. AVR is negatively correlated with LOP. Retinal vessel dynamics analysis measuring AVR is a viable non-invasive method for detecting intracranial hypertension.
Supplemental Material
sj-jpg-1-cep-10.1177_03331024221147494 - Supplemental material for Retinal vessel dynamics analysis as a surrogate marker for raised intracranial pressure in patients with suspected idiopathic intracranial hypertension
Supplemental material, sj-jpg-1-cep-10.1177_03331024221147494 for Retinal vessel dynamics analysis as a surrogate marker for raised intracranial pressure in patients with suspected idiopathic intracranial hypertension by Snorre Malm Hagen, Elisabeth Arnberg Wibroe, Johanne Juhl Korsbæk, Mikkel Schou Andersen, Asger Bjørnær Nielsen, Mathias Just Nortvig, Dagmar Beier, Frantz Rom Poulsen, Rigmor Højland Jensen and Steffen Hamann in Cephalalgia
Supplemental Material
sj-jpg-2-cep-10.1177_03331024221147494 - Supplemental material for Retinal vessel dynamics analysis as a surrogate marker for raised intracranial pressure in patients with suspected idiopathic intracranial hypertension
Supplemental material, sj-jpg-2-cep-10.1177_03331024221147494 for Retinal vessel dynamics analysis as a surrogate marker for raised intracranial pressure in patients with suspected idiopathic intracranial hypertension by Snorre Malm Hagen, Elisabeth Arnberg Wibroe, Johanne Juhl Korsbæk, Mikkel Schou Andersen, Asger Bjørnær Nielsen, Mathias Just Nortvig, Dagmar Beier, Frantz Rom Poulsen, Rigmor Højland Jensen and Steffen Hamann in Cephalalgia
Footnotes
Acknowledgements
The authors would like to thank Jakob Find Munk Madsen, the CEO of StatuManu ICP ApS, for his technical support of this study.
Declaration of conflicting interests
The authors declared the following potential conflicts of interest with respect to the research, authorship, and/or publication of this article: SM Hagen: Received research funding from Øjenforeningen (Fight for Sight, Denmark) and the Synoptik Foundation. EA Wibroe: Medical advisor for StatuManu ICP ApS on ad hoc basis. Travel cost and conference fee for participation in NANOS 2022 was reimbursed by StatuManu ICP ApS. Received research funding from Øjenforeningen (Fight for Sight, Denmark) and the Synoptik Foundation. JJ Korsbæk: Funding from Lundbeck Foundation and Candys Foundation. MS Andersen: Research grant from EU (Eurostar) with StatuManu ApS and Epipole Ltd. AB Nielsen: No conflicts of interest to disclose. MJ Nortvig: No conflicts of interest to disclose. D Beier: Advisory board member: Novartis, TEVA, Lilly; Clinical trials: Novartis, TEVA, Lilly, Lundbeck; Travel support: Novartis, Allergan, Abbvie. FR Poulsen: Advisory board member: OARK, research grant from EU (Eurostar) with StatuManu ApS and Epipole Ltd. RH Jensen: Gave lectures for Pfizer, Eli-Lilly, ATI, Merck, TEVA, Novartis, Lundbeck and Allergan. Investigator in clinical trials with ATI, Eli-Lilly, Novartis and Lundbeck. Director of Danish Headache Center, Lifting The Global Burden of Headache and Founder of Master of Headache Disorders at University of Copenhagen. Received research funding from University of Copenhagen, Rigshospitalet, ATI, Lundbeck Foundation, The Medical Society in Copenhagen, NovoNordisk Foundation and Tryg Foundation. S Hamann: Director of the Optic Disc Drusen Studies Consortium and the Copenhagen Optic Nerve Research Center. Received research funding from Rigshospitalet and the VELUX Foundation.
Funding
The authors disclosed receipt of the following financial support for the research, authorship, and/or publication of this article: This work was supported by Øjenforeningen (Fight for Sight, Denmark); and the Synoptik Foundation. The funding bodies had no influence on conception, design or reporting of the study.
References
Supplementary Material
Please find the following supplemental material available below.
For Open Access articles published under a Creative Commons License, all supplemental material carries the same license as the article it is associated with.
For non-Open Access articles published, all supplemental material carries a non-exclusive license, and permission requests for re-use of supplemental material or any part of supplemental material shall be sent directly to the copyright owner as specified in the copyright notice associated with the article.