
Abstract
Purpose of the study
The pathophysiological mechanism of medication overuse headache is uncertain; no distinctive markers have been described right now. The aim of this study was to conduct proteomic analyses on serum samples from patients with medication overuse headache and healthy individuals. Specifically, mono- (SDS-PAGE) and two-dimensional gel electrophoresis (2-DE) followed by liquid chromatography tandem mass spectrometry (LC-MS/MS) were used to evaluate changes in serum proteins.
Main findings
By SDS-PAGE, four over-expressed bands were revealed in patients, compared to controls. 2-DE combined with LC-MS/MS analysis allowed confirmation of some proteins preliminarily detected by SDS-PAGE: Hemopexin, alpha-1-acid glycoprotein 1, apolipoprotein A4 and haptoglobin. Moreover, other differential proteins were isolated, mostly increased in MOH patients: Alpha-1-antitrypsin, immunoglobulin heavy constant alpha 1, retinol binding protein and transthyretin. Only one protein, immunoglobulin kappa constant, was decreased in the patients’ group.
Conclusions
The investigation of the serum proteome can offer a better understanding about biological mechanisms underlying medication overuse headache. Specifically, medication overuse headache shares some serum biochemical markers with chronic pain conditions. Further studies might uncover the relevance of these proteins in medication overuse headache.
Introduction
About 2% of the worldwide population is suffering from chronic migraine, a neurological disorder characterized by reiterated episodes of severe and disabling head pain. Chronic migraine often involves a large intake of analgesics and acute headache medications (AHMs), paradoxically increasing the frequency and intensity of headache to a secondary disorder termed medication overuse headache (MOH) (1). Ergotamine, triptans, nonsteroidal anti-inflammatory drugs (NSAIDs), paracetamol, opioids, and caffeine are widely prescribed to chronic migraineurs and carry a different risk profile for developing MOH (2,3). Overall, their discontinuation and the subsequent amelioration of headache suggest their causative role. However, the neuropathology appears more complex and the frequent intake of AHMs does not necessarily produce MOH (4). In animal models, the regular consumption of AHMs, regardless of its type, leads to abnormal trigeminal nociceptive processing, ultimately related to neuronal nitric oxide synthase and calcitonin gene-related peptide (CGRP) (5,6). Anyway, normal serum levels of CGRP were described in MOH patients (7).
Although the discovery of biomarkers is a cornerstone in understanding of most medical conditions, MOH is still on the lookout. Several studies have so far explored different markers associated with medication overuse, including genetic polymorphisms, neurophysiological and neuroimaging abnormalities (8). They might help in identifying those patients at risk for developing the disorder, as well as the selection and monitoring of treatments, but none of them demonstrated a comprehensive role in the disease. Now, proteomics is refocusing the medical and pain research. It is becoming more and more important because of its ability to identify candidate biomarkers for many diseases, including cancers and neurodegenerative diseases (9,10). Demonstrating the clinical utility of a biomarker requires a disciplined approach: Initial explorative studies are expected to prove that the biomarker is significantly associated with the clinical state of interest. Up to now, there are no details regarding the serum proteomic profile of patients with MOH. Accordingly, the aim of this study was to explore for the first time and evaluate, using mono- (SDS-PAGE) and two-dimensional gel electrophoresis (2-DE) coupled with mass spectrometry (MS), whether changes in serum proteins of patients with MOH occur with respect to healthy individuals.
Methods
Population of the study
Sixty-nine consecutive patients with MOH, referring to the Headache and Drug Abuse Centre at the University of Modena and Reggio Emilia, were enrolled prospectively in a large single-centre proteomic study between September 2016 and January 2018. All patients were diagnosed by trained physicians, according to the international criteria (11). After signing written informed consent, collection of clinical data and completion of questionnaires were completed on admittance, before withdrawal therapy was started. The blood sampling was performed on the second day of hospitalization, fasting from midnight. For each patient, the subsequent parameters were described: (a) Prevalent acute headache medication used, classified in triptans, NSAIDs and mixtures; (b) daily drug intake (DDI), number of acute headache medications consumed every day; (c) years of chronic symptoms (CHR), time elapsed since the beginning of MOH.
Parameters (a) and (b) have been estimated considering the 3 months preceding the collection of blood samples.
Forty-two age- and sex-matched healthy volunteers were enrolled as controls. On the experimental day, they completed questionnaires and performed blood sampling, fasting from midnight. For both patients and healthy volunteers, exclusion criteria were: Headache on admittance to the centre, altered results in routine laboratory tests, other non-cephalic chronic painful conditions, and autoimmune, hepatic, renal, oncological, cardiovascular, psychiatric or neurological relevant pathologies. Proteomic analyses illustrated in this paper were conducted on a random sample of 20 patients and 18 controls.
Ethical considerations
This study was performed following the Helsinki Declaration principles, approved by the local Ethical Committee of Modena (prot. 2073) and subsequently amended by the Area Vasta Emilia Nord Ethics Committee (prot. 0019446/18). All patients and healthy volunteers gave their written consent to participate in the study before any experimental procedure was performed.
Serum samples collection and storage
Venous blood was collected in vacutainer tubes and allowed to clot at room temperature for 1 h. Serum was obtained by centrifugation at 2000 × g for 10 min at 4°C; a mixture of protease inhibitors (Sigma-Aldrich) was added to prevent protein degradation and alteration. Samples were divided into aliquots and stored at −80°C until analysis.
Proteomic analysis
Firstly, the complexity of serum was reduced by depletion of albumin and IgG using the ProteoPrep® Immunoaffinity albumin and IgG depletion kit (Sigma-Aldrich, St. Louis, MO, USA), that selectively removes these two most abundant serum proteins (12). Then, proteomic analysis was performed by sodium dodecyl sulphate-polyacrylamide gel electrophoresis according to Laemmli’s method, as previously reported (13). Briefly, serum samples (5 µg) were mixed with a solution composed of Laemmli buffer/2-mercaptoethanol, heated to 95°C for 5 min and then loaded in duplicate onto 4–12% precast gradient gel, Novex NuPAGE™ gels (Thermo Fisher Scientific, Waltham, MA, USA). Protein bands were stained with Coomassie Blue G-250 and gel images were acquired by a calibrated densitometer (Bio-Rad Laboratories, Hercules, CA, USA). To reveal differentially expressed protein bands, the QuantityOne 1-D analysis software, version 4.6.7 (Bio-Rad Laboratories) was employed, as previously described (14). This software allows the detection of increased or decreased protein bands based on stain intensity, returning the signal as optical density (OD). Furthermore, serum samples were subjected to 2-DE. In the first-dimension separation, serum proteins (130 µg) were diluted with rehydration buffer (6 M urea, 2 M thiourea, 4% CHAPS, 25 mM dithiothreitol (DTT), 0.2% ampholytes) and then loaded onto immobilized pH gradient strips, Ready IPG Strip™ (Bio-Rad Laboratories), 7 cm long, pH range 3–10. The isoelectric focusing (IEF) and the subsequent equilibration steps were carried out as previously described (16). The second-dimension separation was achieved on 8–16% polyacrylamide gradient gel using 1X Tris-Glycine-SDS, pH 8.3 (Bio-Rad Laboratories), as running buffer. Finally, proteins were stained with a highly sensitive silver nitrate staining protocol, based on the method reported by Shevchenko et al. (15). After the densitometric acquisition, each gel image was examined by the PDQuest 2-D image analysis software, version 7.3.1 (Bio-Rad Laboratories). This software detects the spot stain intensity as OD, and the spot area (mm2), providing a final value expressed as density (OD/mm2). The 2D gel maps from MOH patients and controls were compared to detect differentially expressed protein spots according to density values.
LC-MS/MS protein identification
The bands and spots of interest were subjected to an “in-gel” trypsin digestion protocol as reported earlier (12). Shortly, bands and spots were first de-stained with acetonitrile (ACN) and with a solution composed of 30 mM potassium hexacyano-ferrate/100 mM sodium thiosulphate, respectively. Then, they were reduced with DTT, alkylated with iodoacetamide and digested overnight at 37°C with Trypsin Gold Mass Spectrometry grade (Promega, Madison, Wisconsin, United States). After digestion, peptides were extracted by ACN/water/trifluoroacetic acid (50:49:1) and concentrated in a vacuum dryer, Concentrator plus (Eppendorf, Hamburg, Germany).
Before MS analysis, dried samples were resuspended in water/ACN/formic acid (95:3:2), sonicated at room temperature and centrifuged at 12,000 × g for 10 min. Protein identification was performed by an UHPLC-ESI-QExactive™ (Thermo Fisher Scientific), composed of UltiMate 3000 UHPLC System coupled to an ESI-QExactive™ Hybrid Quadrupole-Orbitrap™ mass spectrometer (LC-MS/MS-QO System), controlled by Xcalibur™ software, version 29 build 2926 (Thermo Fisher Scientific). The column, Zorbax SB-C18 RRHT, 2.1 × 50 mm, 1.8 µ particle size (Agilent Technologies, Santa Clara, CA, USA) was equilibrated with buffer A (0.1% formic acid) and 2% ACN at a flow rate of 0.3 mL/min. After sample injection (8 µL), ACN was raised at 3%, then linearly increased until 21% in 19 min; hence, the percentage of ACN was brought to 90% in 4 min and kept for 3 min before starting the reconditioning step. The total run-time per sample was 35 min.
The acquired raw data, converted into the Mascot generic format using MsConvert (version 3.0.10730, ProteoWizard tools) were searched against the UniProtKB database for peptide sequences and C-RAP for contaminants by Mascot MS/MS ion search, version 2.4 (Matrix Science, London, UK) setting the following parameters: Homo sapiens taxonomy (_HUMAN), trypsin as proteolytic enzyme, two max missed trypsin cleavages, mass tolerances ± 10 ppm for the precursor ions and ± 0.05 Da for the product ions, cysteine carbamidomethylation as fixed modification and methionine oxidation as variable modification. The highest score hits among Mascot were selected, where the score is [−10 × log(P)] and P is the absolute probability that the observed match between the experimental data and the database sequence is a random event. Proteins were considered identified when they showed at least two unique peptides. Moreover, an automatic decoy database search was used to estimate the false discovery rate (FDR), which was adjusted to < 1%. Protein identification was done in duplicate, using bands or spots cut from different gels.
Statistics
The comparison of quantitative variables between MOH patients and healthy individuals was performed using independent t-test, whereas the comparison of qualitative variables was performed using χ2. All p-values were two-sided, with a level of significance of 1%. R software (version 3.4.3) was used to perform statistical analysis.
Results
Population characteristics
Blood samples of 20 patients with MOH and 18 healthy volunteers were analysed (Table 1). Patients were between 34 and 74 years old (mean = 52.8), most were females. On admittance, headache was daily or almost daily for all of them, for not less than 3 months. Each of the 20 patients had suffered from migraine before being diagnosed with MOH. They consumed about two AHMs every day (mean =2.0, range = 0.4–4.4), and they had been suffering from chronic headache for more than 15 years (mean = 15.6, range = 0.33–40). According to the prevalent use of AHMs, 12 patients consumed triptans (60%), fewer patients were taking NSAIDs (n = 4; 20%) or mixture drugs (n = 4; 20%). The latter are combination analgesics, containing caffeine, indomethacin and prochlorperazine. The control group of healthy volunteers was an equally female-dominated group, aged between 25 and 59 years (mean = 40.6). Compared to healthy individuals, MOH patients had higher Zung Self-Rating Depression Scale (ZUNG-D) scores and less prevalent alcohol consumption. No significant differences were found in the following parameters: Body mass index, systolic and diastolic blood pressure, the prevalence of coffee and cigarette consumption and blood tests on renal function. Data and statistical comparisons are summarized in Table 1.
Baseline characteristics of MOH patients and healthy individuals.
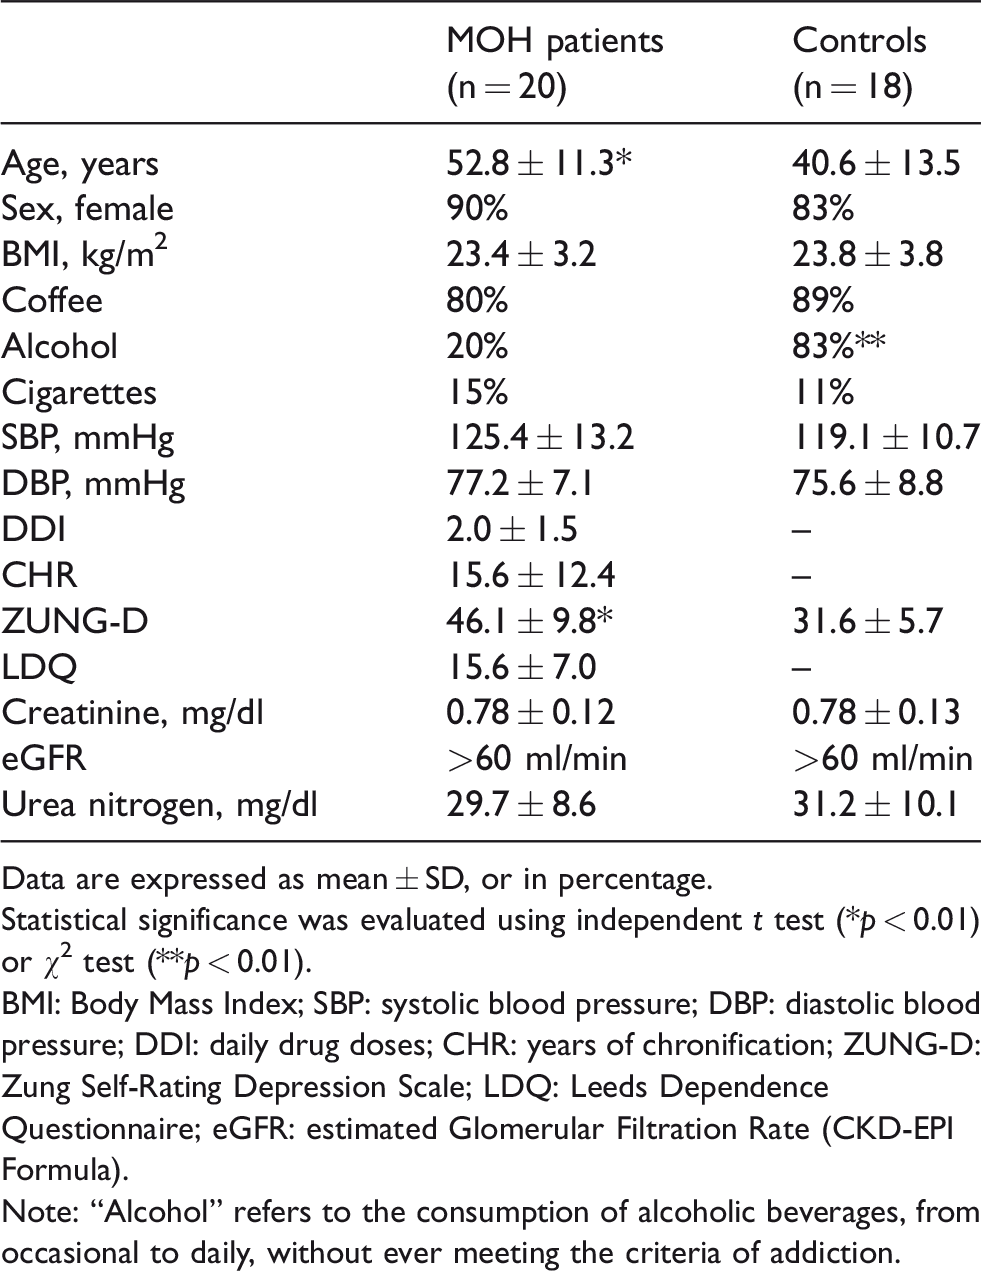
Data are expressed as mean ± SD, or in percentage.
Statistical significance was evaluated using independent t test (*p < 0.01) or χ2 test (**p < 0.01).
BMI: Body Mass Index; SBP: systolic blood pressure; DBP: diastolic blood pressure; DDI: daily drug doses; CHR: years of chronification; ZUNG-D: Zung Self-Rating Depression Scale; LDQ: Leeds Dependence Questionnaire; eGFR: estimated Glomerular Filtration Rate (CKD-EPI Formula).
Note: “Alcohol” refers to the consumption of alcoholic beverages, from occasional to daily, without ever meeting the criteria of addiction.
Mono-dimensional gel electrophoresis (SDS-PAGE)
By SDS-PAGE and QuantityOne 1-D analysis software, four bands differentially expressed were revealed between patients with MOH and healthy individuals (Figure 1). Specifically, the four bands were over-expressed in the patient group, as indicated by fold-change values reported in the last column of Table 2. Proteins included in each band were identified by LC-MS/MS-QO System; all MS data are provided in Table 2.

SDS-PAGE separation. The differentially expressed bands detected in serum of MOH patients compared to control subjects are indicated by alphanumeric labels (C0–C3 in controls; P0–P3 in MOH patients). The bands labels correspond to those reported in Table 2. Proteins included in each band were identified by LC-MS/MS. SDS-PAGE: 4–12% gradient gel (Novex NuPAGE); Coomassie Blue G-250 staining.
Differentially expressed proteins in serum of MOH patients and controls detected by SDS-PAGE and identified by LC-MS/MS.

(a)Alphanumeric code of the protein band, corresponding to those reported in Figure 1 (P0-P3 bands for MOH patients; C0-C3 for controls).
(b)Protein entry name, according to the UniProtKB database.
(c)The highest scores with MASCOT search engine.
(d)Theoretical molecular weight (Da).
(e)Number of significant peptides matching the identified protein.
(f)Number of significant sequences.
(g)Exponentially modified protein abundance index (emPAI).
(h)Fold-change of band intensity, achieved as the ratio between the optical density (OD) values measured in the MOH patients’ group vs. the control group.
Two-dimensional gel electrophoresis (2-DE)
2-DE combined with LC-MS/MS analysis allowed confirmation of some proteins preliminarily detected and identified by SDS-PAGE (Table 3): Hemopexin (HEMO), alpha-1-acid glycoprotein 1 (A1AG1), apolipoprotein A4 (APOA4) and haptoglobin (HPT). Figure 2 shows two representative 2D gel maps obtained from serum samples of control subjects (Figure 2(a)) and MOH patients (Figure 2(b)), which evidence the differentially expressed protein spots revealed by the PDQuest software. Moreover, other proteins were also discovered, mostly increased in MOH patients: Alpha-1-antitrypsin (A1AT), immunoglobulin heavy constant alpha 1 (IGHA1), retinol-binding protein (RETBP) and transthyretin (TTHY). Only one protein, immunoglobulin kappa constant (IGKC), was decreased in the patients group compared to controls.
Differentially expressed serum proteins detected by 2-DE and identified by LC-MS/MS.
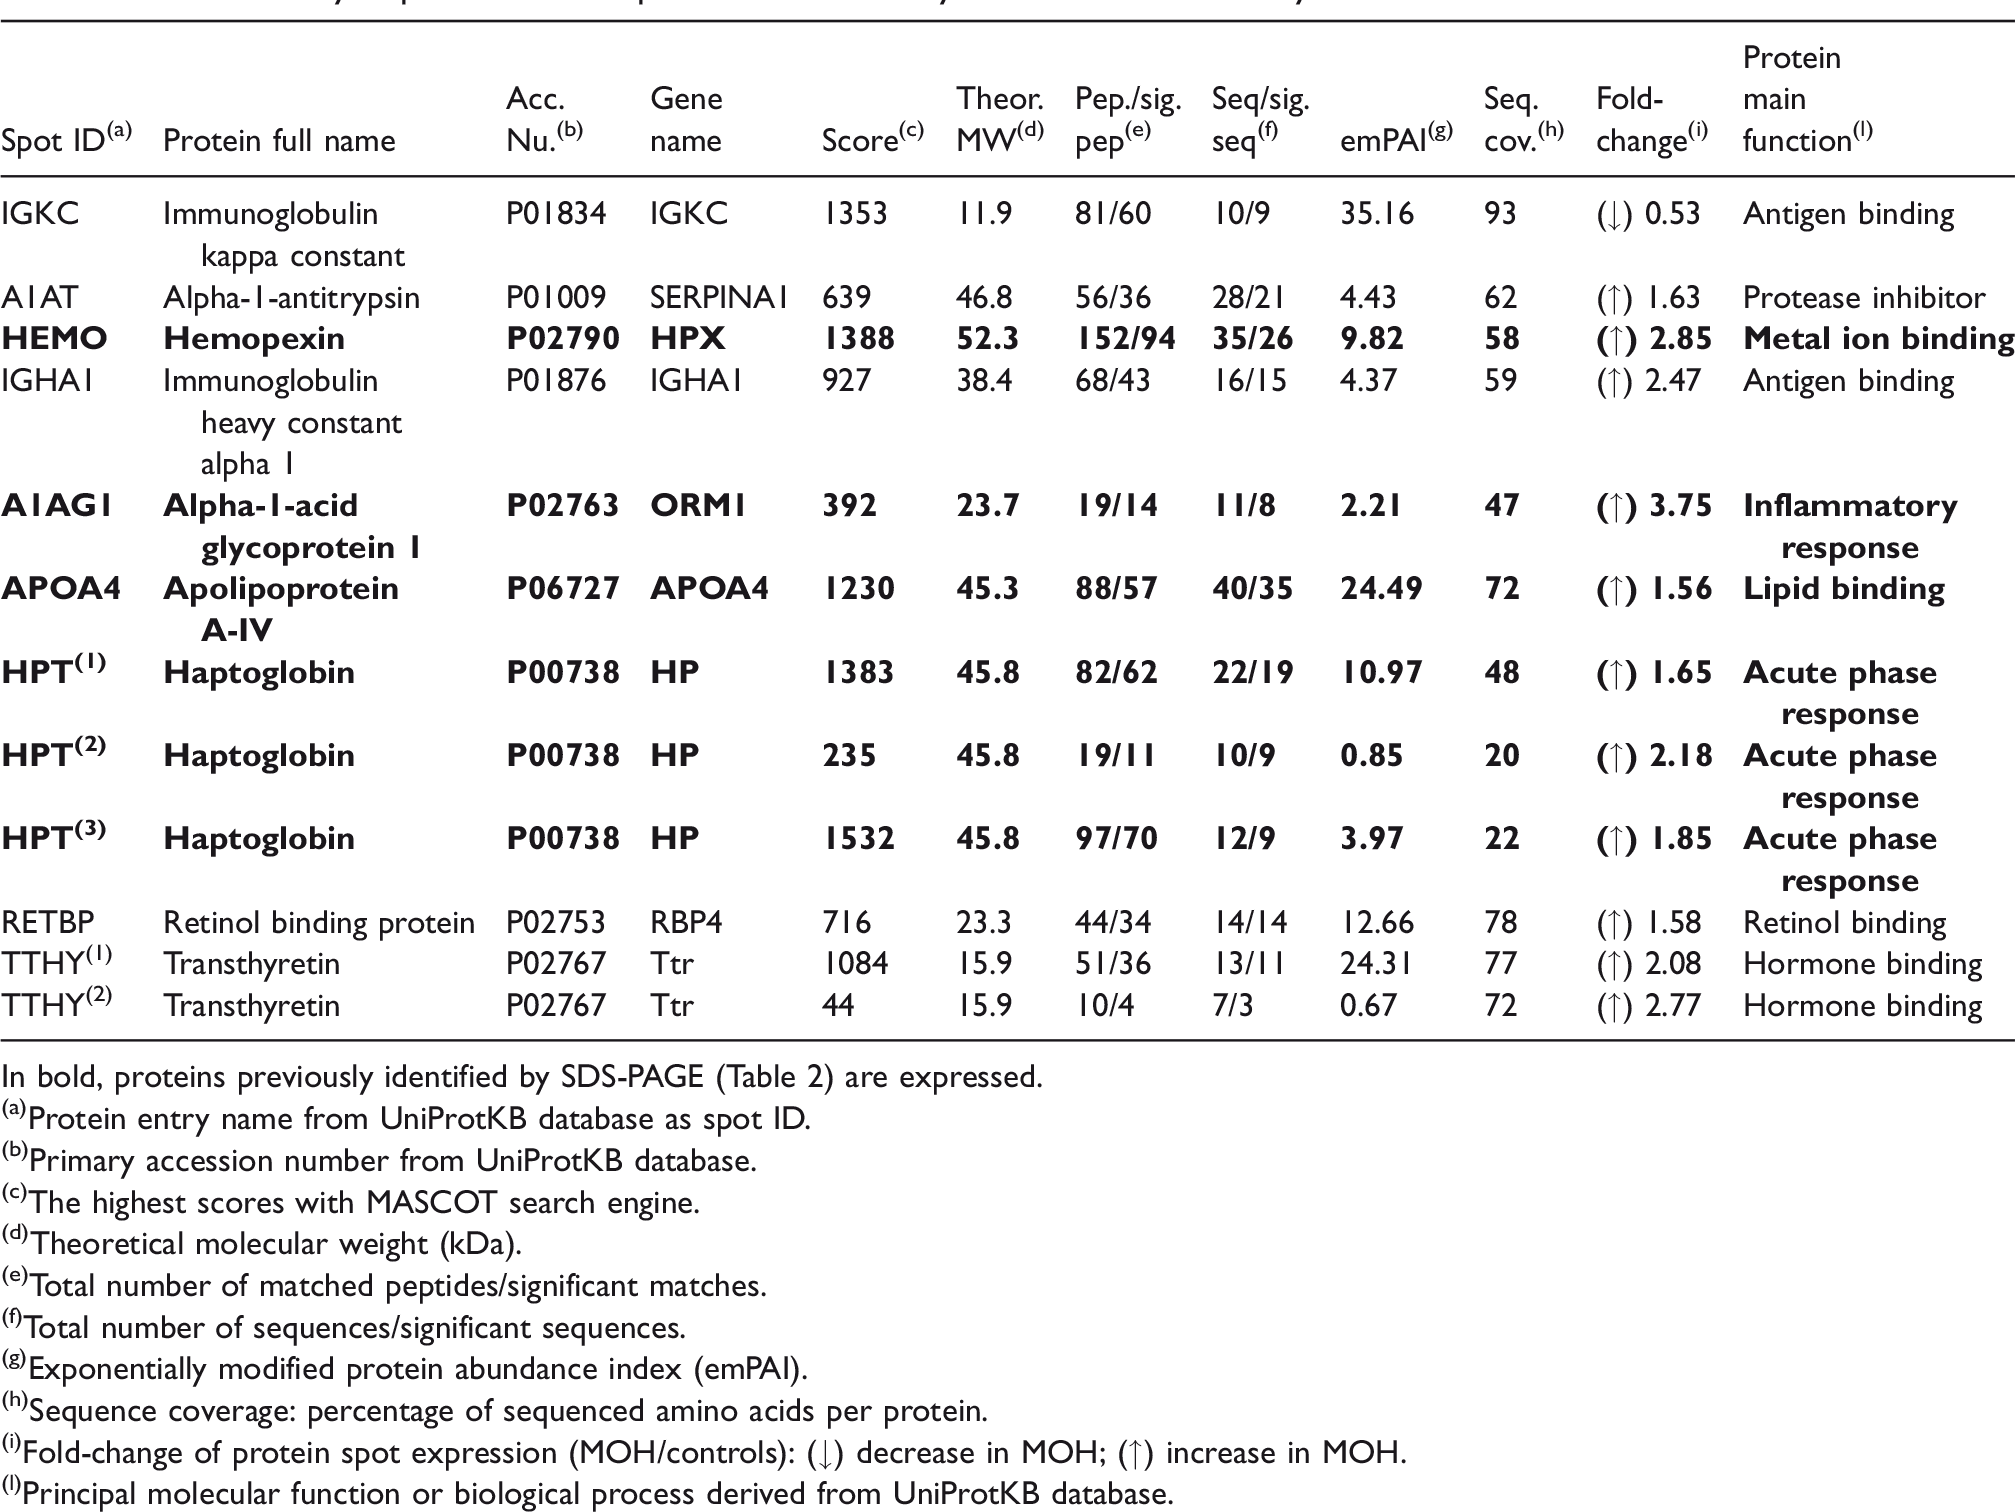
In bold, proteins previously identified by SDS-PAGE (Table 2) are expressed.
(a)Protein entry name from UniProtKB database as spot ID.
(b)Primary accession number from UniProtKB database.
(c)The highest scores with MASCOT search engine.
(d)Theoretical molecular weight (kDa).
(e)Total number of matched peptides/significant matches.
(f)Total number of sequences/significant sequences.
(g)Exponentially modified protein abundance index (emPAI).
(h)Sequence coverage: percentage of sequenced amino acids per protein.
(i)Fold-change of protein spot expression (MOH/controls): (↓) decrease in MOH; (↑) increase in MOH.
(l)Principal molecular function or biological process derived from UniProtKB database.

Representative 2-D gel maps of serum samples. In circles are evidenced the differentially expressed spots between control group (a) and MOH patient’s group (b). For each identified protein the corresponding entry name (which reflects that listed in Table 3) is reported.
Discussion
This study represents an exploratory evaluation performed on MOH patients, designed to identify potential serum protein markers related to the chronic headache condition. It enters into a rapidly evolving area of research, concerning the study of the human pain pathophysiology using proteomic techniques. Serum profiles of patients with different chronic pain conditions (such as fibromyalgia, chronic widespread pain and painful neuropathies) were associated with abnormal levels of varying protein molecules (16,17), some appear capable of diagnosing endometriosis in patients suffering from chronic pelvic pain (18). Also, in migraine, different proteins were detected in the attack period compared to the attack-free period using 2-DE and MS analysis (19).
Serum proteins over-expressed in MOH patients
We found different proteins at unusually high concentrations in the serum of MOH patients. A1AT, TTHY, APOA4, and HPT have already been identified in previous studies and in an animal model of neuropathic pain. Specifically, A1AT and TTHY were found at a high level in the urine of MOH patients (20), whereas A1AT, APOA4, HPT, and TTHY were increased in rat serum up to 5 weeks after sciatic nerve ligation (21). Moreover, in the present study, three additional serum proteins were detected at high levels: HEMO, A1AG1, and RETBP.
HEMO is a glycoprotein known to bind heme, and transports it to the liver for breakdown and iron recovery. It is produced by several sources, including hepatocytes, mononuclear blood cells and the human brain (22), and it was previously linked to nerve injury (23,24). In patients with painful intervertebral disc degeneration, the cerebrospinal fluid level of HEMO correlated with pain intensity and physical disability (25). A1AG1 is a serum protein synthesized in the liver, which binds synthetic drugs and influences their distribution and availability in the body. Unlike other drugs-binding proteins present in serum, such as albumin, A1AG1 levels were found to be increased in chronic pain and several stress-related clinical situations (26,27). Thus, it may reduce the efficacy of drugs administered in patients who are chronically stressed, accounting for some aspects of apparent tolerance and reduced efficacy for tricyclic antidepressants and analgesics (28). Finally, RETBP is a 21 kDa protein that originates from the liver and circulates in the blood bound to TTHY. It mediates retinol transport in blood plasma and delivers retinol to the peripheral tissues. RETBP concentrations in the peripheral blood are about 50 mg/L and are increased in renal impairment. Its reabsorption by the kidney is nearly complete, so its increase in concentration is an indicator of impaired tubular function (29). A previous proteomic assessment of serum from fibromyalgia patients showed up-regulated levels of RETBP compared to healthy individuals (18). Moreover, its plasma concentration was increased in trigeminal neuralgia patients and decreased after surgery (30).
Does MOH have some neuropathic traits?
Several serum proteins were observed at unusually high concentrations in MOH patients, but the reason is unclear. Based on the results of previous studies, it could be assumed that MOH and neuropathic pain might have some similarities. The definition of neuropathic pain is still evolving and remains an issue of controversy. According to one of its most recent definitions (31), it consists of the following features: a) pain and sensory symptoms persisting beyond the healing phase; b) neurological sensory signs in variable degrees, manifesting as negative and/or positive sensory phenomena; and c) other neurological signs, including negative and/or positive motor dysfunction or autonomic symptoms. MOH shares nearly all the aforementioned clinical aspects of neuropathic pain, including hyperalgesia, allodynia, positive and negative sensory phenomena (32). Most closely related to MOH, the impact of prolonged exposure to AHMs might result in enduring neural damage and sensitization of the trigeminal nociceptive pathways, including increased facilitation and/or a diminished inhibition of pain (5,6,33). Medications typically used for neuropathic pain, such as tricyclic antidepressants and antiepileptics, show some effectiveness in MOH. In addition, the variable analgesic response of MOH with opioids appears to parallel the variable outcomes observed when opioids are administered for the treatment of neuropathic pain (34,35). Anyway, MOH is still considered more related to medication overuse and does not possess enough evidence to be regarded as a neuropathic pain manifestation; further efforts will deepen such relationship.
Limitations
The identification of candidate serum markers of MOH is only explorative. At the current status, the detected proteins provide no information about future risk of the disorder. Moreover, healthy subjects appeared significantly younger than patients after the random selection of samples. However, data from our study and those reported in the scientific literature do not suggest significant proteomic changes at these ages (52.8 vs. 40.6). A small increase in serum concentration has been described for A1GA1 (36), but is irrelevant with respect to the fold-change we observed.
Conclusions
The present study provides evidence that serum proteome can renew information about possible mechanisms underlying MOH. Specifically, the disease is associated with increased levels of serum proteins, some of which are also highly concentrated in the urine and serum of animals with neuropathic pain. Most proteins have been associated with chronic pain syndromes, suggesting that MOH may share some neuropathological mechanisms with neuropathic pain. The current findings might contribute to a better understanding of the pain sensitization processes, as well as widening the knowledge of the biological mechanisms involved in MOH. However, large-scale studies are needed to validate and extend the current results, using additional models and high-throughput approaches to demonstrate proper sensitivity and specificity for potential clinical use of some protein markers.
Clinical implications
Proteomics revealed high-level proteins in the serum of patients with MOH compared to healthy individuals. Serum and urinary proteomic patterns of MOH share specific traits, also found in other chronic pain syndromes and in animal models of neuropathic pain. MOH and neuropathic pain share some markers and clinical manifestations, but their relationship deserves further investigation.
Footnotes
Declaration of conflicting interests
The authors declared no potential conflicts of interest with respect to the research, authorship, and/or publication of this article.
Funding
The authors received no financial support for the research, authorship, and/or publication of this article.