
Abstract
Objective
The objective of this investigation was to examine the distribution of galcanezumab and a control immunoglobulin 4 antibody containing the same constant regions as galcanezumab, into peripheral and central tissues.
Methods
Galcanezumab and a control immunoglobulin 4 antibody were radioiodinated with Iodine-125 to specific activities of 0.11 mCi/mg and 0.16 mCi/mg, respectively. At 24, 72, and 168 hours following subcutaneous injection of either antibody (4 mg/kg), cerebrospinal fluid and plasma were obtained followed by saline perfusion to remove residual blood and collection of selected tissues for determination of Iodine-125 content by gamma counting.
Results
The peak plasma levels of Iodine-125 galcanezumab and Iodine-125 control immunoglobulin 4 were observed at 72 hours and remained high at 168 hours post-dose. The rank order of tissue levels was dura mater = spleen > trigeminal ganglia ≫hypothalamus = spinal cord = prefrontal cortex = cerebellum. Iodine-125 galcanezumab levels in peripheral tissue (dura mater, spleen, and trigeminal ganglia) averaged 5% to 11% of plasma, whereas all of the central nervous system (CNS) tissue levels and the cerebrospinal fluid levels were < 0.4% of plasma. Distribution of the antibodies into the dura mater and the trigeminal ganglia was similar to that observed in the spleen and significantly greater than exposure in the brain or spinal cord.
Conclusions
The central levels of galcanezumab were relatively low, which would favor the dura mater and trigeminal ganglia as sites of action for its observed clinical efficacy. However, a central site of action cannot be excluded.
Introduction
Migraine is a common neurologic disease ranking sixth in worldwide prevalence and second as a specific cause of disease disability in the world (1–3). Yet despite its high socioeconomic cost, migraine is often under-recognized and inadequately treated (3–6). Consequently, the effective management of migraine represents a significant clinical need.
Serious investigations into the pathophysiology of migraine have accelerated over the past 2–3 decades, spurred in part by observations that spontaneous and experimentally evoked migraine was associated with elevations of jugular venous blood concentration of calcitonin gene-related peptide (CGRP), which was reversed with sumatriptan-induced relief of migraine symptoms (7,8). This neuropeptide is expressed in peripheral sensory neurons, as well as in the central nervous system, and is prominent within the trigeminovascular system (9–12). Several small-molecule CGRP receptor antagonists were shown to be effective in relieving acute migraine headache in double-blind, randomized, placebo-controlled clinical trials, although further development was hampered by off-target hepatotoxicity and formulation issues (13–16). More recently, the use of humanized monoclonal antibodies has shown promising results in randomized clinical studies (17). For example, galcanezumab, given in monthly doses ranging from 120 mg to 300 mg, was effective in preventing migraine, and was safe and well tolerated by patients with migraine (18). These findings were recently confirmed in a larger Phase 3 clinical trial (19).
While converging evidence points to a prominent role for CGRP in the pathophysiology of migraine, the mechanisms invoked to mediate migraine headache are not clearly established. Growing evidence indicates that peripheral actions of CGRP, at the meningeal neurovascular interface or trigeminal ganglion (TG), are likely to be most relevant to migraine, and that the antibodies to CGRP act mainly at peripheral sites of the trigeminovascular system (5,20). However, it is still possible that CGRP can also act centrally, at the level of the trigeminal nucleus caudalis as well as at sites involved in descending pain modulation. In the present investigation, we examined the ability of galcanezumab given subcutaneously to cross the blood-brain barrier (BBB) in rats.
Materials and methods
Preparation of antibodies
Reaction vials were precoated with Pierce® Iodination Reagent (Pierce catalogue #28600) at approximately 0.03 mg Iodogen Reagent/mg antibody as recommended by Pierce “Standard Protocol for Radioiodination of Proteins and Peptides.” Either galcanezumab or control immunoglobulin 4 (IgG4) antibody was added to a precoated reaction vial. 0.12 mCi carrier-free Iodine-125 ([125I]) (Perkin Elmer catalogue #NEZ033A) per mg antibody was added and allowed to proceed at room temperature in phosphate-buffered saline (PBS) for at least 10 minutes with occasional mixing. The iodinated proteins were purified from free [125I] using PD-10 gel filtration columns (GE catalogue #17-0851-01). Peak protein fractions were pooled, antibody concentrations were determined using a Beckman DU7400 spectrophotometer, and radioactivity was determined using a PerkinElmer Wizard2® gamma counter. The resulting radiolabeled galcanezumab and control IgG4 antibody had specific activities of 0.11 mCi/mg and 0.16 mCi/mg, respectively. The antibody solutions were prepared in PBS at a pH of 7.4 in a concentration of 2 mg/ml prior to injection.
In vivo studies
All animal studies were conducted in accordance with the policies and recommendations of the National Institutes of Health guidelines for laboratory animals and conform to the protocols approved by the Eli Lilly Institutional Animal Care and Use Committee. Male Sprague Dawley rats (Harlan, Indianapolis, IN) weighing between 300 and 330 g were housed three to a cage with free access to food and water.
At the start of the study, two groups of 12 rats received subcutaneous injections of either 4 mg/kg of [125I] galcanezumab or [125I] control IgG4. At 24, 72, and 168 hours after injection, four rats were culled from each group at each of these time points and anesthetized with urethane (600 mg/kg). Approximately 50 µL to 100 µL of cerebrospinal fluid (CSF) was withdrawn from the cisterna magna of each rat, visually inspected for signs of blood contamination, and weighed. Approximately 1 ml of blood was obtained by direct cardiac puncture and placed in an EDTA microfuge tube, and 200 µL of plasma was prepared for analysis. The animals were then subjected to cardiac perfusion with heparinized saline to rinse out residual blood, and the following tissues were collected and weighed for analyses: Spleen, prefrontal cortex, cortex (72 and 168 hours only), hypothalamus, cerebellum, whole spinal cord, dura mater, and TG. Tissue wet weight or volumes (plasma, CSF) were determined for each sample. Radioactivity present in each sample was determined by counting each sample with a PerkinElmer Wizard2® gamma counter.
Data analyses
Counts per minute obtained from each sample were adjusted for counting efficiency, radioactive decay over the course of the study, and specific activity to calculate the mass of antibody present, which was expressed as a fraction of the volume (µL) or sample weight (mg). In addition, tissue and CSF concentrations of antibody were also expressed as a percent of plasma concentration. Statistically significant differences among samples, set at p ≤ 0.05 (two-tailed), were determined by two-way analysis of variance (ANOVA), with the tissue matrix (plasma, CSF, spleen, dura mater, TG, spinal cord, prefrontal cortex, cerebellum, and hypothalamus) and treatment/time (galcanezumab or control IgG4 treatments at 24, 72, or 168 hours) as factors, which was performed followed by Tukey’s Multiple Comparison test (Prism 6.05, GraphPad Software, La Jolla, CA). Because whole cortex (excluding the prefrontal cortex) was only collected at 72 and 168 hours, it was excluded from the statistical analyses.
Results
Plasma levels and time-course of [125I] galcanezumab and [125I] control IgG4
Plasma levels of both [125I] galcanezumab and [125I] control IgG4 were measured at 24, 72, and 168 hours (Figure 1). Peak plasma concentrations of 160 nM (24,000 pg/µL) and 150 nM (22,000 pg/µL) for [125I] galcanezumab and [125I] control IgG4, respectively, were attained 72 hours after injection. The plasma concentrations remained elevated at 168 hours after dosing. There were no significant differences between plasma concentrations of galcanezumab or the control IgG4 antibody over the course of the study. Moreover, the plasma levels of [125I] galcanezumab were consistent with those measured in previous preclinical and clinical studies (21,22). In rats, a 4 mg/kg dose of galcanezumab resulted in a serum level of 21,300 pg/µL 120 hours after dose and inhibited capsaicin-induced increased blood flow as determined by laser Doppler imaging (21). In healthy human volunteers, doses of galcanezumab that are consistent with the range of clinically efficacious doses in episodic migraine inhibited capsaicin-induced increased blood flow measured by laser Doppler imaging and produced peak serum concentrations of up to 37,200 pg/µL (22).
The time-course of plasma concentrations (fmole antibody/µL plasma) for [125I] galcanezumab and [125I] control IgG4. It should be noted that the plasma concentrations at 72 hours and 168 hours are consistent with the mean serum level of 21,300 pg/µL (95% CI: 18,000–24,500 pg/µL) for an active dose in the rat to inhibit capsaicin-induced blood flow measured with laser doppler imaging (21).
Tissue levels and time-course of [125I] galcanezumab and [125I] control IgG4
The time-course of the levels of the antibodies in different tissues paralleled that seen in plasma (Figure 2). Tissue levels of [125I] galcanezumab were elevated at 24 hours and reached a peak concentration at 72 hours. They remained elevated 168 hours after injection of the antibodies. The highest concentrations were observed in plasma, spleen, dura, and TG at each time point, whereas the lowest concentrations were observed in brain tissue, spinal cord, and CSF (Figure 2). There were no significant differences in the tissue levels and in the time-course of distribution between [125I] galcanezumab and [125I] control IgG4.
The distribution of [125I] galcanezumab and [125I] control IgG4 in different tissues at 24, 72, and 168 hours.
Normalized biodistribution of [125I] galcanezumab and [125I] control IgG4 to plasma
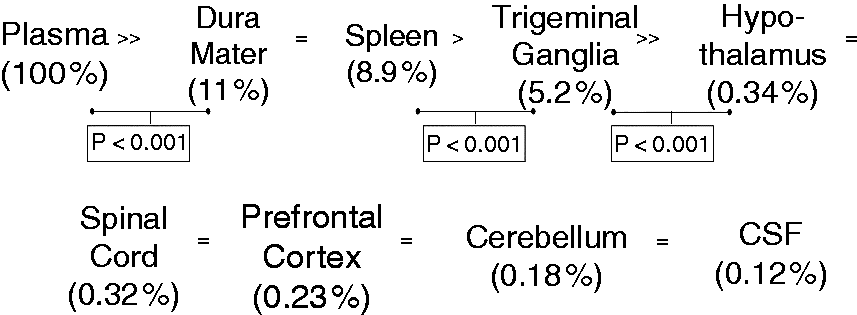
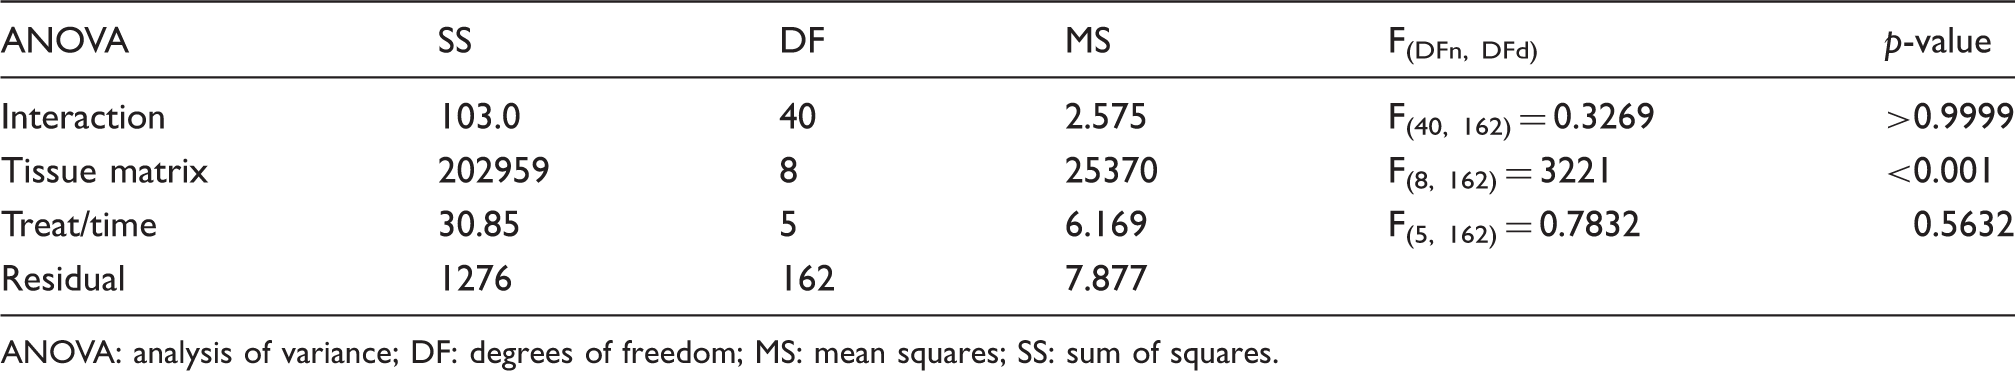
To better visualize the differences in distribution of the antibodies across the different tissue types, the concentrations in each sample were normalized by division so that plasma concentrations were set as 100%, and each of the tissue concentrations were reported as a percent of the plasma level (Figure 3). A subsequent two-way ANOVA indicated no significant effect of group (such as treatment and time, F(5, 162) = 0.78; p = 0.56) nor an interaction between group and tissue matrix (F(40, 162) = 0.33; p > 0.99) (Table 1). In other words, there were no significant differences in normalized tissue concentrations between galcanezumab and control IgG4 across all time points measured. In contrast, a significant effect of the tissue matrix was found (F(8, 162) = 3221, p < 0.001) and a post hoc comparison of the different tissues was completed (Table 1). The concentrations of [125I] galcanezumab and [125I] control IgG4 were approximately an order of magnitude lower in the spleen, dura, and TG when compared to plasma concentrations and ranged between 11% (dura, global mean % plasma values averaged across all three time points) and 5.2% (TG) (Figure 4). There were no significant differences in normalized tissue concentrations between the dura and the spleen (8.9%). The normalized level measured in the TG was significantly (p < 0.001) lower than that determined in the dura. The normalized tissue concentrations were significantly (p < 0.001) lower, by an order of magnitude, in the hypothalamus compared to levels in the TG (Figure 4). The normalized tissue concentrations of galcanezumab were similar in the hypothalamus, spinal cord, prefrontal cortex, cerebellum, and CSF (corresponding to 167 pM ± 5.85 pM), ranging from 0.32% (spinal cord) to 0.12% (CSF) of plasma levels (Figure 4). The rank order of tissue concentrations is illustrated in Figure 4.
Concentrations of [125I] galcanezumab and [125I] control IgG4 normalized as % plasma at the time of peak effect (72 hours). Rank order of [125I] galcanezumab concentrations. ANOVA table for distribution of galcanezumab and control IgG in all tissues and across time. ANOVA: analysis of variance; DF: degrees of freedom; MS: mean squares; SS: sum of squares.
Discussion
The present investigation showed that systemically administered galcanezumab remains largely outside the central nervous system (CNS) and does not differ from that of the control IgG antibody. Penetration into the CSF and brain tissue was extremely low, ranging from 0.1% to 0.3% of the plasma concentration. Although uptake of galcanezumab and the control IgG were detected in plasma and all tissues samples within 24 hours, peak plasma values were reached at 72 hours. Levels remained elevated 168 hours (i.e. 7 days) after injection. These results are consistent with reported distribution of IgG proteins. Animal studies have shown that about 0.1% to 0.2% of systemically administered antibodies reach the CNS at steady-state concentrations (23,24). Clinical studies regularly indicate a steady-state IgG CSF/serum ratio of 0.0027 (0.27%) (25,26).
Several animal studies where CGRP levels in brain tissue were analyzed have provided CGRP concentrations ranging from <0.5 pmols/g tissue in the cerebellum to 58.3 ± 6.8 pmols/g tissue in medullary tissue (28–33), which are considerably higher than the galcanezumab concentrations in brain tissues reported in the present investigation. However, it should also be emphasized that these reported CGRP levels might be over-estimated, since a majority of the CGRP measured in such studies is not extracellular and, depending on the ELISA assay utilized, prepro- and pro-CGRP can be measured as well. Measurement of CGRP concentration in CSF may be a meaningful surrogate that avoids these potential confounds. In a study where 60 mM potassium chloride was applied to the dura of anesthetized rats, CGRP concentrations of CSF derived from the cisterna magna were measured (34). Dural stimulation resulted in CSF concentrations ranging from a baseline of 84.3 ± 4.9 pg/ml (22.2 pM ± 1.29 pM) to 94.9 ± 6.1 pg/ml (25.0 pM ± 1.69 pM) (34), which are somewhat lower than the CSF galcanezumab concentrations determined in the present investigation. Thus, it is possible that sufficient galcanezumab enters the CSF to neutralize central CGRP. However, the concentration of CGRP in the CSF results from the diffusion and thus dilution of CGRP that is released at a synapse. Thus, the local concentration of galcanezumab required to neutralize CGRP before the neuropeptide can activate its receptor(s) could be orders of magnitude higher than needed to bind the CSF CGRP concentration.
The mechanisms for transport of antibodies into the CNS are currently under investigation. The BBB consists of a single layer of nonfenestrated capillary epithelial cells joined by tight junctions and further supported by astrocytes and pericytes (24,35). This arrangement results in a highly regulated permeability that restricts the access of large molecules such as IgGs to the CNS (26,36). It had been previously hypothesized that migraine aura, which is believed to be associated with cortical spreading depression, caused a disruption of the BBB, allowing it to become “leaky” and permitting drugs that normally cannot cross the BBB to penetrate into the CSF. However, magnetic resonance imaging performed during the aura phase of migraine in 19 patients with migraine found no evidence of increased BBB permeability (37,38). In a dynamic PET imaging study of patients with glyceryl trinitrate (GTN)-triggered migraine attacks, there was no binding of [11C]-dihydroergotamine in brain parenchyma either during baseline or after GTN, indicating that the BBB remains intact during a migraine attack (39).
It is more likely that IgG enters the CSF via the choroid plexus. The choroid plexus forms the blood-CSF barrier and is responsible for the secretion of CSF. The flow of CSF from the choroid plexus to the arachnoid villi, where it is resorbed into the blood, is 2 µL/min in rats and 520 µL/min in humans, whereas the microcirculation of CSF into brain parenchyma progresses at a rate of 0.1 µL/min (36). In a more recent study designed to examine the pharmacokinetics of IgG absorption into the brain, mice were injected intraperitoneally with a preparation containing polyclonal human IgG (26). While 61.8% of the injected dose was present in plasma, 0.16% was in the spleen, and 0.009% and 0.002% was found in the cortex and hippocampus, respectively (26). Although these numbers are not directly comparable to those determined in the present study, since they report percent of injected dose and not mg of IgG/g tissue, they show a relatively low presence of IgG in brain tissue compared to the spleen. In situ cerebral perfusion studies showed a saturable brain uptake of IgG, suggesting that transporters may transfer IgG across the BBB (26). However, this observation is in conflict with others indicating no transport of IgG across the BBB (40). It therefore remains unclear whether a transport system exists to transfer IgG into the CNS. Conversely, transport of IgG from CSF into the blood has been demonstrated (41).
The higher concentration of IgG measured in the TG in the present study supports other observations, indicating that the TG is not protected by the BBB. The intravenous injection of Evans blue dye, which complexes with serum albumin and does not cross the BBB, to rats showed no staining in the cortex and cerebellum, but the dye was present in the TG, pituitary, and choroid plexus (42). Moreover, a direct measure of permeability surface area showed a > 30-fold greater permeability for the TG when compared to brain regions (43). In that study, anesthetized rats received continuous infusions of [51Cr]- Ethylenediaminetetraacetic acid (EDTA), after which plasma brain and TG tissue were analyzed in order to calculate the permeability-surface area product (PS) for [51Cr]-EDTA in each tissue sample in order to quantify degree of permeability (43). The slightly, but significantly, lower levels of IgG measured in the TG compared to spleen or dura may reflect the limited degree of protection afforded by the endoneurium (35).
Both the TG and highly vascularized dura lie outside the BBB and are rich in CGRP and CGRP receptors (44). Converging evidence suggests that although migraine is considered to be a centrally mediated disease, it may not be necessary for CGRP blockade to act centrally to alleviate migraine. The injection of a [11C]MK-4232 as a tracer for positron emission tomography showed displacement in several brain regions when either rhesus monkeys or human subjects were given high doses of the CGRP antagonist telcagepant (44). However, no displacement was seen when a clinically relevant oral dose of 140 mg was given. It was concluded that it was not likely necessary to block central CGRP receptors to show efficacy against migraine (45).
There are a few caveats to consider. One is that many studies that determine BBB permeability use markers such as inulin, albumen, EDTA or other small molecules. The IgG antibodies are at least an order of magnitude or more greater in weight than these compounds, and thus the permeability relative to IgGs may be overestimated. As the use of monoclonal antibodies as therapeutic agents is relatively new, there is not much information available on possible sex differences or species differences in their pharmacokinetics (46). In general, the behavior of therapeutic monoclonal antibodies can still be considered a class property of IgGs, since their behavior is similar to that of the endogenous counterpart IgG (46). Importantly, in the present study, the plasma/CSF ratios observed in the present study are in line with reported clinical ratios, as described above. There does not appear to be any clinically important sex differences in pharmacokinetics of monoclonal antibodies (47).
In summary, the present investigation shows the presence of galcanezumab in peripheral and central tissue within 24 hours of subcutaneous injection, which persists for over 168 hours. Both dura and TG show considerable uptake of galcanezumab, consistent with that observed in peripheral tissue and indicative of residing outside the BBB. There was a low level of access of galcanezumab into the CNS, which is consistent with literature values available for other IgG proteins. The distribution and time-course of uptake of galcanezumab was not different from that of the IgG control. Although the central levels of galcanezumab were relatively low, a central site of action for the observed clinical efficacy cannot be excluded.
Article highlights
Galcanezumab is found in all tissue with 24 hours of subcutaneous injection and persists for >168 hours. Less than 1% of plasma levels of galcanezumab access the CNS. The distribution of antibody into the dura mater and the trigeminal ganglia is more similar to that of a highly innervated peripheral tissue (i.e. spleen) than of brain tissue.
Footnotes
Acknowledgements
The authors thank Michael H. Ossipov and Teri Tucker of Syneos Health for their help with writing, editing, and formatting the manuscript. Eli Lilly and Company contracted Syneos Health for writing and editorial services.
Declaration of conflicting interests
The authors declared the following potential conflicts of interest with respect to the research, authorship, and/or publication of this article: KWJ, SMM, and MPJ are employees of Eli Lilly and Company and own stock in the company. VJW was employed by Eli Lilly and Company at the time the study was conducted.
Funding
The authors disclosed receipt of the following financial support for the research, authorship, and/or publication of this article: The trial was sponsored by Eli Lilly and Company.