
Abstract
Objectives
Several brain and spinal magnetic resonance imaging signs have been described in spontaneous intracranial hypotension. Their correlations are not fully studied. This study aimed to explore potential mechanisms underlying cerebral neuroimaging findings and to examine associations among spinal and brain magnetic resonance imaging signs.
Methods
We conducted a retrospective review of magnetic resonance myelography and brain magnetic resonance imaging records of patients with spontaneous intracranial hypotension. Categorical principal component analysis was employed to cluster brain neuroimaging findings. Spearman correlation was employed to analyze associations among different brain neuroimaging findings and between brain and spinal neuroimaging findings.
Results
In patients with spontaneous intracranial hypotension (n = 148), categorical principal component analysis of brain neuroimaging signs revealed two clusters: Cerebral venous dilation and brain descent. Among all brain magnetic resonance imaging signs examined, only midbrain-pons angle associated with anterior epidural cerebrospinal fluid collection length (surrogate spinal cerebrospinal fluid leak severity) (n = 148, Spearman’s ρ = −0.38, p < .001). Subgroup analyses showed that the association between midbrain-pons angle (within brain descent cluster) and spinal cerebrospinal fluid leak severity was presented in patients with convex margins of the transverse sinuses (n = 122, Spearman’s ρ = −0.43, p < .001), but not in patients without convex margins (n = 26, Spearman’s ρ = −0.19, p = .348). The association between severity of transverse sinus distension and spinal cerebrospinal fluid leak severity was only presented in patients without convex margins (n = 26, Spearman’s ρ = 0.52, p = .006).
Conclusion
This study indicates that there are two factors behind the brain neuroimaging findings in spontaneous intracranial hypotension: Cerebral venous dilation and brain descent. Certain brain neuroimaging signs correlate with spinal cerebrospinal fluid leakage severity, depending on different circumstances.
Keywords
Introduction
Spontaneous intracranial hypotension (SIH) results from cerebrospinal fluid (CSF) leakage at the spinal level (1,2,3). Several brain and spinal neuroimaging abnormalities have been described in association with SIH (2,4). Our recent study indicated that brain and spinal neuroimaging findings could be used as SIH diagnosis markers and prognosis predictors in SIH patients (5). However, one study reported a poor correlation between CSF pressure and brain neuroimaging signs in patients with SIH (6). Currently, the relationships between brain and spinal neuroimaging findings and the best brain neuroimaging markers to reflect the severity of spinal CSF leakage remain unknown.
The Monro-Kellie doctrine has been widely accepted as a credible explanation for many brain neuroimaging abnormalities (7) including diffuse pachymeningeal enhancement (4,8) and venous distension (9,10,11). In this context, blood volume tends to increase to compensate for decreased CSF volume (i.e. dural sinus engorgement) in patients with CSF leakage or hypovolemia, so long as intracranial volume remains constant (7). On the other hand, we found the narrowing of the midbrain-pons angle was associated with a poorer response to treatment of SIH (5). However, the underlying mechanism of this important neuroimaging finding is still unknown since it cannot be well explained by the Monro-Kellie doctrine (12). Savoiardo et al. proposed a hypothesis for the development of deformity of the diencephalon and midbrain: The stretching of the deep cerebral venous system causes obstruction of venous outflow, and the subsequent deep venous congestion is the reason for deformity of the diencephalon and midbrain (18).
The aims of this study were twofold. First, we explored the potential mechanisms underlying documented SIH-associated neuroimaging findings. Second, we sought to elucidate possible links between spinal leakage severity and brain neuroimaging abnormalities. We hypothesized that (a) those signs not attributable to the Monro-Kellie doctrine might be linked to another mechanism; and (b) brain neuroimaging signs would be associated with spinal CSF leakage severity.
Methods
Demographics and clinical profiles
The study cohort was involved originally in another previously published study (5). Briefly, consecutive patients with SIH who were admitted to the Neurology ward of Taipei Veterans General Hospital between 1 January 2007 and 1 July 2014 formed the cohort. Diagnoses were made according to the International Classification of Headache Disorders, second edition (ICHD-II) criteria for headache attributable to SIH (7.2.3) (13) except for criterion D (headache resolution within 72 hours of epidural blood patch [EBP]), because some patients’ headaches did not resolve within 72 hours. The onset-neuroimaging interval was recorded based on medical records, which was defined as the time interval between the onset date of the first symptom of SIH and the date of neuroimaging performance.
Brain neuroimaging studies
The brain MRI examination, both with and without administering intravenous contrast medium [gadopentetate dimeglumine (Gd) 0.1 mmol/kg body weight], was performed on a 1.5-T system to all patients with the same protocols. Brain images were obtained in the transverse plane with T1- and T2-weighted spin-echo sequences. The section thickness was 8 mm, with an acquisition matrix of 256 × 256. We recorded brain MRI signs as nominal or continuous variables (Figure 1). Nominal variables included convex margins of the transverse sinuses (also known as the venous distension sign) (9,10,11), subdural fluid collection (14,15,16), and diffuse pachymeningeal enhancement (4). The convex margins of the transverse sinuses (the venous distension sign) can be visualized on post-contrast T1-weighted sagittal view. In its normal condition, the transverse sinus normally has concave or straight borders on sagittal view. In patients with SIH, the convex margins of the transverse sinuses (defined as a convex bulging margin of the superior and inferior border of the mid-portion of the dominant transverse sinus on sagittal view) is based on previous studies (9,10,11). We also recorded the severity of midbrain-pons deformity as both continuous and nominal variables, where a midbrain-pons angle <40° was considered severe according to our previous study (5). Continuous variables included midbrain-pons angle (12), descent of the cerebral aqueduct (depicted as iter descent below the incisural line connecting the tuberculum sellae with the confluence of the vein of Galen into the straight sinus, in mm) (4,17,18), severity of transverse sinus venous distension, and severity of superior sagittal sinus venous distension. Transverse sinus distension severity was defined as the angle between the line tangential to the superior and inferior borders of the dominant mid-transverse sinus on sagittal images. Superior sagittal sinus venous distension severity was defined as the angle between the lines tangential to the bilateral border of the dominant superior sagittal sinus on coronal images.
The measurements of brain MRI findings. The T1-weighted gadolinium-enhanced coronal magnetic resonance imaging (MRI) of the brain revealed bilateral subdural collections (Panel A, arrows) and diffuse pachymeningeal enhancement (A, arrowheads). The severity of the superior sagittal sinus venous distension was defined as the angle between the lines tangential to the bilateral border of the dominant superior sagittal sinus on coronal images (Panel B, red lines). The severity of the descent of cerebral aqueduct was depicted as iter descent below the incisural line (mm). (Panel C, yellow line). The midbrain-pons angle was defined as the angle between the line tangential to the anterior margin of the midbrain and the line tangential to the superior margin of the pons on the sagittal midline of the MRI (Panel D). The normal transverse sinuses were concave of the superior and inferior border of the mid-portion of the dominant transverse sinus on sagittal images (Panel E-1 and E-2). The convex margins of the transverse sinuses were defined as convex bulging margin of the superior and inferior border of the mid-portion of the dominant transverse sinus on sagittal images (Panel F-1 and F-2). The severity of transverse sinus distension was defined as the angle between the line tangential to the superior and inferior borders of the dominant mid-transverse sinus on sagittal images (Panel G).
Spinal neuroimaging studies
Heavily T2-weighted non-contrast magnetic resonance myelography (MRM) was performed with a phased-array spine coil on a 1.5-T superconducting system (Signa HD or Signa Excite twin, GE Medical Systems, Milwaukee, Wisconsin) without intrathecal gadolinium, as described previously (5,19,20). According to the literature, the anteriorly (ventrally) located epidural CSF collection tends to be more prolonged and associated with neurological complications (21). Besides, our research showed the length of anterior epidural CSF collection could predict treatment outcomes (5). Therefore, in this study, we used it as a surrogate of the severity of spinal CSF leak. A whole vertebra as the smallest unit was used to quantitate the length of anterior epidural CSF collections (5,19,20,22). The software for analysis was SmartIris of Taiwan Electronic Data Processing Corp. All imaging findings were interpreted by an experienced neuroradiologist (Lirng JF) as in our previous studies (5,19,20,23).
Statistics
Means were reported with standard deviations and medians were reported with interquartile range. Dimension-reduction of brain MRI signs was performed by categorical principal component analysis (CATPCA) (24), which enables a variable set to be reduced into a smaller set of components that represents the relationship of the original variables. Original variables were reduced to a small set of principal components (Cronbach’s alpha >0.70 for each) amenable to two-dimensional plots. We used Spearman’s correlational analyses to examine potential associations between brain and spinal MRI signs. Bonferroni’s correction for multiple comparisons was applied in the primary analyses, including brain sign-brain sign associations (corrected for six pairwise comparisons: p = .05/6 tests = .0083), brain sign-spine sign associations (corrected for four pairwise comparisons; p = .05/4 tests = .0125), and subgroup analyses (corrected for four pairwise comparisons; p = .05/4 tests = .0125). All statistical analyses were conducted with IBM SPSS software (version 22.0).
Ethics
The study protocol was approved by the Institutional Review Board of Taipei Veterans General Hospital (2017-07-001AC#1).
Results
Patients
Demographics, clinical features, neuroimaging findings, and first-EBP response rate of our study participants (n = 148).

Associations between brain MRI signs
A CATPCA plot with the original variables, transformed variables, and loadings of the inter-relationships of categorical MRI variables is presented in Figure 2. The total variance in the transformed variable accounted for by the two dimensions was 75%. Two clusters were identified by the CATPCA. The first is a cluster of variables related to brain descent, reflecting strong correlations with midbrain-pons angle and subdural effusion. The second is a cluster of variables related to cerebral venous dilation, reflecting correlations between diffuse pachymeningeal enhancement and the convex margins of the transverse sinuses (the venous distension sign). Notably, midbrain-pons angle (a continuous variable) had a correlation with cerebral aqueduct descent (Spearman’s ρ = −0.24, p = .003, Table 2, in bold), but did not correlate significantly with the severity of transverse sinus venous distension (Spearman’s ρ = −0.12, p = .132) or severity of superior sagittal sinus venous distension (Spearman’s ρ = −0.05, p = .556). Transverse sinus venous distension severity, however, did exhibit a correlation with the severity of superior sagittal sinus venous distension (Spearman’s ρ = 0.25, p = .002, Table 2, in bold).
CATPCA loading plot. The CATPCA plot reveals two distinct clusters. One cluster, related to brain descent, reflects strong correlations with midbrain-pons angle and subdural effusion, which appear above zero on the Dimension 2 axis in the plot. The second cluster, related to cerebral venous dilation, reflects correlations with diffuse pachymeningeal enhancement and the venous distension sign, which appear below zero on the Dimension 2 axis in the plot. Association between brain descent-related brain MRI signs, cerebral venous dilation related brain MRI signs, and spinal MRI signs reported as Pearson’s r value (p values)*. Associations between brain MRI signs (above mid-table divide) were considered significant at Bonferroni-corrected threshold (corrected for six pairwise comparisons) of p = .05/6 tests = .0083. Associations between brain and spinal MRI signs (below mid-table divide) were considered significant at Bonferroni-corrected threshold (corrected for four pairwise comparisons) of p = .05/4 tests = .0125. Significant outcomes are highlighted in bold.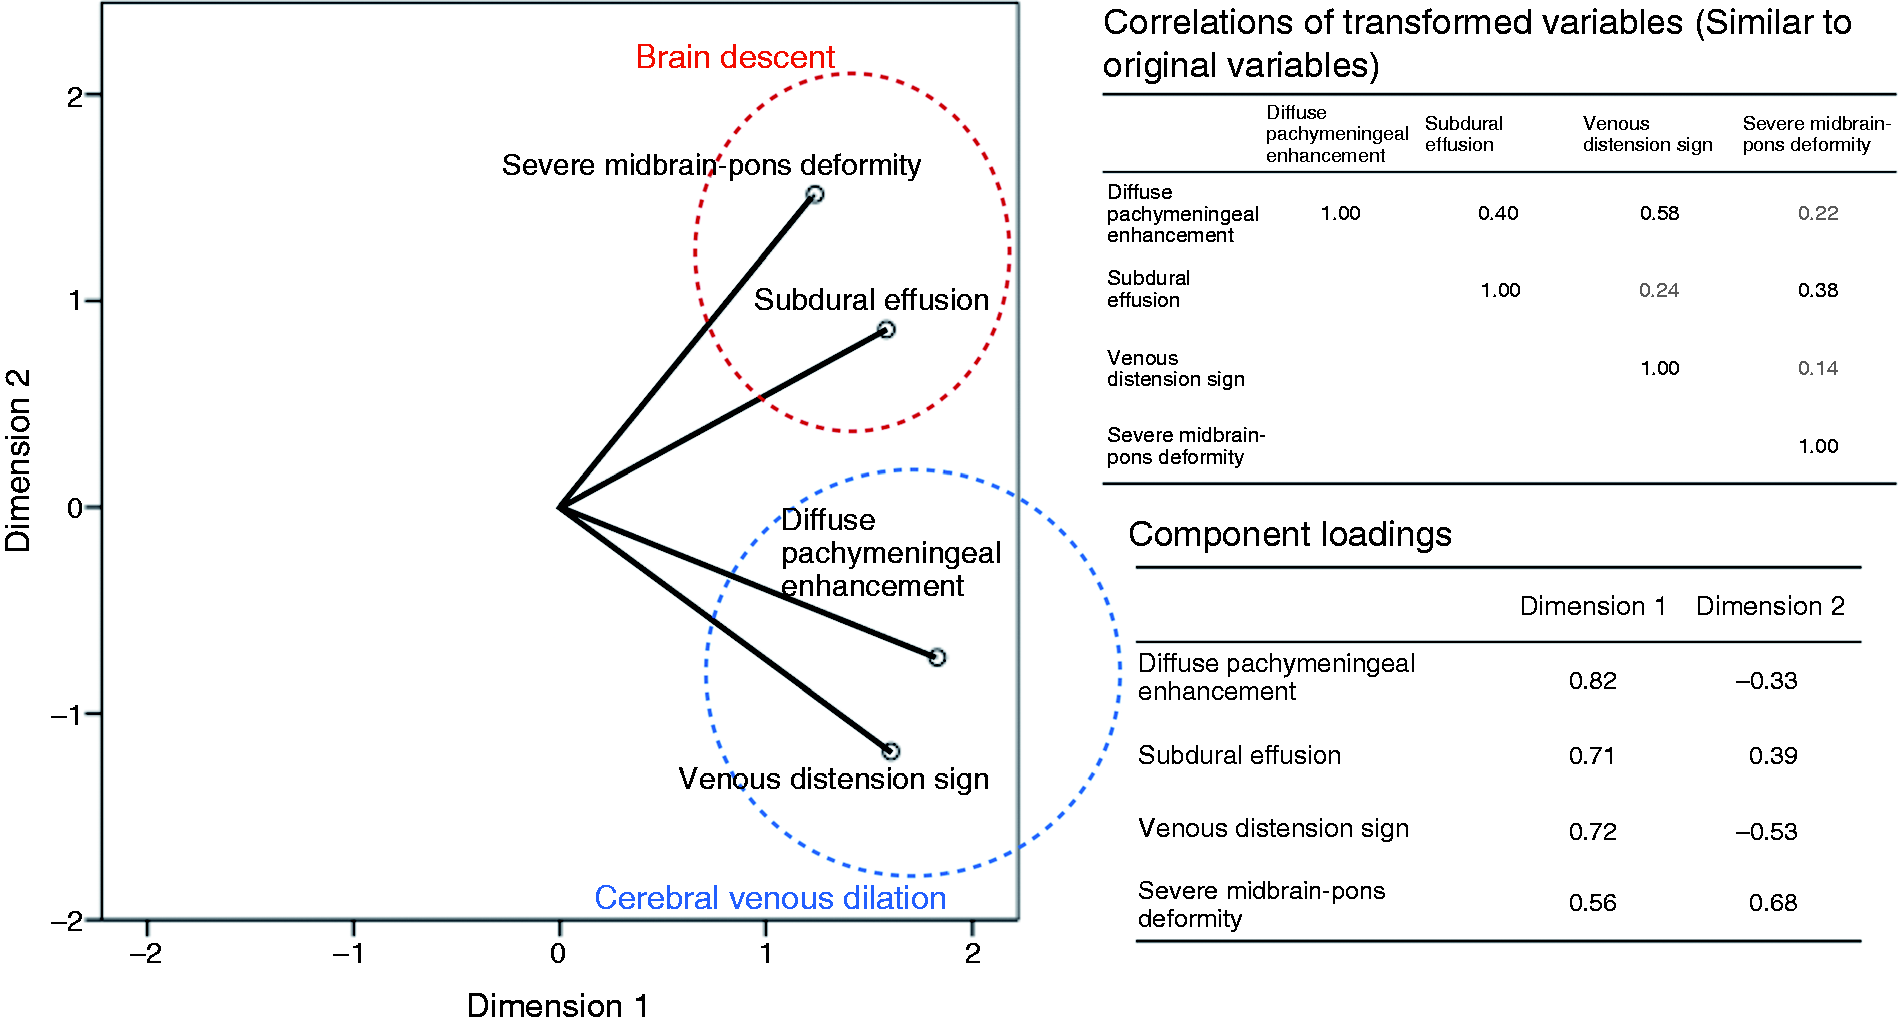

Associations between brain and spinal MRI signs
Subgroup analysis: Associations of brain MRI signs with the spinal MRI sign of anterior epidural CSF collection length (measured in number of vertebrae)*.

Associations between brain MRI signs and CSF collection length were considered significant at Bonferroni-corrected threshold (corrected for four pairwise comparisons) of p = .05/4 tests = .0125. Significant results are shown in bold.
Discussion
This study revealed two independent mechanisms as being related to SIH brain neuroimaging findings, namely cerebral venous dilation and brain descent (4,7,9,12,25,26). Using anterior epidural CSF collection length as an index of SIH severity (5), we further found that both cerebral venous dilation and brain descent were associated with the severity of spinal CSF leakage, but those associations emerged under distinct circumstances.
Elasticity of cerebral venous system limits application of the Monro-Kellie doctrine
The Monro-Kellie doctrine posits that a change in blood, brain, or CSF volume produces reciprocal changes in one or both of the other two volumes (7). Cerebral venous dilation is an early and important compensatory mechanism for CSF volume loss in patients with spinal CSF leaks (10). But in patients with maximal engorgement of the cerebral venous system (presence of the venous distension sign) under conditions of spinal CSF leakage (27), further dilation becomes less likely. This finding could be due to the elasticity limitations of the cerebral venous walls. Therefore, we propose that the association between spinal CSF leakage and cerebral venous dilation is only applicable in those whose cerebral veins have not reached this elasticity limit; that is, those in whom there is no venous distension sign (Figure 3).
A conceptual graph depicted the mechanisms to explain MRI findings related to CSF leakage in SIH. The graph pictured is a model of two independent mechanisms underlying SIH neuroimaging findings: Cerebral venous dilation (blue line) and brain descent (red line). Cerebral venous dilation is associated with spinal CSF leakage severity before the cerebral venous system reaches its elasticity limit. When cerebral venous dilation reaches its maximum, brain descent becomes the predominant spinal CSF leakage-related finding.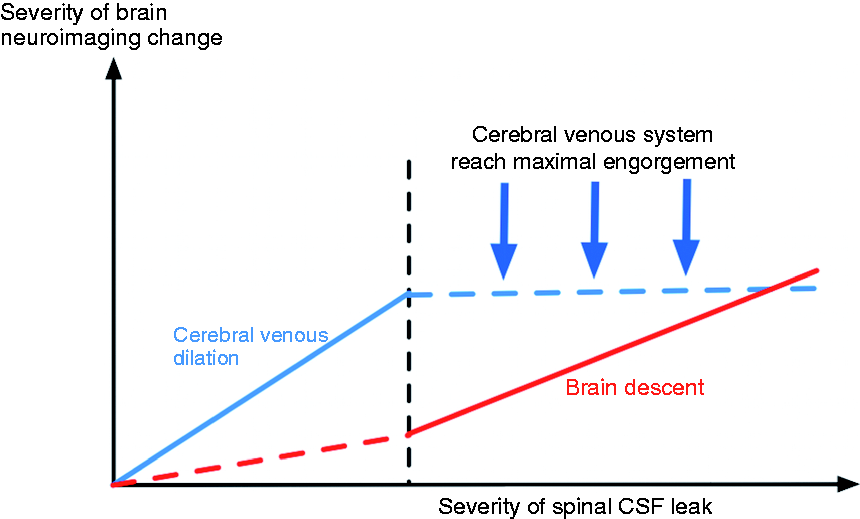
Brain descent and midbrain-pons deformity are SIH complications after cerebral venous dilation has reached its elasticity limit
Closure of the midbrain-pons angle, an indicator of midbrain-pons deformity (12), has been associated with a relatively poor response to EBP in SIH patients (5). Here, we found that the midbrain-pons deformity belonged to the brain descent mechanism, but not the cerebral venous dilation mechanism. Additionally, the midbrain-pons deformity was associated with a longer anterior epidural CSF collection, indicative of a more severe CSF hypovolemic state (5). This deformity became especially predominant when cerebral venous dilation reached its elasticity limits, as indicated by the presence of the venous distension sign (Figure 3) (27). Because the elasticity of the cerebral venous sinus is better than that of other brain structures (e.g. brain parenchyma, tentorium, and falx), structural brain deformation occurs after cerebral venous dilation has reached its limit. The brain descent mechanism can explain several neuroimaging findings that cannot be explained by the Monro-Kellie doctrine (27), including narrowing of the midbrain-pons angle and descent of the cerebral aqueduct.
Clinical implications
The present study suggests that the midbrain-pons angle can be used as an indicator of spinal CSF leakage severity, building upon our prior work demonstrating that the midbrain-pons angle can be used to predict EBP outcomes (5). Our findings suggest that the mechanism underlying closure of the midbrain-pons angle in SIH is related to brain descent rather than to the volumetric compensation described in the Monro-Kellie doctrine.
Limitations
This study has limitations. First, the cross-sectional study design was implemented without serial neuroimaging studies. Because of concerns about patients’ safety, the neuroimaging was performed as soon as possible, once the MR machine was available. Therefore, it was impossible to control the interval between symptom onset and neuroimaging in our patients. Furthermore, because most of the patients in this study benefitted from EBPs, our data should not be considered representative of the natural course of SIH-related changes. Therefore, caution is warranted in the interpretation of the progression of neuroimaging findings. Second, we did not measure CSF pressure directly. Rather, we used anterior epidural CSF collection length to represent spinal CSF leakage severity based on our previous study (5). The reliability of this surrogate of CSF leakage severity has not yet been scrutinized in the literature. Third, we used CATPCA rather than the commonly-used principal component analysis to delineate the components of different brain neuroimaging findings for SIH. This is because the two important findings, diffuse pachymeningeal enhancement and subdural fluid collection, are mainly categorical variables.
Conclusions
This study demonstrated associations between brain neuroimaging signs and spinal CSF leakage severity. Mechanistically, the observed neuroimaging changes were related to cerebral venous dilation and brain descent. Our findings are consistent with the Monro-Kellie doctrine providing an explanation of the main compensatory mechanism triggered by spinal CSF leakage before cerebral venous engorgement reaches its elasticity limit. Following maximal cerebral venous engorgement, however, spinal CSF leakage appears to lead to brain descent and subsequent midbrain-pons deformity.
Clinical implications
The brain neuroimaging changes in SIH patients were related to cerebral venous dilation and brain descent. The midbrain-pons angle can be used as an indicator of spinal CSF leakage severity, especially in patients with maximal cerebral venous engorgement. Before cerebral venous engorgement reaches its elasticity limit, the Monro-Kellie doctrine is the main compensatory mechanism triggered by spinal CSF leakage.
Footnotes
Author contributions
Jr-Wei Wu contributed to study conception and design, analysis and statistics of data, and drafting the manuscript. Yen-Feng Wang contributed to acquisition and analysis of data. Jong-Ling Fuh and Shih-Pin Chen contributed to acquisition of data and critical revision of the manuscript. Jiing-Feng Lirng interpreted all patient’s brain and spinal neuroimaging. Shu-Shya Hseu performed the epidural blood patch treatment for SIH patients and contributed to acquisition of data. Shuu-Jiun Wang contributed to acquisition of study funding, study conception, acquisition of data, and critical revision of the manuscript.
Acknowledgement
The authors thank Neuroradiologist Shu-Ting Chen for her help with data management.
Declaration of conflicting interests
The authors declared no potential conflicts of interest with respect to the research, authorship, and/or publication of this article.
Funding
The authors disclosed receipt of the following financial support for the research, authorship, and/or publication of this article: The study was supported in part by grants from the Brain Research Center of National Yang-Ming University from the Featured Areas Research Center Program within the framework of the Higher Education Sprout Project by the Ministry of Education in Taiwan and Taipei Veterans General Hospital [V106C-106, V105C-127], Ministry of Science and Technology of Taiwan [MOST 106-2321-B-010-009, MOST 106-2314-B-075-021].