
Abstract
Objective
To interpret questionnaire scores, clinicians and researchers need to know what change in score reflects a meaningful change in the condition of an individual patient, and what difference reflects a meaningful difference between groups. These values differ between different populations. We determined the within-person minimally important change (MIC) and the between-group minimally important difference (MID) of the Headache Impact Test-6 (HIT-6) questionnaire in a primary-care population of migraine patients.
Methods
We included 490 patients who participated in a clinical trial on the treatment of migraine in primary care. We compared their change scores on the HIT-6 questionnaire between baseline and at three-months follow-up with the answers to two anchor questions according to the ‘mean change approach’ and the ‘ROC curve approach’.
Results
The within-person MIC was estimated to be between −2.5 points (mean change approach) and −6 points (ROC curve approach). The choice for the within-person MIC value depends on the consequences of false positives and false negatives in a particular setting. The between-group MID was estimated at −1.5 points.
Conclusions
We determined the within-person MIC and between-group MID for the HIT-6 in a primary-care population of migraine patients. We recommend the use of these values for clinical care and for research.
Keywords
Introduction
The Headache Impact Test-6 (HIT-6) is a six-item questionnaire assessing headache severity and change in a patient’s clinical status over a short period of time. It was developed in 2003 in the United States (US) and has been translated into 27 languages (1,2). The questionnaire has adequate reliability and validity (3–7). The HIT-6 questionnaire is now widely used as a screening instrument to determine the severity of headache impact on a patient’s life, and as an outcome measure in headache trials (8–11).
To evaluate changes in HIT-6 scores, clinicians and researchers need to know what change in score reflects a meaningful change in the condition of an individual patient. This within-person ‘minimally important change’ (MIC) reflects the relevance of a change for a patient and is therefore not the same as a statistically significant change, or a minimally detectable change (12). Therefore, the within-person MIC is defined as ‘the smallest change in score in the construct to be measured, which patients perceive as important’ (12,13). Clinicians can use the within-person MIC to determine whether an individual patient’s condition has improved or has deteriorated. It can also be used to determine if a treatment is effective in a group of patients (e.g. for evaluation research) by comparing the proportion of patients that improves in the group that receives the treatment with the proportion of patients that improves in the group that did not receive the treatment (14,15). Another method for researchers to interpret differences between two groups of patients is to use the between-group ‘minimally important difference’ (MID). Unlike the MIC, this is not used for individuals but evaluates the difference in mean change scores of two groups that are followed over time, e.g. in a randomised trial. The between-group MID is ‘the smallest difference between scores of groups of patients that is considered important’ (16).
The within-person MIC and between-group MID can be assessed by two types of methods classified as ‘anchor-based’ and ‘distribution-based’ methods, respectively. In anchor-based methods an external criterion, the so-called ‘anchor’, is used to determine what patients (or their clinicians) consider important improvement or deterioration. In contrast, distribution-based methods are based on statistical characteristics of the sample (17). In general, anchor-based methods are preferred over distribution-based methods because anchor-based methods take into account the relevance of the measured change for the patient (13,18,19).
Recently, this journal published a study estimating the within-person MIC of the HIT-6 questionnaire in a (Dutch) primary-care population of patients with chronic tension-type headache; in that study a within-person MIC of −8 points was found (20). However, in a study by Coeytaux et al. investigating a secondary-care population with chronic daily headache, a within-person MIC of −3.7 points was found (21). These findings support the assumption that the within-person MIC of a specific questionnaire differs between different populations (17,22). Therefore, we need to determine the within-person MIC and the between-group MID in different populations and settings, and to compare the findings of these studies.
The within-person MIC and between-group MID of the HIT-6 have not yet been examined in a primary-care population of migraine patients. Therefore, because we have data on this specific population, we estimated these changes using two anchor-based approaches.
Methods
Participants
Data were obtained from migraine patients who participated in a randomised trial comparing a proactive approach of migraine patients by their general practitioner (GP) to usual care (11); this study was approved by the ethical committee of the Leiden University Medical Center. The patients were recruited in 64 general practices in Leiden and surroundings in the region of South-Holland in the Netherlands. Patients prescribed ≥ 2 triptans per month were selected from the electronic medical records. Because this was a pragmatic trial, in these patients the diagnosis of migraine headache was not made in accordance with the explicit International Headache Society (IHS) criteria.
After providing informed consent, 490 of 1072 patients (46%) enrolled in the trial. Participating patients did not differ from non-participating patients with regard to age, sex, triptan use, consultations for headache in the previous year, HIT-6 score and use of prophylactic medication (data not shown). The patients completed the questionnaire and a headache diary at baseline and after three, six and 12 months. For the present study on the within-person MIC and between-group MID of the HIT-6, the baseline measurement and the three-month follow-up data were used.
Measures
Headache Impact Test (HIT-6)
The HIT-6 questionnaire measures the severity of headache impact on a patient’s life. The six items are:
When you have headaches, how often is the pain severe? How often do headaches limit your ability to do usual daily activities, including household work, work, school, or social activities? When you have a headache, how often do you wish you could lie down? In the past 4 weeks, how often have you felt too tired to do work or daily activities because of your headaches? In the past 4 weeks, how often have you felt fed up or irritated because of your headaches? In the past 4 weeks, how often did headaches limit your ability to concentrate on work or daily activities?
Response options are (with corresponding relative weights in parentheses): never (6), rarely (8), sometimes (10), very often (11) and always (13). Headache impact on this scale ranges from 36 (no headache) to 78 (very severe headache) (1). Patients who did not complete the questionnaire were excluded. We calculated the change scores by subtracting the baseline values from the values at three months’ follow-up.
Anchor questions
At three months patients rated their change in headache severity compared to baseline. We used two different questions with five answering categories. To ensure comparability, the first question was the same question as that used by Coeytaux et al. (21). We added a second question asking specifically about limitation in daily activities, because the HIT-6 is developed to measure the severity of headache impact on daily life and our aim was to stay as close to the HIT-6 as possible.
Compared to three months ago, how is your headache condition? (a) Much better (b) Somewhat better (c) About the same (d) Somewhat worse (e) Much worse. Compared to three months ago, how often do headaches now limit your usual daily activities, including housework, work and/or social activities? (a) A lot less often now (b) Somewhat less often now (c) About the same (d) Somewhat more often now (d) A lot more often now.
Statistical analysis
Internal consistency
Before calculating the MIC and MID, we checked some measurement properties of the questionnaire in our study sample. First, we checked whether the questionnaire adequately distinguished between patients with different levels of severity of headache complaints by making a histogram of the HIT-6 change scores and checking whether this showed a normal distribution. We also verified that patients had enough room for improvement by calculating the proportion of patients with the highest and lowest possible score on the HIT-6 at baseline in order to explore possible ‘floor’ or ‘ceiling’ effects. Second, we performed a confirmatory factor analysis to check if the HIT-6 measures one construct, in this case ‘severity of headache impact’ (see Appendix 1 in Supplementary Material online), as was described by Kawata et al. (23). If a scale is not unidimensional, the within-person MIC and between-group MID value will be difficult to interpret. Third, we calculated item-total correlations (Pearson’s r) to examine if each item correlates sufficiently with the total score. The rule of thumb is that an item should correlate with the total score with a Pearson’s r above 0.20 (24). Fourth, we assessed the internal consistency of the HIT-6 by evaluating Cronbach’s α for the HIT-6 scores. The Cronbach’s α gives an indication of the correlation among the items in the scale. A value of ≥ 0.70 is considered to indicate good internal consistency, given that the scale is unidimensional (24,25).
MIC and MID
For the within-person MIC, we compared the changes in HIT-6 scores with the responses to the anchor questions. We first analysed the two treatment arms separately to verify if the results were interchangeable and thus generalisable to the whole cohort. Because no differences were found in the results between the two arms, we present the results for the whole sample as one cohort, without division into the two treatment arms. First, we assessed the correlation of the anchor questions and the HIT-6 change scores. The correlation indicates how well an instrument distinguishes between patients who (according to the anchor) are importantly improved or importantly deteriorated and those with no important change (26). Second, we determined the within-person MIC and between-group MID with two anchor-based methods. With the mean change approach the within-person MIC and the between-group MID were estimated. The ROC curve approach was used to generate an extra estimation of the within-person MIC. Third, we calculated the smallest detectable change (SDC) of the HIT-6 questionnaire. When a patient’s HIT-6 score decreased with a value higher than the SDC, a real change has occurred with 95% confidence (12).
The mean change approach. According to this approach, the within-person MIC is represented by the mean change in HIT-6 score of the group of patients that reported being ‘somewhat better’. The between-group MID is estimated by subtracting the mean change score in the group that reported to be ‘about the same’ from the mean change score of the group that reported to be ‘somewhat better’ (19). The ROC curve approach. For this approach we divided the patients into two groups. Patients who reported to be ‘much better’ or ‘somewhat better’ were considered to be ‘importantly improved’. Patients who reported to be ‘about the same’ were considered to be ‘not importantly changed’. We constructed an ROC curve to describe the performance of change scores of the HIT-6 in discriminating between patients who do or do not show important improvement. The area under the curve (AUC) was calculated as a measure of discrimination of change on the HIT-6. For each change score we summed the percentage of false-positive and false-negative findings ([1-sensitivity] + [1-specificity]). We estimated the optimal cut-off point by the change score for which the sum of percentages of false-positive and false-negative classifications was smallest (13). The SDC was calculated as 1.96 × (√2) × standard error of measurement (SEM) in the group of patients who reported to be ‘unchanged’ on the anchor. The SEM was calculated from the square root of the variance between the measurements and the error variance (√(VarError. + VarOccasion)).
Subgroup analyses
We performed subgroup analyses for gender and age to explore whether the MIC value differs between men and women, and between the different age groups. Six age groups were defined: i.e. < 35, 35–38, 39–42, 43–48, 49–54, > 55 years.
Results
Baseline characteristics of participants.

HIT-6: Headache Impact Test-6.
Missing values, item means and correlations of the HIT-6 questionnaire, (n = 397).

HIT-6: Headache Impact Test-6. aCorrelation of individual items with total score.
Measurement properties
The confirmatory factor analysis showed moderate evidence for the unidimensionality of the scale (see Appendix 1 in the Supplementary Material online). Item-total correlations were ≥ 0.56, thereby showing sufficient item internal consistency (Table 2). The HIT-6 showed adequate internal consistency (Cronbach’s α = 0.80).
Mean change approach
Total and mean change scores on the Headache Impact Test (HIT-6) of migraine patients according to their answer on the anchor questions.
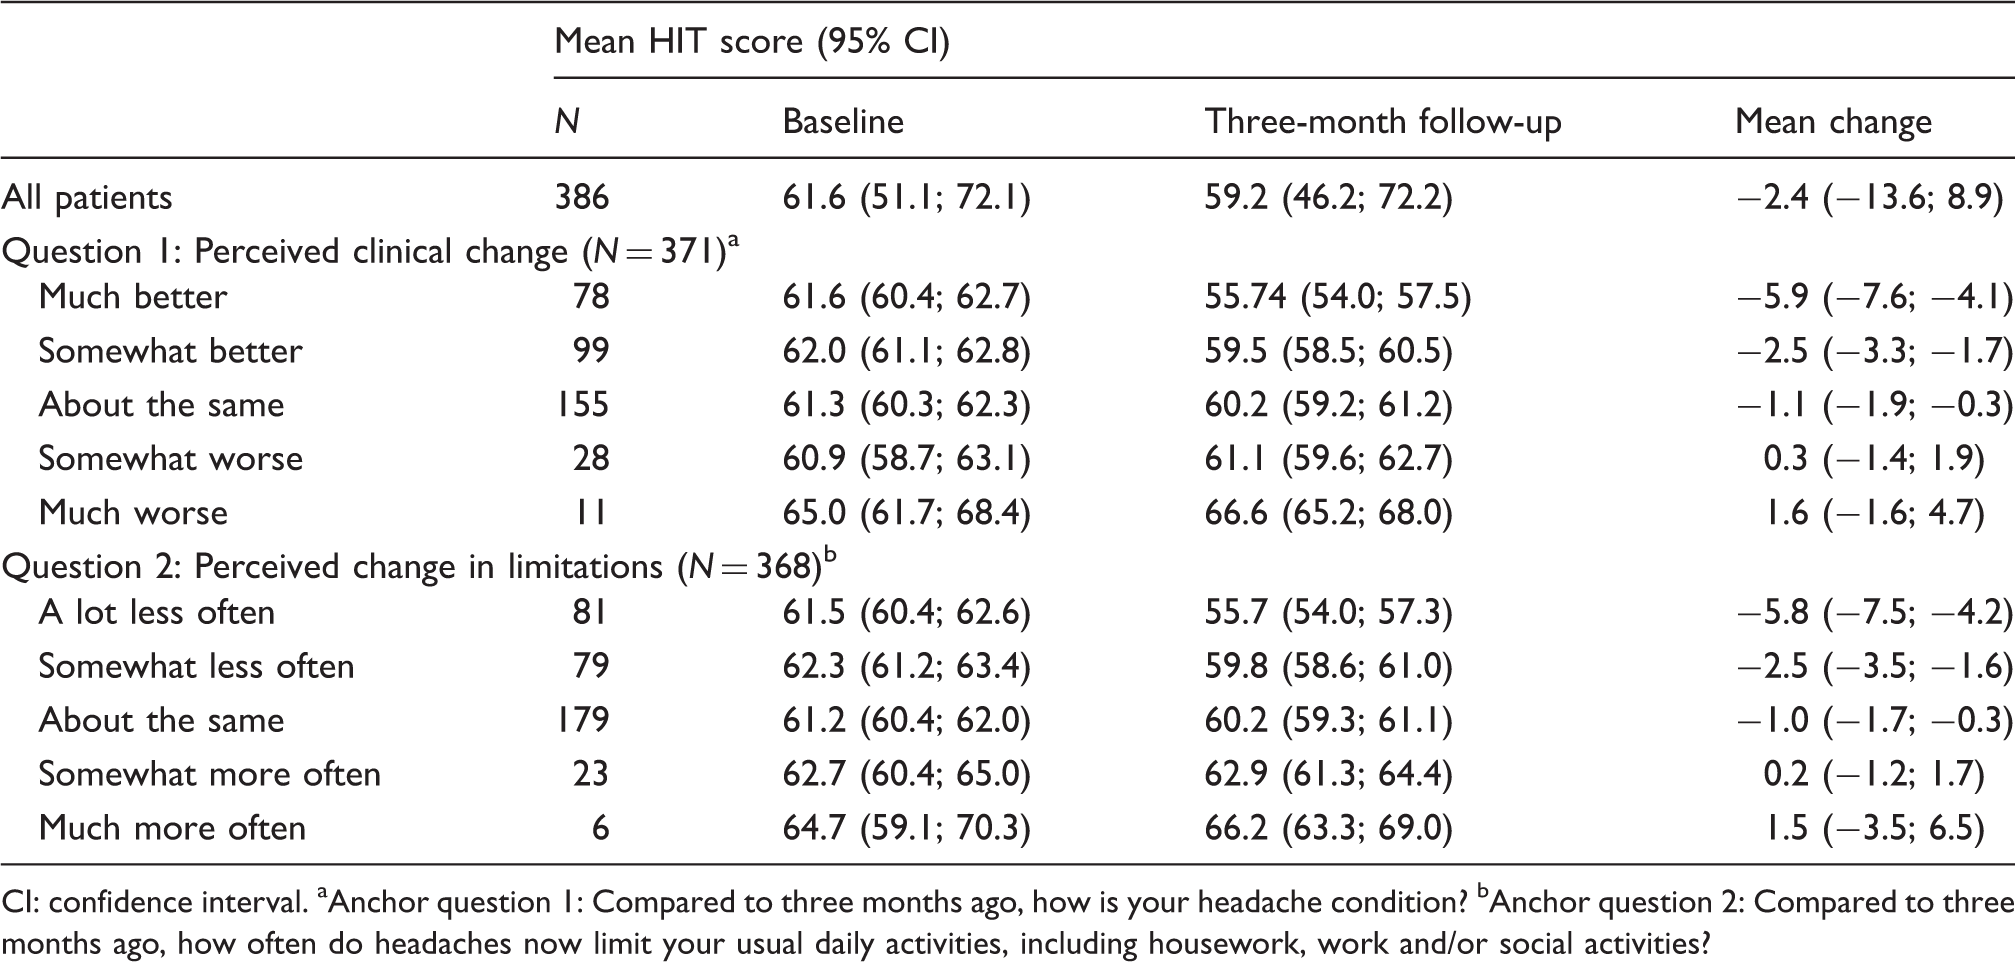
CI: confidence interval. aAnchor question 1: Compared to three months ago, how is your headache condition? bAnchor question 2: Compared to three months ago, how often do headaches now limit your usual daily activities, including housework, work and/or social activities?
ROC curve approach
Table 4 presents the sensitivity, specificity and misclassification for different cut-off points on the change score of the HIT-6. The Figure presents the accompanying ROC curve. The AUC was 0.63 (95% confidence interval (CI) 0.57–0.69). The cut-off point at which the sum of percentages of false-positive and false-negative classifications is smallest was −6 points, with a sensitivity of 36.7% and a specificity of 85.8% for the first anchor question. According to this method, the within-person MIC for the HIT-6 questionnaire is −6 points.
Receiver operating characteristic (ROC) curve for the various cut-off points for change on the Headache Impact Test (HIT-6) for anchor question 1.a Area under the curve: 0.63. Sensitivity, specificity and misclassification for different cut-off points on the change score of the HIT-6 for anchor question 1.a HIT-6: Headache Impact Test-6. Total number of patients who were ‘importantly improved’: n = 177. Total number of patients with no important change: n = 155. aAnchor question 1: Compared to three months ago, how is your headache condition?

For the second anchor question, the ROC curve approach resulted in a within-person MIC of –6 points, with a sensitivity of 38.1% and a specificity of 84.9% (data not shown).
SDC
The SEM in the 155 patients who reported to be ‘unchanged’ on the first anchor question was 3.5 The SDC was calculated at 9.6.
Subgroup analyses
The subgroup analysis for gender showed a within-group MIC value of –1 in men and –6 in women. Thus, the MIC value may be lower in men. However, the subgroup was too small to be able to draw firm conclusions (n = 45). The results for the different age groups were ambiguous. The MIC value for the age group 43–48 years was –6, whereas the values for the other age groups ranged from −1 to −2. We think this requires further exploration in future research.
Discussion
This is the first study to determine the within-person MIC and the between-group MID of the HIT-6 questionnaire in a sample of migraine patients in general practice. Knowledge on the clinical relevance of change scores on measurement instruments is important in both clinical care and research. We evaluated the properties of an instrument widely used in care and research, namely the HIT-6 questionnaire. We have determined the within-person MIC in a population of migraine patients in general practice using ≥ 2 triptans per month. The estimation of the within-person MIC varied depending on the statistical approach, namely −2.5 points for the mean change approach and –6 points for the ROC curve approach. The between-group MID was estimated at −1.5 points using the mean change approach. Compared to the total range of the HIT-6 (i.e. 42 points) a within-person MIC of –1.0 to −6 is relatively small. This may be a reason to use the higher value of the MIC, namely –6 points.
To ensure that a change score on an individual patient level is clinically important, and not just measurement error, the SDC score must not exceed the MIC change score. In our study, the SDC was larger (9.6 points) than the MIC (−2.5 to −6 points). An SDC of this magnitude (9.6 points represents 23% of the scale) is very common for patient-reported outcomes. This means that, if an individual patient has a change score as large as the MIC, we cannot be more than 95% certain that this change is not due to measurement error. Or, in other words, the risk of measurement error is larger than the conventional 5% (i.e. 23%–61%) (27). Therefore, for research it is advisable to use a relatively high MIC value (six or more points), to establish a convincing relevant treatment effect before introducing it into clinical practice.
In the factor analysis we found indications that the HIT-6 may consist of two dimensions. For this study, we chose to calculate the MIC for the whole scale because a two-factor model was not convincingly better than the one-factor model and because earlier research found the HIT-6 to be a unidimensional scale (23). However, we recommend further investigation into the dimensionality of the HIT-6.
A limitation of the study is the low sensitivity and specificity of the chosen ROC cut-off value. This is due to the low correlation of the anchor questions with the HIT-6 score (Spearman correlation 0.31 and 0.33, respectively). This indicates uncertainty in the determination of the MIC and MID values. An explanation for the low correlation in the present study could be a low validity of the anchor. However, the phrasing of the anchor questions and the phrasing of the HIT-6 questions were closely related. Another explanation could be that the responsiveness of the HIT-6 questionnaire is low in patients with episodic headaches. However, Kosinski et al. report that the responsiveness of the HIT-6 questionnaire is adequate (1).
A second limitation is that our patients were not diagnosed with migraine headache following the explicit IHS criteria because we used data from a pragmatic trial. However, the headache classification in the Dutch GP guideline on headache is derived from the IHS criteria (28). All patients who were included were prescribed triptans by their GP, so the probability of having migraine headaches was very high.
The values we found are similar to those found in research among patients with chronic daily headache in secondary care by Coeytaux et al. Those authors reported a between-group MID of –2.3 points whereas we found a between-group MID of –1.5 points. Coeytaux et al. reported a within-person MIC of −3.7 points whereas we found a within-person MIC of −2.5 to −6 points (21). However, our findings are different from those of Castien et al., who reported a within-person MIC of −8 points in patients with tension-type headache (20). Part of the difference may be explained by a difference in the classification of the patients who reported to be ‘somewhat better’. Coeytaux et al. considered patients who reported to be somewhat better as being clinically relevantly changed. Castien et al. made a different choice; they considered patients who reported to be somewhat better as not being changed. When designing our study we used the classification of Coeytaux et al. to enable comparison. Had we used the classification of Castien et al., the within-person MIC value would have been larger for the mean change approach, namely −5.9 points (see Table 3). However, the results for the ROC-curve approach would be the same, namely −6 points. Therefore, it seems that the outcome is dependent on the choice of the groups and, therefore, on whether one emphasises the ‘minimal’ aspect (Coeytaux et al.) or the ‘important’ aspect (Castien et al.) of the MIC. However, this does not explain all of the differences between the three studies.
Another part of the difference may be explained by the difference in study populations. It is suggested that a different within-person MIC will be found in different headache patient populations (22). A possible explanation for this is that different kinds of patients experience their headache differently, or that different kinds of headaches have a different impact on a patient’s life. It would be interesting to further explore these hypotheses in future studies.
To conclude, we estimated a between-group MID of the HIT-6 questionnaire in a group of migraine patients in primary care at –1.5 points. This value can be used to compare groups of migraine patients. For individuals, we estimated the within-person MIC at −2.5 to −6 points. The decision of whether to use the high or low end of the range for the MIC should be made based on the consequences of false positives and false negatives in a particular patient sample and setting (24). In research it is advisable to use a higher value, to establish a convincing relevant treatment effect before introducing it into clinical practice. In clinical practice lower values may be used.
The present study shows that it is important to evaluate measurement instruments for clinically relevant changes in different populations and for the types of headaches for which they are used. The study provides a good example for researchers and clinicians of how to approach this issue.
Clinical implications
The HIT-6 questionnaire is an often-used tool to measure headache impact in clinical practice and in research. The within-person minimal important change (MIC) and the between-group minimal important difference (MID) of this questionnaire differ between different populations and headache types. We found a within-person MIC of between −2.5 and −5.5 points and a between-group MID of −1.5 points in a primary-care population of migraine patients. These figures are helpful in the interpretation of research papers.
Author contributions
Study concept and design: Smelt, Assendelft, Terwee, Ferrari, Blom
Acquisition of data: Smelt, Assendelft, Blom
Analysis and interpretation: Smelt, Assendelft, Terwee, Blom
Critical revision of the manuscript for important intellectual content: Assendelft, Terwee, Ferrari
Study supervision: Blom
Footnotes
Funding
This research received no specific grant from any funding agency in the public, commercial, or not-for-profit sectors.
Conflict of interest
None declared.