
Abstract
Background
Flickering light has been shown to sensitize the migraine visual system at high stimulus contrast while elevating thresholds at low contrast. The present study employs a dichoptic psychophysical paradigm to ask whether the abnormal adaptation to flicker in migraine occurs before or after the binocular combination of inputs from the two eyes in the visual cortex.
Methods
Following adaptation to high contrast flicker presented to one eye only, flicker contrast increment thresholds were measured in each eye separately using dichoptic viewing.
Results
Modest interocular transfer of adaptation was seen in both migraine and control groups at low contrast. Sensitization at high contrast in migraine relative to control participants was seen in the adapted eye only, and an unanticipated threshold elevation occurred in the non-adapted eye. Migraineurs also showed significantly lower aversion thresholds to full field flicker than control participants, but aversion scores and increment thresholds were not correlated.
Conclusions
The results are simulated with a three-stage neural model of adaptation that points to strong adaptation at monocular sites prior to binocular combination, and weaker adaptation at the level of cortical binocular neurons. The sensitization at high contrast in migraine is proposed to result from stronger adaptation of inhibitory neurons, which act as a monocular normalization pool.
Introduction
The defining visual features of migraine are photophobia and, in a subpopulation of migraineurs, visual aura which typically precedes headache onset. Photophobia (light avoidance) is characterized by hypersensitivity or intolerance to light, such that moderate intensities are perceived as uncomfortable and even painful (1). Although most extreme during migraine episodes, photophobia may also afflict migraineurs between episodes. However, interictal visual discomfort has been reported to be linked not only to light intensity, but also to specific spatial and temporal properties of the visual input. In particular, spatial and temporal frequencies close to the peak of the human contrast sensitivity function (3–5 c/deg stripes and 10–20 Hz flicker) are most aversive (2–5). Flicker is particularly bothersome to individuals with migraine. A good illustration of this is driving through an avenue of trees at sunset when the sun falls directly behind the tree line. Although many find the flickering sunlight to be mildly irritating, migraineurs find this much more aversive (6). In a laboratory test of flicker aversion thresholds, we have repeatedly found that migraineurs choose to abort a flickering screen at lower contrasts than healthy controls who, in many cases, are not bothered at all by such a stimulus even at maximum contrast (5,7,8).
Most psychophysical work on flicker or temporal frequency has focused on detection thresholds – the minimum contrast that can be detected against a homogeneous field – and there are mixed results as to whether migraineurs differ from controls (9–11). However, it has long been clear that the problem for migraineurs comes principally from higher contrast stimuli, not from stimuli that are barely detectable. Moreover, an extensive electrophysiological literature has clearly indicated that it is repetitive stimulation, not a brief stimulus, that reveals the truly striking differences between migraineurs and individuals with no migraine history. Schoenen and his colleagues have long argued that migraineurs have a deficit in habituation that is revealed in the cortical pattern-reversal visual evoked potential (PR-VEP) during extended viewing of a high contrast phase-reversing checkerboard stimulus (12–14), but see Oelkers-Ax et al. (15). Whereas the amplitude of the PR-VEP decreases with repetitive stimulation in normal brain, presumably reflecting the adaptation of cortical neural networks, migraineurs show no reduction and, in fact, in some cases show potentiation. Although explored most extensively in vision, similar results have been reported in other sensory systems (16–19) suggesting a more global abnormality in sensory adaptation. Psychophysical findings of longer duration visual aftereffects following prolonged stimulation in migraineurs also point to abnormalities in the adaptation process (20,21).
In a recent psychophysical study, we examined adaptation to high contrast flicker and its effects on contrast sensitivity in migraineurs (8). The study systematically assessed absolute contrast threshold (the lowest contrast that can be detected) and contrast increment thresholds (the smallest discriminable difference between two above-threshold contrasts) over a range of contrasts from 10% to 70% before and after adaptation to a spatially uniform flickering stimulus. At absolute threshold, migraineurs and controls showed similar substantial threshold elevations following adaptation. Increment thresholds at low contrast showed a similar pattern, although migraineurs showed stronger adaptation than controls. Adaptation effects were minimal in control participants at high contrast, which is consistent with reports in the normal literature (22,23). In contrast, migraineurs showed increased contrast sensitivity (facilitation) following adaptation relative to their baseline thresholds for a high contrast target (8). This finding is superficially compatible with the VEP findings of abnormalities in adaptation or habituation. (We prefer the term adaptation to habituation because our psychophysical work has not demonstrated all the requirements for habitation as defined in a recent consensus paper on this topic (24). Specifically, weak stimuli do not elicit stronger adaptation effects than strong stimuli (8). However, we think it is likely that we are studying the same phenomenon addressed by Schoenen and colleagues in the PR-VEP studies.)
The PR-VEP responses reflect not only cortical activity (from a broad region of cortex) but also changes in the underlying input to that cortical source. Coppola and colleagues (25) have attempted to further dissect the VEP by looking only at gamma-band frequencies, and have reported that early gamma band waves show weak amplitude reduction over blocks (habituation) in both migraineurs and controls, whereas later gamma-band waves show increased amplitude over blocks (potentiation) in migraine groups only. The authors argue that the later waves may reflect intrinsic cortical activity, whereas the early waves might represent subcortical events. However, there is no direct evidence in the literature to support a subcortical source.
Like the PR-VEP, binocular visual psychophysics similarly reflects all the stages of processing from the eye to the brain level at which the decision process takes place, which could be well beyond early visual cortex. However, there is a way to address this problem psychophysically. It is well known that the visual pathway is segregated by eye until the level of the primary visual cortex (V1) and, in primates, even the input layers of V1 consist of monocularly activated neurons (26,27). Convergence of inputs from the two eyes onto a common set of neurons occurs only after this stage, in the upper and lower layers of V1 and in extrastriate cortex (26). Consequently, by using a stimulus paradigm in which different visual input can be presented simultaneously to the two eyes (dichoptic stimulation), it is possible to determine whether the critical adaptation process occurs prior to the level of binocular combination (either subcortically or in the input layer of V1) or alternatively, at or beyond the stage of initial binocular combination. The essence of this approach is that adaptation is induced through one eye alone while the second eye views a homogenous field, and post-adaptation effects are compared by presenting test stimuli to the adapted eye and the unadapted eye separately. If binocular neurons are adapted, one expects some degree of interocular transfer of the changes in threshold induced by the adaptation, and this should differ across the two groups. If, however, the site of the affected adaptation pool is prior to binocular combination, then activation of the binocular neurons via the non-adapted eye should show no evidence of adaptation (i.e. no threshold change). This is the logic we have followed in the present study, which repeats as closely as possible the conditions of our earlier work except that the stimulation is dichoptic rather than binocular. It should be noted that there is now evidence that some degree of contrast adaptation occurs at multiple stages in the visual pathway (28–32) contrary to earlier claims that this was a cortical phenomenon only (reviewed in Kohn (33)). Our results provide clear evidence that the level that is differentially affected in migraine is pre-binocular.
Methods
Participants
The study received ethics approval by the Human Participants Review Committee of York University, after which participants were recruited from the York University community through advertisements posted on campus. All participants provided written informed consent prior to participating in the study. Participants were screened based on an extensive structured interview, which included a detailed description of their headache symptoms in order to categorize them into the appropriate group using the International Headache Society criteria (34). Control participants were excluded if they had more than one mild non-migraine headache per month or a family history of migraine. Exclusionary criteria applied to both groups included cardiovascular disease, diabetes, psychiatric disorders, alcohol abuse or drug dependency, neurological disease (e.g. epilepsy, multiple sclerosis) and any visual abnormalities not corrected by optical lenses (e.g. amblyopia, glaucoma). Participants were also excluded if they were taking prophylactic medication for migraine or mood disorder. The control group (C) was matched as closely as possible to the migraine group (MIG) in age and gender. Our previous binocular study using a similar paradigm and stimuli revealed no difference between migraineurs with and without aura. For this reason, and because the demands of the present study made participant recruitment and retention difficult, we did not attempt to recruit separate groups with and without aura; both are included in the migraine group.
Visual screening was conducted on all participants to ensure that they were properly corrected. Monocular and binocular distance acuity and static contrast sensitivity for letter stimuli were tested on a Macintosh computer using the software program Stimuli™ Version 3.5 (Accommodata Corp, Cleveland, OH, USA). Stereovision was measured with the Stereo Fly (Stereo Optical Co. Inc., Chicago, IL, USA). Criterion levels were set at 20/20 acuity, contrast sensitivity of 2.4% in each eye, stereoacuity of 40 s of arc and no marked interocular difference in either corrected visual acuity or in refractive correction (anisometropia).
Stimuli
Visual images were presented on a 22 inch LaCie Electron 22 Blue IV™ display (LaCie Ltd, Toronto, ON, Canada) with a refresh rate of 120 Hz and resolution of 800 × 600 pixels. The mean luminance of the screen was 47 cd/m2. The stimuli were created and the experimental paradigm controlled using VPixx™ v2.20 software (VPixx Technologies Inc, St. Bruno, Quebec, Canada) on a Macintosh Macbook Pro™ computer driving a DATAPixx™ processor (VPixx Technologies Inc).
The test stimulus was a spot with blurred edges (Gaussian spatial luminance profile; σ = 0.5°); at high contrast, the visible diameter of this spot was approximately 2°. The adapting stimulus had visible diameter of approximately 4° or twice that of the test spot. Although the edges were again blurred, the adapter had a steeper luminance drop-off (achieved by using a higher-order Gaussian; see Figure 1, upper right inset). The size and luminance profile of the adapting stimulus were chosen to ensure that the area of the retina being tested was well adapted regardless of small involuntary eye movements. Both adaptor and test spot were modulated at 10 Hz (square wave) around the background screen luminance, such that the centre of the spot alternated between light and dark (Figure 1, upper right). Two test contrast levels were chosen (10% and 70%) based on results from our previous study using binocular adaptation (8), as these values had revealed the most prominent effect of adaptation on migraineurs and the most marked differences between healthy controls and migraineurs.
Time course of stimulus presentation during trials with the adapting stimulus. A threshold measurement began with 2 min of adaptation to high contrast square-wave flicker (white > black); each trial was preceded by an additional 2 s top-up of flicker adaptation. The pair of test stimuli (base and increment) were presented in random order separated by a 425 ms interstimulus interval (ISI). The fixation markers aided in fusion and accommodation. For baseline trials, pre-adapt and top-up intervals are replaced with a uniform grey screen. Top right inset: the two temporal phases of the adapting spot (upper panel) and the test spot (lower panel), both shown here at high contrast to illustrate their relative size and the relative steepness of their luminance gradients. Light and dark phases alternated at 10 Hz.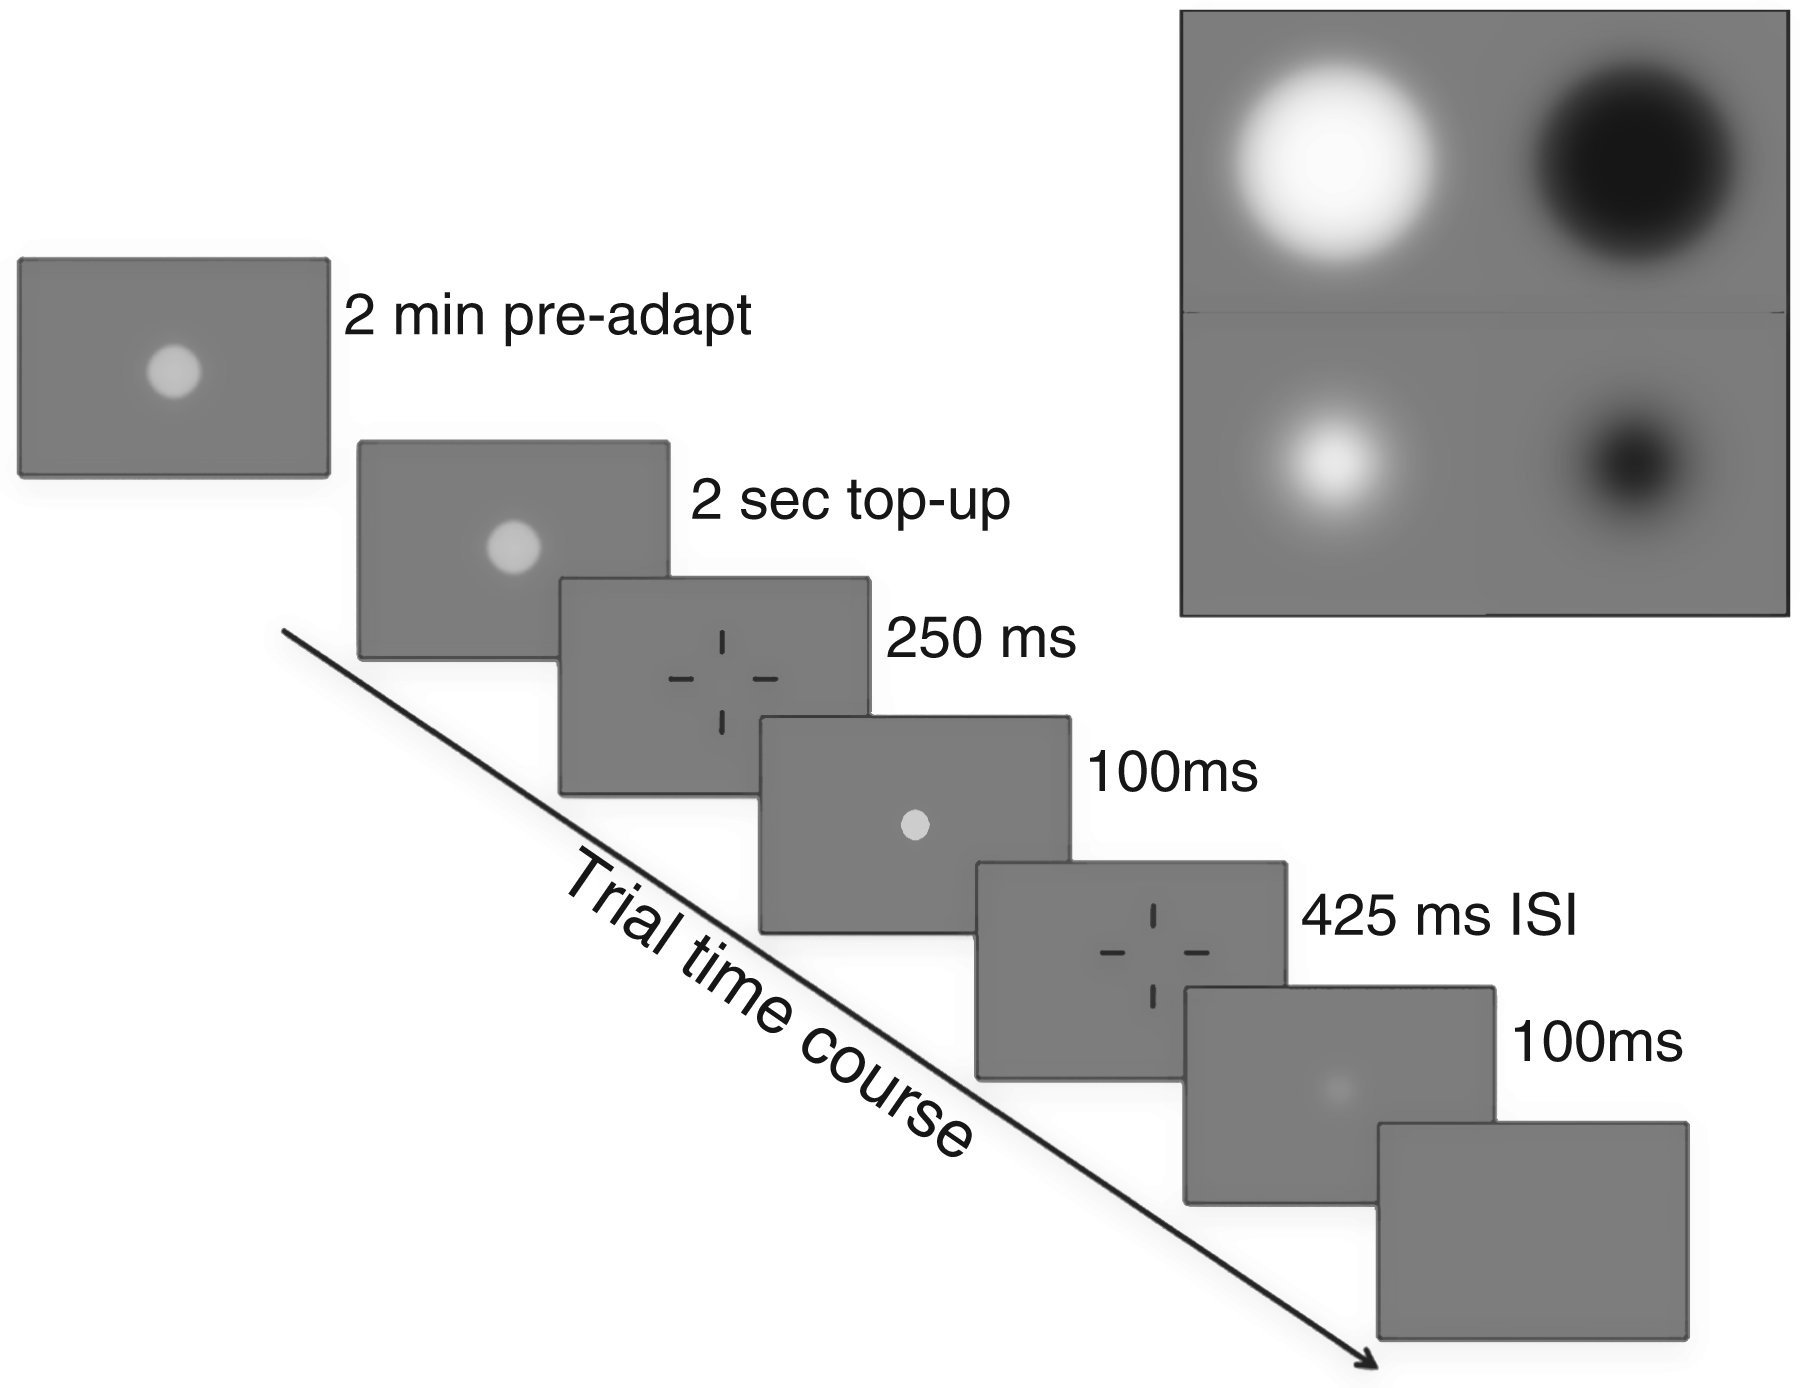
A Wheatstone stereoscope was used in order to superimpose the images presented on two halves of the CRT monitor onto corresponding areas of the two retinae (Figure 2). Two pairs of front-silvered mirrors were used to minimize distortion of the image. The image from the screen was reflected first onto a lateral pair of mirrors oriented at a 45° angle. An additional medial pair of mirrors, also placed at a 45° angle, reflected the image from the first pair of mirrors to corresponding regions of the subject’s retinae. The subjects were instructed to look straight ahead at the inner pair of mirrors. Four short lines on each half of the screen (above, below, left and right of the stimulus locations) were used to guide the participant in fusing the two images and correctly fixating the location at which the adaptor and test would appear. The images from the two sides of the screen were kept separate using a divider made of black non-reflective foam board; this ensured that no light was transferred from one side of the screen to the contralateral eye.
Diagram of the dichoptic stimulus setup. The central divider was a black foam board. The stimuli were presented on the two halves of the cathode ray tube (CRT) monitor, and were reflected onto the foveae of the two eyes via front-silvered mirrors placed at 45° angles to the screen and to the participant’s eyes.
The viewing distance (screen to lateral mirror to medial mirror to eye) was 114 cm. The experiment was conducted in a dark room and the entire apparatus was separated from the rest of the room using room dividers covered in black cloth to reduce any reflectance.
Procedure
Increment thresholds for 10% and 70% contrast were measured for each eye separately using a 2-interval temporal forced choice double staircase paradigm (Figure 1). Within a run, a single base contrast (10% or 70%) was employed, and the pair of test spots was presented to left or right eye at random across trials. This ensured that participants could not attend only to the eye being tested. The test spots were each presented for a single flicker cycle (12 frames: six light/six dark) and were separated by a 425 ms inter-stimulus interval (ISI). The fixation markers appeared in both eyes before and between the test spots to ensure fixation and fusion. During each trial, where one eye saw the two test spots, the second eye viewed a uniform grey screen matched to the time-averaged luminance of the spot. The participant was unaware of which eye was receiving the stimulus and which eye was viewing the uniform grey screen. Participants were instructed to indicate which test spot of the pair (first or second; see Figure 1) contained higher contrast flicker by pressing one of two keyboard buttons. Thresholds were measured using separate interleaved staircases for each eye and a 3-down 1-up tracking procedure, which tracks the 79% correct threshold (35). This means that three correct responses were required before the contrast was dropped by one step and only one incorrect response before contrast was increased by one step. Each run continued for either 12 reversals or until 200 trials were completed. Only the final eight reversals were used to calculate thresholds.
During baseline testing, the timing was matched to that of adaptation trials (see below and Figure 1). In place of a flickering adapting stimulus, a uniform grey screen was presented for the same amount of time as the adapting stimulus in the adaptation runs. This ensured that there was no unintended adaptation during baseline measurements due simply to running the test trials in close succession to one other.
Adaptation thresholds were measured by presenting the 10 Hz flickering adapting stimulus for 120 s to the right or left eye before testing began, and measuring thresholds for each eye separately using the same interleaved left and right eye trials described above. Throughout this paper, when a test trial occurs in the adapted eye, this is referred to as an ipsilateral (IPSI) trial and trials in which the stimulus is presented to the non-adapted eye are contralateral (CONTRA) trials. Before each trial, there was a top up phase where the adapting stimulus appeared for 2 s in the eye being adapted (Figure 1). This timing was matched in the baseline condition by having the participants view a uniform grey field for 2 s before each trial.
Each participant went through several training runs prior to data collection. The first was conducted binocularly using the computer and setup from our previous binocular experiment; all adaptation and test stimuli were viewed through both eyes. This allowed the participants to become familiar with the stimuli and the contrast judgments before introducing the mirror stereoscope setup. Participants were then trained using the dichoptic setup as described above and shown in Figure 2. For all training runs, participants were provided with feedback after every trial.
All three conditions (baseline, adapt right eye and adapt left eye) were completed four times for each contrast level (10% and 70%). During a session, participants would first complete the baseline conditions and then move on to the adaptation conditions. Baseline conditions never followed adapted conditions within a session. Adaptation runs were separated such that only one eye received the adapting stimuli on any given test day. Each participant required 6–8 hours of testing to complete the study. This was split into six to eight sessions of approximately 1 hour each. All testing was interictal, and every session was conducted a minimum of 4 days after the end of any migraine episode. Participant were also asked to notify us if a migraine episode occurred in the 4 days following any test session; no such reports were received.
At the end of the study, participants completed our standard flicker aversion task (7) to measure the visual discomfort induced by full field 10 Hz flicker at a wide range of contrasts. The test began with an 18° × 13° grey field (19 inch monitor at a viewing distance of 114 cm) at 0% contrast (mean luminance of 54 cd/m2). Contrast was increased in equal steps every 5 s up to 100% or until aborted by the participant when the pattern became aversive. The highest contrast level at which a full 5 s was completed without the participant aborting the task was recorded as the discomfort contrast threshold. This task was repeated five times and an average threshold was calculated based on the five replications.
Data analysis
All contrast increment threshold measurements were converted to log contrast values for all data analyses. Every measurement in the study was repeated four times. A common observation in psychophysics, even with highly practiced subjects, is that an occasional threshold measurement will appear to be an extreme outlier compared with the participant’s other data. As this cannot be detected and repeated in the limited time frame of a clinical study such as the present one, we developed a procedure for removing extreme outliers. These criteria are described fully for both baseline and adaptation data sets in Appendix 1. Following this procedure, 21 thresholds from the total data set of 624 measurements were eliminated (10 measurements from eight MIG participants and 11 measures from eight C participants; see Appendix 1 for details).
Following removal of anomalous data points, each participant’s log thresholds were averaged for each condition. All average scores were based on a minimum of three measurements. The group data sets were evaluated for normality using the Kolmogorov-Smirnov test, and for homogeneity of variance using Levine’s F test, and mixed (split-plot) ANOVA was then used to examine baseline thresholds and thresholds following adaptation to high contrast flicker as described below. The Greenhouse-Geisser correction for violation of sphericity was applied where relevant. All statistical analyses were conducted using SPSS statistical software using SPSS® statistical software (IBM Corporation, USA).
Each participant’s aversion threshold scores on the Flicker Aversion test were averaged across five trials and converted to a discomfort score using the formula: discomfort score = log (1/average aversion threshold) (8). This transforms the aversion thresholds to a discomfort scale on which 0 indicates no aversion or discomfort at all, 1 represents discomfort at 0.10 (10%) contrast and 2 would indicate a very high level of discomfort (0.01 (1%) contrast threshold). However, in the present study the lowest contrast tested was 10%.
Correlations were conducted to examine the relationships among subject variables (years with migraine, age at migraine onset, migraine frequency (episodes/year)) and scores on the Flicker Aversion test and the threshold elevation measures. Spearman’s ρ was used whenever one or both variables were not normally distributed as determined using the Kolmogorov-Smirnov test. Between-group comparisons on screening variables (e.g. visual acuity) were made with the non-parametric Mann-Whitney test.
Results
Participants
Summary of participant characteristics.

MA: migraine with aura; MO: migraine without aura; RE: refractive error; D: dioptres.
Of the 26 individuals who completed the study (see Table 1 for participant details), two (one C, one MIG) were also participants in our earlier binocular study (8); the rest were completely naïve to the task, although several had extensive psychophysical experience in other areas of vision research. Eight of the MIG participants were classified as migraine without aura (MO) and five, migraine with aura (MA). The gender distribution of the MIG and C groups was equivalent (11 females, two males per group), and the groups did not differ significantly in mean age (t22 = 0.96, p = 0.35). All participants were right handed. Right eye dominance, as assessed by the hole-in-the-card (Dolman) method, was seen in nine of 13 individuals in the MIG group and in 10 of 13 in the C group. There was no difference between MIG and C groups in monocular or binocular visual acuity or contrast sensitivity, or in refractive errors in either eye (p > 0.05 in each case). Ten participants in each group had corrected refractive errors in one or both eyes; three also had correction for astigmatism. No participants in either group showed an interocular difference of greater than one step on the acuity or contrast sensitivity tests. None had an interocular difference in refractive error of greater than 1.75 dioptres (spherical equivalent) before correction, and the groups did not differ on this measure (p > 0.05).
Preliminary analyses – baseline thresholds and eye dominance
Pre-adaptation sensitivity was compared across eyes and groups in a split-plot ANOVA with one between-group factor (MIG vs. C) and two within-group factors, each with two levels (eye: left vs. right; contrast: 10% vs. 70%). This analysis yielded a highly significant main effect of contrast, which will be discussed in the context of subsequent analyses, but no other statistically significant main effects or interactions. The MIG and C groups did not differ on the baseline measures (F1,24 = 1.02, p = 0.32). No differences between left and right eye were anticipated and none were found (F1,24 = 0.21, p = 0.65).
As it is possible that either baseline thresholds or adaptation effects might differ between dominant and non-dominant eyes, left and right eye scores were re-sorted into dominant eye and non-dominant eye scores for each participant and test condition. Separate 2 × 2 × 3 repeated measures ANOVAs were carried out for MIG and C groups with test eye (dominant vs. non-dominant), contrast (10% vs. 70%), and adaptation condition (baseline vs. IPSI adaptation vs. CONTRA adaptation) as within subject factors in each case. The main effect of test eye was not significant and no significant interactions between test eye and any of the other variables were found in either the MIG analysis or the C analysis, ruling out eye dominance as a confounding factor in this study.
Post-adaptation thresholds and threshold elevation scores
Because no main or interaction effects involving left versus right eye or dominant versus non-dominant eye were found, left and right eye baseline scores were averaged to yield a single baseline measure at each contrast. Post-adaptation scores were combined as follows. Threshold scores following ipsilateral adaptation were averaged (i.e. right eye scores following right eye adaptation were combined with left eye scores following left eye adaptation). Contralateral adaptation scores were combined in the same manner: left eye scores following right eye adaptation were combined with right eye scores after left eye adaptation to yield a single CONTRA adaptation score at each contrast. The individual participant data were then converted into threshold elevation scores by calculating the difference between baseline and IPSI post-adaptation thresholds and between baseline and CONTRA post-adaptation thresholds. (Because log values were used for all contrast increment thresholds, this difference of logs is equivalent to the ratio of adapted to unadapted thresholds.) Positive values on the threshold elevation scale indicate that adaptation to the high contrast test stimulus raised discrimination thresholds, whereas negative values indicate reduced thresholds or a facilitation of detection following adaptation. A score of zero indicates that adaptation exerted no change on thresholds.
The mean threshold elevations for the MIG and C groups for testing at 10% and 70% contrast with the eyes ipsilateral and contralateral to the adapted eye are illustrated in Figure 3. The data were analyzed statistically in a split-plot ANOVA with one between-group factor (MIG vs. C) and two within-group factors – adaptation condition (IPSI eye vs. CONTRA eye) and contrast (10% vs. 70%). The analysis revealed a significant main effect of contrast (F1,24 = 12.44, p < 0.002), a significant interaction between adaptation condition and contrast (F1,24 = 39.013, p < 0.0001) and a significant three-way interaction among group, adaptation condition and contrast (F1,24 = 4.313, p < 0.05). As can be seen in Figure 3, the nature of the interaction between eye tested and contrast is that at low contrast, threshold elevations are greater in the eye ipsilateral to adaptation than in the contralateral eye, whereas at 70% contrast this pattern reverses. However, the three-way interaction indicates that this effect is modulated by headache condition, so to further explore these effects and to test the hypotheses that drove this study we have conducted separate two-way split-plot ANOVAs for IPSI and CONTRA test conditions.
Threshold elevation scores for MIG (red) and C (blue) groups for testing with the eye ipsilateral (circles) and contralateral (squares) to the adapted eye. Error bars = 1 standard error. Threshold elevations below 0 indicate that thresholds were lowered (improved) by adaptation. The lines joining related groups/conditions at 10% and 70% contrast are provided only to aid the reader in visualizing the patterns of change. They should not be interpreted as indicating that threshold elevation measurements made at intermediate base contrasts would be predicted to yield either a smooth linear or a smooth logarithmic relationship with contrast as this remains an empirical question.
The analysis limited to the IPSI eye revealed both a significant main effect of contrast and a significant interaction between contrast and group. Post hoc tests confirmed what is evident in Figure 3. At low contrast, threshold elevations are high in both groups, and do not differ between groups (t23 = 0.378, p = 0.71); at high contrast, threshold elevations in the IPSI eye fall significantly in both groups (MIG: p = 0.0001; C: p = 0.02) but the fall is steeper in the migraine group, with the consequence that at 70% contrast, the groups differ significantly (t23 = –2.969, p = 0.007). In fact, at 70%, the change in threshold in the MIG group is a facilitation rather than an elevation. This pattern of threshold changes following adaptation replicates the pattern reported for binocular data in our earlier study (8).
For the CONTRA eye analysis, there were no significant main effects or interactions. In other words, threshold elevations were not statistically distinguishable at high versus low contrast, and the tendency for the MIG group to show smaller elevations than C in the CONTRA eye (see Figure 3) was not statistically significant. The critical question that drove this study was whether the adaptation seen in the adapted (IPSI) eye was also evident in the unadapted (CONTRA) eye, indicating interocular transfer at the cortical level via binocularly driven neurons. To answer this question, CONTRA scores for the combined groups were compared to 0 using single sample t-tests (a score of 0 would indicate that post-adaptation scores were identical to pre-adaptation baseline). CONTRA scores were found to differ significantly from 0 at both contrast levels (10%: t25 = 5.02, p = <0.001; 70%: t25 = 3.21, p = 0.004).
Flicker aversion results
The flicker aversion data are shown in Figure 4, where a score of 0 indicates that a participant showed no aversion (did not abort the stimulus before it reached 100% contrast). The median aversion score in the MIG group was 0.49, whereas in the C group the median was 0. The majority of the C group (8/13) showed no aversion even for the highest contrast of flicker and two additional C participants showed very minimal aversion, whereas only two in the MIG group failed to show aversion. The proportion of participants showing flicker aversion was significantly higher for MIG than for C (Fisher’s exact probability (1-tailed) = 0.02). For the MIG group, correlations between flicker aversion scores and performance on the increment threshold task were examined using Spearman’s ρ for ranked data; flicker aversion scores did not show a significant correlation with any of the threshold elevation measures (p > 0.05 in all cases). The C group did not contain enough variation in flicker aversion to allow meaningful assessment of correlations.
Individual participant Flicker Aversion Scores. Stars represent the group medians. A score of 0 indicates that the participant did not abort the flickering stimulus at 100% contrast. The individual with the highest score in the Migraine group, indicated by +, aborted the stimulus in less than 5 s at the lowest contrast step (10%) on every trial, so we arbitrarily represent her score as 1.3 (5% contrast) on the graph.
Correlations with subject factors
For the MIG group, years with migraine, age at migraine onset, and migraine episode frequency were each tested for correlations (Spearman’s ρ) with each measure of contrast threshold elevation and with the flicker aversion scores. None of these correlations approached statistical significance (p > 0.05 in all cases).
Migraine with (MA) versus migraine without aura (MO)
For reasons described earlier, we did not attempt to recruit separate MO and MA groups, and the number in each subgroup of our MIG sample (eight MO, five MA) is small. However, we did examine the data for MA and MO separately to make certain there was no consistent pattern of differences between the subgroups. All test data sets were compared with unpaired t-tests, and no significant differences between MA and MO were found (t11 = 0.20–0.99; p = 0.34–0.88). When the MIG threshold elevation data were subdivided by MA/MO category, the IPSI and CONTRA functions for the two migraine groups were identical in slope to the combined MIG data sets in Figure 3, and only slightly separated in absolute value on the ordinate. Although statistical tests lack the power to detect small differences between groups of this size, it is clear that the overall pattern of results differentiating MIG from C fairly reflects the performance of the two subgroups of migraineurs in our sample.
Discussion
There is substantial evidence in the literature that neural processing following repetitive sensory stimulation is abnormal in migraine (reviewed in Schoenen et al. (36) and Coppola et al. (37)). The present results add to this conclusion in the following three ways. Firstly, we have replicated our earlier finding in migraineurs that adapting to high contrast visual flicker leads to elevated thresholds for discriminating among low contrast flickering targets, but reduced thresholds or facilitation for discriminating among high contrast flickering targets. The high contrast facilitation is seen only in migraineurs, whereas both migraine and control groups show the low contrast threshold elevation. Secondly, by using a dichoptic paradigm presenting the adapting and test stimuli to the same or different eyes as shown in Figure 2, we have demonstrated that the facilitation at high contrast in migraine is limited to the adapted eye. Thirdly, the observation that the direction of the high contrast threshold change (reduction vs. elevation) is opposite in the two eyes of migraineurs argues that these results cannot reflect just a single adaptation site at the level of cortical binocular neurons.
Models of cortical and subcortical adaptation
Adaptation was originally conceptualized as neural fatigue or unavoidable weakening of response strength following prolonged activation. Although a reduction in response (reduced response gain) does occur, adaptation may also entail a recalibration of the response to better match the stimulus conditions (contrast gain change). Intuitively, the idea here is that when the environment contains very little luminance contrast (everything is shades of grey) high sensitivity to small differences is advantageous even if this would lead to neural saturation at very high contrast, preventing fine discrimination among high contrasts. Conversely, when the environment contains a wide range of contrast including very high contrasts, sensitivity to very low contrast is sacrificed in order to optimize discrimination among the high contrasts present in the scene.
Visual adaptation involves both response gain changes and contrast gain changes and these occur at multiple levels in the visual system and on multiple time scales (see Kohn (33) for review). In the primate retina and lateral geniculate nucleus (LGN) of the thalamus, adaptation is strongest in the magnocellular system (29), which is tuned to high temporal and low spatial frequency (38). Both the adapting and test stimuli in the present study would be expected to preferentially stimulate the magnocellular pathway, so pre-cortical adaptation would be likely to occur in our paradigm. At the cortical level, adaptation generally shows marked specificity for stimulus conditions (orientation, spatial frequency, direction) (32,39–42).
Implications of threshold elevation findings for localizing adaptation sites
Our contrast discrimination results with low contrast test stimuli are consistent with the predictions of a model entailing adaptation at the site of cortical binocular convergence (strong threshold elevation in the adapted eye; weaker threshold elevation in the non-adapted eye in both groups – see Figure 3, 10% contrast). However, this simple one-stage adaptation model cannot explain the findings with high contrast test stimuli. As a group, migraineurs showed threshold reduction (facilitation) in the adapted eye, and threshold elevation in the non-adapted eye (Figure 3, 70% contrast). The control group showed strong threshold elevation in the non-adapted eye, and weaker threshold elevation in the adapted eye (Figure 3, 70%). Neither pattern is consistent with interocular transfer of an effect mediated entirely at the level of binocular convergence. Such a model would predict effects in the same direction in both eyes, and effects of equivalent strengths in both eyes or weaker in the non-adapted eye (if performance is mediated by both monocularly and binocularly activated neurons).
In Appendix 2, we describe a neural network model that can encompass all the present findings. The critical features of the model are the following. There is strong adaptation (response reduction) at one or more sites early in the visual pathway where neuronal activation is purely monocular (i.e. retina, LGN or layer 4 of striate cortex). This will affect test performance only through the adapted eye. These excitatory neurons in turn bring about more modest adaptation of the binocular cortical neurons that they directly or indirectly drive. This second level of weaker binocular adaptation will be reflected in test performance through both the adapted and the non-adapted eye. Thirdly and critically, the model postulates strong adaptation of a network of inhibitory neurons that pool inputs from excitatory neurons with a wide range of stimulus properties, all derived from a single eye. This monocular inhibitory pool modulates the excitability of binocular neurons in the cortex, exerting a divisive normalization based on a pooling of contrast levels present in the local image region. Reducing the strength of this inhibition through adaptation will lead to enhanced excitability of the binocular cortical neurons at high contrast (a shift in contrast gain) via disinhibition. Provided there are separate normalization pools for inputs from the two eyes, which is a necessary condition to fit the present data, the release from inhibition which results from adapting the inhibitory neurons will also be seen only for tests presented through the adapted eye. Test stimuli presented through the non-adapted eye will be processed through non-adapted early excitatory and normalization-pool inhibitory circuits, and only at the level of the shared binocular neurons will the effects of adaptation be manifest. Details of the model, including fits based on group and individual participant data are fully described in Appendix 2. The model fit to the group data indicates considerably stronger adaptation in the migraine group than in the control group, especially at the two monocular sites. However, in an analysis of the variance in model parameters fit to the individual data, this difference reached statistical significance only for the inhibitory normalization pool suggesting that the most important abnormality in adaptation in migraine lies here (see Appendix 2 for details).
The early monocular adaptation we postulate could occur in the LGN, at the geniculo-cortical synapse, or in monocular target neurons in layer 4 of V1, or at any combination of these sites. Although inhibitory feed-forward architecture exists in both the LGN (43) and the cortex (44, 45), inhibitory neurons do not project through the optic tract, so the normalization pool affecting binocular cortical neurons must lie within the cortex.
It is important to note that we are not proposing inhibition as the mechanism of adaptation. Neuronal adaptation is generally thought to arise either through changes in synaptic efficacy (e.g. long-term depression (46)) or through intra-cellular changes affecting the membrane potential (e.g. increased membrane hyperpolarization (47,48); see Kohn (33) for review). Our data do not speak to which of these occurs in the present context. The point is that these same adaptation processes can affect both excitatory and inhibitory neurons, but when adaptation occurs in inhibitory circuits it has the net effect of increasing the excitability of the cells that were being inhibited.
Relationship to visual evoked potential studies
The present study was motivated by the numerous reports of abnormal habituation of cortical evoked responses to stimulation in the visual (12–14,25,49), auditory (16,18) and somatosensory (19,50) pathways, as well as abnormal habituation of the blink response (17). In all cases, although control groups show a diminution of the response over time, migraineurs show little change, and in some cases show an enhanced response relative to their own baseline. Our data show that a release of cortical neurons from inhibition due to rapid adaptation of inhibitory circuits could certainly explain such an effect. Our model is also generally consistent with a recent VEP gamma-band analysis of visual habituation in migraine. Coppola et al. (25) reported reduced amplitude early components, attributed to the geniculo-cortical input, in both migraine and control groups, but response enhancement in migraineurs in the later components, which they attributed to differences in intracortical processing.
The apparent electrophysiological response potentiation shown by migraineurs is only relative to their own baseline responses, which are typically of lower amplitude than those of the relevant control groups (51,52). Schoenen has described this initial condition as ‘reduced cortical pre-activation’ (53) and attributes it to abnormally weak interictal modulation of the cortex by brainstem serotonin in individuals with migraine (36,51,52). Indeed, the very heavy innervation of layer 4 of visual cortex by serotonergic terminals (54,55) provides anatomical support for such an argument. As we saw no differences in baseline increment thresholds in this study or in absolute thresholds in our previous study (8), we did not build any initial disadvantage (e.g. lower response gain) into our model of the migraine pathway.
Serotonin is known to modulate the synaptic activity of both glutamatergic and gamma-aminobutyric acid (GABA)-ergic synapses at many levels of the brain including both the thalamus and the neocortex (56) and, in fact, 5-hydroxytryptamine (HT)1B and 5HT2A agonists have been shown to exert complex and complementary effects in V1 that vary in direction in an activity-dependent fashion (55). Thus, the stronger adaptation of GABA-ergic neurons we are proposing could be one consequence of a disruption of the normal balance among these various modulatory effects of serotonin. Our findings require a convergence at the level of binocular cortical neurons of two pathways with opposing effects, the relative strengths of which differ in migraineurs and controls. In this respect, our model is similar in spirit to a model proposed by Thomas and colleagues (57) to explain the migraine habituation abnormality, which pits habituation against potentiation at a final output stage.
In comparing our results to the habituation literature, it is important to note that the stimuli in PR-VEP studies differ from the present stimuli in several important respects. Firstly, they all involve checkerboard patterns, which have sharp edges and square sizes ranging from 8 to 80 min of arc in different studies (see Table 6 of Sand and Vingen (58) for summary); hence they contain a spectrum of much higher spatial frequencies than the present stimulus. The small checks, in particular, are likely a better stimulus for the parvocellular pathway and orientation-tuned cortical neurons than the spots used in our study. Secondly, the pattern reversal rate used in the typical PR-VEP study is 1–3 Hz (58), whereas our stimulus flickered at 10 Hz. Again, the parvocellular system may make some contribution to detection of low frequency luminance modulation, whereas the magnocellular system dominates at 10 Hz (59,60). Finally, the PR-VEP reflects the activity of all cortical layers and likely also regions beyond the striate cortex, and therefore reflects many neural networks that may not be tapped by our psychophysical task.
Flicker sensitivity versus flicker aversion
The present study once again confirms previous measures from our lab (5,7,8) that flicker is a strongly aversive stimulus to individuals with migraine. Although nearly all migraine and very few control participants showed aversion responses on our task, we did not find a significant correlation between the aversion thresholds and the contrast increment thresholds among migraineurs. This replicates the finding in our previous binocular study despite minimal overlap in our research participants. Recent work (61) has suggested that photophobia may involve a subcortical pathway arising from the population of intrinsically photosensitive melanopsin-containing ganglion cells recently identified in mammalian retina (62,63). Although highly speculative at this point, it is possible that the affective response to flicker is mediated through this pathway, while the perceptual response is mediated through the geniculo-cortical pathway and that the two are not tightly coupled. However, it is important to note that a difficulty we have encountered both in the present study and in our earlier binocular work is that some migraineurs were too sensitive to the aversive effects of flicker to participate in the studies because of the risk of triggering a migraine headache. Therefore, it is possible that our samples do not cover a large enough range of flicker sensitivity to reveal a significant correlation between the aversion and threshold measures.
Limitations and issues for future study
The present study was designed specifically to examine the effects of flickering light on the migraine visual pathway. In the everyday experience of migraineurs, the flicker encountered usually affects a large part of the visual field (flickering computer screens, overhead lights flickering, sunlight in trees). Our contrast increment threshold measurements required prolonged testing and for that reason we were constrained to using small spot stimuli. Although we have no reason to believe that our findings are specific to very local areas of flicker stimulation, we cannot be certain that full-field stimulation would produce identical results. In a similar vein, although the present study found no baseline threshold differences between groups prior to adaptation with our foveal stimulus, it is possible that differences might be seen more peripherally in the visual field as abnormalities in contrast discrimination thresholds have been reported peripherally but not foveally in some studies (64,65). Finally, our migraine participants were recruited from the general university population rather than through a specialized migraine clinic and therefore may represent the milder end of the spectrum of migraine severity. However, it is not clear that more severely affected individuals would have been able to complete the study due to their frequent inability to tolerate flicker.
Finally, our results point to the need for caution in two areas. In trying to identify differences between behavioural, electrophysiological or imaging studies that do show abnormalities in migraine and those that do not, it is critical to ask whether the paradigms allow for significant adaptation during the course of experimental sessions. It may be that unintended adaptation underlies some of the differences in the literature, especially in studies assessing inhibition in migraine. The second issue concerns monocular versus binocular testing. In our dichoptic condition, the eye that is not receiving the test stimulus at any given moment is viewing a homogenous field equal in mean luminance to the time-averaged luminance of the test flash. In many studies of migraine vision, for reasons often not stated, testing is monocular. It potentially makes a considerable difference whether the occluded eye is patched with an opaque patch (and is hence undergoing dark adaptation) or is maintained at the same mean illumination level as the tested eye, either with a translucent patch or via dichoptic stimulation. Recent studies of patching in psychophysics (66) and perimetry (67) and of light deprivation in migraine (68), indicate that darkness is not a zero state in terms of vision.
Conclusions
In summary, the results of the present study provide evidence for significant differences in visual adaptation to flicker, especially at high contrast, between migraineurs and control participants at level(s) of the visual pathway prior to binocular combination. Modelling results suggest that this difference is due in large part to stronger adaptation of inhibitory gain pools in migraine. The results also indicate some adaptation at the level of binocular cortical cells, as evidenced by interocular transfer, but the strength of this adaptation, as estimated through computational modelling, is modest in both groups.
Footnotes
Repetitive stimulation such as flickering light reveals sensitivities in the visual pathway of people with migraine that are not apparent under more typical, varied lighting conditions. This has implications for the design of ‘migraine-friendly’ environments.
The adverse effect of flickering light in migraine likely occurs at an early level of the visual pathway. Localizing the site or sites of this abnormal sensitivity is critical to developing targeted treatments.
The perceptual and affective consequences of exposure to flickering light in people with migraine may reflect actions of two separate neural pathways that are not tightly linked.
Funding
This research was supported by the Canadian Institutes for Health Research, Institute for Gender and Health, grant no. IGO-94417 to F.W.