
Abstract
We have previously demonstrated that perimetric performance measured with flickering stimuli is not normal in some individuals who experience migraine with aura in the period between their attacks. In this study, flicker perimetric performance is measured in a broad group of migraineurs to determine whether the existence of such visual field deficits is dependent on the presence of visual aura, is correlated with the duration of migraine history, or frequency of attacks. Twenty-eight migraine with aura, 25 migraine without aura, and 24 non-headache control subjects participated. The performance of the migraine groups was not significantly different from each other. The migraine groups showed significantly lower general sensitivity across the visual field and higher incidence of localized visual field deficits relative to controls. Both length of migraine history and frequency of migraine occurrence over the past 12 months were significantly correlated with lower general sensitivity to flickering visual stimuli.
Introduction
Several studies have demonstrated that perimetric performance in some individuals with migraine is abnormal during the period between their migraine events (1–6). While deficits have been identified with standard automated perimetry (SAP) (3, 5, 6), visual field assessment designed to test specific neural pathways appears to have advantages in the detection of such visual field abnormalities. These tests are designed to preferentially assess either the magnocellular visual pathway by using flickering (1) or moving targets (4, 7), or alternately to assess the koniocellular pathway by using short-wavelength (blue-on-yellow) targets (2). While rare reports of dramatic extensive visual field loss exist immediately post migraine (8, 9), most visual field abnormalities have been identified in-between migraines, when visual symptoms are not present and while subjects are otherwise asymptomatic (1–3, 5).
Visual field deficits in individuals with migraine require study for several reasons. Firstly, the pattern of deficits (for example, whether one eye or both is affected, and, if both, whether deficits are homonymous), and the affected neural pathways identified with neural pathway specific testing, provide information regarding which neural processes form part of the underlying pathophysiology of migraine. Secondly, an understanding of the types of visual field deficits in otherwise healthy migraineurs is essential for accurate clinical differential diagnosis of visual field loss due to ocular disease. Of particular relevance is glaucoma, as a number of ophthalmological studies have found support for a link between these two conditions (10–14).
Previous studies indicate that, while some individuals with migraine demonstrate abnormal visual field performance, many do not (1–3). As migraine history and symptomatology can be highly varied, it is possible that specific migraine characteristics may contribute to predicting perimetric performance. For example, if deficits are cumulative, we can expect that subjects with a greater number of migraine attacks should demonstrate greater losses in sensitivity. Alternately, perhaps those subjects with migrainous visual aura show the most marked deficits, as these individuals clearly have visual pathway involvement as part of their migraine events. In our previous study identifying visual field deficits using flickering stimuli, we tested a select group of 15 young adult (aged < 40 years) migraine with visual aura subjects (1). While we have reported similar deficits in several individuals diagnosed with migraine without aura (15), we have not compared a more representative age-matched group. Here, we examine flicker perimetric performance for a larger group of migraine subjects designed to be more representative of the wider migraine community. We included individuals with a broader range of ages than our previous study and included individuals both with and without visual aura. We explore whether aspects of migraine history such as the presence of visual aura, frequency of attacks, or duration of migraine history, influence flicker perimetric outcomes during the interictal period in this broader population group.
Methods
Subjects
Two migraine groups participated in the study: 25 migraine without aura (aged 18–57); and 28 migraine with aura (aged 18–56). A group of 24 non-headache controls were also recruited (aged 18–50 years). The median values of the ages of the groups were not statistically significantly different (one-way analysis of variance on ranks, H = 5.36; d.f. = 2; P = 0.07). Subjects were required to meet the following visual and ocular health criteria: best corrected visual acuity of 6/7.5 or better, refractive errors less than ± 5.00 diopters sphere and ± 2.00 diopters astigmatism, normal anterior eye and ophthalmoscopic examination, no evidence of glaucoma, no history of diabetes or other systemic disease known to affect ocular function, with the exception of migraine, and were not taking any medications known to affect visual field sensitivity or contrast sensitivity. Migraine subjects were tested at a minimum of 4 days post-migraine offset to enable wash-out of medication taken to relieve migraine symptoms and were not permitted to be taking prophylactic abortive migraine pharmacotherapy. Migraine subjects were required to have migraine symptoms meeting the International Headache Society criteria for either migraine with aura (MA) or migraine without aura (MO). All subjects provided written informed consent in accordance with a protocol approved by the University of Western Australia Human Research Ethics Committee and in agreement with the tenets of the Declaration of Helsinki.
Migraine characteristics
Migraine characteristics were determined through the use of a questionnaire and clinical interview. Patients provided estimates of: age at first migraine; current and previous frequency of attacks; severity in terms of loss of productivity, and details of their current migraine symptomatology.
Temporal modulation perimetry
Flicker perimetric performance was measured across the central 30° of the visual field using a Medmont M700 perimeter (Medmont Pty Ltd, Camberwell, Vic., Australia). A detailed description of the perimeter can be found elsewhere (16). In brief, the perimeter uses 0.43° (Goldman size III) light emitting diodes (LEDs) as stimuli (λmax = 565 nm). The bowl luminance is 3.2 cd/m2 and the maximum stimulus luminance is 320 cd/m2.
Flicker thresholds were determined using the Auto-Flicker test which has been described in detail elsewhere (1). Luminance pedestal flickering stimuli are presented, where the flickering component of the stimulus is modulated about a pedestal luminance that differs from the background luminance. The temporal frequency of the stimuli is varied with eccentricity to improve the dynamic range of the test (1–3°, 18 Hz; 6°, 16 Hz; 10° and 15°, 12 Hz; 22°, 9 Hz). Thresholds are measured using a 6/3 dB staircase (16), and stimuli are presented for 800 ms. Seventy-three locations are assessed. These locations are arranged in concentric rings (1, 3, 6, 10, 15 and 22°) as shown in Fig. 1.
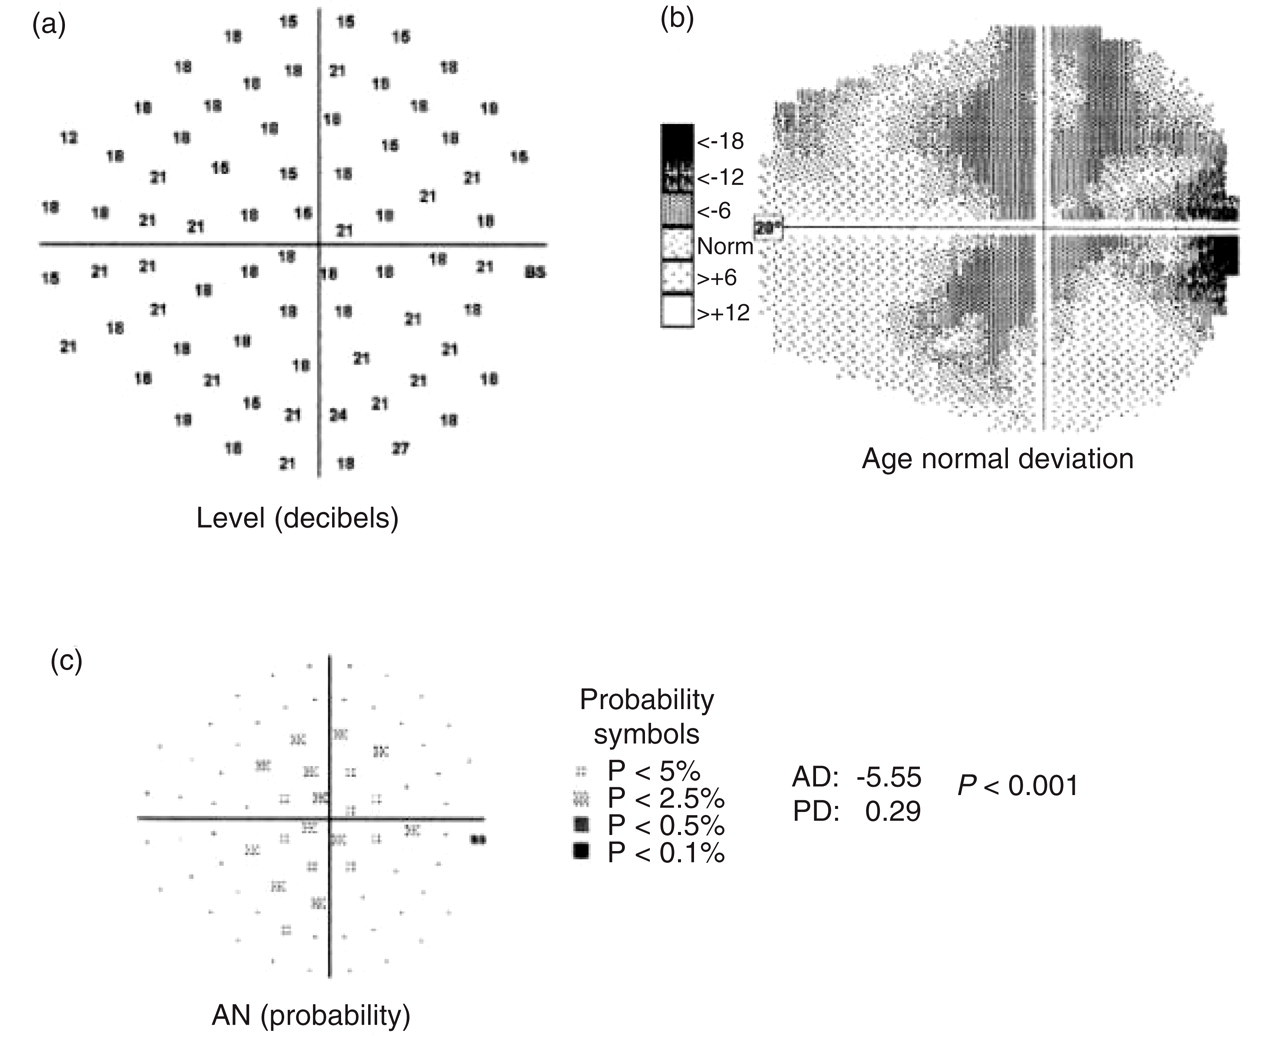
Right visual field of a 28-year-old female migraine-without-aura participant measured 5 weeks post migraine. This subject demonstrated a generalized depression of flicker sensitivity. Three representations of performance are shown: (a) visual field sensitivity in dB (higher numbers indicate better performance; BS indicates the physiological blind spot); (b) grey-scale comparison of performance relative to the age-matched normative database (darker regions indicate worse performance relative to age-matched norms); and (c) age normal probability plot (locations with values lower than the confidence limits of the normative database are flagged with the symbols indicating the probability levels).
Analysis of visual field performance
Perimetric performance was determined for each subject using the global indices returned by the perimeter (average defect and pattern defect) as well as on a point-wise basis.
The average defect
The average defect (AD) indicates whether there is a generalized depression or elevation across the visual field, compared with the internal normative database of the perimeter. The average defect is determined by comparing the subject's performance, on a point-wise basis, with the perimeter's internal database of age-matched norms. The index is based on locations that do not contribute to the calculation of the pattern defect (see later) in an attempt to remove the influence of highly abnormal values. Negative values indicate worse-than-expected performance relative to age norms on average across the visual field, whereas positive values represent better-than-expected performance. A visual field example with significant generalized depression is shown in Fig. 1.
The pattern defect
The pattern defect (PD) is the second global performance index returned by the perimeter and higher values of this index indicate local asymmetries in an individual's visual field relative to the remainder of their visual field. This index compares each point to the sensitivity expected from the subject's individually calculated Hill of Vision. The calculation is achieved by averaging those points at two eccentricities (for example, 3° and 22°) that have dB values that lie within a pre-specified range of the maximum value in each ring (4 dB at 3°, 6 dB at 22°). These averages must themselves fall within the 95% confidence limits for age-matched norms or another ring is considered. Once two suitable rings are identified, the slope (Hill of Vision) is calculated, and predictions are made on a point-wise basis as to how each point compares with the expected value. Hence, the calculation is not based on age-matched norms but the patient's own sensitivity profile. The higher the PD index, the more likely is the presence of a localized scotoma. A visual field example with significant localized depression is shown in Fig. 2.

Right visual field of a 34-year-old female migraine-without-aura participant measured 5 days post migraine. This subject has a localized infero-temporal loss of sensitivity. Three representations of performance are shown: (a) visual field sensitivity in dB (higher numbers indicate better performance; BS indicates the physiological blind spot); (b) grey-scale comparison of performance relative to the age-matched normative database (darker regions indicate worse performance relative to age-matched norms); and (c) age normal probability plot (locations with values lower than the confidence limits of the normative database are flagged with the symbols indicating the probability levels).
The perimeter houses an internal normative database of visual field performance for each of the tasks, from which the AD and PD are determined. Individuals with migraine are not excluded from the normative database, and from population estimates of migraine prevalence (17) it might be expected that approximately 10–15% of individuals in the normative database are migraineurs. Consequently, we compare the performance of our migraine subjects with our own non-headache control subjects to establish abnormality. We also list the number of migraine subjects who had AD and PD values flagged by the perimeter at the P < 0.01 level, as this provides an estimate of severity of deficits relative to the wider normative database.
Statistics
The subject groups were compared using either parametric or non-parametric statistics where appropriate. Non-parametric tests were used if the distributions were non-Gaussian (Kolmogrov–Smirnov). Group comparisons were made using the global indices generated by the perimeter (AD and PD). To determine whether a significant relationship existed between migraine history and visual outcomes, Spearman Rank Order correlations were calculated between the migraine characteristics and perimetric global indices. For the correlations, the eye with the worst performance was selected. Statistical calculations were performed using SigmaStat 3.0 (SPSS Science, Chicago, IL, USA).
Results
Comparison of generalized visual field sensitivity: the AD index
Compared with the normative database of the perimeter, one subject with MA and four subjects with MO had at least one eye with AD flagged at P < 0.01 level. This represents a significant generalized depression of sensitivity across the visual field relative to the internal database. None of the control subjects had AD outside the normative P < 0.01 level for either eye. Figure 3 shows a histogram of the AD indices. A negative AD indicates a generalized depression in sensitivity relative to the normative database. It can be seen that our control group performed slightly worse on average than the normative database (indicated by negative AD values), demonstrating that we didn’t by chance select a hyper-normal control group. Each of the three subject groups are shown separately and visual inspection of Fig. 3 shows that, while the distributions largely overlap, there is a higher proportion of migraineurs than controls in the negative tail of the distributions. This is confirmed by statistical analysis. A mixed-factor ANOVA (factors were eye and group) found no significant difference between MO and MA groups (F 1,51 = 0.49, P = 0.49). Migraine subjects were pooled to compare with controls, with migraine group performance being significantly worse than controls (F 1,75 = 6.36; P = 0.01).

Histogram of the AD global index. Both eyes of each subject are represented. The vertical lines show the mean values for each subject group. , Controls; •, MA, ○, MO.
Comparison of localized deficits: the PD index
Compared with the internal normative database, four MO, nine MA and no controls had PD indices outside the P < 0.01 level. Figure 4 shows a histogram of the PD indices for each of the three groups. The distributions are non-Gaussian, hence non-parametric statistics were used to compare groups. While there is substantial overlap between the migraine and control groups, both the migraine distributions have long tails, indicating a small proportion of subjects with highly abnormal PD indices (indicative of localized areas of decreased sensitivity within their visual fields). There was no significant difference in performance between right and left eyes for any of the groups, so eyes were pooled (Signed Rank Test P > 0.05). There was no significant difference in median PD between MO and MA groups (Mann–Whitney Rank Sum Test, P = 0.86). Migraine subjects were pooled to compare with controls, with median migraine PD (1.65 dB) being significantly worse (Mann–Whitney Rank Sum Test, P = 0.03) than that of controls (0.92 dB).
Histogram of the PD index. Both eyes of each subject are included. , Controls; •, MA, ○, MO.
Description of visual field deficits
The histograms shown in Figs 3 and 4 present data from both eyes of each subject. To explore whether, for a given migraine subject, performance was similar in both eyes, Fig. 5 plots the AD index obtained for the right eye against that obtained for the left eye for each of the migraine subjects. Average sensitivity across the visual field was significantly correlated between the two eyes (Pearson product moment correlation coefficient r = 0.72, P < 0.01) demonstrating that, in general, subjects who had reduced average sensitivity in one eye relative to the normative database also had a generalized reduction in sensitivity in their other eye.

Scatter plot showing the AD global index for the right eye plotted against that of the left eye for each migraine subject. r = 0.72; P < 0.01. •, MA; ○, MO.
While the level of generalized sensitivity (AD index) was correlated between the two eyes of migraine subjects, the level of localized asymmetry in visual field performance was not. Figure 6 shows the PD index for the right eye plotted against that of the left eye for each of the migraine subjects. A Spearman Rank Order correlation demonstrated no significant relationship between the performance of right and left eyes (r = 0.07, P = 0.62). Hence, many migraine subjects with a localized visual field deficit in one eye, did not have a localized loss in their other eye.
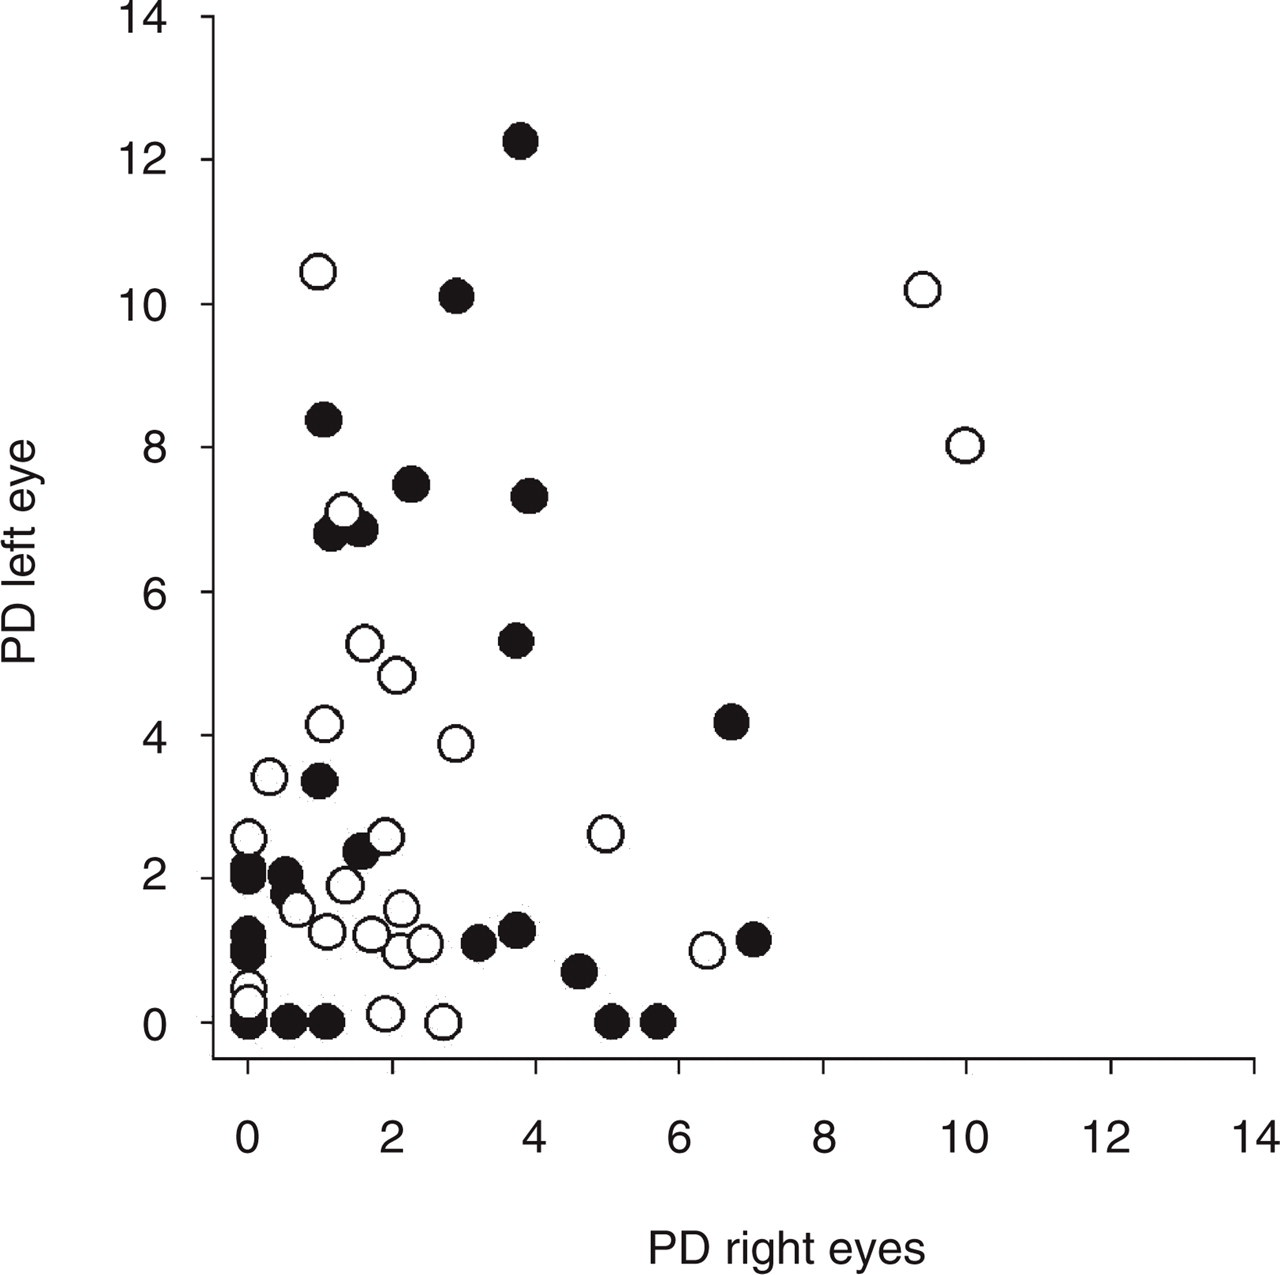
Scatter plot showing the PD global index for the right eye plotted against that of the left eye for each migraine subject. r = 0.72; P = 0.62. •, MA; ○, MO.
Because the Medmont normative database does not exclude individuals with migraine, and the exact details of the database are unavailable for proprietary reasons, the visual fields of all migraine subjects were also compared with our control subjects on a point-wise basis. Locations with sensitivities outside the lower 95th percentile for controls were identified. For the purpose of inspecting the location of visual field deficits, a cluster of three or more adjacent locations flagged as being outside the lower 95th percentile of normal performance was classified as a localized depression. This classification criterion is commonly used to classify abnormal fields using standard automated perimetry (18, 19), and is likely to be applicable to flicker perimetry as the spatial test-pattern is similar. None of the subjects showed a homonymous hemianopic or quadrantic deficit. The majority were superior or inferior arcuate deficits located in the 10 or 15° test ring. Table 1 shows the number of subjects from each migraine group with superior, inferior or foveal deficits.
Number of subjects in each migraine group with either a superior arcuate, inferior arcuate or foveal deficit

Relationship of perimetric performance to migraine history
Migraine history was collected by verbal retrospective reporting and completion of a written questionnaire. Unfortunately, this type of reporting is subjective and may be inaccurate. Subjects were questioned regarding a wide range of migraine features, however, many were unable to confidently report aspects of their migraine symptomatology, such as side of headache or visual aura. All subjects were confident in retrospectively estimating their age at first migraine. Subjects were also confident in their estimate of the number of migraines in the past 12 months. From these estimates, the duration of migraine history was determined in years, as well as the current frequency (number of migraines in the past 12 months). The duration of migraine history ranged from 1 year to 44 years, with a mean of 16 years (S.D. = 11 years). The number of migraines in the past year ranged from one to 60 (mean = 15, S.D. = 13).
The duration since the most recent migraine was also included in the correlation analysis, as we have previously documented one migraine without aura subject with a flicker perimetric deficit measured 24 h post migraine that gradually improved over a 35-day period. The mean duration post migraine was 31 days (S.D. = 33 days), with a minimum of 4 days and a maximum of 168 days.
Relationship of migraine characteristics to generalized sensitivity across the visual field
Spearman rank order correlations were determined between the migraine history descriptors and the AD of the worst eye of each migraine subject. As the presence of visual aura does not predict visual field performance, migraine – with and – without – aura groups were pooled. AD was not correlated with the duration since the last migraine (r = 0.12, P = 0.45). A weak, but statistically significant, negative correlation was found between AD and the number of migraines in the past 12 months (r =− 0.30, P = 0.03), as well as between AD and the duration of migraine history (r =− 0.33, P = 0.01). This suggests that there is some contribution of both migraine frequency and cumulative migraine history in determining general sensitivity to flickering stimuli across the visual field.
Relationship of migraine characteristics to localized sensitivity loss
Spearman rank order correlations were also calculated for the relationship between the migraine history descriptors and the PD of the worst eye of each migraine subject. No statistically significant correlations were obtained between any of the measures: duration since last migraine (r = 0.05, P = 0.71); number of migraines in the past 12 months (r =− 0.02, P = 0.90); duration of migraine history (r = 0.15, P = 0.31). Hence, while migraine history may contribute to decreased generalized sensitivity across the visual field, we find no relationship between these factors and the localized, often unilateral and arcuate mid-peripheral scotomas present in some migraineurs.
Discussion
Abnormal visual fields measured with flicker perimetry were common in our larger group of migraine subjects. The flickering targets used in temporal modulation perimetry (TMP) are likely to be preferentially detected by the magnocellular visual pathways (20, 21). We chose to use TMP as it has previously been shown to be more effective at identifying visual field loss in individuals with migraine than standard automated perimetry (1, 15). This advantage of TMP is unlikely to be due to a selective loss of magnocellular neural performance as other neural pathway specific assessments have demonstrated anomalies of visual processing in migraineurs using tasks likely to be detected by either parvocellular (15) or koniocellular (2) pathways. Tasks that are preferentially detected by magnocellular neurons may be more sensitive for the detection of early loss because M-cells are sparse [approximately 10–20% of ganglion cells (22, 23)]. Therefore, if even a small proportion of neurons are malfunctioning, a deficit may be manifest due to reduced redundancy rather than due to a selective magnocellular loss (24).
We identified two main patterns of visual field loss in our migraine subjects: decreased generalized sensitivity across the visual field, and localized deficits. General sensitivity was strongly correlated between left and right eyes of individuals, implying a cortical basis for this reduction in sensitivity. Such a reduction in sensitivity may possibly result due to a difference in neural processing in these individuals. A number of studies of visual performance measures in individuals with migraine have attributed their findings to abnormal cortical processing (25–31), which has been variously attributed to cortical neuronal hyperexcitability, a lack of habituation, or an abnormality of intracortical inhibition or excitation. Irrespective of the exact neural mechanism, a primary difference in neural processing may explain decreased flicker sensitivity. Alternately, a generalized deficit may arise as a secondary consequence of such abnormal cortical processing. Abnormal cortical neuronal response may increase the aversiveness of the stimuli and decrease subject attention. Several studies have reported heightened visual discomfort in individuals with migraine during the interictal period (25, 28, 32, 33). Heightened aversiveness does not explain the localized losses found in some migraine subjects.
We found a weak, but statistically significant, correlation between decreased generalized sensitivity and increased migraine frequency. Abnormalities in cortical neuronal function that increase susceptibility to migraine, thereby resulting in more frequent attacks, may manifest as decreases in generalized visual sensitivity for primary or secondary reasons as described above. We also found a weak but significant correlation between decreased generalized sensitivity and duration of migraine history, which implies some cumulative effect of migraine on visual processing. Our findings are consistent with those reported in a doctoral thesis by Khalil (25). Khalil reports significant correlations between duration of migraine and foveal temporal contrast sensitivity for an flickering LED stimulus similar to that used in the Medmont perimeter, for flicker rates of 10 Hz (r = 0.46, P < 0.01) and 20 Hz (r = 0.27, P = 0.01), but not for rates of 3.3 Hz, or 30 Hz. Yet, several other studies have not found associations between visual performance measures and duration of migraine history (30, 34). These studies used grating stimuli that were either static (34), or presented as part of a masking paradigm (30), and were designed to assess different visual mechanisms than the flickering stimuli used both by Khalil and ourselves. These stimulus differences may explain the inconsistent findings regarding the effect of migraine duration on visual performance, as may the difficulties associated with retrospective reporting of migraine symptomatology.
While this study was designed to include a wider and more generally representative group of migraineurs than our previous study of flicker perimetry performance in migraine (1), our sample still does not include severe sufferers, as subjects were not permitted to be on abortive migraine therapy. Of additional potential interest is whether the laterality of the aura or head pain is related to location of visual field deficit. Subjects were not always able to tell us which side of their head was involved (or said both varying from migraine to migraine), or even whether the aura was predominantly on one side. These difficulties with retrospective reporting of aura symptoms are well recognized (34–36). Reliable analysis of such factors requires prospective collection of migraine symptomatology over an extended period through the use of diaries or similar.
A subgroup of migraineurs demonstrated localized scotomas to flickering stimuli. Unlike the decrease in generalized sensitivity, the degree of visual field asymmetry (as measured by the PD index) was not related to the clinical migraine features studied. The unilateral and localized nature of these deficits implies a different causative mechanism to the generalized decreases in sensitivity. Several authors have argued that the vasospastic component of migraine may contribute to visual field deficits in migraineurs as well as the proposed increased susceptibility to develop glaucoma in some individuals with migraine (6, 10, 11, 37, 38). The often unilateral, mid-peripheral scotomas found in our study are similar to those found in early glaucomatous visual field loss. Glaucomatous visual field loss is persistent, hence, establishing the time-course of such visual field deficits in migraineurs is essential to differential diagnosis, and may possibly aid in identifying those individuals with migraine who have an increased future risk of developing glaucoma. The relationship between migraine and glaucoma deserves further investigation.
Footnotes
Acknowledgements
AMM is supported by an NHMRC Australian Clinical Research Fellowship (♯139150). The project was supported in part by Raine Medical Research Foundation Priming Grant (AMM), and Australian Research Council grant ♯A00000836 (DRB).