
Abstract
Background: In patients with migraine, an abnormally large haemodynamic response to epileptogenic visual stimulation has previously been observed, consistent with the hypothesis of a cortical hyperexcitability. Ophthalmic filters have been used in the treatment of migraine, and they reduce the haemodynamic response.
Methods: The present study used near-infrared spectroscopy (NIRS) to characterise the haemodynamic response to a range of visual stimuli in 20 patients with migraine (15 with aura and 5 without) and paired controls in order to assess the effect of ophthalmic treatment. In an initial study, the response to three stimuli (chequerboard, and two gratings of different spatial frequency) was measured. In a second study, using the mid-spatial frequency grating as stimulus, the response was compared when precision spectral filters (PSF), grey filters or filters of control colour were worn as ophthalmic lenses.
Results: In the first study the time course of the response differed between the groups. The difference was most distinct for the grating with mid-spatial frequency. In the second study the PSF broadened (normalised) the haemodynamic response in migraineurs relative to controls, consistent with fMRI BOLD findings and suggesting a physiological mechanism for their reported efficacy. In neither study were there differences in the amplitude of the response between migraine and control groups or indeed between filters.
Conclusion: The time course of the functional response as measured by NIRS may be an effective tool to track therapy with PSF and explore the mechanisms of visual stress in migraine.
Keywords
Introduction
The greater responsiveness of the visual cortex in individuals with migraine has been observed (i) psychophysically via illusions/distortions (1); (ii) electrophysiologically (as increased VEP amplitude and reduced habituation (2,3); (iii) via lower thresholds for the induction of phosphenes from transcranial magnetic stimulation (4) (though inconsistently (5)); and (iv) by increased fMRI BOLD amplitude in response to those grating patterns with a mid-range spatial frequency that are generally judged to be aversive (6), and particularly so by individuals with migraine (7).
The visual stimuli to which patients with migraine are most responsive generally resemble those from which patients with photosensitive epilepsy are most at risk (8), suggesting that the greater responsiveness may reflect a lowered convulsive threshold due to a failure of cortical inhibition. This would be consistent with (i) the non-specific paroxysmal EEG abnormalities that patients with migraine sometimes exhibit, (ii) the efficacy of antiepileptic drugs in migraine prophylaxis (9), and (iii) the co-morbidity of epilepsy and migraine (10).
Although the slow progression of a migraine aura resembles that of spreading depression (11) rather than an epileptic phenomenon, it is possible that a hyperexcitability of the visual cortex may contribute to the induction of a spreading depression. In animals pretreated with the pro-convulsive drug metrazol, visual stimulation can precipitate spreading depression (12) and in humans, electrocorticography following brain trauma shows epileptiform activity associated with cortical spreading depression (13).
Perhaps as many as 40% of patients with migraine (14,15) report that visual stimulation can trigger attacks, and it is possible that their susceptibility is related to an elevated responsiveness of the visual cortex to visual stimulation. Huang et al. (6) observed higher fMRI BOLD response in patients with migraine than in those who do not suffer with headaches, and this abnormal elevation occurred only for patterns with spatial frequency in the epileptogenic range.
The haemodynamic response in visual areas of the cortex can be measured using near-infrared spectroscopy (NIRS), a portable technique that, although offering relatively poor localization, can easily measure the latency of the response and its amplitude. The present study used NIRS to investigate the cortical activation by visual stimulation in a sample of patients with migraine and their controls, with the aim of exploring the suitability of the technique for the assessment of treatment of visual sensitivity in migraine.
Coloured filters have long been used to treat photosensitive epilepsy (16), and patients with migraine often report a benefit from tinted lenses (17). When the colour of the tint was chosen individually to decrease visual discomfort and perceptual distortion when viewing text, a small-scale double-masked study has confirmed that a reduction of symptoms occurs when the appropriately coloured tint is worn, as compared with a control tint of different colour (18). Huang et al. (19) showed that in migraineurs this tint, but not control tints, both coloured and grey, reduced the fMRI BOLD response in prestriate areas.
The present study consists of two experiments that explored the haemodynamic response of the visual cortex to visual stimulation. The purpose of the first experiment was to develop techniques and compare the haemodynamic response in migraineurs with that in controls. The purpose of the second experiment was to study the effect of precision spectral filters (PSF) on the haemodynamic response.
Methods
Details of migraine participants
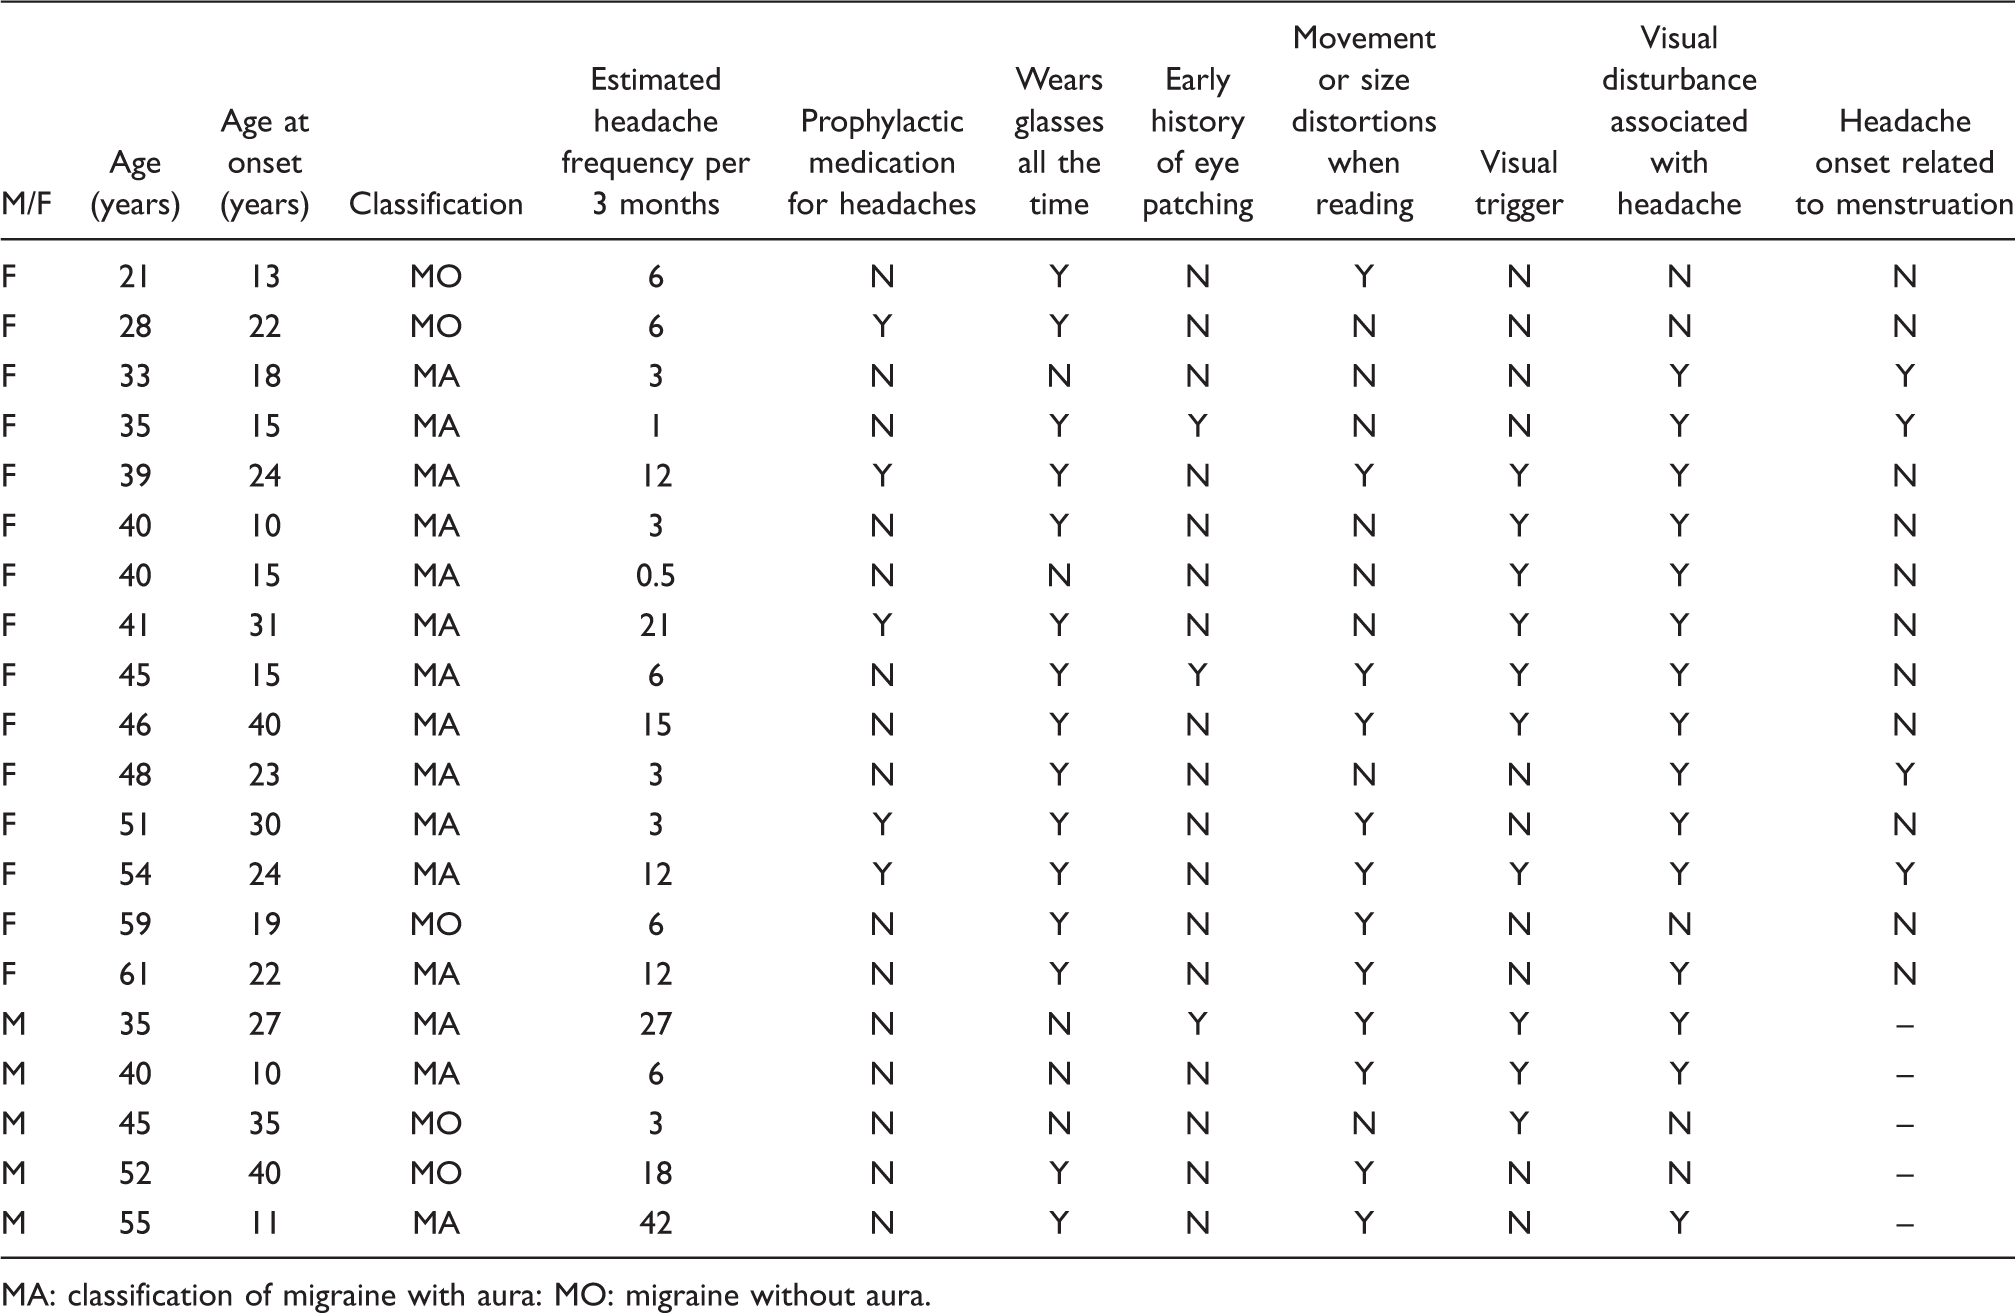
MA: classification of migraine with aura: MO: migraine without aura.
The patients were first examined with the Intuitive Colorimeter (18), which involved viewing text illuminated with coloured light, in order to select a colour optimal for improving the clarity of the text, and reducing visual discomfort according to a standard protocol (17).
The NIRS recording was then undertaken while participants were seated and viewed, from a distance of 0.6 m, a video on a Dell AS501 LCD monitor in which black and white patterns were displayed for 16 s, with a rest period of 31 s during which a uniform grey screen with the same space-averaged luminance was visible.
The changes in oxygenated and deoxygenated haemoglobin concentration in the visual cortex were measured using an eight-channel NIRS system (Artinis Medical Systems BV, Zetten, the Netherlands). Two optodes connected to receivers were positioned symmetrically 37 mm vertically above the inion, each 30 mm from the body midline (i.e. close to O1 and O2 on the international 10-20 system for electrode placement). Two transmitter optodes were positioned vertically above the two receivers, resulting in a pair on each side of the head. Three further transmitters were positioned laterally on the circumference of a circle centred on the receivers, at 40° intervals. As a result, four channels were positioned over the posterior cortices of the two cerebral hemispheres. Each channel had an optode spacing of 35 mm. A differential path length factor of 6.26 was assumed for the calculation of changes in oxygenated and deoxygenated haemoglobin concentrations in micromolar units (20).
Blood pressure was transduced continuously from the middle finger of the left hand using a Portapres photoplethysmograph (Finapres Medical Systems, Amsterdam, the Netherlands) at a sampling rate of 10 Hz.
The preparation and analysis of the data are described online as a data supplement. In brief, shifts in baseline due to optode movement were removed, and the signal low-pass filtered.
Experiment 1
Method
The patterns used in Experiment 1 were: (i) a coarse grating with square-wave luminance profile and spatial frequency 1.2 cycles per degree (cpd); (ii) a fine square-wave grating with spatial frequency 18.5 cpd; (iii) a radial chequerboard, each check subtending 7.5°, with 20 annuli, the element size in each succeeding annulus increasing with eccentricity by a factor of 1.5. Pattern types 1 and 2 were shown as a static stimulus, whereas pattern type 3 was flashed at a frequency of 1 Hz, alternating with a diffuse grey field of the same space-averaged luminance (80 cd m–2). All patterns had a Michelson contrast of 98% and subtended a viewing angle of 20°. They were surrounded by a background (32.5 × 36°) of the same space-averaged luminance. A central fixation cross (1 × 1°) was visible throughout. A photocell directed at a corner of the screen provided a signal synchronised with stimulus presentation that was captured by the data acquisition software. There were eight presentations of each pattern, randomly ordered in groups of three, each pattern type presented once per group, avoiding repetitions of each type on neighbouring presentations.
Data were averaged across all channels because preliminary analyses failed to show any significant differences between channels, and because data dropout was low (less than 4% overall) and was not unevenly distributed across channels.
The response amplitude was estimated from the difference in concentration values during an averaging period of 8 s beginning 12 s after stimulus onset, compared with the average concentration values during two baseline periods of 4 s, one beginning 4 s before stimulus onset and the other 15 s after stimulus offset.
Results
Figure 1 shows the average responses to each visual stimulus separately for migraineurs and their age- and sex-matched controls. Separate repeated-measures analyses of variance of the response amplitude for oxygenated haemoglobin and deoxygenated haemoglobin with stimuli and participant group as factors revealed a significant main effect of stimulus (F(2,38) = 26.38, p = 0.000 for oxyhaemoglobin, and F(2,38) = 11.49, p = 0.000 for deoxyhaemoglobin), but not for participant group (F(1,19) = 3.94, p = 0.062 for oxyhaemoglobin and F(1,19) = 0.50, p = 0.489 for deoxyhaemoglobin). The main effect of stimulus was attributable mainly to the larger response to the chequerboard: for oxyhaemoglobin the Bonferroni post hoc paired comparisons between stimuli were all significant, and for deoxyhaemoglobin the pairwise comparisons involving chequerboards were significant.
The average haemodynamic response in controls (broken curves) and migraineurs to coarse gratings, fine gratings and chequerboards (1st, 2nd and 3rd rows, respectively), shown separately for oxyhaemoglobin (HbO2) (left column) and deoxyhaemoglobin (HHb) (right column).
A general response function (obtained empirically from independent data, see online data supplement) was cross-correlated with each signal for a range of lags. The peak in the cross-correlation function at the lag closest to zero (stimulus simultaneity) provided a measure of the magnitude of each response at the optimum lag, a measure that took account of any differences in latency between groups. The correlations for deoxyhaemoglobin were low and were not considered further. A repeated-measures analysis of variance (ANOVA) of the cross-correlations for oxyhaemoglobin with group and stimuli as factors revealed no significant effect of stimulus, no effect of group and no significant interaction terms.
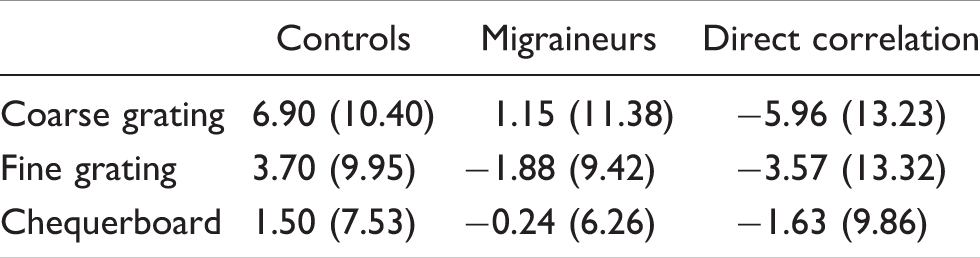
Average (and standard deviation) of the time lag (s) for oxyhaemoglobin. Columns for controls and migraineurs present the time lag (s) between the general response function and the subject’s averaged signal at which the cross-correlation was first maximal. The column headed ‘Direct correlation’ shows the time lag (s) at which the cross-correlation between the response in migraineurs and the paired controls was first maximal. For correlation with the general response function, positive values indicate that the averaged signal is later than the general response function; negative values indicate that the averaged signal is earlier. For direct correlation, positive values indicate that the migraineurs lagged the controls
Overall, the response was earlier in migraineurs, as confirmed by a repeated-measures ANOVA with group and stimuli as factors. Inspection of Figure 1 suggests that this was because the response in the migraineurs lasted a shorter time, decreasing earlier. ANOVA revealed a significant effect of group (F(1,18) = 4.96, p = 0.039) but no significant effect of stimulus, and no significant interaction terms. Individual t-comparisons revealed that the difference between groups was significant for coarse (mid-frequency) gratings (t(19) = 2.21, p = 0.040), but not for fine (high-frequency) gratings (t(19) = 1.54, p = 0.139) or chequerboards (t(19) = 1.25, p = 0.225).
The above analysis of time course was corroborated by cross-correlating the signal for each migraineur directly with that for their age- and sex-matched control, i.e. independently of the general response function. The value of the lag at which each migraineur’s signal and each control participant’s signal was first maximally correlated provided a measure of the latency between signals, and is shown in the third column of Table 2. Individual t-comparisons revealed that the difference between groups for coarse gratings was significant (t(19) = 2.36, p = 0.029), but not for fine gratings (t(19) = 1.62, p = 0.123) or chequerboards (t(19) = 1.23, p = 0.234). A similar analysis confined to the 15 patients who experienced migraine with aura yielded similar findings.
When subjects were separated about the median into two groups based on the size of their blood pressure response, the difference in NIRS concentration values was non-significant (t = 0.34, p = 0.41, one-tailed): there was no significant change in blood pressure across groups. Any systemic effects that may have been present were therefore a minor part of the observed haemodynamic response.
Discussion
Both migraineurs and controls showed a clear haemodynamic response to stimulation. The response magnitude was clearly affected by the nature of the visual stimulus, with the chequerboards giving the greatest response for both groups, when measured at the same delay relative to stimulus onset. There were no differences in the magnitude of the response for migraineurs and controls, although overall the response in migraineurs occurred on average about 3 s earlier than in controls and did so particularly for coarse gratings. The findings provide further evidence that coarse gratings are the optimum stimuli to show differences in the haemodynamic response between migraineurs and controls, as shown previously (6).
Experiment 2
Method
The participants in Experiment 1 underwent a further session in which they viewed a video that displayed a black and white coarse square-wave grating with spatial frequency of 1.2 cpd, as used in Experiment 1. Presentation parameters were otherwise the same as those in Experiment 1. The pattern was shown as a static stimulus, presented continuously on four separate occasions while the participant wore one of three types of tinted lenses, selected on the basis of a colorimetry assessment of the migraine patients: (i) ‘active’ lenses having the colour chosen to reduce distortions of text and improve comfort; (ii) control (placebo) lenses with similar transmission and a chromaticity that was about 0.07 distant in the CIE UCS diagram (21); (iii) a grey lens of similar transmission. The chromaticities of the coloured lenses (active and control) are shown separately for each migraine participant in Figure 2, connected by a line. Each control participant used the lenses chosen by the paired migraineur. The grey lens was chosen to match the photopic transmission of the active and placebo lenses. The lenses were used in the following order: active lens, placebo lens, grey lens, grey lens, placebo lens, active lens. The order ensured that any linear trend in signals contributed equally to all conditions.
International Lighting Commission (CIE) 1976 uniform chromaticity diagram (21) showing the chromaticities of the active lenses (points) and control lenses (crosses). Lines connect the chromaticities of the lenses used by each participant.
Data from the participants were averaged across trials and channels. The two sets of data collected for each lens type (active, placebo and grey lenses) were then averaged.
Results
Figure 3 shows the average haemodynamic response in migraineurs to coarse gratings in controls and migraineurs for active, placebo and grey lenses. The response is shown separately for oxygenated and deoxygenated haemoglobin. In the bottom row the data for the oxyhaemoglobin response in migraineurs have been re-plotted to show the effect of the filters.
The average haemodynamic response to coarse gratings in controls (broken curves) and migraineurs for active, placebo and grey lenses (1st, 2nd and 3rd rows, respectively), shown separately for oxyhaemoglobin (HbO2) (left column) and deoxyhaemoglobin (HHb) (right column). Bottom row: part of the same data re-plotted to show the oxyhaemoglobin response in migraineurs for (i) active (continuous curve) versus placebo and (ii) active (continuous curve) versus grey lenses.
Separate repeated-measures analyses of variance of the change in concentration values, with lens type and participant group as factors, showed no significant main effects or interactions both for oxygenated and deoxygenated haemoglobin. The same was true when the response amplitude was estimated by cross-correlation with the general response function.
Average (and standard deviation) of the time lag (s) for oxyhaemoglobin. Columns for controls and migraineurs present the time lag (s) between the general response function and the subject’s averaged signal at which the cross-correlation was first maximal. The column headed ‘Direct correlation’ shows the time lag (s) at which the cross-correlation between the response in migraineurs and the paired controls was first maximal (data for 20 patients and their controls). For correlation with the general response function, positive values indicate that the averaged signal is later than the general response function; negative values indicate that the averaged signal is earlier. For direct correlation, positive values indicate that the migraineurs lagged the controls

Individual planned t-comparisons revealed that the difference between the active coloured lens and placebo coloured lens was marginally significant for migraineurs (t(19) = 2.04, p = 0.056, one-tailed), but not controls (p = 0.47). The difference between the active and grey lens was significant for migraineurs (t(18) = 2.30, p = 0.033, one-tail) but not for controls (p = 0.34). The bottom panel in Figure 3 shows the oxyhaemoglobin response for migraineurs for active lens versus placebo lens and active lens versus grey lens, to allow the differences in response shape with different lenses to be visualised.
The overall latency of the response in controls and migraineurs was also compared directly by computing the lag at which the cross-correlation between each migraineur and paired control was first maximal. Individual planned t-comparisons revealed a significant difference between active and placebo lenses (t(18) = 2.26, p = 0.037). The difference between the active and grey lens was not significant (t(19) = 1.63, p = 0.12). (This analysis combines the variability in the estimate of time lag for both controls and migraineurs.)
When a similar analysis was confined to the participants who experienced migraine with aura and their matched controls the results did not reach significance.
When subjects were separated about the median into two groups based on the size of their blood pressure response, the difference in NIRS concentration values was non-significant (t = 0.36, p = 0.36, one-tailed).
Discussion
It might be anticipated (19,22–24) that differences in the NIRS response in migraineurs and controls should be clearly discernible, and indeed this was found to be the case. We have demonstrated (i) differences in the haemodynamic response to various visual stimuli; (ii) an abnormal response in migraineurs; (iii) normalisation of this response with use of PSF that reduce photophobia. In these three respects, the results resemble those obtained with fMRI BOLD (19).
Schytz et al. (25) used NIRS to measure the haemodynamic response in 12 migraineurs without aura, comparing it with 12 controls. They failed to find any differences between migraineurs and controls in the magnitude or latency of the haemodynamic response. This might be for two reasons: (i) they were measuring in the frontal cortex using cognitive activation, and there is no evidence for cognitive dysfunction in migraine (26), and (ii) the patients had migraine without aura. The measurements in the present paper were undertaken in the visual cortex. The visual cortex generally provides a smaller NIRS signal than the frontal cortex, but has been shown to give an abnormally large fMRI BOLD signal in migraineurs. Further, the majority of our patients had migraine with visual aura, which is atypical and may have increased the chances of obtaining an abnormality. A limitation of the present study is that we recruited patients by advertisement and as a result, our sample was heterogeneous with respect to disease characteristics such as age, attack frequency and medication use. The heterogeneity of the migraine group may therefore limit the extent to which the present findings may be generalised.
It is not possible to say whether the abnormal time course of the response observed in the present study was a reflection of a general dysfunction in cerebral blood flow regulation (27) or was specific to the visual cortex because we did not include non-occipital channels. (We were concerned to sample the occipital signal densely so as to maximise the chances of obtaining a reliable (occipital) signal with all patients.)
The amplitude of the response to visual stimuli was dependent on the nature of the stimuli as measured by methods that were relatively unaffected by the time course of the response, but less so by methods that took such differences into account. The responses to the chequerboard stimulus were generally larger than for the other stimuli; one possible reason why chequerboards are popular as visual stimuli in activation studies (e.g. 28). With all the visual stimuli used there were no significant differences in response magnitude between migraineurs and controls. Whereas different stimuli are simple to compare within participants when the sources of variation between participants are statistically controlled, the latter sources of variation make it difficult to compare amplitudes of responses between subjects. Aside from haemodynamic and neural variability, the optical properties of the brain vary widely between participants. For example the distance the light takes from source to detector (the optical path length) is crucial for quantifying the amplitude of haemoglobin concentration changes. This is assumed not to vary between participants, and in the present study a literature average is used. But there is a large standard deviation when path length is measured directly by time-of-flight (29) or frequency domain optical methods (20).
The time course of the haemodynamic response is unlikely to be sensitive to the optical path length and is therefore, in principle, less variable between subjects and more sensitive to small changes, as might occur in pathological conditions. This may explain why we saw significant differences in the time courses of the haemodynamic response between participants but not the significant differences in response amplitude that have been observed with fMRI BOLD. The differences in time course were robust whether measured by methods that assumed a typical response function, or by methods that were independent of such a function.
The unusual shape of the haemodynamic response in migraineurs has not been observed before. This may be because:
The response has been studied using fMRI, which frequently sacrifices time resolution for enhanced measurements of amplitude or spatial resolution. With NIRS there is little spatial resolution to trade off, and greater time resolution is possible. The BOLD response reflects the deoxyhaemoglobin response (30) and in the present study this signal did not show latency differences. The absence of latency differences in the deoxyhaemoglobin response might be attributable to the relatively small signal, but it appears to be the oxyhaemoglobin signal rather than the deoxyhaemoglobin signal that shows the differences in time course (see Figures 1 and 3).
Previously the time course of the NIRS response has been used primarily to look at changes in the relative responses of oxy- and deoxyhaemoglobin (31). To our knowledge, the present study is the first example of an alteration of the haemodynamic response time by a pathological condition, measured by NIRS. The fact that a treatment condition that alleviates symptoms (PSF) normalises the temporal response gives us confidence that the altered time course is reporting on a pathological event. The mechanisms for the altered haemodynamic response will require further study. The difference could be neural or vascular. The simplest explanation would be that the migraineurs had a less prolonged cortical response, but this does not seem consistent with other data (6,19). An altered vascular response is possible; for example an enhanced rate of removal of a vasodilator such as nitric oxide from the vasculature could accelerate the decrease in post-stimulus cerebral blood flow. However, it is just as likely that the answer lies in the spatial resolution of NIRS. Differences in latency of response have been shown in different layers using fMRI in animal studies (32) and the haemodynamic response function as measured with NIRS in humans is an average of many stimulus response functions, each of which may have different time courses. Excessive speculation as to the contribution of such latency differences is unwarranted but this study suggests that simultaneous fNIRS and fMRI measurements (33), together with EEG, would be beneficial to an understanding of neurovascular coupling in migraine.
Conclusion
The study has provided an indication of the utility of NIRS in the measurement of the haemodynamic response to visual stimuli, and its ability to distinguish between migraineurs and controls in terms of the time course of the response. The finding that PSF normalise the haemodynamic response to visual stimuli in migraine suggests a mechanism underpinning their therapeutic use.
Footnotes
Acknowledgements
We thank Dr Peck Koh, Dr Anna Blasi, Roger Deeble and Michael Lodge for technical help.
Funding
The work was supported by Wellcome Trust Grant Number 080274. The study was funded solely by the Wellcome Trust.
Conflict of interest
Author AJW invented the Intuitive Colorimeter used in the study. The UK Medical Research Council owns the rights to the instrument. AJW receives a proportion of royalties on sales of the instrument from the MRC as an ‘Award to Inventors’. None of the authors or the MRC receives royalties on sales of tinted lenses.
The authors are solely responsible for the study design; collection, analysis, and interpretation of data; writing of the report; and the decision to submit the paper for publication.
References
Supplementary Material
Please find the following supplemental material available below.
For Open Access articles published under a Creative Commons License, all supplemental material carries the same license as the article it is associated with.
For non-Open Access articles published, all supplemental material carries a non-exclusive license, and permission requests for re-use of supplemental material or any part of supplemental material shall be sent directly to the copyright owner as specified in the copyright notice associated with the article.