
Abstract
Aims: The underlying mechanisms of migraine remain poorly understood, partly because we lack objective methods for quantitative analysis of neurological function. To address this issue, we measured interictal saccadic latency in migraineurs and controls.
Methods: In a cross-sectional study, we compared interictal saccadic latency distributions of 12,800 saccades in 32 migraineurs with 32 age- and sex-matched controls.
Results: The variability of migraineurs’ reaction time distributions was significantly smaller (σ = 1.01 vs. 1.13; p < 0.05) compared with controls. In addition, a smaller proportion of migraineurs generated ‘early’ saccades (31% vs. 56%: p < 0.05). Sensitivity/specificity analysis demonstrated the potential benefit of this technique to diagnostic discrimination.
Conclusions: The migraineur’s brain behaves significantly differently from that of a control during the interictal period. By analysing whole distributions, rather than just means, data can be related directly to current neurophysiological models: specifically, the observed decrease in variability suggests a functional deficit in the noradrenergic systems influencing the cerebral cortex. From a clinical perspective, this novel method of characterising neurological function in migraine is more rapid, practicable, inexpensive, objective and quantitative than previous methods such as evoked potentials and transcranial magnetic stimulation, and has the potential both to improve current diagnostic discrimination and to help guide future research into the underlying neural mechanisms.
Introduction
Migraine is the most frequent neurological disorder worldwide, affecting up to 12% of the general population (1). It brings a significant socioeconomic burden (2); the World Health Organization rates severe migraine in disability class VII (the most disabling), and as the 13th leading cause of disease burden for women worldwide (3). Despite its prevalence and impact, little is known about the pathophysiology of migraine: a consequence of our current lack of knowledge of the functional changes in this disorder is poor diagnosis and inadequate management of the condition.
There are three main problems with our understanding of migraine. Most fundamentally, its aetiology is poorly understood, with many different hypotheses proposed to underlie its trigger and mechanism. These include the depolarisation theory, based on cortical spreading depression (4), the serotonergic theory, involving an imbalance in brain 5HT (1), a similar theory suggesting a noradrenergic deficit (5–9), and a cerebrovascular theory (10). To an extent these different theories have now been reconciled by the concept of neurovascular disorder (11) and of general cortical hyper-responsivity (12,13). Additional underlying mechanisms have been proposed, including low magnesium and mitochondrial abnormalities, which could result in cortical instability (14).
Secondly, the sub-classification of migraine remains unsatisfactory. At present, the condition is broadly subdivided into migraine with aura (MA) and migraine without aura (MoA). However, given the variety of symptoms, this is likely to be an oversimplification – migraine may in fact refer to a spectrum of disorders rather than a single entity.
Finally, diagnosis itself is rendered difficult by the multitude of possible combinations of clinical symptoms that fall under the umbrella term ‘migraine’. Whilst the primary clinical manifestation is unilateral headache, this is seldom the sole complaint (15): migraineurs often present with systemic disturbances such as nausea, vertigo, incontinence or diarrhoea, which may also be accompanied by a sensory prodrome: an aura. Current clinical diagnosis relies upon subjective description of symptoms, which must conform to ICHD-II criteria as set out by the International Headache Society (IHS). The ICHD-II criteria are widely accepted as the gold standard for headache disorders, and in the hands of experienced neurologists are likely to be quite accurate in diagnosis. More problematic are the many patients who might be seen in primary care, where clinicians necessarily lack the experience needed for finer discrimination. Consequently, the criteria may be applied less stringently, leading to misdiagnosis. There is clearly a need for objective, quantitative tests that can supplement conventional means of diagnosis. Possibilities that have previously been investigated include transcranial magnetic stimulation (TMS), evoked potentials (VEP), and reaction time tasks, but they have yielded conflicting and confounding results (16). In the case of reaction times this is in part due to a lack of standardisation of protocol, over-complex protocols that lead to high error rates, the use of mean or median latency rather than whole distributions that better describe the data, and small numbers of trials – perhaps limited by the fatigue associated with manual and verbal response tasks.
The use of saccadic latency circumvents many of these problems. Recent studies into Huntington’s disease (HD) (17), Parkinson’s disease (PD) (18) and dementia (19) have used clearly defined saccadic tasks that are also simple for the subject, thus drastically reducing error rates and making results more robust. Furthermore, recent technological advances (20) enable the collection of the large datasets that – crucially –allow the mapping and analysis of distributions rather than simply reporting means. In addition, because in everyday life humans make two or three saccades every second, abundant data can be collected without risk of the fatigue to which manual response tasks are exposed. Finally, by using a highly standardised test procedure combined with objective quantitative parametric analysis, results can not only be compared between different centres, but related to a growing body of quantitative understanding of the neural decision mechanisms that underpin reaction time (21). More specifically, it appears that the saccadic latency is paradoxically long because of tonic descending inhibition that suppresses inappropriate rapid responses from lower levels until the predominantly cortical mechanisms of decision reach their conclusion. Thus reaction time is decision time, and as such reflects the activity of relatively diffuse neural networks spanning wide areas of cortex.
Models of decision and reaction time such as LATER (Linear Approach to Threshold with Ergodic Rate) (22), the simplest of its kind (23), can be used to interpret putative changes in migraineur latency in the context of decision theory. LATER postulates a decision variable that rises linearly in response to afferent information from a stimulus until it reaches a threshold or criterion level for initiating a response (Figure 1). On different trials the rate of rise, r, varies randomly as a Gaussian with mean µ and variance σ2; the reciprocal of reaction time, or promptness, therefore follows a Gaussian distribution. Reaction times themselves therefore generate a recinormal distribution, resulting in the well-known skewness when plotted as a histogram. The parameters µ and σ are most easily visualised by plotting histograms cumulatively, using a probit scale and reciprocal abscissa – a reciprobit plot (Figure 1). A third parameter is σE, representing the standard deviation of a subpopulation of very fast saccades. Interestingly these fast saccades are not present in all individuals in a population, so values for this parameter will exist for some individuals and not others. In this study we have therefore measured saccadic latency distributions in migraineurs and age- and sex-matched controls, characterising the data in terms of the underlying LATER parameters.
The LATER model. Left, in response to a stimulus, a decision signal S with an initial value S0 rises at a constant rate r until it reaches a threshold or criterion level ST, at which point a response is initiated. On different trials, r varies randomly with a Gaussian distribution (mean µ, variance σ2), giving rise to a skewed distribution of latency. Right: because the reciprocal of latency has a Gaussian distribution, if a cumulative histogram on a probit scale is plotted as a function of reciprocal latency (a reciprobit plot), a straight line is obtained. However, in some people, under some conditions, a small subpopulation of very fast saccades may be found, that usually lie on a second line (early distribution) of shallower slope, and variance σE2.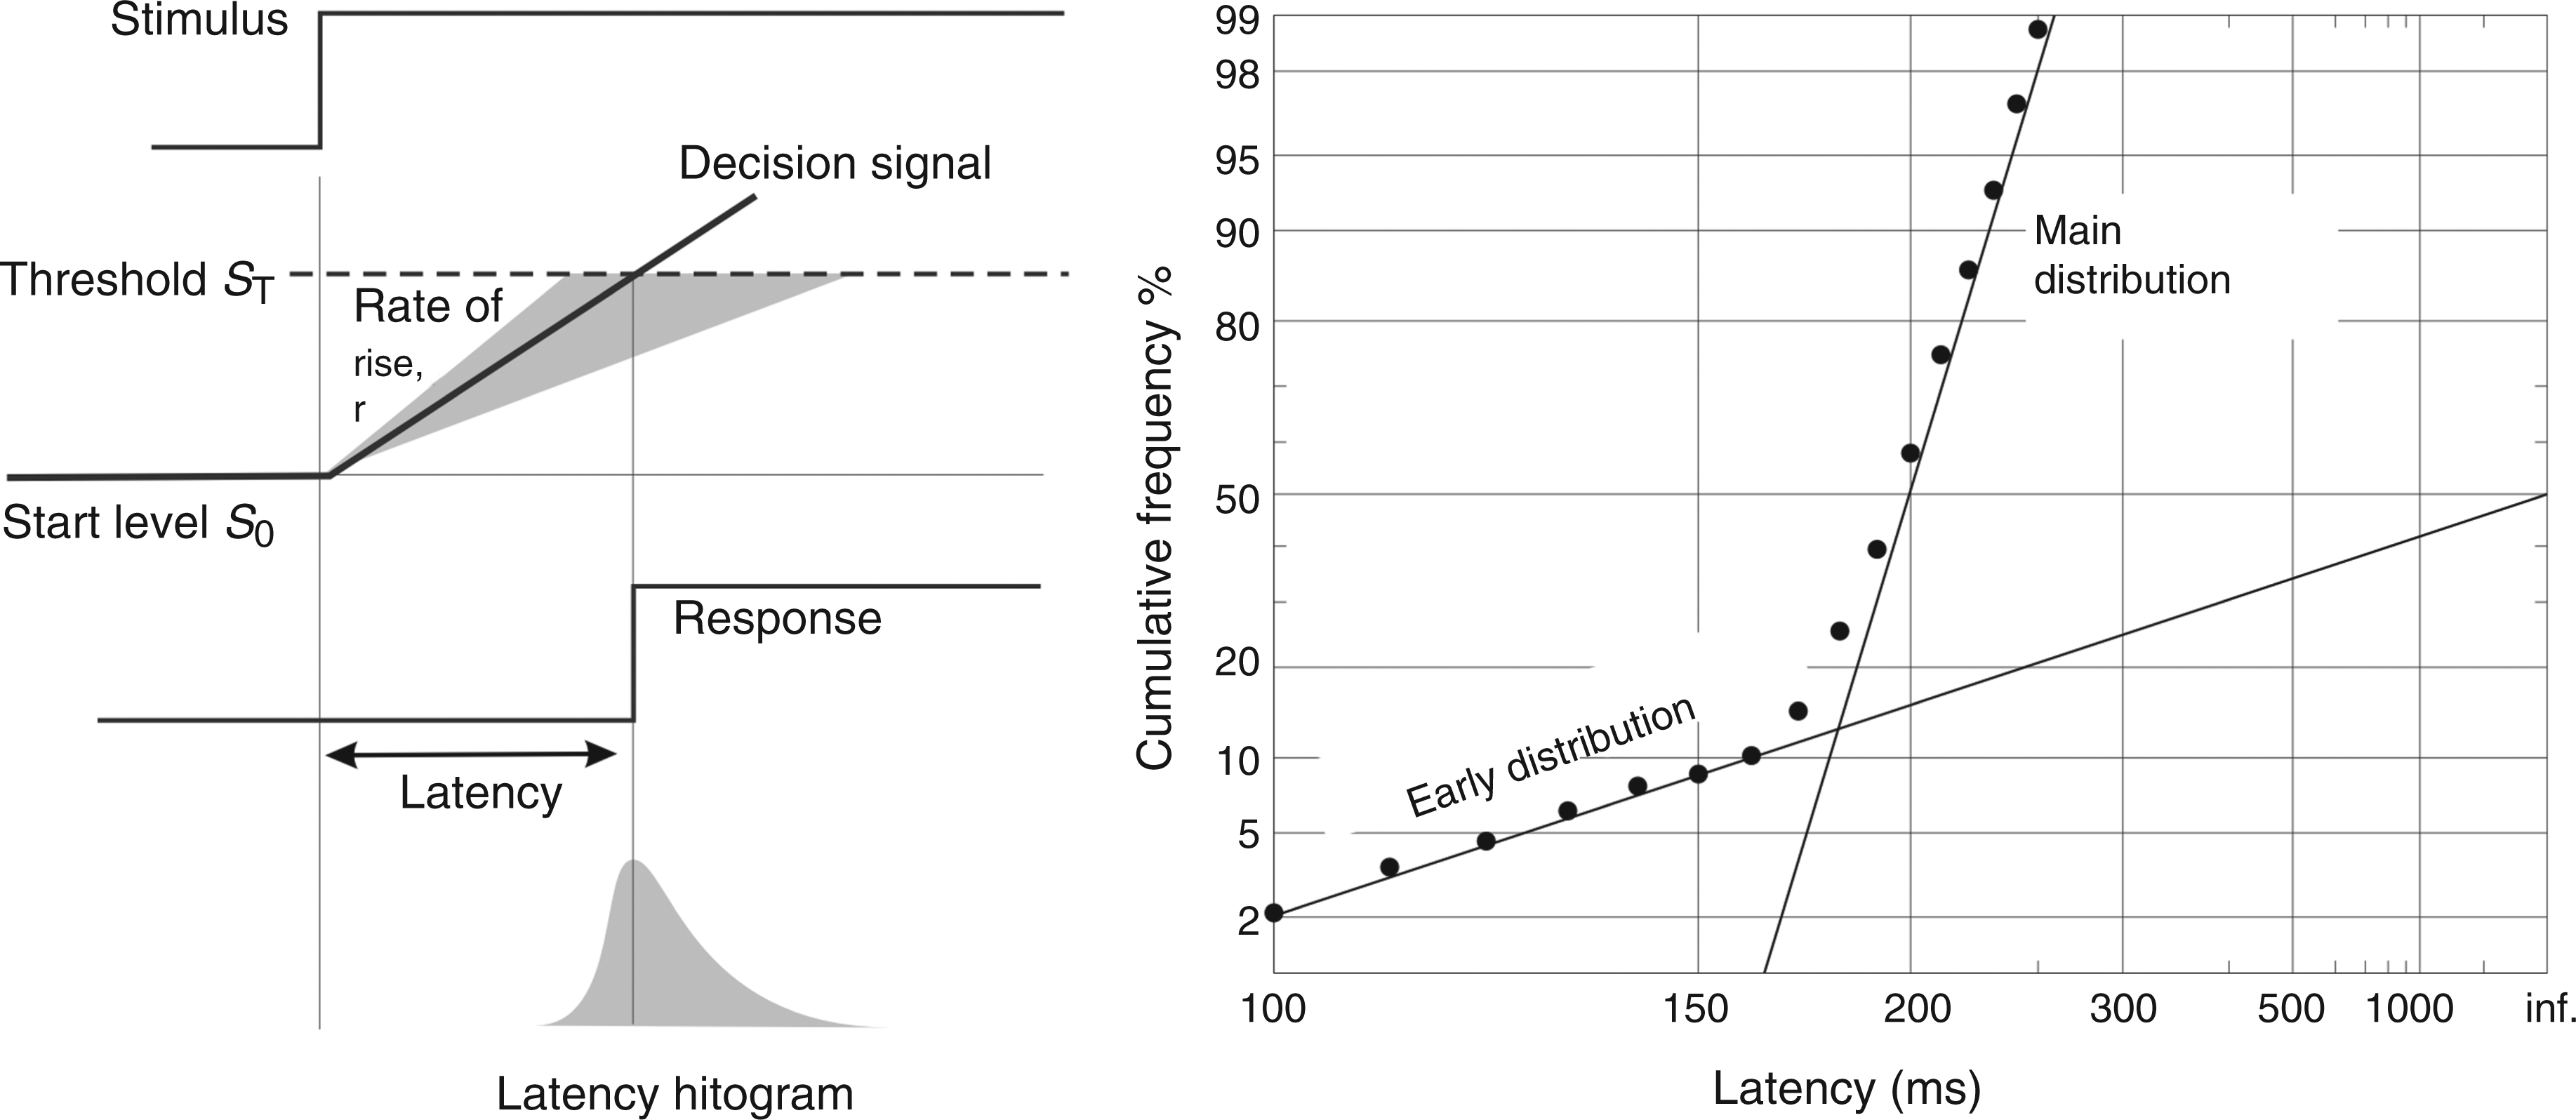
Over the last 10 years, there has been an increasing appreciation of the need to describe neurological disorders quantitatively. Much of our understanding and diagnosis of neurological disorders remains anecdotal and subjective. This study meets this need for quantitative neuroscience with a protocol that circumvents many concerns often associated with reaction time studies (16) by emphasising the desirability of studying distributions. In doing so, it is the first study that attempts to address altered neurological function in migraineurs in a manner permitting quantitative analysis.
Patients and methods
We performed a cross-sectional study of 32 migraineurs and 32 age- and sex-matched controls. Using oculometric recording we compared interictal saccadic latency distributions between migraineurs and controls.
Between 1 October 2007 and 13 March 2008 we recruited migraineurs and controls from the Cambridgeshire area, in addition to the annual Migraine Action Association© conference. We also used age- and sex-matched controls from a pre-existing database, available from a recent study using the same protocol. To be eligible, participants had to suffer at least two migraine attacks per year, as diagnosed using the International Classification of Headache Disorders (ICHD-II), and be aged 16–50. Exclusion criteria were neurological disorders such as stroke, multiple sclerosis, epilepsy, concussion within the past year, psychiatric disorders, visual disorders, and the use of medication known to affect neurological function, including that for migraine prophylaxis. The number of cases in the area during the study period determined the sample size. After verbal and written explanation, participants gave informed consent to partake in the study, the procedures of which had local ethical committee approval and conformed to the ethical standards described in the Declaration of Helsinki.
We recorded horizontal eye movements with a miniaturised, head-mounted, infrared reflection oculometer (Figure 2) (20) (12-bit resolution, sampling rate 1 kHz, low-pass filtered at 250 Hz, signal-to-noise ratio 45 dB). The device is comfortable and requires no head restraint because the target display moves with the head: three low-power red lasers mounted on the saccadometer project high-contrast 0.1° 13 cd m–2 target dots on to any convenient background (because of their very high contrast, the background reflectance has little effect), in a horizontal line at ±10° to the midline; to a first approximation these angles are independent of the distance between subject and background.
Above, a saccadometer in situ. The three lasers, visible at the top, project visual targets onto a wall or ceiling: because they move exactly with the head, no head restraint is necessary. Below, the experimental protocol. Participants were required to fixate a central target (black dot: fixation is indicated by a dashed circle). After a random foreperiod (1–2 s) the target moves 10° horizontally, randomly to the left or right, and the participant makes a saccade to the new target location: the time between target onset and response onset is the latency. The next trial begins with the target returning to the central location.
For each subject we recorded 200 trials, making 12,800 in all. Participants sat 1 m from a blank wall, and a trial began with the presentation of a central target, which, after a random foreperiod (1–2 s), was extinguished at the same time as a target to either the left or right (chosen at random to prevent anticipation) appeared. The target remained illuminated for 25 ms after the end of the resultant correct saccade, or for 1 s (with an incorrect or absent response), whichever was shorter. We instructed participants to track the movement of the target with their eyes as quickly as possible. The device is automatically calibrated by five preliminary trials to each side.
The software application LatencyMeter automatically eliminated trials contaminated by blinks, head movements and inattention; the data were then exported to the application SPIC, which analysed the data, providing estimates of the underlying LATER parameters by minimisation of the Kolmogorov–Smirnov one-sample statistic, and generating reciprobit plots.
The two fundamental parameters (see Discussion for interpretation) are the mean (µ) and standard deviation (σ) of the main distribution of reciprocal latencies. For some, but not all, individuals, a small subpopulation of early saccades was seen, distinct from the main distribution, which can be characterised by a third parameter, its standard deviation (σE).
To characterise any differences, we tested µ, σ and σE for normality, then appropriately used Student’s unpaired t-tests to compare µ and σE between populations and a Mann–Whitney U-test to compare σ. In addition, we used binomial analysis to evaluate the proportion of migraineurs and controls whose distributions contained an early component. We also performed a binomial logistic regression to yield sensitivity and specificity values compared to the ICHD-II gold standard in order to probe the diagnostic utility of oculometric recording.
Results
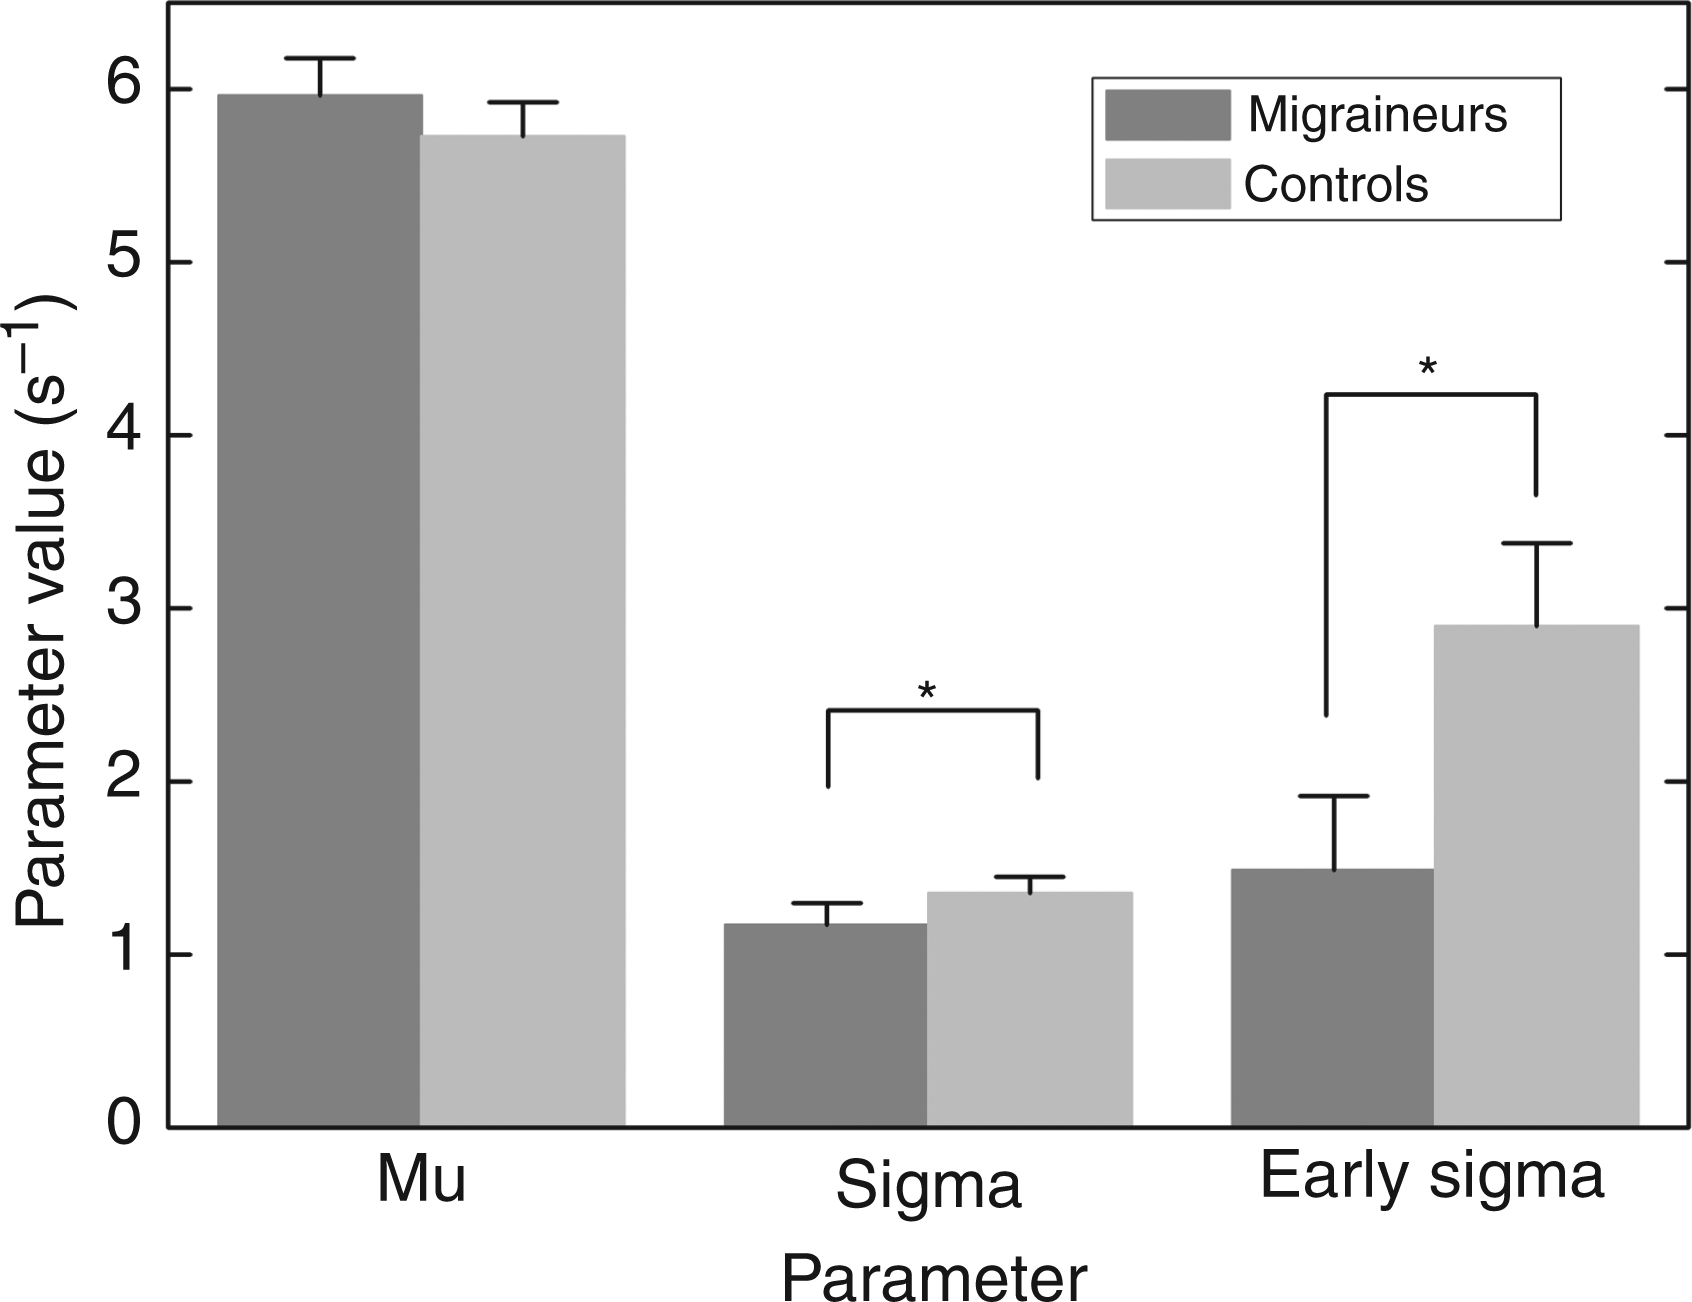
Kolmogorov–Smirnov one-sample tests showed that for all migraineurs (7 male and 25 female, 15 classified as MA and 17 as MoA, as well as for all controls (also 7 male and 25 female), reaction time distributions conformed (p > 0.05) to the recinormal distribution predicted by LATER, justifying the description of all distributions by means of the three LATER parameters, µ, σ and σE. Figure 3 shows a three-dimensional scatter plot for the two groups. The visual difference between migraineurs and controls is explained by differences in the variability of reaction times and the subpopulation of early saccades. To estimate the relative contribution of the three parameters (Figure 4), we first tested the datasets for normal distribution using the Shapiro–Wilk test, to ensure appropriate parametric and non-parametric analyses. For µ, the distributions did not depart significantly from normality, and a Student’s unpaired t-test (t = 0.811, p = 0.421) showed that there was no significant difference in migraineur µ (5.964 ± 0.217) compared with controls (5.726 ± 0.197). The distribution of σ across participants was found not to be Gaussian, and a Mann–Whitney test (W = 1194.5, p = 0.0386) showed that migraineurs have a significantly lower σ (1.010 ± 0.122) compared with controls (1.125 ± 0.094).
The distribution across participants of the latency parameters (µ, σ and σE) for migraineurs (n = 32, filled circles) and age- and sex-matched controls (n = 32, unfilled). Mean values of the parameters µ, σ and σE, for migraineurs (n = 32) and age- and sex-matched controls (n = 32). The error bars show ± 1 standard error; asterisks indicate significant differences (p < 0.05). Note that the significant difference in early sigma is due to the differing proportion of migraineurs and controls that exhibit an early component in their reaction time distributions: mean values of early sigma in migraineurs and controls do not differ significantly.
The early component, σE, is less straightforward: because of the criteria applied by SPIC, the data are forced into a bimodal configuration: if the overall fit of the model to the data is significantly better when the parameter σE is included, then an individual is allocated a σE value, otherwise not. The first question is whether there is a significant difference between the two groups as to whether, in this sense, they exhibit an early component at all. Whilst 18 out of 32 controls had a significant early component, the corresponding figures for migraineurs were only 10 out of 32, a significant reduction (one-tailed binomial comparison, z = –2.02, p = 0.043). When only the subjects with an early component are looked at, their σE distributions do follow a normal distribution. However, for those with a significant early component, we then found no significant differences between the values for σE (Student’s unpaired t-test, t = 1.356, p = 0.186) between migraineurs and controls. Parametric and non-parametric analysis, as appropriate, identified no significant differences between whole distributions or individual parameters of MA vs. MoA and male vs. female migraineurs (p > 0.05).
We also used binomial logistic regression to calculate log likelihood ratios (LLRs), generating LLR = aµ + bσ + cσE + d, where the constants a, b, c and d are given by: a = 0.346; b = –0.955; c = –0.409; d = 0.097 if σE > 0, otherwise 0.685. As expected from the previous analysis of individual components, σ has the largest weight, but the other two parameters contribute as well. To elucidate whether such an analysis has diagnostic potential, we carried out a sensitivity/specificity analysis, estimating whether any point drawn at random was more likely to be classified as belonging to the migraineur population than to the control population. Figure 5 shows the effect of varying the criterion LLR value: the optimum criterion value of 0.45 correctly classified around 70% of migraineurs and controls. This percentage probably reflects the heterogeneous nature of our migraine population: no doubt there will be differences in sensitivity and specificity values between different subtypes of migraine, for instance with and without aura (see Discussion).
Sensitivity/specificity plot, showing the proportion of correctly and falsely identified migraineurs as a function of the log likelihood ratio used as the discriminating criterion. The vertical dotted line indicates the criterion value (the log likelihood ratio in arbitrary units) providing the best overall values for sensitivity and specificity. This can be adjusted depending on the relative weight assigned to the danger of false positives and of false negatives.
Discussion
These results confirm our suggestion that saccadometry can provide a simple, quantitative and discriminative method for characterising neurological function in migraineurs. Interictal saccadic reaction time distributions differ between migraineurs and age- and sex-matched controls, with the migrainous population having a reduction in variability in reaction time and in the incidence of ‘early’ saccades. These results suggest an interictal, ever-present level of neurological dysfunction in the migraine brain, with implications both for improved diagnosis and for understanding the nature of the underlying neural impairment.
Our results are promising, with saccadometry alone yielding a sensitivity and specificity of 70%, using the ICHD-II as a ‘gold standard’. In a clinical setting this would of course be augmented by the diagnostician’s knowledge of the previous medical history, risk factors and response to treatment.
Potential limitations of our study include the sample size and the possible influence of other variables associated with migraine that can affect reaction time. The large number of saccades recorded from each participant, combined with the reproducible nature of saccades within an individual, goes some way to addressing any problem with sample size. In order to reduce the effect of external variables that could influence reaction time, we recorded from all participants in as far as possible an identical manner, with stringent exclusion criteria for individual trials; this makes it unlikely that the validity or our results, or their interpretation, could be affected by significant confounding factors.
Because of the heterogeneity of migraine, saccadometry is likely to yield different results in migraineurs with and without aura; as a result it may be possible to improve the sensitivity/specificity index. Current theories of migraine suggest that reversible cortical change is mainly a phenomenon seen in MA rather than MoA, so any changes in whole brain function detectable using saccadometry may be more pronounced when looking at MA. As reversible cortical pathology is a finding more consistently linked with MA rather than MoA (24,25), differences can be lessened by inclusion of MoA patients, if in fact their reaction times are no different to controls. Our sample size may mean that a difference between MA and MoA has been missed, but a larger study is under way to clarify this. Finally, including measures that in themselves do not show significant differences could still potentially improve discrimination, as although sub-threshold, they would nevertheless summate if they were correlated.
Based on this, we predict that the above figure of 70% should rise significantly when MA alone is looked at, potentially providing a useful objective adjunct to its diagnosis; applying the same experimental protocol in a larger study of migraineurs with and without aura should permit subgroup analysis.
Any conclusions about possible underlying neural mechanisms, based on functional interpretation of the changes in reaction time distribution that we have observed, must necessarily be tentative at this stage. Our findings confirm the necessity of characterising reaction time distributions rather than simply reporting mean latency, as illustrated by the fact that µ, the mean reciprocal latency, was no different between migraineurs and controls. Neither the significant reduction in σ, nor the reduced incidence of early responses, would have been noticed without distributional analysis. The observed decrease in σ in migraineurs, reflecting a decrease in the degree of randomness of saccadic latency, is striking. While there are several factors that have been observed to affect µ alone, or µ and σ together (22,26–29), changes to σ in isolation have seldom been reported. One notable – and in this context, highly significant – example is Usher’s study of latencies during periods of high response variability and of increased activity recorded from electrodes implanted in monkey locus coeruleus (30). Parametric analysis using LATER reveals that these periods are associated with a pure increase in σ without a change in µ, suggesting that the parameter σ may perhaps be regulated by the ascending noradrenergic projections. Likewise, an important study by Smyrnis and colleagues has shown (31) that σ is increased in patients with schizophrenia, when compared with controls, further corroborating the role of neurotransmitter systems in modulating reaction time and their variability in particular. Similar roles for other diffuse ascending projections have long been suspected (32–35). In this way, our findings provide considerable support for the view that noradrenergic activity is depressed in migraineurs (5–9). (However, a study (36) that appeared while the present paper was in submission reports, for a different task and without distributional analysis, an increase in the standard deviation of migraineur reaction time: clearly further work is necessary to try to clarify this point).
As far as the early responses are concerned, the observed reduction in their incidence may well reflect the same effect of reduced ascending noradrenergic activity. A reduction in the variability of normal saccadic responses is likely to be associated with a similar reduction in the variability of early responses (σE) as well (see for example reference 22); this reduction might well take σE values below the significance threshold that SPIC uses to decide whether an early component is present or not. Thus, the reduction in incidence is also adequately explained by the reduced noradrenergic activity. Secondly, it is clear from the LLR equation for sensitivity/specificity analysis that σ carries far more weight than σE and is thus the more robust and important difference to look at.
A feature of migraine that must also be borne in mind is its dynamic nature. A previous investigation (37) documented a progressive interictal reduction in habituation, which normalises during an attack. Because habituation (38) has been held to be the most reliable phenotypic biomarker for migraine (1), it is feasible that saccadic reaction time distributions, the biomarker proposed here, may also be modulated during the interictal period. Consequently, our static comparisons should perhaps be made when migraineurs are the same proportion of the way through their cycle, though as cycle length varies both within and between migraineurs, this presents a challenge. In addition, it would be enlightening to perform saccadometry longitudinally in individual migraineurs, to determine whether changes in reaction time parallel the previously documented changes in habituation and perhaps further our understanding of migraine neuropathology.
Saccadometry is a novel methodology for assessing cognitive function in migraine. We find it to be more rapid, clinically applicable, objective and quantitative than previously used methods; its associated analytical procedures are capable of providing scientific insights into the underlying neural mechanisms. Its discriminative power is promising, but true diagnostic utility remains to be characterised. While such a test may be less valuable in outpatient neurology clinics where experienced symptom interpretation and ICHD-II diagnosis is likely to be reliable, being rapid, inexpensive and easy to administer it may prove useful in community settings for general practitioners.
Footnotes
Funding
This research received no specific grant from any funding agency in the public, commercial, or not-for-profit sectors.
Contribution of authors
All authors except Professor Carpenter recorded data; otherwise all authors contributed equally to the design of the procedures, the analysis of data, and the preparation of the paper.
Conflict of interest
There are no conflicts of interest, except that Professor Carpenter is an honorary director of a company (Advanced Clinical Instrumentation) that distributes devices for measuring eye movements in the UK.