
Abstract
Aim: We assessed the pattern of regional white matter and grey matter abnormalities in patients with cluster headache (CH), using tract-based spatial statistics (TBSS) and voxel-based morphometry (VBM).
Methods: Using a 3.0 Tesla scanner, dual-echo, diffusion tensor and 3D T1-weighted scan were acquired from 15 patients with episodic CH and 19 healthy controls. TBSS analysis was performed using the FMRIB's Diffusion Toolbox. VBM was performed on the 3D T1-weighted images using SPM8.
Results: No diffusivity and volumetry abnormalities of brain white matter were detected in CH patients. Compared with controls, CH patients showed decreased grey matter volume in the right thalamus, head of the right caudate nucleus, right precentral gyrus, right posterior cingulate cortex, bilateral middle frontal gyrus, right middle temporal gyrus, left inferior parietal lobule and left insula (p < 0.001). They also had increased grey matter volume of the right cuneus. The results did not change after hemisphere mirroring in the five patients with left lateralized attacks. The decreased left middle frontal gyrus volume was significantly correlated with disease duration (r = −0.79, p < 0.001).
Conclusion: CH patients experience tissue abnormalities of grey matter regions that are part of the antinociceptive system, which is shared with other chronic pain conditions.
Introduction
Cluster headache (CH) is a primary headache condition characterized by recurrent short-lasting attacks (15–180 min) of excruciating unilateral periorbital pain accompanied by ipsilateral autonomic signs (lacrimation, nasal congestion, ptosis, miosis, lid oedema and redness of the eye). CH has a circannual and circadian periodicity with attacks clustered in bouts occurring during specific months of the year. CH is associated with trigeminovascular activation, neuroendocrine and vegetative disturbances. The precise mechanisms underlying the attacks, however, remain largely unknown (1).
Several metabolic and functional imaging studies (2–5) have indicated that a primary hypothalamic dysfunction might be involved in the pathogenesis of CH: the posterior part of the hypothalamus was shown to be activated during spontaneous and provoked attacks of the disease (2–5). In addition, a seminal voxel-based morphometry (VBM) study performed using a 1.5 Tesla (T) scanner has described an increased volume of the inferior posterior hypothalamus in these patients (2).
There are, however, data supporting a more global central nervous system (CNS) dysfunction in CH patients, similar to what has been described in migraine patients, and in patients suffering from chronic painful conditions (6). In particular, a neurovascular activation, involving not only the hypothalamus, but also the thalamus, basal ganglia, cingulum and frontal cortex, has been reported in CH patients during an attack (3). A few neurophysiologic studies (7,8) have also detected abnormalities of mid-latency and long-latency auditory evoked potentials pointing to a distributed alteration of high-order neuronal processes in these patients.
The development of methods which allow a voxel-wise assessment of brain damage distribution, including VBM (for volume quantification) and tract-based spatial statistics (TBSS) (for the assessment of white matter (WM) architectural integrity), allow the definition of patterns of abnormalities in various neurological conditions (9), including migraine (6). However, apart from the pioneering study of May et al. (2), these techniques have not been used systematically in patients with CH.
Against this background, we applied TBSS and VBM on images obtained using a 3.0 T scanner to define the patterns of regional WM and GM abnormalities in patients with episodic CH, outside the attack phase, with the ultimate aim of ascertaining whether structural brain abnormalities in these patients are restricted to the hypothalamus (and thus corroborating the results of May and coworkers (2)), or, conversely, tend to be more distributed in the CNS. To provide some clues about the nature of the detected changes, we also investigated their correlation with the duration of the disease.
Methods
Patients
Patients were recruited consecutively from the CH population attending the Outpatient Clinic, Department of Neurology, Scientific Institute and University Hospital San Raffaele. We studied 15 right-handed patients with episodic CH (2 women, 13 men, mean age = 44 years, range = 29–64 years; mean disease duration = 10 years, range = 1–28 years) in headache-free state for at least 1 month. All patients met the criteria of the International Classification of Headache Disorders for the diagnosis of CH (1). Ten patients suffered from a right-sided headache and 5 from a left-sided headache. Patients with hypertension, hypercholesteraemia, diabetes mellitus, vascular/heart diseases, and other major systemic and neurological or psychiatric conditions were excluded. At the time MRI was performed, none of the patients was taking a treatment for CH. Nineteen right-handed healthy volunteers, with no familial history of headache, no previous history of neurological dysfunction (including migraine) and a normal neurological exam, served as controls (7 women and 12 men, mean age = 42 years, range = 27–69 years). All participants were assessed clinically by a single neurologist, who was unaware of the MRI results. Local ethical committee approval and written informed consent from all participants were obtained before study initiation.
Image acquisition
Using a 3.0 T Intera scanner (Philips Medical Systems, Best, The Netherlands), the following sequences of the brain were obtained: 1) dual-echo (DE) turbo spin-echo (TSE) (TR/TE = 2200/24–120 ms, echo train length (ETL) = 6; flip angle = 90°, matrix = 256 × 256, field of view (FOV) = 240 × 180 mm2, 44 axial 3 mm thick slices); 2) fluid attenuated inversion recovery (FLAIR) (TR/TE = 11,000/120 ms, inversion time = 2800 ms, flip angle = 90°, matrix size = 256 × 256, FOV = 230 mm2, 28 4 mm thick contiguous, axial slices); 3) 3D T1-weighted fast field echo (FFE) (TR/TE = 25/4.6 ms; flip angle = 30°; matrix size = 256 × 256; FOV = 230 × 230 mm2; 220 contiguous, axial slices with voxel size = 0.89 × 0.89 × 0.8 mm); and 4) pulsed-gradient spin-echo; echo-planar (TE/TR = 58/8775.5 ms; flip angle = 90°; acquisition matrix size = 96 × 96; FOV = 240 × 240 mm2; 55 contiguous, 2.3 mm thick axial slices) with SENSE (acceleration factor = 2) and diffusion gradients applied in 35 non-collinear directions. Two optimized b factors were used for acquiring diffusion weighted images (b1 = 0, b2 = 900 s/mm2).
Image analysis
All MRI analysis was performed by a single experienced observer, unaware to whom the scans belonged. T2-weighted scans were analysed for the presence of lesions and FLAIR scans were always used to increase confidence in their identification. Lesion volumes (LV) were measured using a local thresholding segmentation technique (Jim 4.0, Xinapse System, Leicester, UK).
DTI MRI analysis: TBSS
Diffusion-weighted images were first corrected for distortions caused by eddy currents. Then, using the FMRIB's Diffusion Toolbox (FDT tool, FSL 4.1, http://www.fmrib.ox.ac.uk), the diffusion tensor (DT) was estimated in each voxel by linear regression (10) and fractional anisotropy (FA) and mean diffusivity (MD) maps derived. TBSS analysis was used for voxel-wise analysis of whole brain WM diffusion tensor imaging (DTI) measures (http://www.fmrib.ox.ac.uk/fsl/tbss/index.html). In detail, individual FA images were non-linearly registered to the FMRIB58_FA atlas (a high-resolution average of 58 FA images from healthy men and women aged between 20–50 years, in the same space of the Montreal Neurologic Institute (MNI)152 standard space image, at 1 × 1 × 1 mm resolution) provided within FSL, and then averaged. The resulting mean FA image was thinned to create a WM tract ‘skeleton’, which was thresholded at a FA > 0.2 to include only WM voxels. The FA values lying at the centre of tracts were further projected onto the FA skeleton (11). The individual registration and projection vectors obtained during the above-described process were also applied to MD data.
Voxel-based morphometry analysis
On 3D FFE images, intracranial volumes (ICV) were calculated using the cross-sectional version of the Structural Imaging Evaluation of Normalized Atrophy (SIENAx) software, as the sum of GM, WM and cerebrospinal fluid (CSF) volumes. VBM and the SPM8 software (www.fil.ion.ucl.ac.uk/spm/software/spm8) were used to assess differences in GM and WM volumes between CH patients and controls, as described elsewhere (12). First, 3D FFE images were segmented in GM, WM and CSF by using the standard unified segmentation model in SPM8. Then, GM and WM segmented images of all participants, in the closest possible rigid-body alignment with each other, were used to produce a GM and WM templates and to drive the deformation to the templates. At each iteration, the deformations, calculated using the Diffeomorphic Anatomical Registration using Exponentiated Lie algebra (DARTEL) registration method (13), were applied to GM and WM, with an increasingly good alignment of participant morphology to produce templates. Spatially normalized images were then modulated to ensure that the overall amount of each tissue class was not altered by the spatial normalization procedure. Because the DARTEL process warps to a common space that is smaller than the MNI space, an affine registration between the GM template of our participants and the GM prior of SPM8 was performed. The transformation was then applied to all modulated images by modifying the header to avoid resampling (14). Finally, the images were smoothed with an 8 mm full-width at half-maximum Gaussian kernel.
Statistical analysis
Demographic characteristics were compared between groups using the non-parametric Mann-Whitney U-test.
MD and FA voxel-wise differences between CH patients and controls were tested using a permutation-based inference tool for non parametric statistical thresholding (randomized program within FSL) (15) and two-sample t-tests, adjusting for participants’ age and sex. The number of permutation was set to 5000. The resulting statistical maps were thresholded at p < 0.05, with correction for multiple comparisons (family-wise error (FWE) corrected) at a cluster level using the threshold-free cluster enhancement (16) option in the randomized tool in FSL. Results were also assessed at an uncorrected statistical level (p < 0.05).
Between-group comparisons of smoothed GM and WM maps were assessed using analyses of covariance, including age, sex and ICV as covariates. The VBM analysis was repeated after mirroring the hemispheres for the five patients with a left-sided lateralization of the attacks. The correlation between regional GM/WM abnormalities and disease duration was assessed using SPM8 and a linear regression analysis. For all the analyses run with SPM, results were assessed at a threshold of p < 0.05 corrected for multiple comparisons (FWE). Based on previous VBM studies (6,17,18), our a priori hypothesis regarding the involvement of pain transmitting structures prompted us to use an uncorrected threshold of p < 0.001 throughout the whole brain.
Results
Sex and age did not differ between CH patients and controls (p = 0.25 for sex and p = 0.53 for age).
Non-specific brain T2-hyperintense lesions were detected in nine CH patients and three healthy controls. Mean T2 LV was 0.4 ml (SD = 0.05 ml) in CH patients and 0.3 ml (SD = 0.09 ml) in healthy controls (not significant).
TBSS analysis revealed no significant differences in MD and FA values of the WM skeleton between CH patients and healthy controls (using both a corrected and an uncorrected threshold). VBM analysis showed no difference of regional WM volume between CH patients and healthy controls.
Compared with controls, CH patients had significant reduced GM volume (p < 0.001, uncorrected) of the right thalamus, right posterior cingulate cortex, left inferior parietal lobule, head of the right caudate nucleus, bilateral middle frontal gyrus (MFG), right middle temporal gyrus, right precentral gyrus and left insula (Figure 1). Table 1 summarizes the MNI coordinates, cluster extents and T values of all these regions. The opposite comparison showed an increased volume of the right cuneus (MNI coordinates: 18, −104, 6; cluster extent = 89; t value = 4.93) in CH patients vs. healthy controls. The results did not change after hemisphere mirroring in the five patients with left lateralized attacks (Table 1). None of the analysis showed any abnormality involving the hypothalamus.
Areas showing significant grey matter (GM) volume differences (p < 0.001, uncorrected) between cluster headache (CH) patients and healthy controls, superimposed on a high-resolution T1-weighted template. Areas with reduced GM volume in CH vs. controls are shown in cyan; areas with increased GM volume in CH vs. controls are shown in red. See text for further details. Regions showing significant reduced grey matter volume in patients with cluster headache compared with healthy controls (p < 0.001, uncorrected) without and with mirroring the hemispheres in the five patients with a left lateralization of the cluster attacks Abbreviations: MNI: Montreal Neurologic Institute, L: left, R: right, BA: Brodmann area. p < 0.05, family-wise error corrected.

In CH patients, decreased left MFG volume was significantly correlated with disease duration (r = −0.79, p < 0.001) (Figure 2).
Graphical localization (A) and scatter plot (B) of the correlation (p < 0.001, uncorrected) between decreased grey matter volume in the left middle frontal gyrus and disease duration in patients with cluster headache.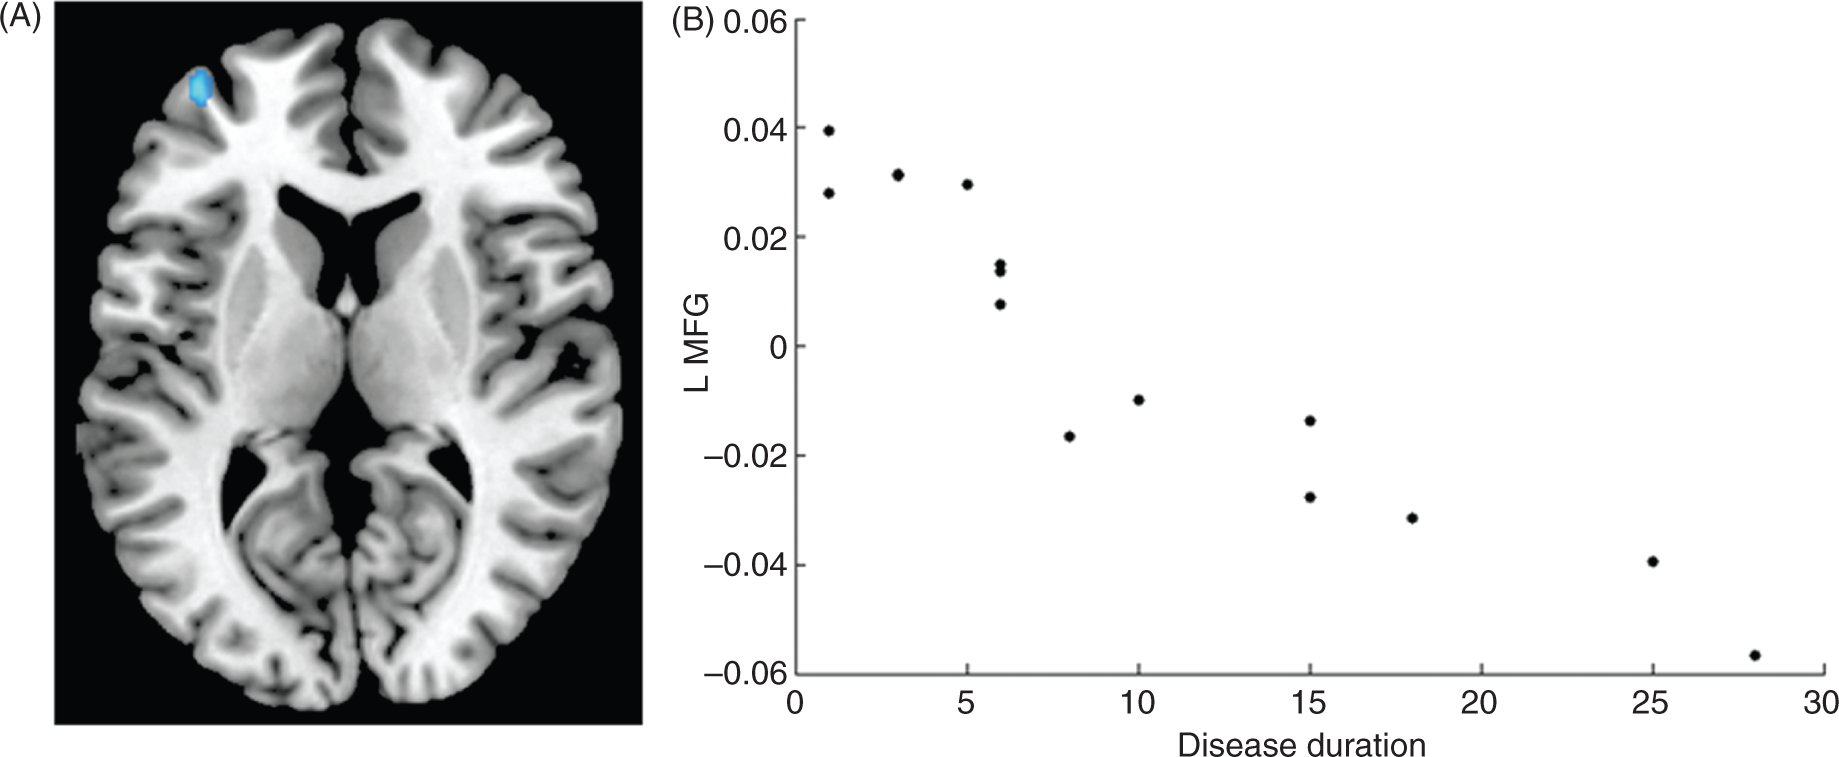
Discussion
In this study, we wished to characterize the topographical distribution of abnormalities in the brain WM and GM in patients with CH by using two widely applied methods that allow an analysis of MR images at a voxel level.
The first intriguing result of this study is that the WM outside focal T2-weighted lesions (NAWM) is spared in patients with CH, as shown by the absence of DTI MRI and volumetric abnormalities assessed with TBSS and VBM. Using different methods of analysis (19,20), previous DTI MRI studies have demonstrated subtle abnormalities to the NAWM of patients with migraine, with a selective involvement of the thalamocortical tracts in all and of the optic radiations in migraineurs with aura. All the studies of patients with migraine (19–21) found no correlation between the presence and extent of DTI MRI abnormalities and the number of attacks and disease duration, suggesting that the observed DTI MRI changes might represent a phenotypic biomarker of the disease, reflecting a congenital condition rather than a process related to disease progression over time.
The notion that structural abnormalities of specific CNS regions might contribute to characterizing the different headache conditions, differentiate their clinical manifestations and guide therapeutic interventions has been postulated by several authors (6,22,23). In patients with CH, the colocalization of abnormalities of function and structure in the posterior hypothalamus (2) has raised the hypothesis that this structure might be the trigger zone for the onset of the attacks and has led to the use of electrode stimulation of this region for CH patients unresponsive to pharmacological medications (24). It is worth mentioning that functional hypothalamic abnormalities have been detected mostly during cluster attacks (4,25), whereas they were not detected in CH patients outside this phase. In addition, only one VBM study (2), which enrolled 25 CH patients and 29 healthy controls, has described an increased volume of the posterior hypothalamus in both CH patients during active headache and headache-free state. Several factors might contribute to explain the discrepancy between our results and previous findings (2). First, we used a higher field strength scanner (3.0 T vs. 2.0 T). Second, the geometry of the sequences used for the VBM analysis differed between the two studies. Third, and probably most importantly, we applied the SPM8-VBM procedure, which has several advantages over the one applied by May et al. (2), including the production of a study-specific template, the use of a better registration algorithm and a different modulation of regional volume differences. Fourth, May et al. (2) enrolled only male patients with a wide range of ages (25–74 years), and both factors (gender and age) are known to influence regional variation of GM volumes (26). Finally, all our patients were out of the attacks at the time of MRI acquisition, whereas the majority of those studied by May et al. (2,3,25,27) were assessed during the acute phase. Clearly, the absence of significant structural abnormalities in the hypothalamus in our study does not rule out an involvement of this area in the pathogenesis of CH. In this perspective, it is tempting to speculate that hypothalamic volume abnormalities revealed in the previous VBM study (2) could reflect a dynamic process, which might tend to reverse outside the attack phase. Such an hypothesis is also supported by the results of functional and metabolic studies (2–5).
The analysis of GM volume revealed a decreased volume in several cortical and subcortical regions in CH patients vs. healthy controls, including the thalamus, caudate nucleus, posterior cingulate cortex, prefrontal cortex, sensorimotor cortex, parietal cortex, insula and middle temporal cortex, which are part of the so-called ‘pain-matrix network’ and are normally involved during the processing of painful stimuli, as reported by previous functional imaging studies (for a review see (28)). These results are in agreement with those from several morphometric studies in patients suffering of chronic painful conditions, including migraine (6), chronic daily headache (17), chronic back pain (18), and chronic pain due to primary hip osteoarthritis (29). All these studies have suggested a decreased GM volume in pain-transmitting areas independently of the primary origin of the pain. Indeed, as recently reviewed by May et al. (6), at present at least 30 studies have demonstrated GM tissue loss in 14 different chronic pain syndromes. This supports the notion that patients with chronic pain share a common pattern of GM injury in multi-integrative structures known to be involved during the experience and the anticipation of pain (23). Notably, we also found reduced volume in the right caudate nucleus. Nociceptive information from the trigeminal nuclei may reach the striatum independently of the thalamus because direct projections from lamina I neurons of the trigeminal spinal nucleus to the putamen and caudate nucleus have been demonstrated (30). In addition, the caudate is considered a key region of the network believed to be involved in acupuncture analgesia (31). A recent study (32) found an increased GM volume of the caudate nuclei in migraine patients with high-frequency attacks compared with patients with low-frequency attacks, suggesting once again that GM abnormalities might change over time in painful syndromes.
The analysis of regional abnormalities of GM volume also revealed an increased volume in the right cuneus in CH patients vs. healthy controls. Although visual symptoms under the form of aura or aura-like warning have been reported in up to 14% of patients with CH (33,34), none of our patients had such a complaint. Functional abnormalities in the visual network restricted to V1 have been found in a previous resting state functional MRI study (35) and might reflect visual system rewiring secondary to the repetition of retro-orbital pain and photophobia during the attacks (33).
Once established that GM abnormalities do occur in CH patients, we wished to gain some insight into the nature of such abnormalities. The correlation we found between disease duration and left MFG volume suggests that the observed abnormalities might be the consequence of the repetition of the painful stimulation over time. This result agrees with other morphometric studies in chronic pain patients (17), including migraine (6). Interestingly, in this latter group of patients MFG decreased volume was associated with executive dysfunctions (36).
In conclusion, our results show that CH patients have a pattern of regional GM abnormalities that mirrors the one observed in several chronic painful conditions, with a preservation of WM architecture. Longitudinal studies are now warranted to define whether these GM abnormalities vary in the different stages of the disease (acute vs. chronic phase) and whether they reverse after the initiation of treatment.