
Abstract
Introduction: Photic driving is believed to be increased in migraineurs and has been interpreted as a sign of cortical hyperexcitability. However, most previous studies have included patients in various phases of the migraine cycle. The results are, therefore, difficult to interpret as neurophysiological abnormalities tend to accumulate close to the attack in migraineurs.
Subjects and Methods: We recorded steady state visual evoked EEG-responses (SSVEPs) for 6, 12, 18 and 24 Hz flash stimuli from 33 migraineurs without aura, eight migraineurs with aura and 32 healthy controls. Interictal recordings were compared pair-wise with recordings before, during and after attack, as well as with EEGs from healthy controls. Driving power was also correlated with sensory hypersensitivity and severity of migraine.
Results: Between attacks, driving responses to 18 Hz and 24 Hz were attenuated in migraineurs without aura. Driving power of 12 Hz increased before the attack. Attack trigger sensitivity, photophobia, pain intensity and a family history of migraine were related to decreased and/or symmetric photic driving.
Conclusions: Earlier results may have overestimated the driving response in migraine due to inclusion of recordings during the preictal interval and/or habituation among controls. Abnormal photic driving may be related to the pathophysiology of clinical sensory hypersensitivity.
Introduction
Increased photic EEG driving amplitudes, i.e. steady-state visual evoked potentials (SSVEPs), are reported in migraineurs (1–10). Golla and Winter (9) were the first to find prominent photic driving to medium stimulation frequencies (18–24 Hz) in headache patients compared to declining responses from 18 Hz and above in headache-free subjects, the so-called ‘H-response’. Also, with the use of quantitative EEG (QEEG), flash rates above 20 Hz seemed to evoke the largest responses in migraineurs (2–7,10). A replication of former results is warranted for two reasons. First, QEEG studies should preferably be done blindly to avoid selection bias (11), but only two studies describe a blinded design (4,5). Second, in later years, many studies have revealed a larger response to stimuli in migraineurs just before the attack with a variety of neurophysiological methods (12–19). Results from the preictal period have usually been merged with those from the true interictal period in most photic response studies (2,7–10,20–24). However, Nyrke et al. (20) suggested that increased photic driving could be explained by the inclusion of EEGs from the preictal phase (20), but no data about photic driving in the preictal period in migraine seem to be available.
Accordingly, our aim was to perform a blinded study of the EEG-driving pattern to intermittent photic stimulation frequencies above and below 20 Hz in migraineurs, analyzing results from the different ictal phases separately. We also explored the relationship between photic driving and trigger factors, photophobia and severity of migraine.
Subjects and methods
Subjects
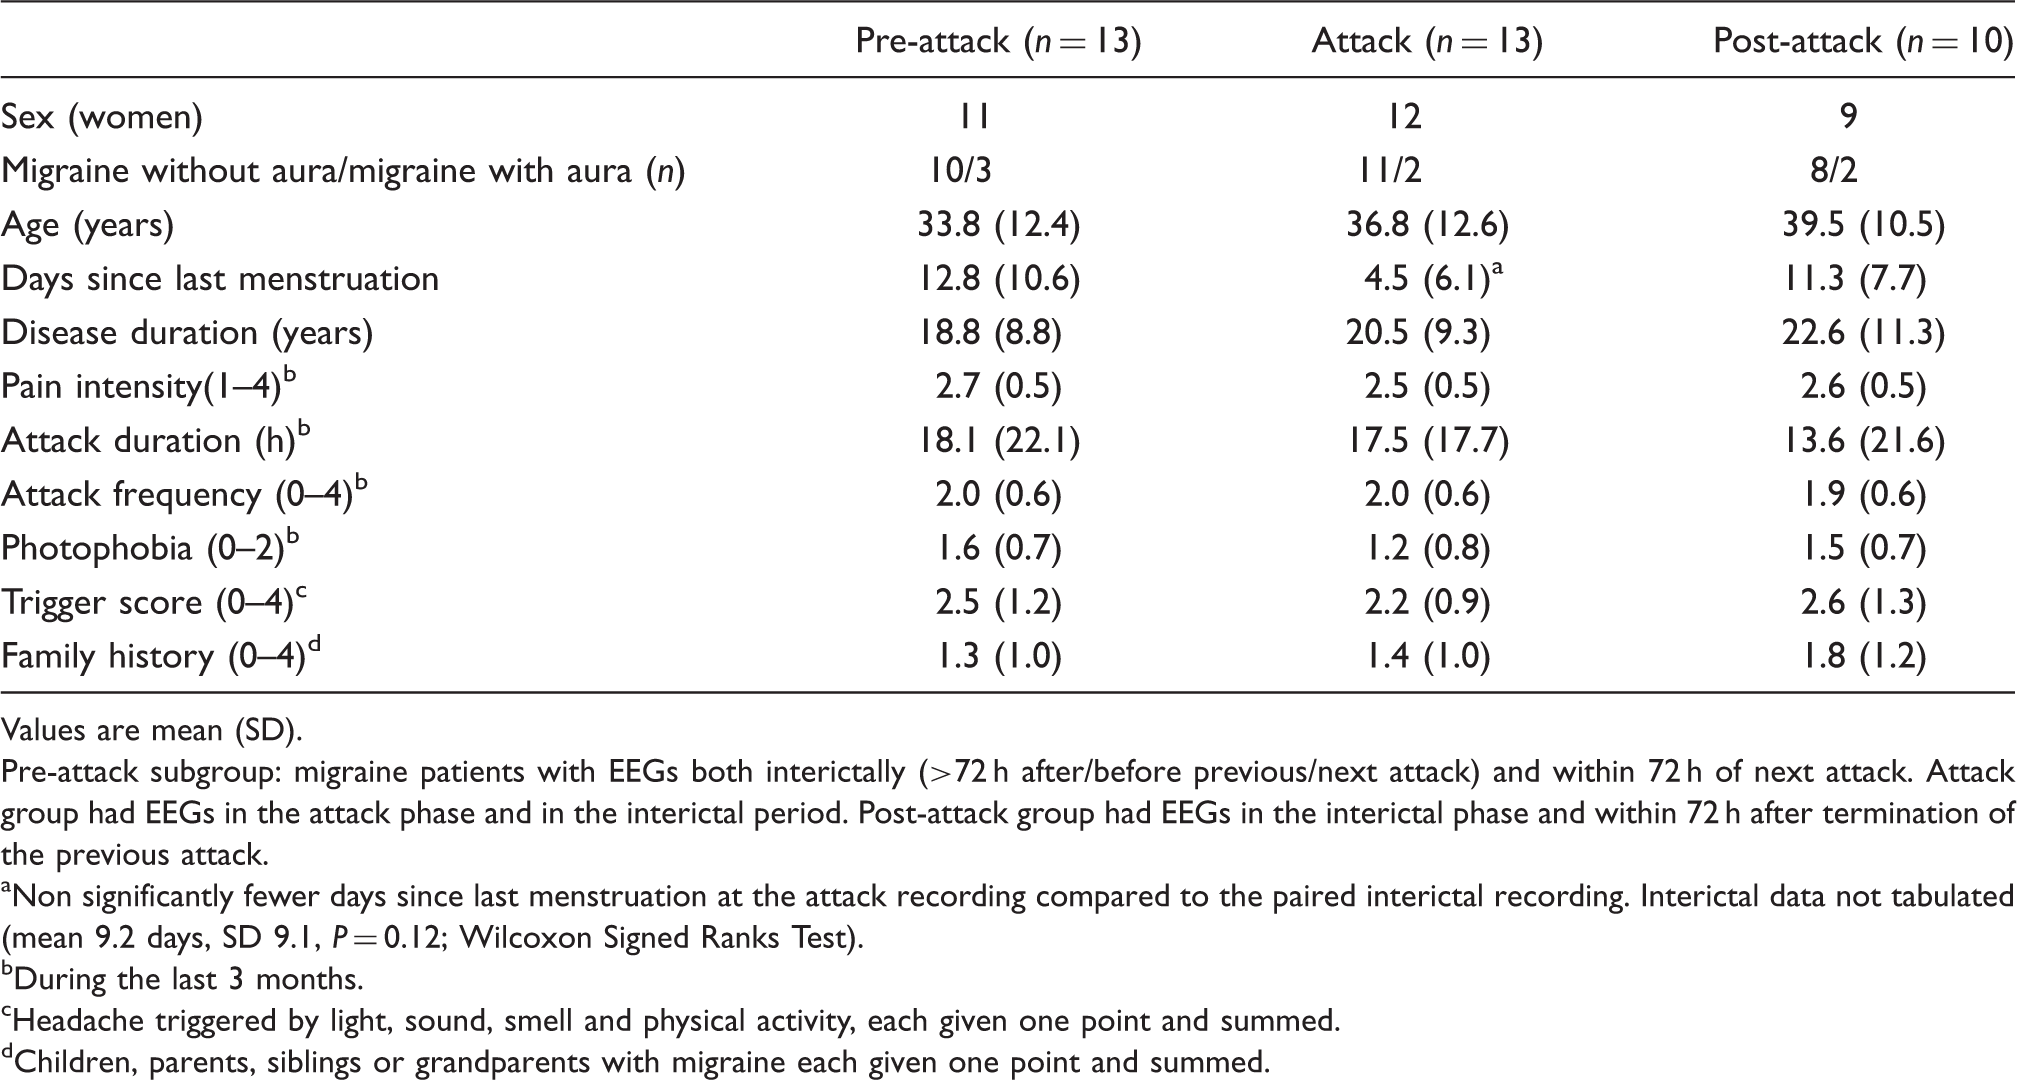
Background data for the group studied in the interictal interval a

Values are mean (SD).
>72 h from attack. 25 migraineurs had at least one EEG more than 72 h from the past and future attack. From the control group an EEG from an age- and sex-matched control with the same recording order was chosen (n = 18).
n = 19, 5, 18 in the three groups due to incomplete data.
0, no drinking; 1, less than once a month; 2, once a month; 3, 2–4 times a month; 4, 2–3 times a week; 5, ≥4 times per week.
During the last 3 months.
Headache triggered by light, sound, smell and physical activity, each given one point and summed.
Children, parents, siblings or grandparents with migraine each given one point and summed.
No significant differences (Wilcoxon Signed Ranks Test, Mann–Whitney U-test, or Fisher’s exact test) were found between groups.
Study protocol
We collected demographic data from all included subjects with questionnaires. Migraineurs also reported data on the clinical presentation of their headache; i.e. what triggered their headache, disease duration, attack duration, attack frequency, headache intensity, and photophobia. In addition, they completed detailed headache diaries, starting at least 2 weeks before and ending at least 2 weeks after the test period. It included entries on pain characteristics for each headache attack, accompanying symptoms and consequences for work and leisure. The subjects had three EEGs recorded on different days. The detailed information from the headache diaries during the test period enabled us in retrospect to pinpoint the exact temporal relation of the EEG recording to the headache attack. The recordings were classified as preictal or postictal if obtained within a time window of 72 h before or after the attack respectively. We defined EEGs during attack or between two closely spaced attacks as ictal, and those recorded more than 72 h before and after an attack as interictal. Twenty-five migraine patients had an interictal recording. To ensure optimal comparability of the control EEG recordings (n = 18), each control for a patient with an interictal migraine recording was matched for age and sex. The EEG recording was the same number in the sequence as that of the patient. This matching was done by a computer. This procedure enabled us to compare preictal, postictal and ictal recordings with interictal recordings in a paired analysis.
Data loss occurred in two patients who were not willing to undergo all three EEG recordings because headache worsened after the tests. One of them did not complete the diary. For group comparisons and correlations we used interictal recordings. EEG recording and analysis were done in a blinded manner without knowledge of disease status. The study was carried out according to the Helsinki Declaration and approved by The Regional Ethics Committee.
EEG recording and stimulus procedure
The EEG was recorded with eyes closed for approximately 30 min. The first 5 min was undisturbed; thereafter a motor test and the photostimulation trains followed. Only the latter is reported in the present paper. Spectral EEG data (26–28), as well as other neurophysiological investigations (12–14) from the same study sample have been reported previously. For a more detailed description of the EEG recording and the inclusion process, see Bjørk et al (28).
Twenty-one scalp electrodes were positioned according to the 10–20 system supplemented by lateral anterior temporal electrodes (29) and channels recording horizontal and vertical eye movements and ECG. EEG was recorded digitally with Nervus 3.0. The sampling rate was 256 per second. The EEG was recorded with a common cephalic reference between F4, Fz, C4, and Cz (FC2 according to the 10–10 electrode system (30)), but re-referenced before analysis with the average reference protocol in Nervus 3.0. The band pass filter setting was 0.5–70 Hz. The subjects were lying down in a dimly lit room. Stimulation was given with the standard photostimulator of Nervus 3.0 at maximum intensity (step 8). Flash power was 1.0 J. The stroboscope was positioned 25 cm (1st train) and 15 cm (2nd train) from the eyes. We measured the illumination to be 20 lux s/pulse at 20 cm with an integrating photometer with autoreset and a Philips 3355 oscilloscope. Intermittent photic stimulation was presented for 10 s for each frequency with a 10 s break in between. The stimulation procedure included the following frequencies 6-12-18-24-6-12-18-24-30-36-40-30-36-40. This flash train was delivered two times. Hence we obtained four 10-s segments for each flash rate. Thirty, 36 and 40 Hz stimuli were applied because they belong to a standard EEG protocol for evaluation of epileptiform photoparoxysmal activity. The latter responses were not analyzed because we intended to focus on the frequencies that earlier has been found to be abnormal in migraineurs (2,10,20) and because these responses are of a very low amplitude. In addition we found it important to restrict the number of variables as a large number of analyses would increase the likelihood of coincidentally significant results. For these reasons we evaluated 6 Hz, 12 Hz, 18 Hz, and 24 Hz photic responses in the present study.
Quantitative analysis
We manually selected the EEG segments during visual stimulation. We restricted the analysis to the occipital channels (O1 and O2) because the strongest sources of the SSVEP signals are in the occipital cortex (31,32). If not contaminated by artefacts, the entire stimulus period (10 s) was sampled. In the case of occasional movement artefacts, we used the longest artefact-free part of the segment. The Fast Fourier transformation application included in the Nervus 3.0 software yielded power per Hertz (µV2/Hz) spectra with the following settings: 0.25 Hz frequency resolution, half-overlapping blocks and a hamming window applied over the entire 4-s epoch. The FFT spectral curves from the four segments were averaged to reduce variance. We estimated the narrow-band driving power for each of the stimulus frequencies in question (X) ± 0.25 Hz. According to Nyrke et al. (7,20), the contribution to the evoked signal from outside the X ± 0.25 Hz band is negligible. Band power values from O1 and O2 were averaged for the main analysis. Asymmetry was calculated as the sign-free difference between left and right electrode: ABS (O1–O2).
Statistical analysis
We used SPSS v17.0 for statistical computations. Where possible non-parametric tests were used because the power variables were not normally distributed and the MA group was small. Before parametric tests all variables were Ln-transformed to obtain normal distribution. Group effects on the response pattern in response to increasing flicker frequencies were evaluated with repeated measures analysis of variance (rANOVA). We used frequency (6-12-18-24 Hz) as the within-subject factor, driving power for each frequency as the dependent variables and diagnostic group as the between subject factor (MA, MwoA and Ctr). Thereafter three post-hoc two-group rANOVAs were performed to determine if any group was significantly different from the others. Sphericity was ascertained for most of the tests; if needed the Greenhouse–Geisser correction was applied.
Driving power for each flash frequency in MA, MwoA and Ctr was separately compared with the non-parametric Kruskal–Wallis test. Contrasts were explored with Mann–Whitney U-tests. In migraineurs we used the paired Wilcoxon signed ranks test to compare differences between the interictal interval and the preictal, ictal and postictal period and Spearman’s rho to explore correlations between trigger sensitivity score (scale 0–4; headache triggered by light, sound, smell and physical activity, each given one point and summed), attack duration, headache intensity (1–4), family history of migraine (scale 0–4; where children, parents, siblings or grandparents with migraine each was given one point and summed), photophobia (0–2), headache history (number of years with headache) and headache frequency (1–4). Correlations and paired tests were performed on the combined migraine group to preserve statistical strength. Fisher exact test was used for categorical variables. To avoid excessive type II errors (33–35) statistical significance was kept at 0.05.
Results
Background data on different subgroups used in paired comparisons
Values are mean (SD).
Pre-attack subgroup: migraine patients with EEGs both interictally (>72 h after/before previous/next attack) and within 72 h of next attack. Attack group had EEGs in the attack phase and in the interictal period. Post-attack group had EEGs in the interictal phase and within 72 h after termination of the previous attack.
Non significantly fewer days since last menstruation at the attack recording compared to the paired interictal recording. Interictal data not tabulated (mean 9.2 days, SD 9.1, P = 0.12; Wilcoxon Signed Ranks Test).
During the last 3 months.
Headache triggered by light, sound, smell and physical activity, each given one point and summed.
Children, parents, siblings or grandparents with migraine each given one point and summed.
Effect of diagnosis on photic driving
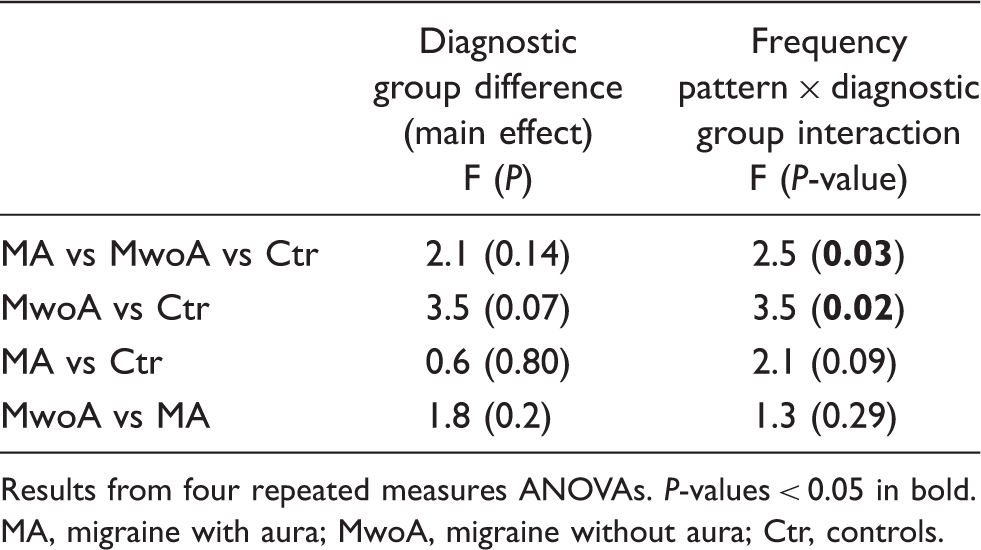
The driving pattern to flicker stimuli of increasing frequencies was different in MwoA and Ctr (Figure 1, Tables 3 and 4). For MwoA patients the response curve appeared raised for 6 Hz driving power, but thereafter decreased for higher frequencies (driving power versus frequency interaction; P = 0.03).
Mean driving power in migraineurs with aura (MA), migraineurs without aura (MwoA) and Controls (Ctr) for 6, 12, 18 and 24 Hz flicker stimulation. The response patterns are different between the three groups (P = 0.028) and the main difference is between MwoA and Ctr (P = 0.019, see Table 4). When driving power is separately compared between groups, MwoA patients have significantly attenuated 18 Hz and 24 Hz power compared to Ctr (Mann–Whitney tests, P = 0.007 and P = 0.021, respectively). Interictal (>72 h from the attack) driving power for 6, 12, 18 and 24 Hz flash stimulation P-values < 0.05 in bold. Kruskal–Wallis test. Migraineurs without aura versus controls P = 0.007. Migraineurs without aura versus controls P = 0.021. Driving power related to group and frequency Results from four repeated measures ANOVAs. P-values < 0.05 in bold. MA, migraine with aura; MwoA, migraine without aura; Ctr, controls.
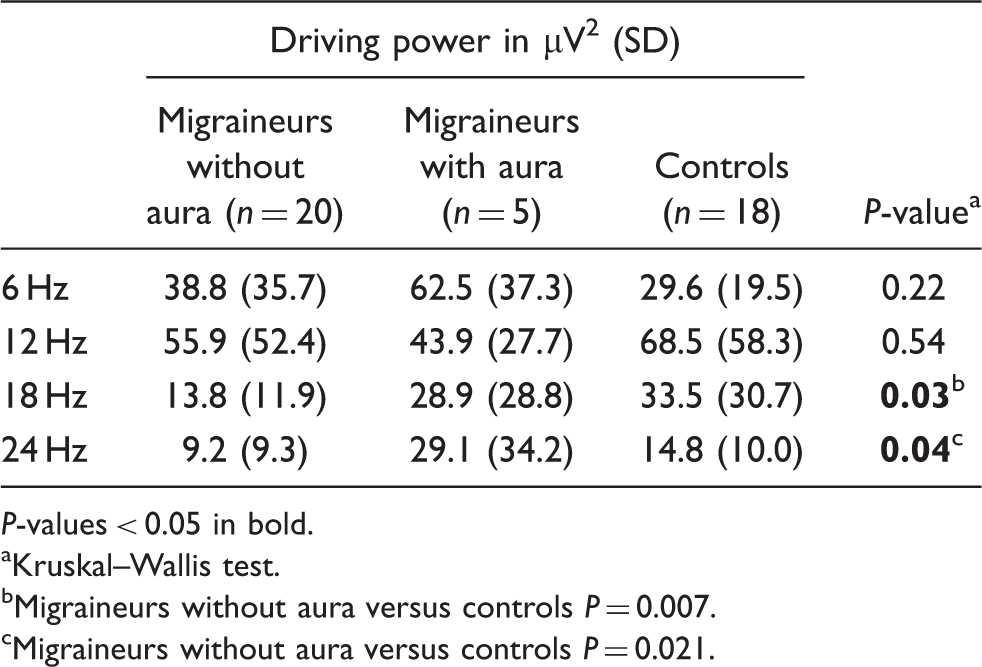
The driving amplitude for each separate flash frequency was suppressed for 18 Hz and 24 Hz stimuli in MwoA compared to Ctr (Table 3). The combined migraine group also had less 18 Hz driving power than controls (mean driving power [SD]: 16.9 µV2 [17.0] vs 33.5 µV2 [30.7]; P = 0.014). However, photic responses were similar between groups for 6 Hz and 12 Hz flicker frequencies.
The 18 Hz driving power was more symmetric in MwoA compared to both Ctr and MA (mean asymmetry [SD]: 5.6 µV2 [9.2] vs 15.6 µV2 [16.6] and 19.6 µV2 [28.7]; P = 0.006 and 0.035, respectively).
Effect of the migraine cycle on photic driving
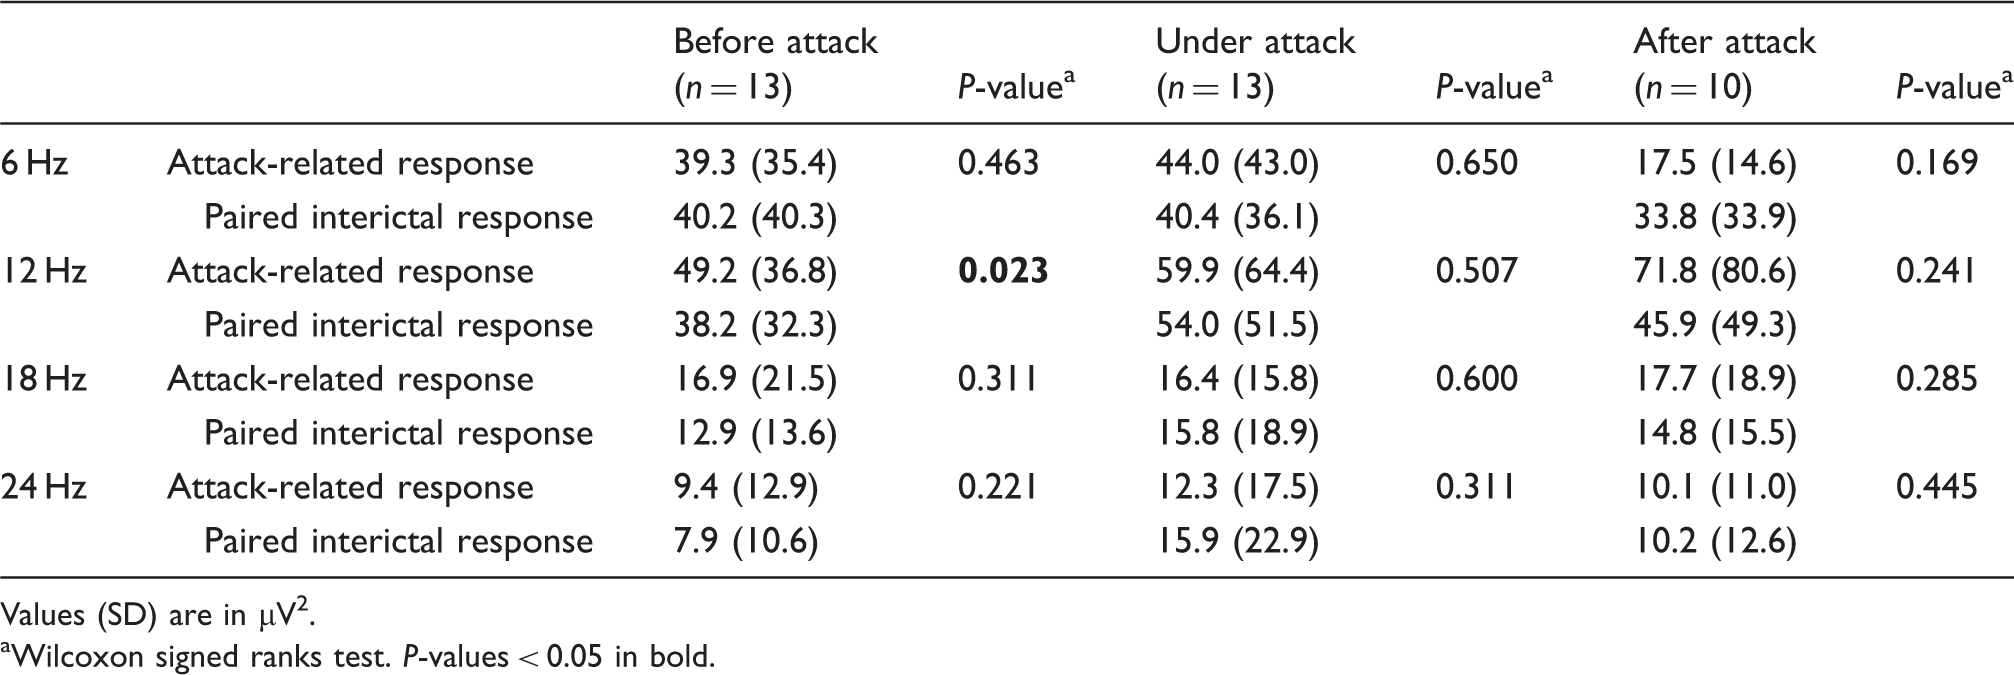
The driving amplitude to 12 Hz flicker was greater within 72 h before the attack compared to the interictal period in paired analysis (Table 5). Of the 13 patients with a preictal recording within 72 h before the attack, 11 had raised 12 Hz power (Figure 2). Power also appeared to be slightly raised before the attack for 18 Hz and 24 Hz flicker frequencies but the difference did not reach statistical significance (Table 5). Driving power during or after the attack was not different from interictal values (Table 5).
The 12 Hz driving power in migraineurs between attacks (interictal) and before attack. Preictal power increased in 11 of 13 cases. Mean fundamental driving power before, after and during attack Values (SD) are in µV2. Wilcoxon signed ranks test. P-values < 0.05 in bold.
Driving power symmetry did not change through the migraine cycle (P > 0.075, Wilcoxon signed ranks test).
Effect of clinical variables on photic driving
Trigger sensitivity score correlated negatively with 6 Hz driving power and asymmetry (rho = −0.65, P = 0.00005, Figure 3, and rho = −0.59 P = 0.002, respectively) and 12 Hz driving power (rho = −0.42, P = 0.04, Figure 3). In order to check the consistency of this result we repeated the analyses on the entire migraine group (regardless of temporal distance to attack, n = 41) in separate analyses of test 1, test 2 and test 3. The correlation results above were reproduced in all three tests (rho = −0.3 to –0.6, P = 0.03 to 0.0001).
Trigger sensitivity score (0–4, y-axis) correlated negatively with 6 Hz (dashed line) and 12 Hz (filled line) driving power (Ln-transformed power-data, x-axis).
Self-reported photophobia correlated negatively with 6 Hz driving power (rho = −0.52, P = 0.008). A post-hoc comparison of patients with little (0–1 on a 0–2 scale, n = 12) versus much (2 on a 0–2 scale, n = 13) photophobia revealed significantly attenuated 6 Hz driving power in patients with severe symptoms (P = 0.014, Mann–Whitney U-test, Figure 4). Photophobia also correlated negatively with 6 Hz driving power asymmetry (rho = −0.44, P = 0.027).
The 6 Hz driving power in patients with slight (n = 12) versus severe (n = 13) self-reported photophobia (0–2) and controls (n = 18). Patients with severe photophobia had significantly less 6 Hz driving power than patients with slight photophobia (P = 0.014, Mann–Whitney U-test). One outlier is shown (asterisk).
Pain intensity correlated negatively with 24 Hz driving power asymmetry (rho = −0.41, P = 0.04, without outlier rho = −0.37, P = 0.078). Patients with high-intensity attacks (grade 3–4, n = 14) had less 24 Hz driving power asymmetry than those with milder pain (grade 1–2, n = 11, P = 0.044). Family history of migraine correlated negatively with 12 Hz driving power (rho = −0.43, P = 0.033). Headache attack duration, disease duration and attack frequency did not correlate with the driving frequency response.
Discussion
Our main results are decreased interictal photic driving in migraineurs without aura. Driving amplitude increased before attack and correlated negatively with trigger sensitivity and photophobia. Photic driving has been interpreted as increased in migraineurs the last 50 years and regarded as a sign of increased cortical excitability (5,36). Our results challenge this notion and may accordingly provide indirect support to the theory of hypoactive sensory cortices between attacks in migraine (37).
Summary of SSVEP and H-response studies in migraine


Results for the fundamental component, driving asymmetry, driving response pattern/the H responses and habituation are reported. Only studies which have provided measures or group comparisons for the fundamental driving component (F1) are included.
Mix mig = migraineurs with and without aura, N = normal controls, MA = migraine with aura, MwoA = migraine without aura, Cl = Classic migraine (corresponds to MA), Cm = common migraine (corresponds to MwoA), T = tension headache, D & W = Dow & Witty (1947) (67), AHC = Ad hoc Committee on Classification of Headache (1962) (68), WFN = World Federation of Neurology 1969 (69), IHS 88 = International Headache Society Headache classification 1988 (70), F = fundamental component (F1), ↑ = increased, → similar, ↓ decreased, Ce = central region, Te = temporal region, Fr = frontal region, Pa = parietal region, Oc = occipital region. EC eyes closed, EO = eyes open, freq = frequency, incl = included.
Regarding interictal registrations. Preattack and Postattack interval = the interval before/after attack. Number of hours before/after attack in brackets.
Flash frequencies used. Duration of flicker stimuli/break in between flicker trains in brackets.
H response: photic driving >14 Hz defined as s/r > 0.33, t/s > 0.5 where r = alpha peak frequency abundance/power, s = 18 Hz driving abundance/power and t = 14–16 Hz (trough) abundance/power. N response: declines from 14 Hz (s/r < 0.33), A response: declines from 14 Hz, rises from 16 Hz (s/r > 0.33, t/s < 0.5).
Our computations based on numbers reported in the paper: (23) P = 0.51, P = 0.95 and P = 0.12, respectively, Mann–Whitney U-test.
Cm group gathered for earlier study (7).
Only the first 4 s used for some fundamental component calculations.
Teenagers = 10–17/18 years old.
Mean of fundamental component for F21, F24 and F27.
Possibly, the discrepancy between studies is due to the different stimulus train durations used. Column 7 in Table 6 shows the duration of the stimulation period/resting period (brackets) in each study. In the present study we used 10-s flicker durations, which is half (2–5,10) or one quarter (6) of the durations used in most recent studies. This might explain the discrepancy from former results, as the duration of stimulus may have a strong effect on recorded SSVEPs (32). Habituation is defined as a progressive response decrement as a result of repeated stimulation, occurring more rapidly at higher frequencies (42). In cats marked habituation occurs to intermittent photic stimulation, especially for frequencies above 18–20 Hz (43). It is possible that long-lasting flicker trains in other studies (up to 100 s) could have introduced seemingly higher power in the migraine group when the total stimulus period is averaged due to a possible habituation phenomenon in the controls. Migraineurs probably lack habituation to other kind of sensory stimuli (44–53). Unfortunately, we have not found studies on habituation as such to medium frequency flash stimulation in controls or migraineurs, and it was not investigated in the present study. Common migraine patients (equivalent to MwoA with current classification (25)) showed a habituation-like response to sine-modulated light in a way similar to healthy controls when driving power in the first 4 s was compared with the last 8 s. However, classic migraineurs (equivalent to MA) did not show the same power reduction as the controls (20), possibly reflecting a trend towards habituation deficit. When possible habituation phenomena were abolished by only using the first 4 s of stimulation, the authors did indeed find lower driving power than controls in this group for 16–22 Hz stimulation (though only reaching significance for 20 Hz) (20).
The depressed photic driving in MwoA may indirectly support the notion of low cortical pre-activation in migraine between attacks (54). A tendency towards decreased amplitude for the first evoked potentials epoch has been seen in migraineurs in some studies; (44,45,55,56) according to the theory of low pre-activation, the decreased initial responses at the start of stimulation as well as the deficient habituation in migraineurs could be explained by hypo-activation of sensory cortices (37). The low pre-activation level then allows for a wider range of suprathreshold responses later in the course of the stimulation period (54). The hypo-activation may be caused by inefficient thalamocortical drive caused by changed activity in state setting brain stem nuclei (37,57,58). In animal studies, brain stem as well as thalamic stimulation does indeed increase cortical photic driving amplitudes to frequencies above, but not below, 6 Hz (43). Hence, it is plausible that decreased subcortical stimulation would decrease medium frequency (but not 6 Hz) SSVEPs. The increased driving symmetry between the hemispheres found interictally may possibly reflect thalamocortical synchronization and further support this hypothesis. Interestingly, two studies of alpha-phase synchronization during photic stimulation have found increased synchrony in migraineurs (59,60). De Tommaso et al. (59) attributed this to decreased pre-excitability in thalamocortical pathways and suggested that a state of cortical hypo-activity favoured an aberrant response to repetitive flash stimulation. A fluctuating dysregulation of cortical excitability causing excessive swings in either direction might explain the change of driving amplitude close to the attack in the present study, as well as the deviating results from other neurophysiological studies of evoked responses and transcranial magnetic stimulation (TMS) (61).
We found lower photic drive and symmetric hemispheric activity in patients who easily got attacks after exposure for triggers, i.e. light, sound, smell and physical activity. Photophobia during attack correlated in the same way. These results strengthen the assumption that the sensitivity to environmental stimuli is coupled to aberrant sensory processing in migraine, possibly to low cortical pre-activation. Interestingly, recent TMS data also suggested that patients with more intense pain had lower visual cortex excitability (62) in line with our results. The biological trigger mechanism for environmental stimuli in migraine is unknown. Recently, brain stem nuclei dysregulation has been hypothesized to be central for the pathogenesis (63,64). One may speculate that a well-regulated photic driving response serves to protect against intense stimuli, whereas a dysregulated, attenuated response predisposes to sensory hypersensitivity. To our knowledge, trigger factor sensitivity has not been correlated to visual responses or other neurophysiological response in humans before.
Other explanations for our results should be considered. We did not randomize the order in which each stimulation frequency was presented, partly for practical limitations in the Nervus program and partly in order to minimize the variance in group comparisons. However, provided that any sequence-effect is similar between groups, the comparison between groups will not be biased. If, on the other hand, group differences were influenced by stimulation order due to a possible habituation deficit in migraineurs, we should expect a low response to 6 Hz and higher responses to the subsequent higher frequencies in migraineurs compared to controls. However, our results showed the opposite: migraineurs had a (non-significant) increased response to 6 Hz whereas the response to the subsequent higher frequencies was decreased. Hence, it is not likely that our main results were biased by the fixed order.
Illumination intensity could theoretically have produced differences between studies, as strong intensity dependence is found in migraineurs (47,65). Illumination intensity during flash light is hard to measure reliably, and is often ambiguously reported (or not mentioned, available technical illumination details in former studies are depicted in column 6 in Table 6). It is accordingly hard to make inferences about the effect of flash intensity between studies. However it seems unlikely that low flash intensity could explain low amplitudes in our study as our flash power was 1.0 J as opposed to 0.2 J in some studies which have found increased driving amplitudes in migraineurs (2–6,10). However, low stimulation intensity increases the tendency towards habituation in healthy people (42), making it more probable that differences between our results and the low intensity studies are caused by habituation deficit in migraineurs in the latter. Other methodological differences could also account for differences, like the lack of blinding (Table 6) or artefact detection in most studies. The present study seems to be the only one where migraineurs were included from the general population and not from hospital or out patient clinics.
Conclusions
The depressed photic driving reported here is not in agreement with most former studies. This discrepancy may be explained by inclusion of migraineurs in the preictal phase as well as habituation deficit in migraineurs during long intervals of stimulation in earlier investigations. Our results should be reproduced with other blinded, controlled studies which account for the preictal interval in the analyses. Habituation to steady-state visual stimulation should also be investigated in migraineurs.
Footnotes
Acknowledgements
The authors are grateful for the invaluable technical assistance of Grethe Helde, Marit Stjern and Gøril Gravdahl. Grants were provided from The Norwegian Research Council and Norwegian University of Science and Technology. None of the authors had any conflicting interests.