
Abstract
Introduction: Prostaglandins (PGs) are involved in nociception and mast cell degranulation. Prostaglandin D2 (PGD2) is a vasodilatator released during mast cell degranulation. The headache-eliciting effect of PGD2 has not been studied in man.
Subjects and methods: Twelve healthy volunteers were randomly allocated to receive intravenous infusion of 384 ng/kg/min PGD2 over 25 min in a placebo-controlled, double-blind cross-over study. We recorded headache intensity and associated symptoms, velocity in the middle cerebral artery (VMCA) and diameter of the superficial temporal artery (STA) and radial artery (RA) using ultrasonography.
Results: In the period 0–14 h, 11 subjects reported headache on PGD2 compared to one subject on placebo (P = 0.002). During the in-hospital phase (0–120 min), the area under the headache curve was larger on PGD2 compared to placebo (P < 0.05). Median peak headache, 1 (0–1), occurred 10 min after start of PGD2 infusion. There was no difference in incidence of headache in the post-hospital phase between PGD2 (n = 3) and placebo (n = 1). There was a decrease in VMCA (P < 0.001), increase in STA (P < 0.001) and RA (P < 0.006) diameter during PGD2 infusion compared to placebo. Peak decrease in VMCA was 28.3% after 10 min and peak increase in STA was 55.7% after 20 min on the PGD2 day. Conclusions: The present study shows that PGD2 is a very strong vasodilator of MCA, STA and RA, but causes only mild headache.
Introduction
In the last 10 years, nociception around cephalic blood vessels and mast cell degranulation have become ‘hot’ topics in migraine pathophysiology (1–4). In particular, dura mater and meningeal nociceptors are believed to play a pivotal role in the generation of head pain (5,6). Dural mast cells are densely lined close to meningeal perivascular afferents and animal models of inflammatory pain have shown that prostanoids are involved in nociception and mast cell degranulation (7). We have previously studied the ability of prostaglandin I2 (PGI2) and prostaglandin E2 (PGE2) to cause head pain in normal human volunteers, demonstrating that PGI2 (8) and PGE2 (9) elicit headache and cephalic vasodilatation. Prostaglandin D2 (PGD2) is a vasodilator released by mast cell degranulation (10–12); however, in contrast to PGI2 and PGE2, it is not known to activate or sensitize dural sensory afferents (13). PGD2 synthesis is initiated upon arachidonic acid release from the plasma membrane by the action of phospholipase A2. Arachidonic acid is then converted to prostaglandin G2 and prostaglandin H2 by cyclooxygenases and the final isomerisation step is executed by the specific prostaglandin D synthase to form the active PGD2 (14). PGD2 has a short half-life in plasma of (≤2 min) (15,16) and intracellular responses are mediated via G-protein-coupled receptors named DP-receptors (17).
The headache-inducing effect of PGD2 has not previously been explored in humans, but headache has been reported as an adverse event during PGD2 infusion (18,19). We aimed to study the headache-eliciting effect of PGD2 and to correlate any headache to the effect of PGD2 on cerebral and extracerebral arteries in healthy subjects in a placebo-controlled, double-blind, cross-over study. We hypothezised that PGD2 would strongly dilate cranial arteries, and that this would be accompanied by a pronounced headache.
Design and methods
Pilot experiment
Before the main experiment, we conducted an open pilot study to find the optimal dose of PGD2 that would cause a mild-to-moderate headache on a verbal rating scale (VRS) from 0 to 10 (0, no headache and 10, worst imaginable headache), without intolerable adverse effects and with detectable changes in mean blood flow velocity of the middle cerebral artery (VMCA) by transcranial Doppler (TCD). Three subjects (1 male and 2 females) received intravenous PGD2 in step-wise increasing doses of 128, 192, 256 and 384 ng/kg/min. Each infusion lasted 25 min followed by a 30-min wash-out. The pilot experiment showed a prolonged dilatation of the STA and MCA over time after infusion. To avoid a possible carry-over effect in MCA and STA recordings, we decided to include another two subjects (1 male and 1 female) with 256 and 384 ng/kg/min with infusion time 25 min followed by a 90-min wash-out. The results of the pilot study showed that 384 ng/kg/min of PGD2 induced a mild-to-moderate headache in five subjects (VRS 1; range 1–3), was well tolerated and led to a 38.3% decrease in VMCA.
Main experiment
We recruited 12 healthy subjects (6 males and 6 females), mean age 24 years (range, 18–33 years). Exclusion criteria were: a history of migraine or any other type of headache (except episodic tension type headache less than once a month); any daily medication apart from oral contraceptives; and serious somatic or psychiatric diseases. Two subjects had a family history of migraine. The study was approved by the Ethics Committee of the County of Copenhagen (KA-20060044), Danish Medicines Agency, and the Danish Data Protection Agency and was undertaken in accordance with the Helsinki Declaration of 1964, as revised in Edinburgh in 2000. The study was registered on <www.clinicaltrials.gov> and monitored by the Good Clinical Practice (GCP) unit at Copenhagen University Hospital. All subjects gave informed consent to participate in the study.
Experimental design
In a double-blind, placebo-controlled, cross-over design, the subjects were randomly allocated to receive PGD2 384 ng/kg/min (Sigma) or placebo (isotonic saline) over 25 min on 2 days, separated by at least a week. The central pharmacy performed the randomisation and prepared the study drug. The randomisation code remained in the hospital during the study and was not available to the investigators until the study was complete.
All subjects reported to the laboratory at 08:30 h headache free. Coffee, tea, cocoa or other methylxanthine-containing foods or beverages were not allowed for at least 8 h before start of the study. All procedures were performed in a quiet room and room-temperature was between 22.7–26.3°C. The subjects were placed in the supine position and a venous catheter (Venflon®) was inserted into the right antecubital vein for infusion. The subjects then rested for 30 min before baseline recordings. After baseline measurements, infusion started using a time and volume controlled infusion pump (Braun Perfusor, Melsungen, Germany). Headache intensity, accompanying symptoms, VMCA, diameter of the superficial temporal artery and radial artery, end-tidal partial pressure of pCO2 (PetCO2), adverse events and vital signs were recorded at baseline and then every 10 min until 120 min after start of infusion.
The subjects were carefully instructed to complete a headache diary with accompanying symptoms according to the International Headache Society (20), including questions concerning pre-monitory symptoms (tired, yawning, stiff neck, blurred vision, thirst, intolerant/irritable, emotional, difficulty with concentration, any other symptoms) (21) and allodynia (combing, shaving, shower, cold, ear-rings, eyeglasses, heat, contact lenses, tight clothes, pillow, ponytail, necklace) (22) and any rescue medication every hour until 12 h after discharge from the hospital. Subjects were allowed to take rescue medication of their own choice at any time.
Headache intensity
Headache intensity was recorded on a verbal rating scale (VRS) from 0–10 (0, no headache; 1, a very mild headache [including a feeling of pressing or throbbing – pre-pain]; 5, moderate headache; 10, worst imaginable headache) (23).
Middle cerebral artery blood flow velocity
VMCA was recorded bilaterally by transcranial Doppler (TCD) with hand-held 2-MHz probes (Multidop X; DWL, Sipplingen, Germany), as previously described (24,25). All recordings were done by the same skilled examiner (TW). PetCO2 (end-tidal CO2) was recorded simultaneously to the TCD measurements using an open mask, that caused no respiratory resistance (ProPac Encore® Welch Allyn Protocol, Beaverton, USA).
Diameter of the superficial temporal artery and radial artery
Diameter of the frontal branch of the left superficial temporal artery (STA) and the left radial artery was measured by a high-resolution ultrasonography unit (20 MHz, bandwidth 15 MHz; Dermascan C; Cortex Technology, Hadsund, Denmark) as previously described (25,26).
Vital signs
Heart rate (HR) and blood pressure were measured every 10 min by an auto-inflatable cuff (ProPac Encore®; Welch Allyn Protocol). ECG (Cardiofax V; Nihon-Cohden, Japan) was monitored on an LCD screen and recorded on paper every 10 min.
Data analysis and statistics
Headache score are presented as median and quartiles. Vascular baseline variables are presented as mean ± SD and vascular peak responses as mean and 95% CI, unless otherwise stated. Baseline was beforehand defined as an average of T-10 and T0 before the start of infusion.
We defined an in-hospital phase, consisting of an infusion phase as a period from 0 to 30 min (0–30 min) because of a short half-life (≤2 min) of PGD2 in plasma (15,16), and a post-infusion phase as a period from 30 to 120 min (30–120 min). Furthermore, a post-hospital phase was defined as the period of 2–14 h after start of the infusion.
Primary end-points were incidence of any headache on each experimental day, and differences in response calculated as area under the curve (AUC) according to the trapezium rule (27) for headache score (AUCheadache), VMCA (AUCVMCA), diameter of STA (AUCSTA) between PGD2 and placebo. Secondary end-points were differences in response in PetCO2 (AUCPet CO2 ), diameter of RA (AUCRA), mean arterial blood pressure (MAP; AUCMAP), systolic blood pressure (SBP; AUCSBP), diastolic blood pressure (DBP; AUCDBP), and heart rate (HR; AUCHR) between PGD2 and placebo. Baseline was subtracted before calculating the AUC to reduce variation between sessions within subject.
PetCO2 measured during TCD acquisition were also analysed for changes over time for each dose separately with univariate analysis of variance (ANOVA) with the fixed factors subject and time. To reduce mass significance, the following time points were selected for analysis (T0, T20 and T60). If overall differences were found, Dunnett’s test was applied to characterise which time points were different from baseline. VMCA was corrected for significant changes in PetCO2 according to Markwalder et al (28).
To test the differences between incidence of headache and AEs, we used McNemar’s test. To test differences between variables we used the Wilcoxon signed rank test for headache score and a paired, two-way t-test for vascular data. We tested for period and carry-over effects for all baseline variables with Mann–Whitney test (headache score) and independent t-test. All analyses were performed with SPSS for Mac v11.0 (Chicago, IL, USA). Five percent (P < 0.05) was accepted as the level of significance.
Results
Mean baseline values (± SD) of blood flow velocity in the middle cerebral artery (VMCA), PetCO2, diameter of superficial temporal artery (STA) and radial artery (RA), mean arterial blood pressure (MAP), systolic blood pressure (SBP), diastolic blood pressure (DBP), heart rate (HR), in 12 healthy subjects on PGD2 and placebo days

P-value: paired t-test.
Headache
On the PGD2 day (0–14 h), 11 subjects (92%) reported headache compared to one subject (8%) on placebo (P = 0.002, McNemar test).
During the in hospital phase (0–120 min), 10 subjects reported headache on the PGD2 day and no subject reported headache on the placebo day (P = 0.002, McNemar test; Table 2). During the infusion phase, the AUCheadache 0–30 min on the PGD2 day, 25 (20–30), was larger than on the placebo day, 0 (0–0; P = 0.005; Fig. 1). During the post-infusion phase, the AUCheadache 30–120 min on the PGD2 day, 45 (15–60), was larger than on the placebo day, 0 (0–0; P = 0.008; Fig. 1). The median peak headache, 1 (0–1), occurred 10 min after start of PGD2 infusion.
Median (filled squares) and individual headache scores using a verbal rating scale (VRS) on PGD2 (open squares) and placebo (crosses) days. There was a higher headache response in the infusion (AUCheadache 0–30 min; P = 0.005) and post-infusion (AUCheadache 30–120 min; P = 0.008) phases on PGD2 day compared to placebo day. Clinical characteristics of PGD2-induced headache in 12 healthy subjects a, Peak headache on PGD2 day, in-hospital phase (0–120 min). b, Peak headache on PGD2 day, post-hospital phase (2–14 h). Throb, throbbing; pres, pressing; bilat, bilateral; F, female; M, male; NS, not stated. Subject 10 had a bilateral headache score of 2 immediately after coughing with no associated symptoms.

Timing of peak median headache and peak vascular responses on PGD2 and corresponding values on placebo day in healthy subjects

Median headache is given on a Verbal Rating Scale (VRS). Maximal mean percentage changes from baseline (95% CI) in vascular variables. The middle cerebral artery blood flow velocity (VMCA) is corrected for changes in PetCO2 (28).
Middle cerebral artery velocity
The AUCVMCA was smaller on PGD2 than on placebo during both the infusion (P < 0.001) and post-infusion (P = 0.018) phases (Fig. 2). There was a difference between the AUCPetCO2 recordings during TCD scans between PGD2 and placebo days during the infusion phase (–9.2 mmHg; –11.8 to –6.5, 95% CI, P < 0.001) and no difference in the post-infusion phase (–0.9 mmHg; –9.2 to –7.5, 95%CI, P = 0.824). ANOVA showed a change over time in PetCO2 on PGD2 day (P < 0.001) and the placebo day (P < 0.001). Post-hoc analysis revealed a change in PetCO2 from baseline at the time 10, 20, 30 and 40 min on PGD2 (P < 0.05) and at the time 110 min on placebo (P < 0.05).
Individual and mean diameter (mm) of the superficial temporal artery (STA) on PGD2 compared to placebo. There was an increase in AUCSTA 0–30 min (P < 0.001) on PGD2.

Correction for PetCO2 changes did not change the results of AUCVMCA during the infusion (P < 0.001) and post-infusion (P = 0.005) phases. Peak response corrected for changes in PetCO2 is shown in Table 3.
Superficial temporal artery and radial artery
The AUCSTA 0–30 min during the infusion phase (P < 0.001) and the AUCSTA 30–120 min during the post-infusion phase (P = 0.001) were larger on PGD2 day compared to placebo day. The AUCRA 0–30 min during the infusion phase was larger on PGD2 day compared to placebo (P < 0.006) and there was no difference in AUCRA 30–120 min during the post-infusion phase (P = 0.435). Peak responses are shown in Table 3.
Allodynia and premonitory symptoms
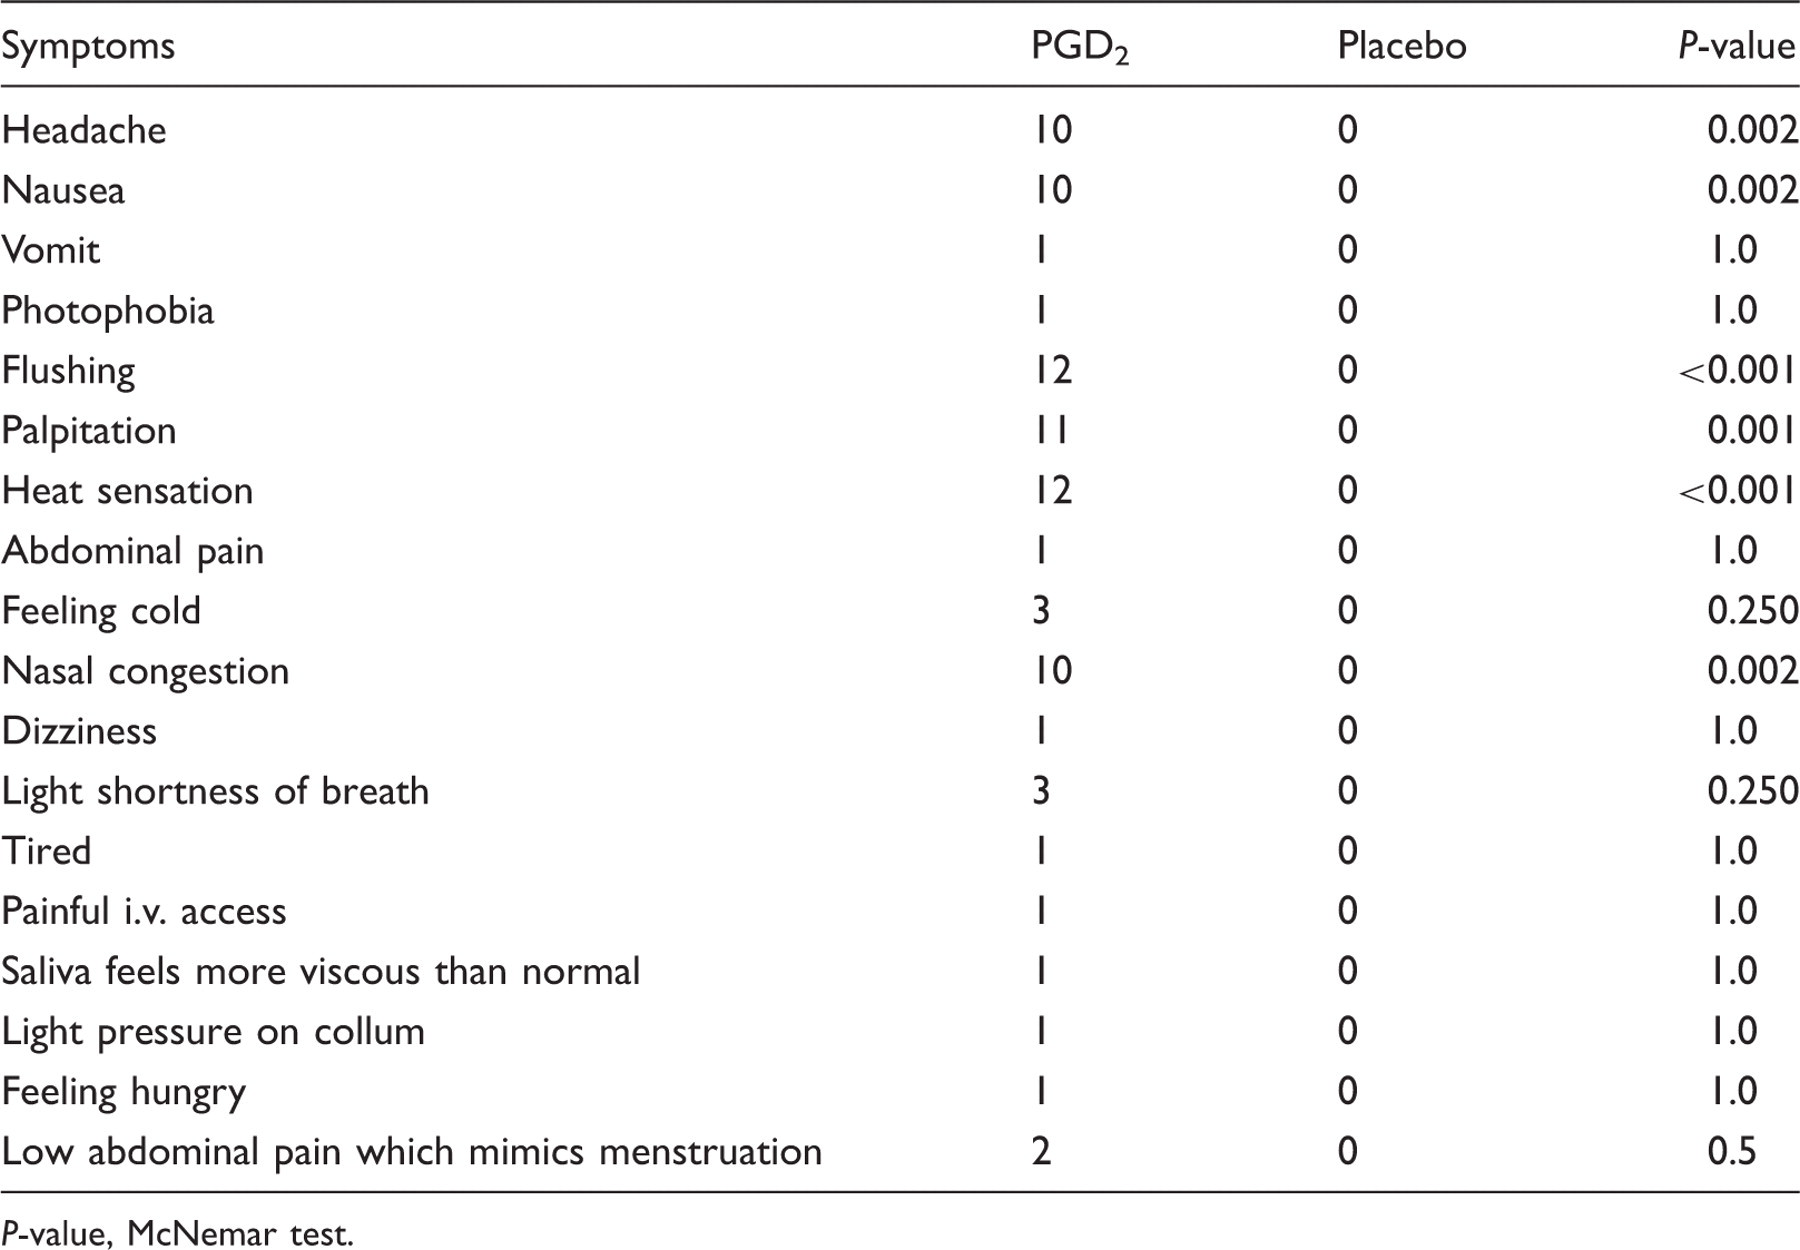
On the PGD2 day the following premonitory symptoms were reported: tiredness (91%), yawning (73%), blurred vision (9%), thirst (9%), difficulty with concentration (9%), and chest pain (9%). On the placebo day, premonitory symptoms were reported as tiredness (50%), yawning (42%), and difficulty with concentration (8%).
There was no difference in reported allodynic symptoms between the two experimental days (P > 0.05, McNemar test). On the PGD2 day, one subject found exposure to heat unpleasant.
Arterial blood pressure and heart rate
There was no difference in MAP during either the infusion (AUCMAP 0–30 min, P = 0.400) or post infusion phase (AUCMAP 30–120 min, P = 0.196). There was an increase in SBP during the infusion phase (AUCSBP 0–30 min, P = 0.027) and no difference in the post-infusion phase (AUCSBP 30–120 min, P = 0.213). There was a drop in DBP during the infusion phase (AUCDBP 0–30 min, P = 0.015) and no difference in the post-infusion period (AUCDBP 30–120 min, P = 0.077). There was an increase in heart rate in the infusion phase (AUCHR 0–30 min, P < 0.001) and no difference in the post-infusion phase (AUCHR 30–120 min, P = 0.162) – see Figure 4 and peak responses in Table 3.
Mean systolic blood pressure (SBP; filled triangles), diastolic blood pressure (DBP; open circles), mean arterial blood pressure (MAP; open squares) and heart rate (HR; filled squares) on PGD2 compared to placebo. There was an increase in SBP (AUCSBP 0–30 min; P = 0.027), a decrease in DBP (AUCDBP 0–30 min; P = 0.015), and an increase in heart rate (AUCHR 0–30 min; P < 0.001). Median headache (filled squares) and mean percentage changes from baseline for the middle cerebral artery blood flow velocity (VMCA) (open squares) corrected for changes in PetCO2, (28) diameter of the superficial temporal artery (STA) (filled triangles) and diameter of the radial artery (open circles) on PGD2 day. Peak decrease in VMCA was 28.3% at 10 min compared to baseline indicating dilatation of MCA (49). Peak increase in STA diameter was 55.7% at 20 min compared to baseline. Peak increase in RA was 16.3% at 20 min compared to baseline.

Adverse events
Adverse events were recorded and reported during in-hospital (0–120 min) period on PGD2 and placebo days (n = 12)
P-value, McNemar test.
Discussion
The major finding in the present study is that PGD2 induced a marked dilatation of intracranial (MCA), extracranial (STA) and peripheral (RA) arteries, but only a mild headache.
Human models of headache or migraine
We have validated and extensively used a human provocation model in normal volunteers (23,25) and in migraine sufferers (29–31) for more than 25 years and have learnt that normal volunteers should be used in the first place (25,32–34). Only substances that produce substantial headache in healthy volunteers have the potential to induce migraine in migraine sufferers and only such substances should, therefore, be tested in migraine sufferers. We have used this model to validate nitric oxide synthase (NOS) inhibition (35) and calcitonin gene related peptide (CGRP) receptor antagonism (36) as anti-migraine targets. Furthermore, we have suggested from human experimentation that cyclic adenosine monophosphate (cAMP) (37) and cyclic guanosine monophosphate (cGMP) (38) signalling pathways may play a crucial role in generation of head pain and that inhibition of these pathways may be effective in the treatment of migraine pain.
Comparison of PGI2 and PGE2
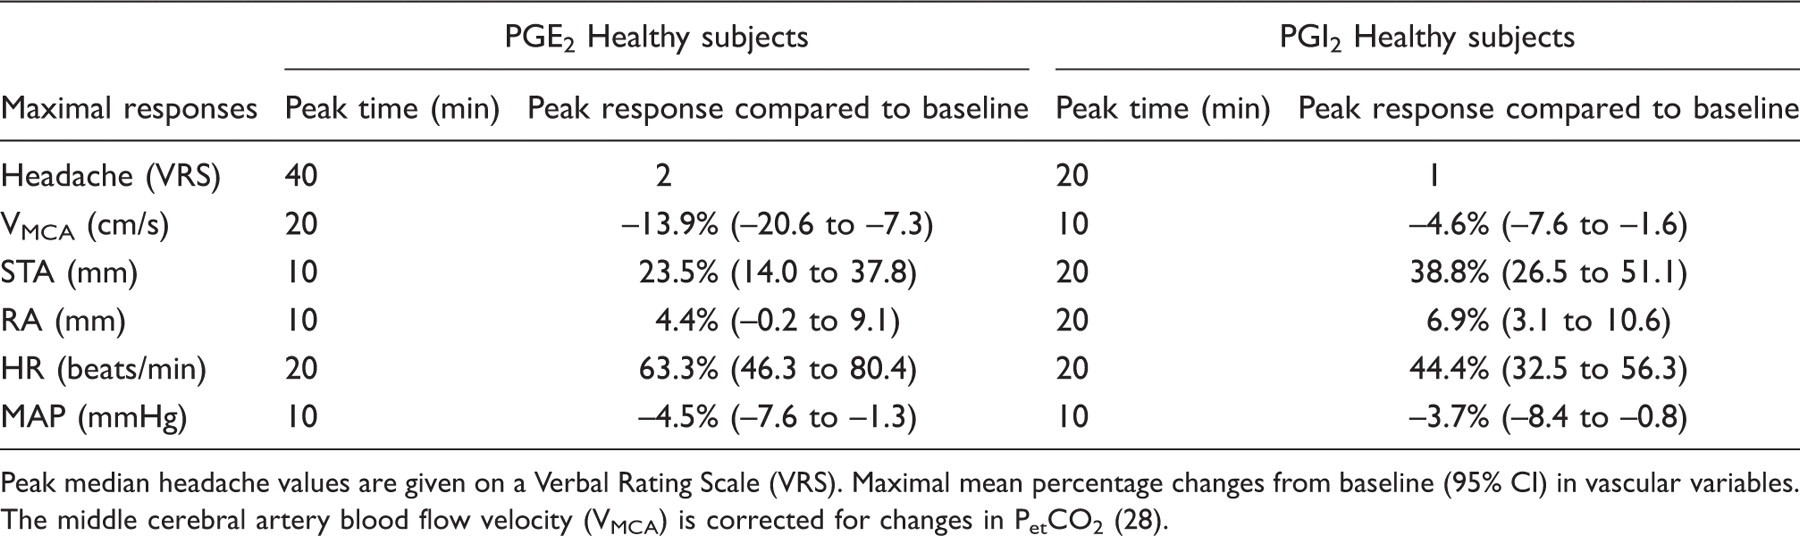
Peak median headache values are given on a Verbal Rating Scale (VRS). Maximal mean percentage changes from baseline (95% CI) in vascular variables. The middle cerebral artery blood flow velocity (VMCA) is corrected for changes in PetCO2 (28).
Possible mechanisms of PGD2-induced vasodilatation and headache
Experimental studies in humans in vivo and in vitro have shown that PGD2 acts as a vasodilator via DP-receptors (46–48). In agreement with this, we observed a marked dilatation of STA and a marked decrease in VMCA. If regional blood flow in the MCA area is constant, a decrease in VMCA is caused by dilatation of MCA (49). For technical reasons, we did not have the possibility to record regional or global CBF and can, therefore, not completely exclude that velocity in MCA was decreased due to a decrease in CBF. Activation of the DP-receptor by PGD2 increases intracellular cAMP (14) which induces vasodilatation via opening of Ca2+-dependent K+ channels in rats and rabbits (50,51). PGI2 and PGE2 mediate dilatation via IP, EP2 and EP4 receptors also coupled to cAMP formation and opening of KATP and BKCa channels (52–55). Interestingly, PGD2, PGI2 and PGE2 induce a Ca2+-dependent CGRP release in rat trigeminal neurons via DP, IP, EP2 and EP4 receptors (56). CGRP might, therefore, contribute to headache in the present study, but CGRP release cannot explain the discrepancy between mild headache intensity and marked vasodilatation. Therefore, only studies using CGRP antagonists will reveal the true role of CGRP in PGD2-induced headache.
In spontaneous migraine attacks, an unknown direct or indirect mechanism may cause release of inflammatory mediators from meningeal mast cells and subsequent activation and sensitization of trigeminal afferents (1,7). Degranulation of mast cells causes release of different substances and PGD2 is the major product (10–12). PGs alone do not trigger mast cell degranulation (57). Therefore, if mast cell degranulation is important to pain in neurovascular headaches, one would expect a more severe headache after PGD2 than after other PGs. This was not the case suggesting that PGD2 release from mast cells may not be a key factor in migraine pain. PGD2 only weakly induces sensitisation of dural and peripheral sensory afferents after topical application compared to PGI2 and PGE2 (13,58–61). This weak pro-nociceptive effect of PGD2 is, therefore, a likely explanation of the discrepancy between vasodilatation and pain in the present study. A central effect of PGD2 is possible because PGD2 may modulate the permeability of the blood–brain barrier, but only 0.1% of prostanoids are detectable in the brain (15,62) after intravenous infusion. Intrathecal PGD2 has both pronociceptive and antinociceptive effects (63–66) and interpretation is, therefore, difficult. PGD2 illustrates the complexity of prostanoid signalling because DP1 receptor agonists induce a weak sensitisation, but they decrease sensitisation induced by PGE2 (67). Furthermore, DP1 antagonism increases sensitisation caused by PGE2 (67). The cAMP–PKA pathway may be involved in the pathogenesis of neurovascular headaches (37,68) and the present results indicate differences in intracellular coupling to the cAMP–PKA pathway and regulation of DP1, IP, EP2 and EP4 receptors. Given the number of PGs and PG receptors, a mechanism of internal control between PGs probably exists.
Most of our subjects reported nausea (83%) and nasal congestion (83%; Table 4). The DP1 receptor is involved in the emesis reflex (69,70). PGD2 causes nasal vasodilatation via DP receptors and previous literature considers PGD2 to be one of the major mediators contributing to nasal congestion (47,48). Thus, PGD2 may contribute to nausea and nasal congestion in primary headaches.
Adverse events of PGD2 might compromise blindness of the present study (Table 4), but adverse events were caused by the physiological response to PGD2 and could not have been avoided. The present double-blind approach was the best possible way, although not ideal, of coping with methodological error.
Conclusions
PGD2 is the strongest dilator of cerebral and extracerebral arteries studied so far in human models of headache. Nevertheless, it did not cause more headache than other prostanoids. We suggest that the weak pronociceptive effect of PGD2 is a likely explanation of the discrepancy between vasodilatation and head pain in the present study. PGD2 causes considerable amounts of nausea and nasal congestion and may be the cause of these symptoms in spontaneous migraine attacks.
Footnotes
Acknowledgements
The authors thank laboratory technicians Lene Elkjær and Winnie Grønning for their dedicated and excellent assistance. The study was supported by grants from Mauritzen La Fountaine Fond, the Danish Headache Society and the Lundbeck Centre of Neurovascular Signalling (LUCENS).