
Abstract
Background:
In the United States, Medicare Functional Classification Level (K-level) guidelines require demonstration of cadence variability to justify higher-level prosthetic componentry prescription; however, clinical assessment of cadence variability is subjective. Currently, no clinical outcome measures are associated with cadence variability during community ambulation.
Objectives:
Evaluate whether physical performance, i.e. 10-meter Walk Test (10mWT)-based walking speeds, L-Test, and Figure-of-8 Walk Test scores, is associated with community-based cadence variability among individuals with a transtibial amputation.
Study design:
Cross-sectional.
Methods:
Forty-nine participants, aged 18–85 years, with a unilateral transtibial amputation were included. Linear regression models were conducted to determine whether physical performance was associated with cadence variability (a unitless calculation from FitBit® OneTM minute-by-minute step counts), while controlling for sex, age, and time since amputation (p ⩽ .013).
Results:
Beyond covariates, self-selected gait speed explained the greatest amount of variance in cadence variability (19.2%, p < .001). Other outcome measures explained smaller, but significant, amounts of the variance (11.1–17.1%, p = .001–.008). For each 0.1 m/s-increase in self-selected and fast gait speeds, or each 1-s decrease in L-Test and F8WT time, community-based cadence variability increased by 1.76, 1.07, 0.39, and 0.79, respectively (p < .013).
Conclusions:
In clinical settings, faster self-selected gait speed best predicted increased cadence variability during community ambulation.
Clinical relevance
The 10-meter Walk Test may be prioritized during prosthetic evaluations to provide objective self-selected walking speed data, which informs the assessment of cadence variability potential outside of clinical settings.
Keywords
Background
For individuals with lower-limb loss (LLL), prosthesis use enhances independence, functional mobility, and quality-of-life. 1 To ensure individuals with LLL obtain prosthetic componentry that meets their ambulatory needs, prosthesis prescription must be appropriate and justified. Federal guidelines for selecting prosthetic componentry vary by country and region. In the United States, the Medicare Functional Classification Level (i.e. K-Level) scale, which ranges from K0 to K4, reflects a patient’s functional mobility potential and ability to safely ambulate using a prosthesis. 2 The lowest functional mobility category K0 indicates one is unable to transfer or ambulate safely with or without assistance and consequently does not qualify for prosthesis reimbursement, 2 while the highest K4 indicates one has mobility skills beyond basic ambulation and may qualify for reimbursement of a greater variety of prosthetic components. 2 To ensure insurance reimbursement of a lower-limb prosthesis in the United States, objective documentation of functional mobility potential must support clinician-assigned K-levels; however, no gold standard for K-level classification exists, leading to subjectivity in K-level classification based on clinician experience and preferences. 3 As subjective documentation results in reimbursement denials and limits access to advanced prosthetic systems, there is a critical need to establish evidence-based relationships between objective clinical measures and functional mobility potential among adults with LLL.
When assessing mobility skills, a variable of interest is cadence, or the number of steps taken per unit of time (typically represented in steps/minute). 4 Cadence variability, or the ability to walk at a range of step rates, reflects the ability to safely traverse environmental barriers. The US Centers for Medicare and Medicaid Services define cadence variability as a primary indicator of higher-level (i.e. K3- or K4-level) ambulatory skills. 5 As the presence or absence of cadence variability assists with distinguishing between mobility sub-classifications and ambulatory abilities, 5 it also significantly affects prosthesis prescription and reimbursement in the United States. Specifically, individuals who demonstrate cadence variability may qualify for reimbursement of more advanced prosthetic technology.2,6
Evidence of cadence variability during community ambulation justifies higher-level mobility classification and corresponding prosthetic technology prescription, as it demonstrates a patient’s potential to benefit from advanced technology (which facilitates smooth and efficient cadence changes) during daily walking. During community ambulation, cadence variability can be assessed using accelerometer-based activity monitors, such as the FitBit® OneTM. Arch et al. 7 previously demonstrated a method for calculating cadence variability among individuals with a unilateral transtibial or transfemoral amputation and a range of walking abilities using step count data obtained from the FitBit® OneTM, and found significant differences in FitBit®-measured cadence variability between mobility subclassifications (i.e. K2- and K3-classified individuals). 7 Orendurff et al. 8 suggested accelerometer use to supplement and confirm clinicians’ perceptions of functional mobility potential among individuals with LLL; however, accelerometers are costly and require time for data analysis, limiting the practicality of daily use in clinical practice.
Historically, performance-based outcome measures have been used to predict mobility potential during community ambulation in other patient populations (e.g. older adults, adults post-stroke) when a community-based measurement is not feasible.9,10 While several performance-based measures have established psychometric properties11–13 among adults with LLL, no clinical outcome measures have been associated with community-based cadence variability. Clinical assessment of cadence variability primarily occurs through visual gait inspection during brief walking bouts. 11 Administration of the Amputee Mobility Predictor (AMPPRO), a performance-based test battery, also includes a single task assessing variable cadence. 11 These assessments, however, rely on the assessor’s subjective perception of cadence change over level ground and may not reflect the potential for cadence variability over long periods of time or when negotiating common environmental barriers (e.g. rough ground, curbs, and obstacles). Furthermore, observed changes in walking speed do not directly reflect cadence variability potential. Other gait parameters, such as step length, may be altered to maintain the same step rate at varying speeds; these changes may be less sustainable when walking in the community. 14 To assist with efforts toward more objective differentiation of lower- versus higher-level mobility and appropriate selection of prosthetic componentry, it is critical to establish relationships between (a) community-based cadence variability, objectively measured using activity monitors, and (b) performance-based measures evaluating daily walking tasks, such as walking at self-selected and fast speeds, transitioning between walking and transferring, and walking while turning.
This study’s objective was to determine whether select performance-based outcome measures (i.e. the 10-meter Walk Test (10mWT), L-Test, and Figure-of-8-Walk Test (F8WT)), administered during clinical evaluations, were associated with cadence variability during community ambulation, obtained during a 7-day monitoring period using FitBit® OneTM monitors, among adults with a transtibial amputation. The hypothesis was better (i.e. faster) 10mWT, L-Test, and F8WT performance in clinical settings would be associated with increased cadence variability during community ambulation.
Methods
Forty-nine adults, aged 18–85 years, with a unilateral transtibial amputation and current prosthesis use were recruited from September 2015 to May 2016. Exclusion criteria included contralateral amputation, unstable medical condition (e.g. uncontrolled blood pressure), compromised residual limb integrity (e.g. wounds), weight-bearing restrictions, and nonambulatory or limited household ambulation status (i.e. K0 or K1-level classification, as assigned by the participant’s prosthetist), given the performance-based measures selected. All participants signed a written informed consent form approved by the University of Delaware Institutional Review Board.
During a standardized evaluation, participants provided demographics and amputation-specific data (e.g. etiology, time since initial amputation) and completed the following questionnaires for sample characterization. As a measure of general mobility status, each participant’s K-level classification, as assigned by the participant’s prosthetist, was recorded. Prior to performance-based testing, participants completed the Houghton Scale, which assesses prosthesis use and stability when wearing a prosthesis, 15 and the Community Integration Questionnaire (CIQ), a 15-item assessment of community participation with initial evidence of validity established in individuals with a range of health conditions, including LLL. 16 CIQ subdomains include home integration, social integration, and productive activities, and the total score ranges from 0 to 29 points. 17 Higher Houghton Scale scores indicate better self-perceived function and greater prosthesis use, 15 while higher CIQ scores indicate greater community participation. 17
The AMPPRO is a reliable (Intraclass Correlation Coefficient (ICC) = 0.96 for test–retest reliability; ICC = 0.99 for inter-rater reliability) and valid measure of functional mobility potential among individuals with unilateral LLL. 11 Through 21 individual tasks, the AMPPRO assesses sitting and standing balance, gait quality, and obstacle negotiation. Previous literature from Gailey et al. 11 has reported score ranges associated with each of the five K-levels, with higher scores associated with higher-level functional mobility skills (i.e. higher K-levels).
The 10mWT assesses gait speed at both self-selected (10mWT-SS) and fast (10mWT-F) speeds 18 and is reliable (ICC = 0.95–0.99) and valid in various patient populations.19–21 The participants were asked to walk across a 10-meter linear course at a self-selected (i.e. “normal”) and fast (i.e. “as quickly as possible but safely”) speed, 18 and walking duration was timed over the middle 6 meters of the course. 18 Three trials were performed at both speeds, and average gait speed for each condition was determined.
The L-test, a reliable (ICC = 0.96–0.97) and valid test of functional mobility among individuals with LLL, was designed to address the ceiling effect of the Timed Up and Go found among higher-functioning adults with LLL. 13 The test requires sit-to-stand and stand-to-sit transfers, linear walking along an L-shaped course, two-90° turns (one to the left and one to the right), and a 180° turn. 13 Following demonstration, one timed trial was performed.
The Figure-of-8 Walk Test (F8WT), an assessment of walking with continuous turning, has been shown to be reliable and valid in various patient populations.22–24 Participants were asked to walk in a figure-of-8 pattern around two cones “as quickly as possible while trying to complete the walk smoothly without any hesitation.” Following demonstration, a timed trial was performed.
Following performance testing, a FitBit® OneTM monitor was placed around the prosthetic ankle for a 7-day monitoring period. When compared to manual step counts, the FitBit® OneTM has demonstrated excellent accuracy among adults with a unilateral transtibial amputation during lab-based walking assessments including prolonged walking (ICC = 0.97) and complex walking (i.e. multi-directional stepping, rapid gait initiation and termination, and turning; ICC = 0.88–0.90). 25 Furthermore, the FitBit® OneTM has been shown to accurately assess step counts in other mobility-impaired patient populations (e.g. older adults, 26 patients who have experienced a stroke 27 ).
Upon return of the monitor, Fitabase (Small Steps Labs, LLC, San Diego, CA), a cloud-based service for FitBit® data extraction, was used to assess minute-by-minute step counts. Step count data were analyzed using the procedure described by Arch et al., 7 wherein a Weibull probability density function (pdf) was fit to each step count data set. Finally, a unit-less measure of cadence distribution spread (i.e. scale parameter) was calculated to reflect cadence variability during the entire monitoring period. 7 Lower scale parameter values reflect a left-skewed distribution of cadence, indicating reduced cadence variability, whereas higher scale parameter values suggest a normal distribution of cadence during the monitoring period, indicating greater cadence variability (Figure 1). No specific cut-points have been established for the presence or absence of cadence variability, whereas Arch et al. 7 previously reported a scale parameter of 26.49 as indicative of lower cadence variability, while a scale parameter of 54.79 as indicative of higher cadence variability. A Weibull pdf was chosen rather than a mean and standard deviation calculation, as the Weibull pdf can model skewed data sets, and scale parameters provide greater insight into data distribution shape compared to a standard deviation. 7 The above method for calculating cadence variability has been validated among a sample of individuals with unilateral transtibial or transfemoral amputation with a range of walking abilities, based on predetermined, prosthetist-assigned K-levels. 7
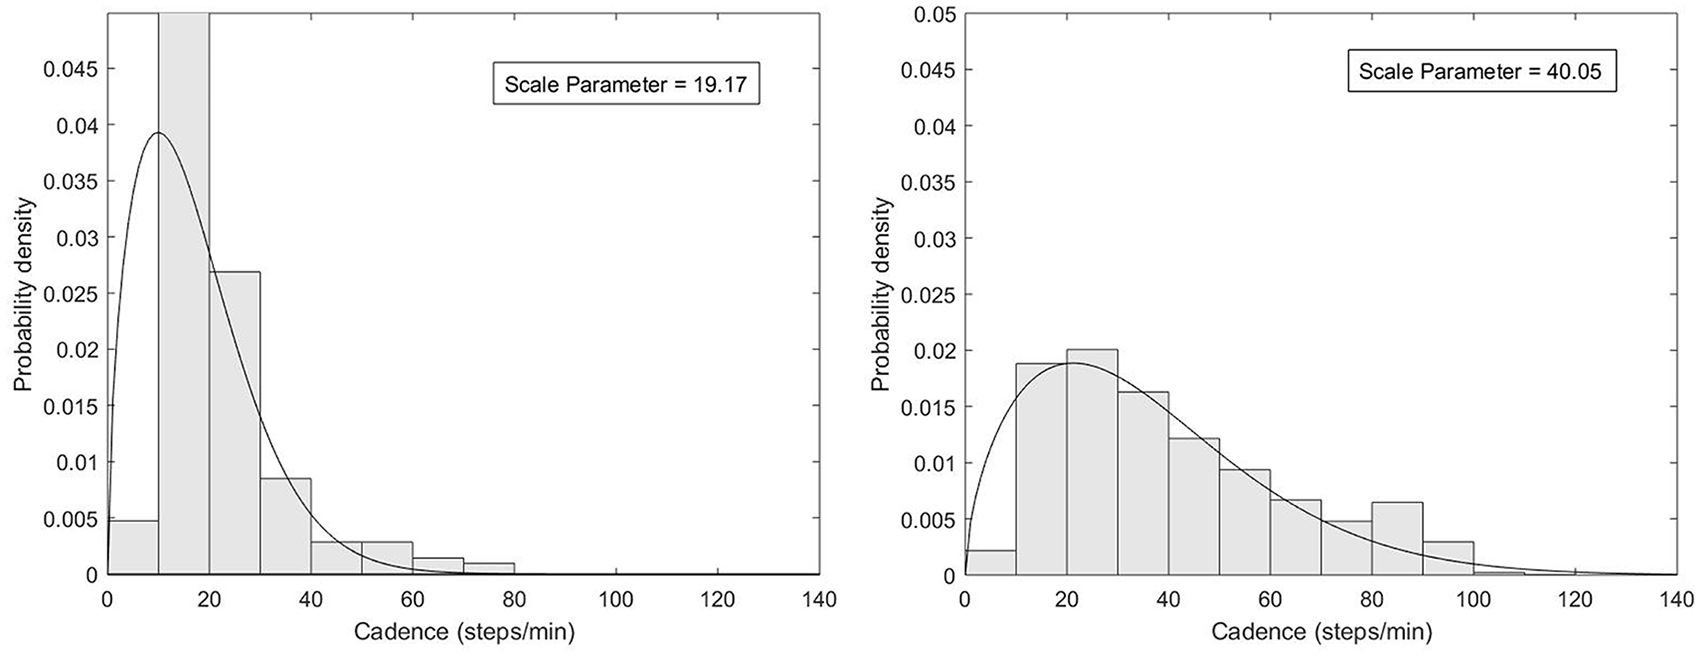
Weibull probability density functions demonstrate data distributions resulting in a lower (left image) versus higher (right image) scale parameter. Data resulting in the lower scale parameter is highly populated around lower cadences (i.e. 20–40 steps/min) and rarely exceeds 60–80 steps/min during the monitoring period, indicating reduced cadence variability during the monitoring period. Data resulting in the higher scale parameter demonstrates higher frequencies of walking at a wide range of cadences (i.e. 0–100 steps/min), indicating greater cadence variability throughout the monitoring period.
Prior to calculating scale parameter values, step count data were cross-checked with a daily activity log completed by the participant to identify data inconsistencies. The participants with data unexplained by their activity log, or fewer than 5 days of valid data, were excluded from analyses (n = 8). Using IBM SPSS Statistics 25 (SPSS, Inc. Armonk, NY), descriptive analyses were conducted to evaluate participant demographics. After checking assumptions and removing extreme outliers (i.e. cases where standardized residuals were <-1.96 or > 1.96 (i.e. ± 2 standard deviations from the mean)), four linear regression models were used to determine whether performance on the 10mWT, at both (a) self-selected (SS) and (b) fast (F) speeds, (c) the L-Test, and (d) the F8WT, was associated with community-based cadence variability (i.e. scale parameter values from FitBit® OneTM data). Given the increased risk for type-1 error when conducting multiple linear regression models, 28 a Bonferroni correction was applied (p ⩽ .013). Sex, age, and time since amputation were included as covariates, as sex-specific gait characteristics, 29 age-related changes in walking pattern, 30 and practice with a prosthesis 11 may affect mobility and cadence variability during community walking. Using G*Power 3.1.9.4 (Universität Kiel, Germany), the necessary sample size for each model to detect a large effect (f2 = .35; α = .013; 1 − β = .80) was determined to be 36 participants.
Results
Participant demographics (n = 41) are displayed in Table 1. Participants were predominantly male with a mean age of 58.3 years and a mean Body Mass Index (BMI) of 29.5 kg/m2. The majority of participants had undergone an amputation due to dysvascularity and were considered established prosthesis users, given the median time since amputation (8 years). Based on the median Houghton Scale score of 10 points, participants were largely independent community ambulators, 15 and the mean CIQ score was 18 points. On the AMPPRO, participants largely scored in the K3 range, 11 with a median score of 40 points. Finally, the median cadence variability scale parameter for the sample was 29.09 [25th, 75th percentiles: 25.92, 35.43].
Participant demographics and performance.
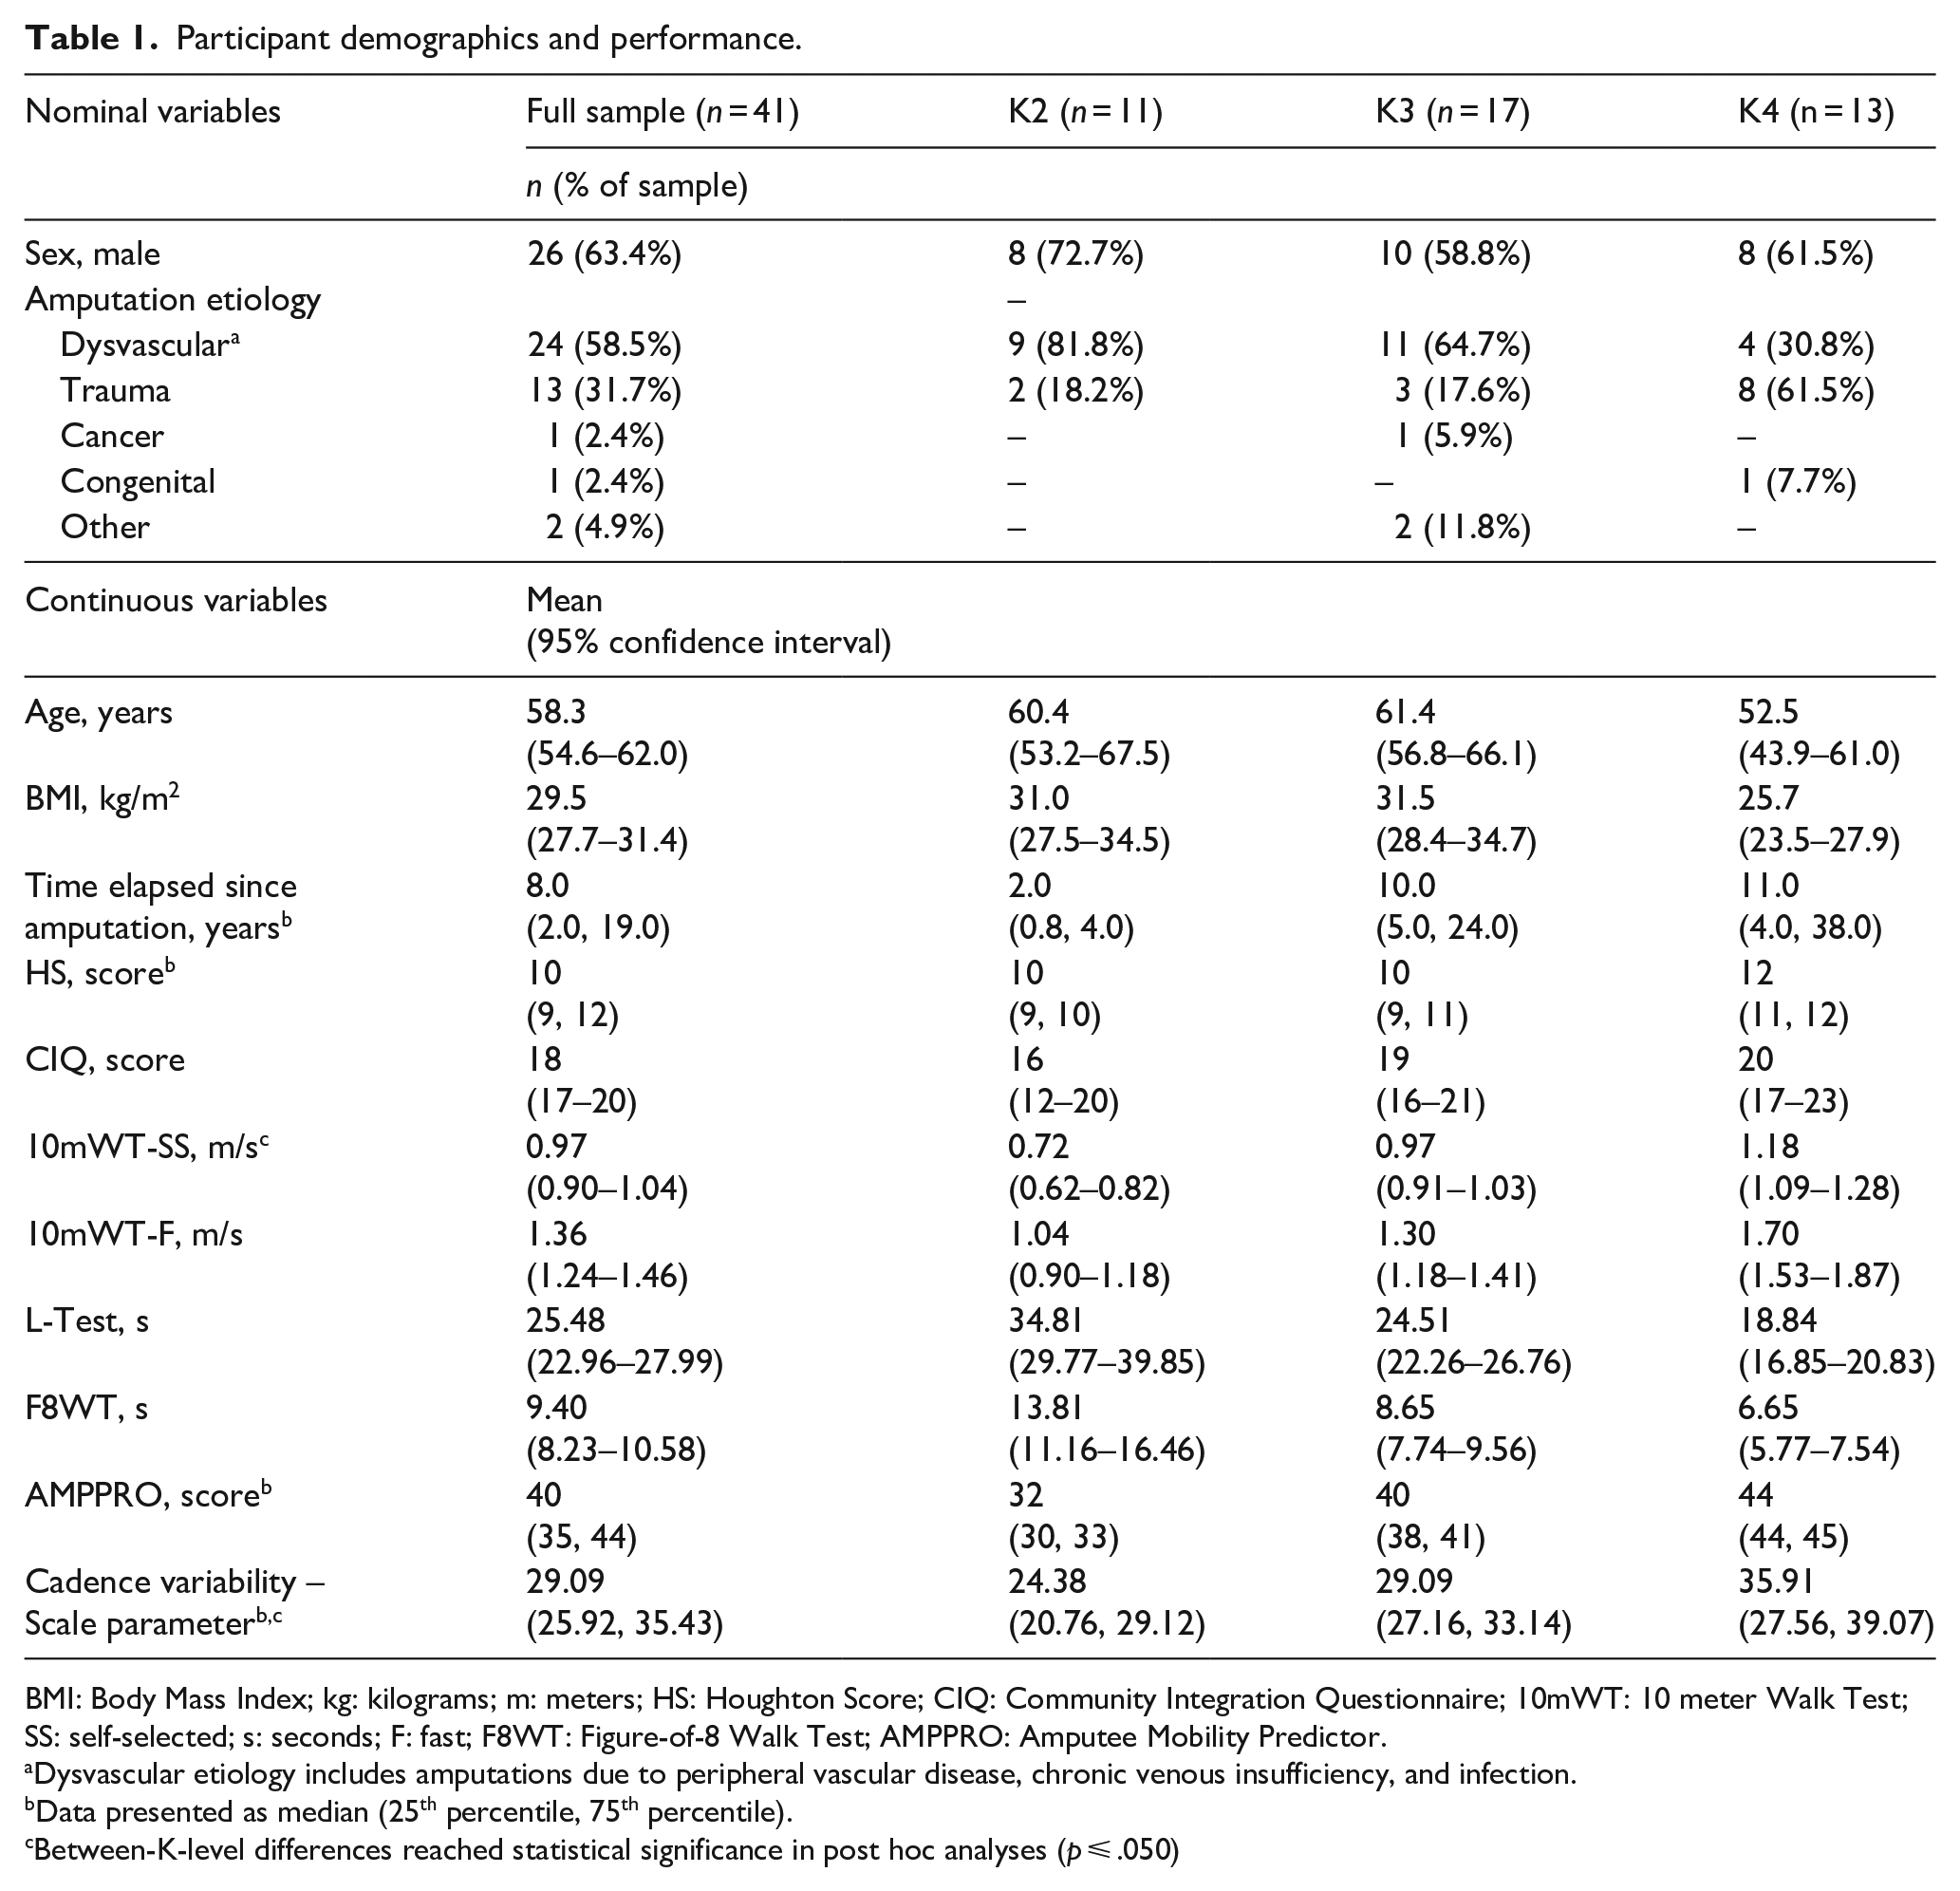
BMI: Body Mass Index; kg: kilograms; m: meters; HS: Houghton Score; CIQ: Community Integration Questionnaire; 10mWT: 10 meter Walk Test; SS: self-selected; s: seconds; F: fast; F8WT: Figure-of-8 Walk Test; AMPPRO: Amputee Mobility Predictor.
Dysvascular etiology includes amputations due to peripheral vascular disease, chronic venous insufficiency, and infection.
Data presented as median (25th percentile, 75th percentile).
Between-K-level differences reached statistical significance in post hoc analyses (p ⩽ .050)
Of the 41 participants with valid FitBit® OneTM data, 2 extreme outliers were identified and removed from all analyses. After removing an additional, extreme outlier from the 10mWT-SS model, final analyses included 38 participants for the 10mWT-SS model and 39 participants for the 10-mWT-F, L-Test, and F8WT models.
Results from linear regression analyses can be found in Table 2. As expected, covariates explained a significant amount of the variance in all outcome measures (R2 for 10mWT-SS, 10mWT-F, L-Test, and F8WT models: 0.462, 0.414, 0.414, and 0.414, respectively; p < .001). Specifically, younger age (p < .001) and increased time since amputation (p = .006-.012) were associated with increased cadence variability; in contrast, sex was not associated with increased cadence variability (p = .020-.052). Beyond covariates, self-selected gait speed explained the greatest amount of variance in cadence variability (R2 change = .192, p < .001). All other tests explained a smaller, but significant, amount of the variance in cadence variability (10mWT-F: .171, p = .001; L-Test: .123, p = .005; F8WT: .111, p = .008). For every 1 m/s increase in self-selected and fast gait speeds, cadence variability increased by 17.58 and 10.66, respectively. Furthermore, for every 1-second increase in L-Test and F8WT time, cadence variability decreased by 0.39 and 0.79, respectively (Figure 2).
Block and individual predictor statistics.
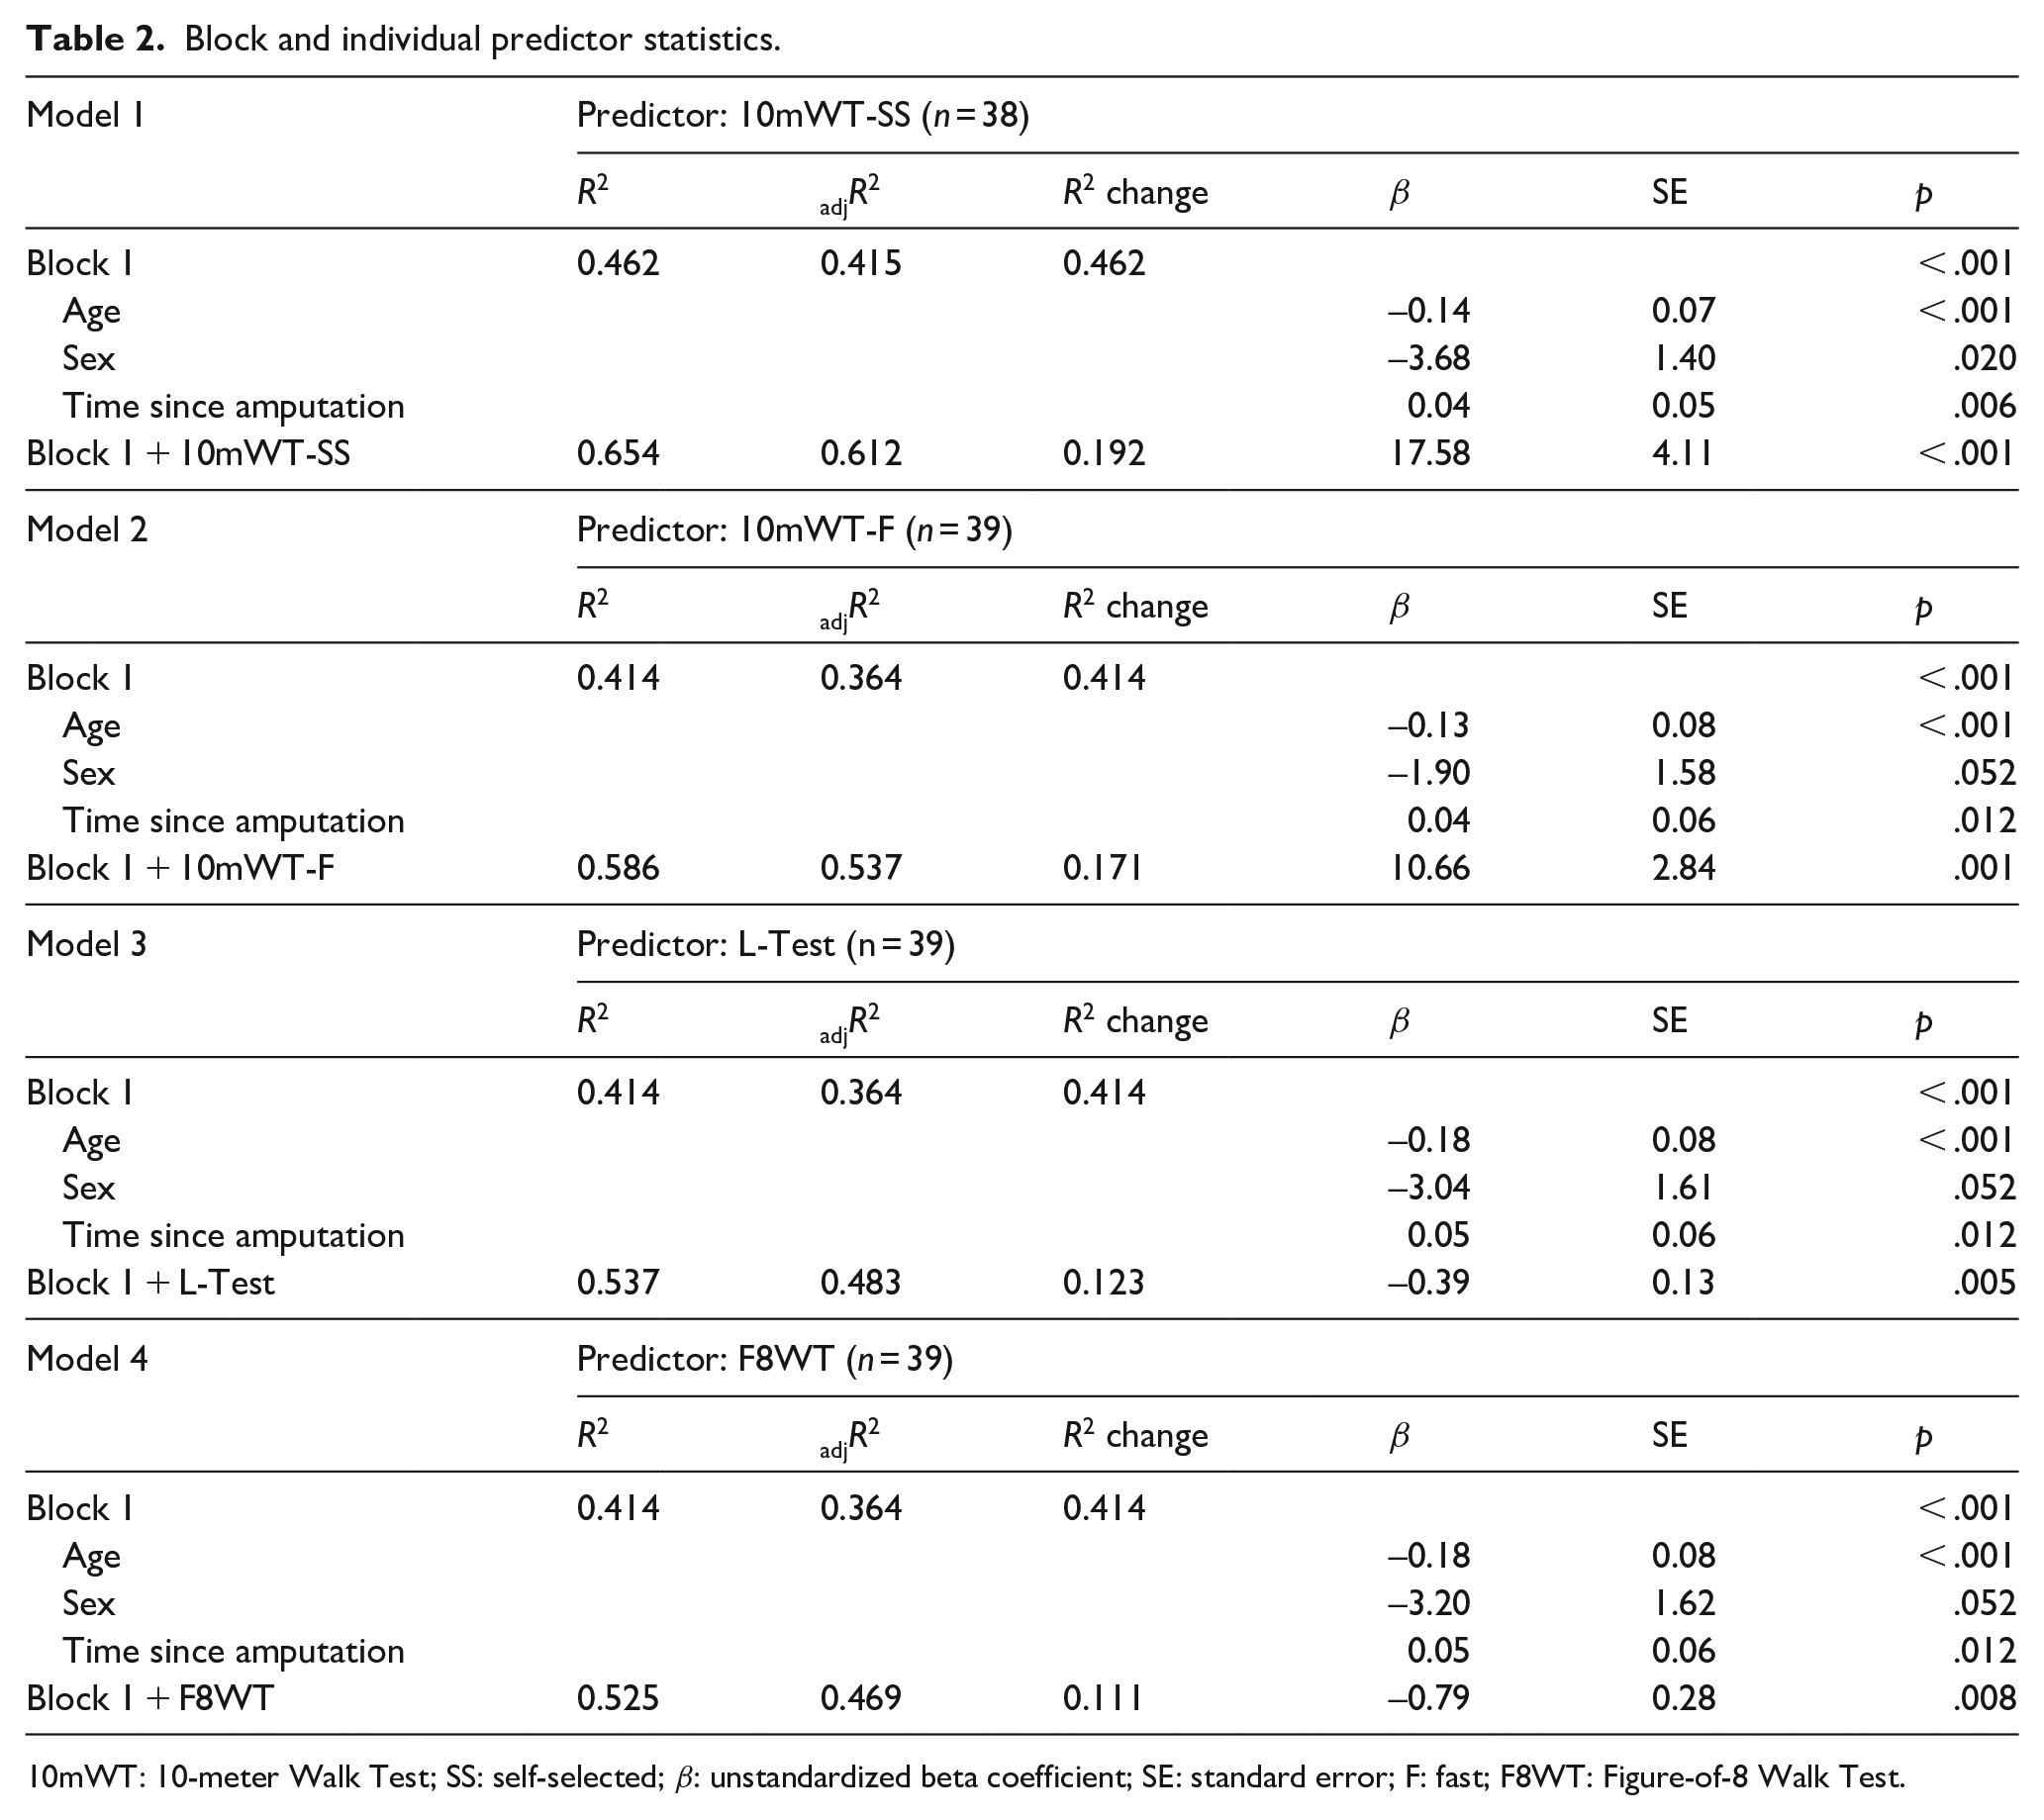
10mWT: 10-meter Walk Test; SS: self-selected; β: unstandardized beta coefficient; SE: standard error; F: fast; F8WT: Figure-of-8 Walk Test.
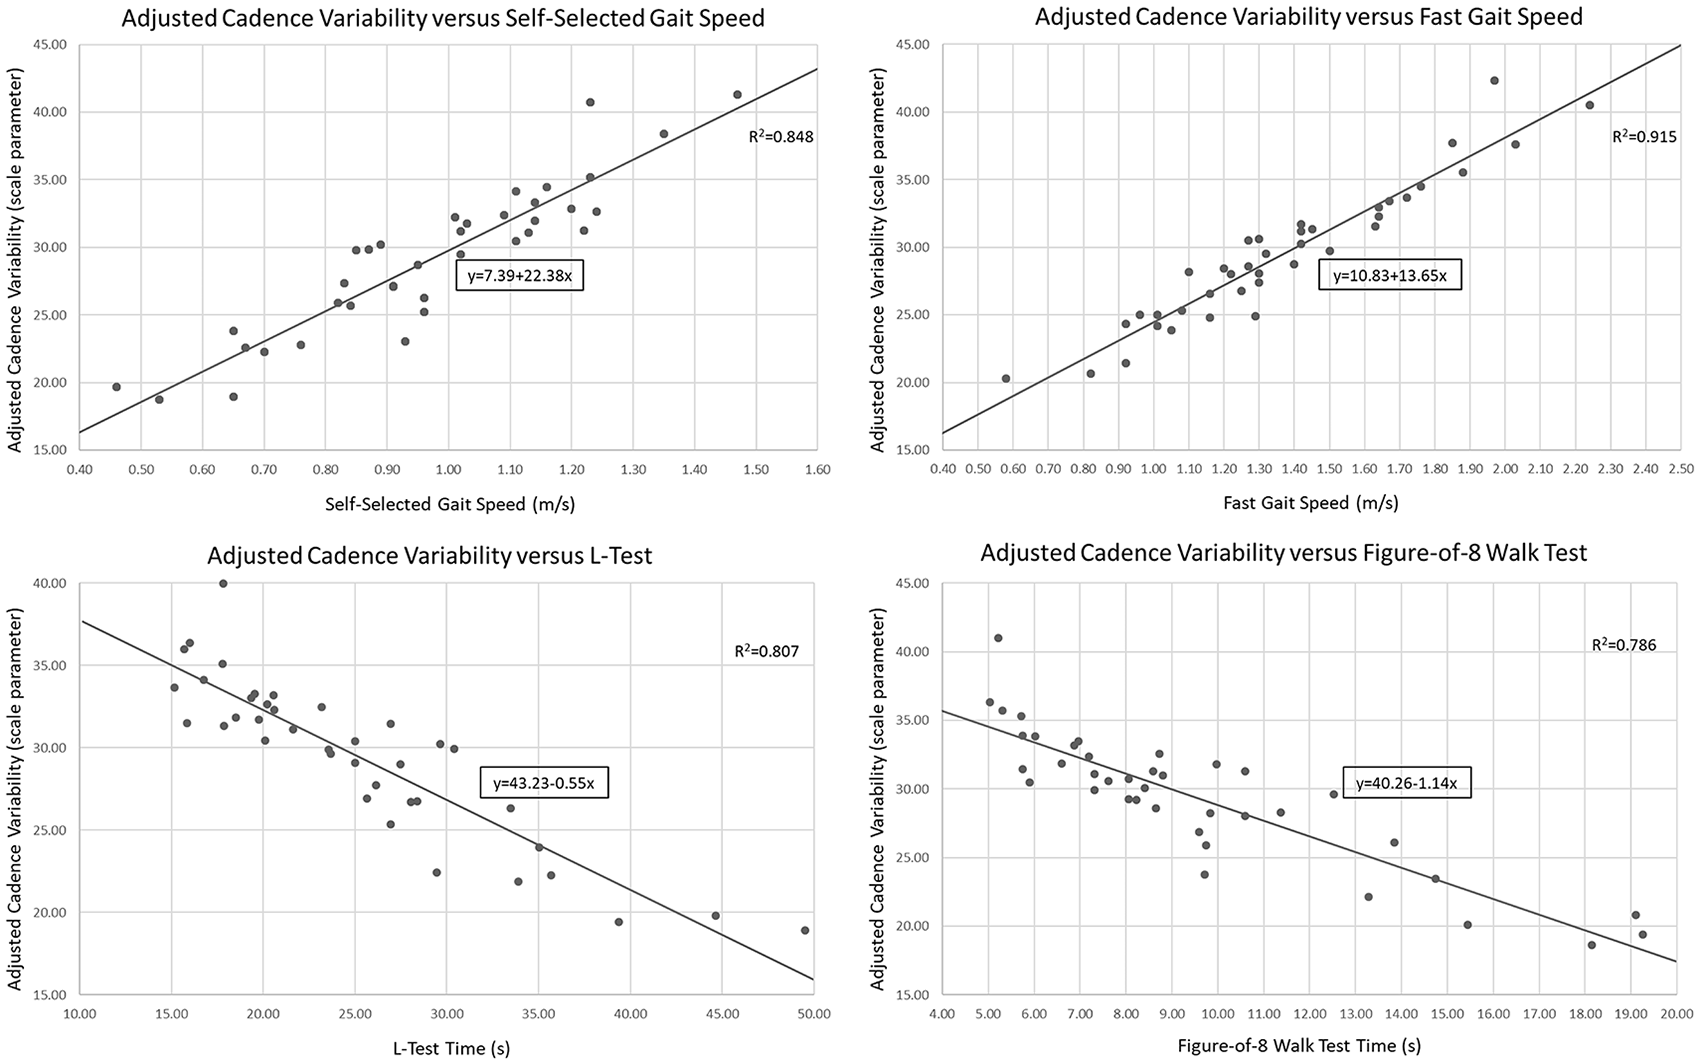
Graphs depicting the correlation between outcome measure scores and adjusted cadence variability, after controlling for covariates, are provided to assist with interpreting cadence variability potential based on physical performance.
Post hoc analyses
There is limited evidence regarding community-based cadence variability and its role in characterizing mobility classifications among adults with LLL. Therefore, additional post hoc analyses were warranted to investigate relationships between FitBit-based cadence variability, AMPPRO tasks, and mobility subclassifications among participants included in all final linear regression models (n = 38; p ⩽ .050). The goal of post hoc analyses was to determine whether data from this study supported the subjectivity of determining cadence variability potential based on AMPPRO task performance alone. Using an additional linear regression model, performance on the “variable cadence” AMPPRO task, which is currently used to assess cadence variability, was analyzed to determine its relationship to FitBit-based cadence variability, after controlling for the abovementioned covariates. The “variable cadence” AMPPRO task was not significantly associated with scale parameter values (R2 change = .041; p = .118). Furthermore, Mann Whitney U tests indicated similarities in task performance between participants classified as K2- versus K3-level (Z =−0.93; p = .926).
Further post hoc testing suggests FitBit-based cadence variability, while not predicted by AMPPRO task performance, differed between prosthetist-determined mobility subclassifications. Greater cadence variability was observed among those participants classified as K3 compared to K2 (t =-2.49; p = .020), as well as among those classified as K4 compared to K3 (t =-2.43; p = .022). Finally, as self-selected walking speed explained the greatest variance in cadence variability in a priori analyses, post hoc testing was done to explore differences in self-selected walking speed between mobility sub-classifications. Significant between-sub-classification differences were observed for mean self-selected gait speeds (F = 21.91, p < .001), after controlling for covariates (i.e. age, sex, and time since amputation).
Discussion
Prior to this study, the lack of established relationships between clinically-administered, performance-based measures, and community-based cadence variability has a limited objective clinical assessment of real-world mobility. Objective assessments of cadence variability must be documented to justify prescription of advanced (e.g. microprocessor) prosthetic componentry for patients who demonstrate higher-level walking skills. Beyond prosthesis prescription, cadence variability reflects the ability to safely and independently negotiate community barriers; therefore, objective assessments of cadence variability may identify patients requiring additional mobility training. Findings from this study suggest clinically-assessed 10mWT, L-Test, and F8WT performance is associated with community-based cadence variability; specifically, faster gait speeds and better L-Test and F8WT performance were associated with increased cadence variability. As self-selected gait speed best explained cadence variability during community ambulation, clinicians may prioritize the 10mWT-SS when determining cadence variability potential. Preliminary scale parameter data (Table 1) and graphs (Figure 2) are provided to assist clinicians with interpreting cadence variability potential based on physical performance among adults with LLL.
Post hoc analysis indicated the AMPPRO task related to variable cadence was not significantly associated with scale parameter values. These findings suggest the AMPPRO variable cadence task, when used in isolation, may not best reflect cadence variability during community ambulation among adults with a transtibial amputation.
Gait speed has been shown to predict community mobility in various patient populations (e.g. older adults, 31 individuals with poststroke, 32 individuals with Parkinson’s Disease 33 ). Furthermore, self-selected gait speed is predictive of prosthesis nonuse postamputation, with speeds ⩽ 0.44 m/s indicating greater risk for nonuse. 34 Recently, Batten et al. 35 reported significant differences in self-selected walking speeds between individuals with LLL based on K-level classification, with median gait speeds of 0.38 m/s, 0.63 m/s, and 1.06 m/s for individuals classified as K2-, K3-, and K4, respectively. In our study, post hoc analyses support Batton et al.’s findings with significance between K-level differences for mean self-selected gait speeds after controlling for covariates (i.e. age, sex, and time since amputation). Higher mean self-selected speeds among participants in our study may be attributed to participants being established prosthesis users, rather than new prosthesis users (i.e. gait speed was assessed at rehabilitation discharge in Batten et al.’s 35 work). In our study, significant between-K-level differences in self-selected walking speed, as well as novel findings regarding the use of self-selected walking speed to determine cadence variability potential, highlight the usefulness of self-selected gait speed assessment when classifying functional mobility level among adults with LLL.
As covariates explained a significant portion of the variance in scale parameter outcomes, clinicians should recognize the potential impact of age, sex, and time since amputation on cadence variability during community ambulation. Younger age and increased time since amputation were significantly associated with increased cadence variability during community ambulation, which supports previous literature suggesting better functional mobility among younger individuals with LLL who have more experience ambulating with a prosthesis. 11 While previous evidence among older adults suggests women walk at higher cadences than men, 29 sex was not significantly associated (p = .020–.052) with greater cadence variability in our study. While increased cadence typically reflects greater cadence variability (Figure 1), prior studies have not specifically investigated associations between sex-specific gait characteristics and cadence variability in adults with or without LLL. These findings warrant further investigation into sex-specific differences in gait characteristics among men and women living with LLL to determine if these differences impact cadence variability potential and/or specific prosthetic componentry needs.
Our sample consisted of community-ambulators with predominantly higher-level ambulatory skills (i.e. K3-level classification); however, the sample represented a spectrum of ambulatory abilities (i.e. 11 and 13 participants were classified at the K2- and K4-levels, respectively). Compared to published mean scale parameter values among K2- (31.55 ± 6.06) and K3-classified (36.49 ± 7.68) participants, 7 participants in this study walked with relatively low cadence variability (scale parameter median (25th, 75th percentiles): 24.38 (20.76, 29.12), 29.09 (27.16, 33.14), and 35.91 (27.56, 39.07), for K2-, K3-, and K4-classified participants, respectively). Lower scale parameter values in this study may be attributed to less demanding occupational or recreational activities, ultimately resulting in lower daily cadence variability. Specifically, lower overall cadence variability may be attributed to fewer purposeful walking bouts (i.e. fewer bouts of walking > 40–60 steps/min 36 ) for transportation or exercise secondary to sedentary work and home environments. Future investigations may explore associations between cadence variability and social or environmental factors, as this may help explain between-study differences in participant cadence variability.
Post hoc analyses revealed significant differences in cadence variability between participants with different mobility subclassifications. These findings suggest that increases in functional mobility classification are not only accompanied by significant increases in self-selected gait speed but also increases in cadence variability during community ambulation. Ultimately, relationships between self-selected gait speed, mobility potential, and community-based cadence variability highlight the clinical importance of evaluating and documenting self-selected walking speed.
As all selected measures were significantly associated with cadence variability during community ambulation, using more than one of the following measures, that is, 10mWT, L-Test, and/or F8WT, may improve clinicians’ confidence in determining cadence variability potential during community ambulation. Importantly, these objective assessments will assist with differentiating between mobility subclassifications (i.e. K2- and K3-level). As self-selected gait speed explained the greatest proportion of the variance in community-based cadence variability, time-limited clinicians may prioritize the 10mWT-SS for insight into cadence variability during real-world walking. Figure 2, in conjunction with scale parameter data provided by K-level in Table 1, may be used to interpret patient data.
Study limitations
While this study provides novel information regarding relationships between clinically-based physical performance measures and community-based cadence variability, our sample was limited to community-dwelling, established prosthesis users who were predominantly male. Furthermore, the validity of the scale parameter calculation method has only been studied in adults with transtibial amputations;7,25 therefore, findings from this study may not be generalizable to a more heterogeneous population of individuals with LLL.
Although the validation of cadence variability calculations included participants with varying amputation levels and walking abilities, 7 validation methods have been limited to laboratory-based walking, 7 while our participants’ cadence variability was determined based on real-world walking conditions. Furthermore, validation of cadence variability calculations was conducted in comparison to predetermined K-level classifications (i.e. K2 versus K3), as no gold standard exists for determining cadence variability. While clinical practice is moving toward comprehensive patient evaluation when determining K-level classification, the clinical decision-making process used to assign K-levels was not dictated to prosthetists and may have been subjective. Future investigations may consider validating the cadence variability calculation against mobility subclassifications assigned using a battery of physical performance measures.
While FitBit® One™ monitors have demonstrated excellent accuracy compared to manual step counts among adults with transtibial amputations in laboratory assessments, comparison to StepWatch 3 step counts suggests the FitBit® One may count fewer steps during free-living conditions. 25 In addition, as Arch et al. 25 found a moderate correlation between absolute percent difference in step count estimates with walking speed, FitBit®-based step counts may be less accurate among individuals in our sample who walked at slower speeds.
Finally, while we assessed associations between physical performance tests and cadence variability scale parameters in this study, we did not investigate specific score cut-points for performance tests reflecting high versus low cadence variability. Future studies may consider investigating scale parameter cut-points to distinguish between high and low cadence variability among individuals with LLL to further progress toward more objective and accurate functional mobility classification. While the use of a Bonferroni correction did not allow identification of significant associations between sex and cadence variability, our conservative p-value was appropriate given our use of multiple regression analyses.
Conclusion
Faster performance on the 10mWT, L-Test, and F8WT was associated with increased cadence variability during community ambulation among adults with a transtibial amputation. As assessing higher-level mobility skills, and consequently distinguishing between K2- versus K3-level classification, relies heavily on cadence variability interpretation, clinicians should consider including the abovementioned measures in prosthetic evaluations to assist with gait assessments and functional mobility sub classification. When it may not be feasible to use accelerometers to evaluate community ambulation among adults with LLL, time-limited clinicians may prioritize the 10mWT at self-selected pace during prosthetic evaluations, as it best explained cadence variability as obtained during community ambulation.
Footnotes
Acknowledgements
The authors would like to thank Independence Prosthetics-Orthotics, Inc., for assistance with respect to recruiting participants for this study.
Author contribution
All authors contributed equally in the preparation of this manuscript.
Declaration of conflicting interests
The author(s) declared the following potential conflicts of interest with respect to the research, authorship, and/or publication of this article: Dr. Sions is a consultant for Independence Prosthetics-Orthotics, Inc.
Funding
The author(s) disclosed receipt of the following financial support for the research, authorship, and/or publication of this article: This work was supported by the Orthotics and Prosthetics Education and Research Foundation, Inc. (OPERF) [grant number 15A01561]. Manuscript preparation was supported, in part, by the National Institutes of Health [grant number 0309364620927608] and a Promotion of Doctoral Studies I scholarship from the Foundation for Physical Therapy Research.