
Abstract
Background:
Residual limb volume is often measured as part of routine care for people with amputations. These measurements assist in the timing of prosthetic fitting or replacement. In order to make well informed decisions, clinicians need access to measurement tools that are valid and reliable.
Objectives:
To assess the reliability and criterion validity of the iSense optical scanner in measuring volume of transtibial residual limb models.
Study Design:
Three assessors performed two measurements each on 13 residual limb models with an iSense optical scanner (3D systems, USA). Intra-rater and inter-rater reliability were calculated using intraclass correlation coefficients. Bland Altman plots were inspected for agreement. Criterion validity was assessed using a steel rod of known dimensions. Ten repeated measurements were performed by one assessor. A t-test was used to determine differences between measured and true rod volume.
Results:
Intra-rater reliability was excellent (range of intraclass correlation coefficients: 0.991–0.997, all with narrow 95% confidence intervals). While the intraclass correlation coefficients suggest excellent inter-rater reliability between all three assessors (range of intraclass correlation coefficients: 0.952–0.986), the 95% confidence intervals were wide between assessor 3 and the other two assessors. Poor agreement with assessor 3 was also seen in the Bland-Altman plots. Criterion validity was very poor with a significant difference between the mean iSense measurement and the true rod volume (difference: 221.18 mL; p < 0.001).
Conclusions:
Although intra-rater reliability was excellent for the iSense scanner, we did not find similar results for inter-rater reliability and validity. These results suggest that further testing of the iSense scanner is required prior to use in clinical practice.
Clinical relevance
The iSense offers a low cost scanning option for residual limb volume measurement. Intra-rater reliability was excellent, but inter-rater reliability and validity were such that clinical adoption is not indicated at present.
Background
Swelling of the residual limb is common in people with amputations, and occurs due to trauma during surgery and physical inactivity following surgery. 1 As part of routine care for people with amputations, clinicians often measure residual limb volume to assist with determining if patients are ready for an initial prosthetic fit or a socket replacement. In a busy clinical setting, it is therefore ideal if clinicians have access to volumetric measurement tools that are not only affordable and easy to use, but also produce reliable and valid results.
Several methods have been investigated in the literature for measuring residual limb volume. These methods include the water displacement method, the circumferential measurement method and optical or laser scanners.2 –9 The water displacement and circumferential measurement methods are relatively cheap and simple to use. Studies examining the water displacement and circumferential measurement methods have found them to be reliable (intraclass correlation coefficient (ICC) = 0.93–0.98) and valid (ICC = 0.92–0.95). 8 However, these measurement methods have their disadvantages. The water displacement method cannot be used to measure residual limb volume in certain patients, for example, patients whose wounds have not healed, or patients who are unable to stand on one leg. The circumferential measurement method results in direct contact with the limb which causes soft tissue deformation. Though it has been shown to be valid when measurements are compared with the water displacement method, the circumferential measurement method is not sensitive enough to detect small volume changes over time. 2 Furthermore, neither water displacement volumetry nor the circumferential method gives a geometric representation of the limb.
The major advantage of computer assisted volume measurement modalities such as optical scanners is their ability to generate and store a geometric representation of the residual limb at the time of measurement. This allows clinicians to visualise residual limb geometry and monitor its changes over time. Clinicians can use this information to identify areas of the residual limb that might be more prone to increased pressure. Modifications to the patient’s prosthetic socket can then be made in advance to minimise the occurrence of pressure areas and skin breakdown. Though clearly useful, these scanners are often very expensive, some costing tens of thousands of dollars. They also require technical expertise in the scanning process and access to computers and elaborate processing software. A potential alternative is the iSense optical scanner (3D Systems, USA) which retails for only US$200 and uses simple processing software to capture geometric representations of an object. Originally developed for the creation of small objects such as jewellery and replica figurines, the iSense has the potential to record volume and shape in a manner similar to the more expensive scanners on the market when used together with a 3D printer. In addition, its scanning process is very simple and only requires access to an iPad or iPhone. Given its low cost and ease of use, the iSense could be a valuable measurement tool for residual limb volume in clinical practice. The aim of this study was to assess the reliability and criterion validity of the iSense scanner in measuring residual limb volume in transtibial limb models.
Methods
We report the design and conduct of the study in accordance with the Guidelines for Reporting Reliability and Agreement Studies (GRRAS). 10
Limb models and steel rod
We used 13 residual limb models to assess reliability of the iSense. The residual limb models were made from plaster casts of patients who had undergone transtibial amputations. All casts were de-identified and varied in size, shape and length. Shape of casts included representations of cylindrical, bulbous and conical shaped limbs. Length of casts ranged from 20 to 32 cm. The casts were fabricated by a prosthetist (Appliance and Limb Centre, Redfern, Australia), and represented the standard type of positive mould used to fabricate sockets in that particular clinic. The prosthetist randomly selected casts from a pool of de-identified casts in the clinic. In order to detect an ICC of 0.9, power of 80% and alpha of 0.05, a sample size of 13 was used. 11 We used a machined steel rod of known dimensions to assess criterion validity of the iSense. Volumetric measurements of the rod were obtained using the iSense, and compared with the actual volume of the rod. The rod was chosen as the criterion standard because the true volumes of the residual limb models were not known. The rod was machined from steel and dimensions were measured using Vernier callipers with an accuracy of 0.02 mm. The length of the rod was 323 mm and diameter 10.05 mm, with corresponding volume of 2562.27 cm3. We chose to use an object of known dimensions (instead of water displacement volumetry) as the gold standard due to evidence suggesting that water displacement volumetry does not consistently produce accurate volumetric measures.3,8
iSense scanner
The iSense scanner is a commercial optical scanner that attaches to the camera of an iPad or iPhone. It is simple to operate. The user holds the iSense scanner approximately 60 cm from the object of interest and allows the geometry to register. Once the geometry is registered, the user walks slowly around the object to capture all of its features. The scanner then uses these captured images to create a three-dimensional model. These three-dimensional models are then imported into meshing software where they can be visualised, and their volumes can be quantified.
Assessors
All measurements were performed by three assessors. Assessor 1 was a physiotherapist, assessor 2 was an engineer, and assessor 3 was an engineering student. All assessors undertook a 2-h training session prior to data collection. The training included reading instructions on the set up and scanning process, watching online videos of the scanning process and practice of the scanning of objects such as bottles of varying sizes.
Measurement procedures
There are two aspects of the measurement procedure: (a) scanning of the limb models and (b) post-processing of the three-dimensional models. We describe these two steps of measurement procedures as follows.
Reliability
Prior to the scanning of the limb models, assessors marked the models to designate the volume of interest. Markings were made in the following areas: medial knee joint line, apex of patella, lateral knee joint line, points 10 cm proximal to the medial knee joint line, apex of patella and lateral knee joint line. These points were measured using a tape measure and marked with a three dimensional marker (Figure 1(a)). This was followed by the scanning of the limb models. Each assessor performed a total of 26 measurements (two measurements on each limb model). Each scan took 2 min with a 2-min interval between measurements. The order of the 26 measurements conducted by each assessor was randomised. All assessors were blinded to other raters’ volume measurements, but were not blinded to their own measurements.
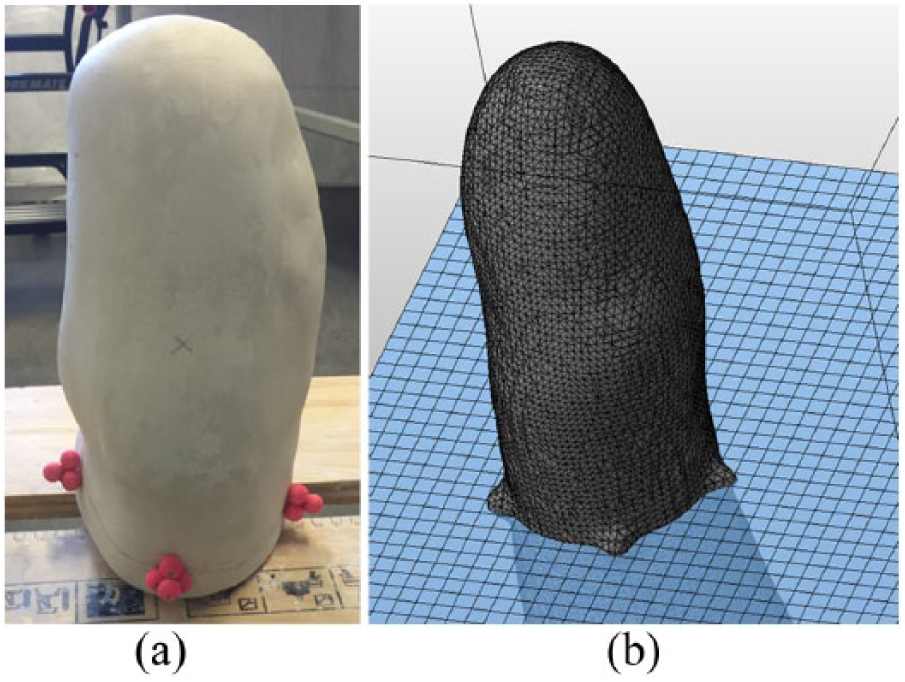
(a) Residual limb plaster mould with 3D markers attached 10 cm proximal to joint line. These markers were used to define the volume of interest. NB: Residual limb cast was scanned in inverted position. (b) Alignment of models on cutting platform in Netfabb Basic.
The scanning process was followed by the post-processing phase where assessors extracted volumetric measurements independently. In order to process the three-dimensional models, the image files were imported into Netfabb Basic (Autodesk, USA). Assessors created a plane between the markers to designate the proximal boundary of the volume of interest. The volume of interest was chosen to include the geometry of the limb proximal to the knee joint. This portion of the limb may be of use in prosthetic fabrication.
The three-dimensional markers on the limb were aligned on a cutting plane, and the model was cut to separate out the volume of interest (Figure 1(b)). We based our marking and processing system on those used in previous studies.3,8,12
Criterion validity
Ten repeated measurements of the rod were performed by one assessor with a 2-min break between scans. The process for performance of the scan was identical to the reliability portion of the study. As the volume of the full rod geometry was being assessed, no post processing was required before the volume was extracted in Netfabb Basic (Autodesk, USA). Rod length, volume and average diameter were recorded for each scan. As the diameter of the captured geometry was not always uniform in all directions (i.e. the scan did not capture a perfectly circular rod), an average of the diameter along two orthogonal planes through the centre of the geometry was taken for each measurement.
Statistical analysis
Reliability
Our study examined intra-rater reliability of the iSense, that is, the extent to which iSense measurements are similar when measured by a single assessor. 13 We also examined inter-rater reliability, that is, the extent to which iSense measurements are similar when measured by different assessors. 13 Reliability statistics were presented in terms of descriptive statistics (mean difference ± SD) and ICCs and their 95% confidence intervals (CIs). We used the following convention to describe the strength of ICC: 14
ICC of 0–0.49 = ‘Poor’
ICC of 0.5–0.74 = ‘Moderate’
ICC of 0.75–0.89 = ‘Good’
ICC of 0.9–1.00 = ‘Excellent’.
For intra-rater reliability, ICC (2, 1) was calculated for each assessor using the two measurements performed on each limb model. For inter-rater reliability, ICC (2, 1) was calculated between assessors based on the first measurement performed on each model. In addition, Bland-Altman plots 15 were used to examine the agreement between assessors.
Criterion validity
Our study examined criterion validity of the iSense, that is, the extent to which iSense measurements are similar when measured against the true volume of an object.
A t-test was performed to detect any significant differences between iSense volumetric measurements and the true volumetric measurement of the steel rod. Mean differences in volume standard deviation (SD) and 95% CIs were reported. All statistical analyses were conducted using SPSS 24 (IBM, USA).
Results
We summarised the descriptive statistics and ICCs for reliability in Table 1. The iSense demonstrated excellent intra-rater reliability. ICCs ranged between 0.991 and 0.997 for all three assessors. In all, 95% CIs ranged between 0.971 and 0.999. There was no statistically significant difference between intra-rater measurements for any of the three assessors. There was good agreement within the assessors, as visualised in the Bland Altman plots in Figure 2(a)–(c). Mean differences (SD) in volume within assessors were small and ranged from −5.4 (77.11) mL to 3.05 (83.11) mL.
Intra-rater and inter-rater reliability measurements for iSense.
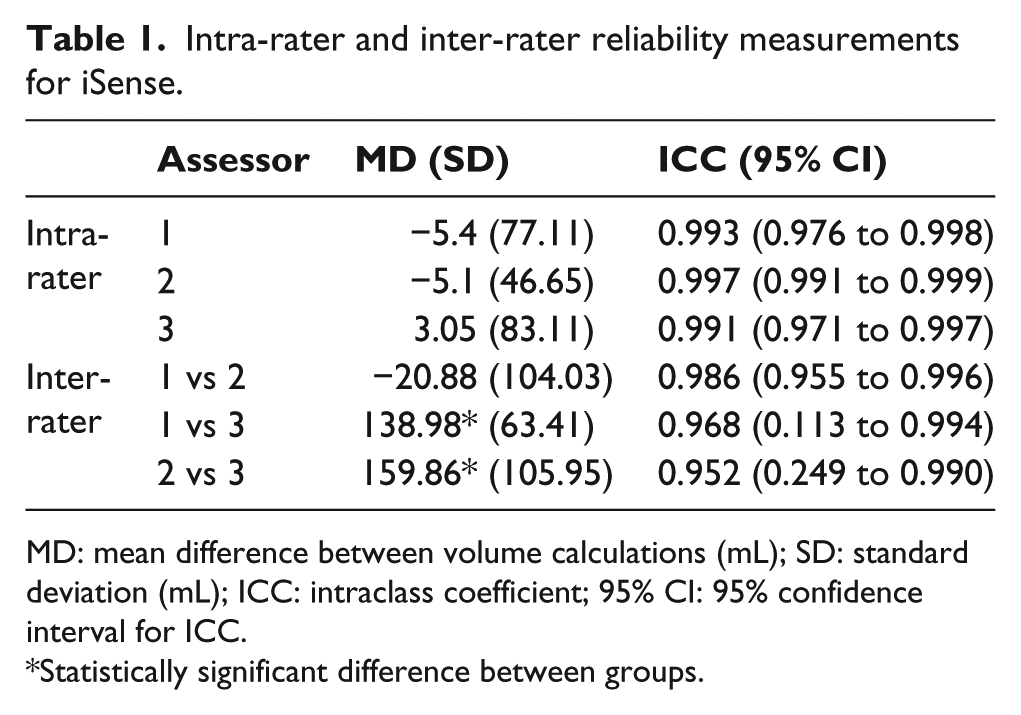
MD: mean difference between volume calculations (mL); SD: standard deviation (mL); ICC: intraclass coefficient; 95% CI: 95% confidence interval for ICC.
Statistically significant difference between groups.
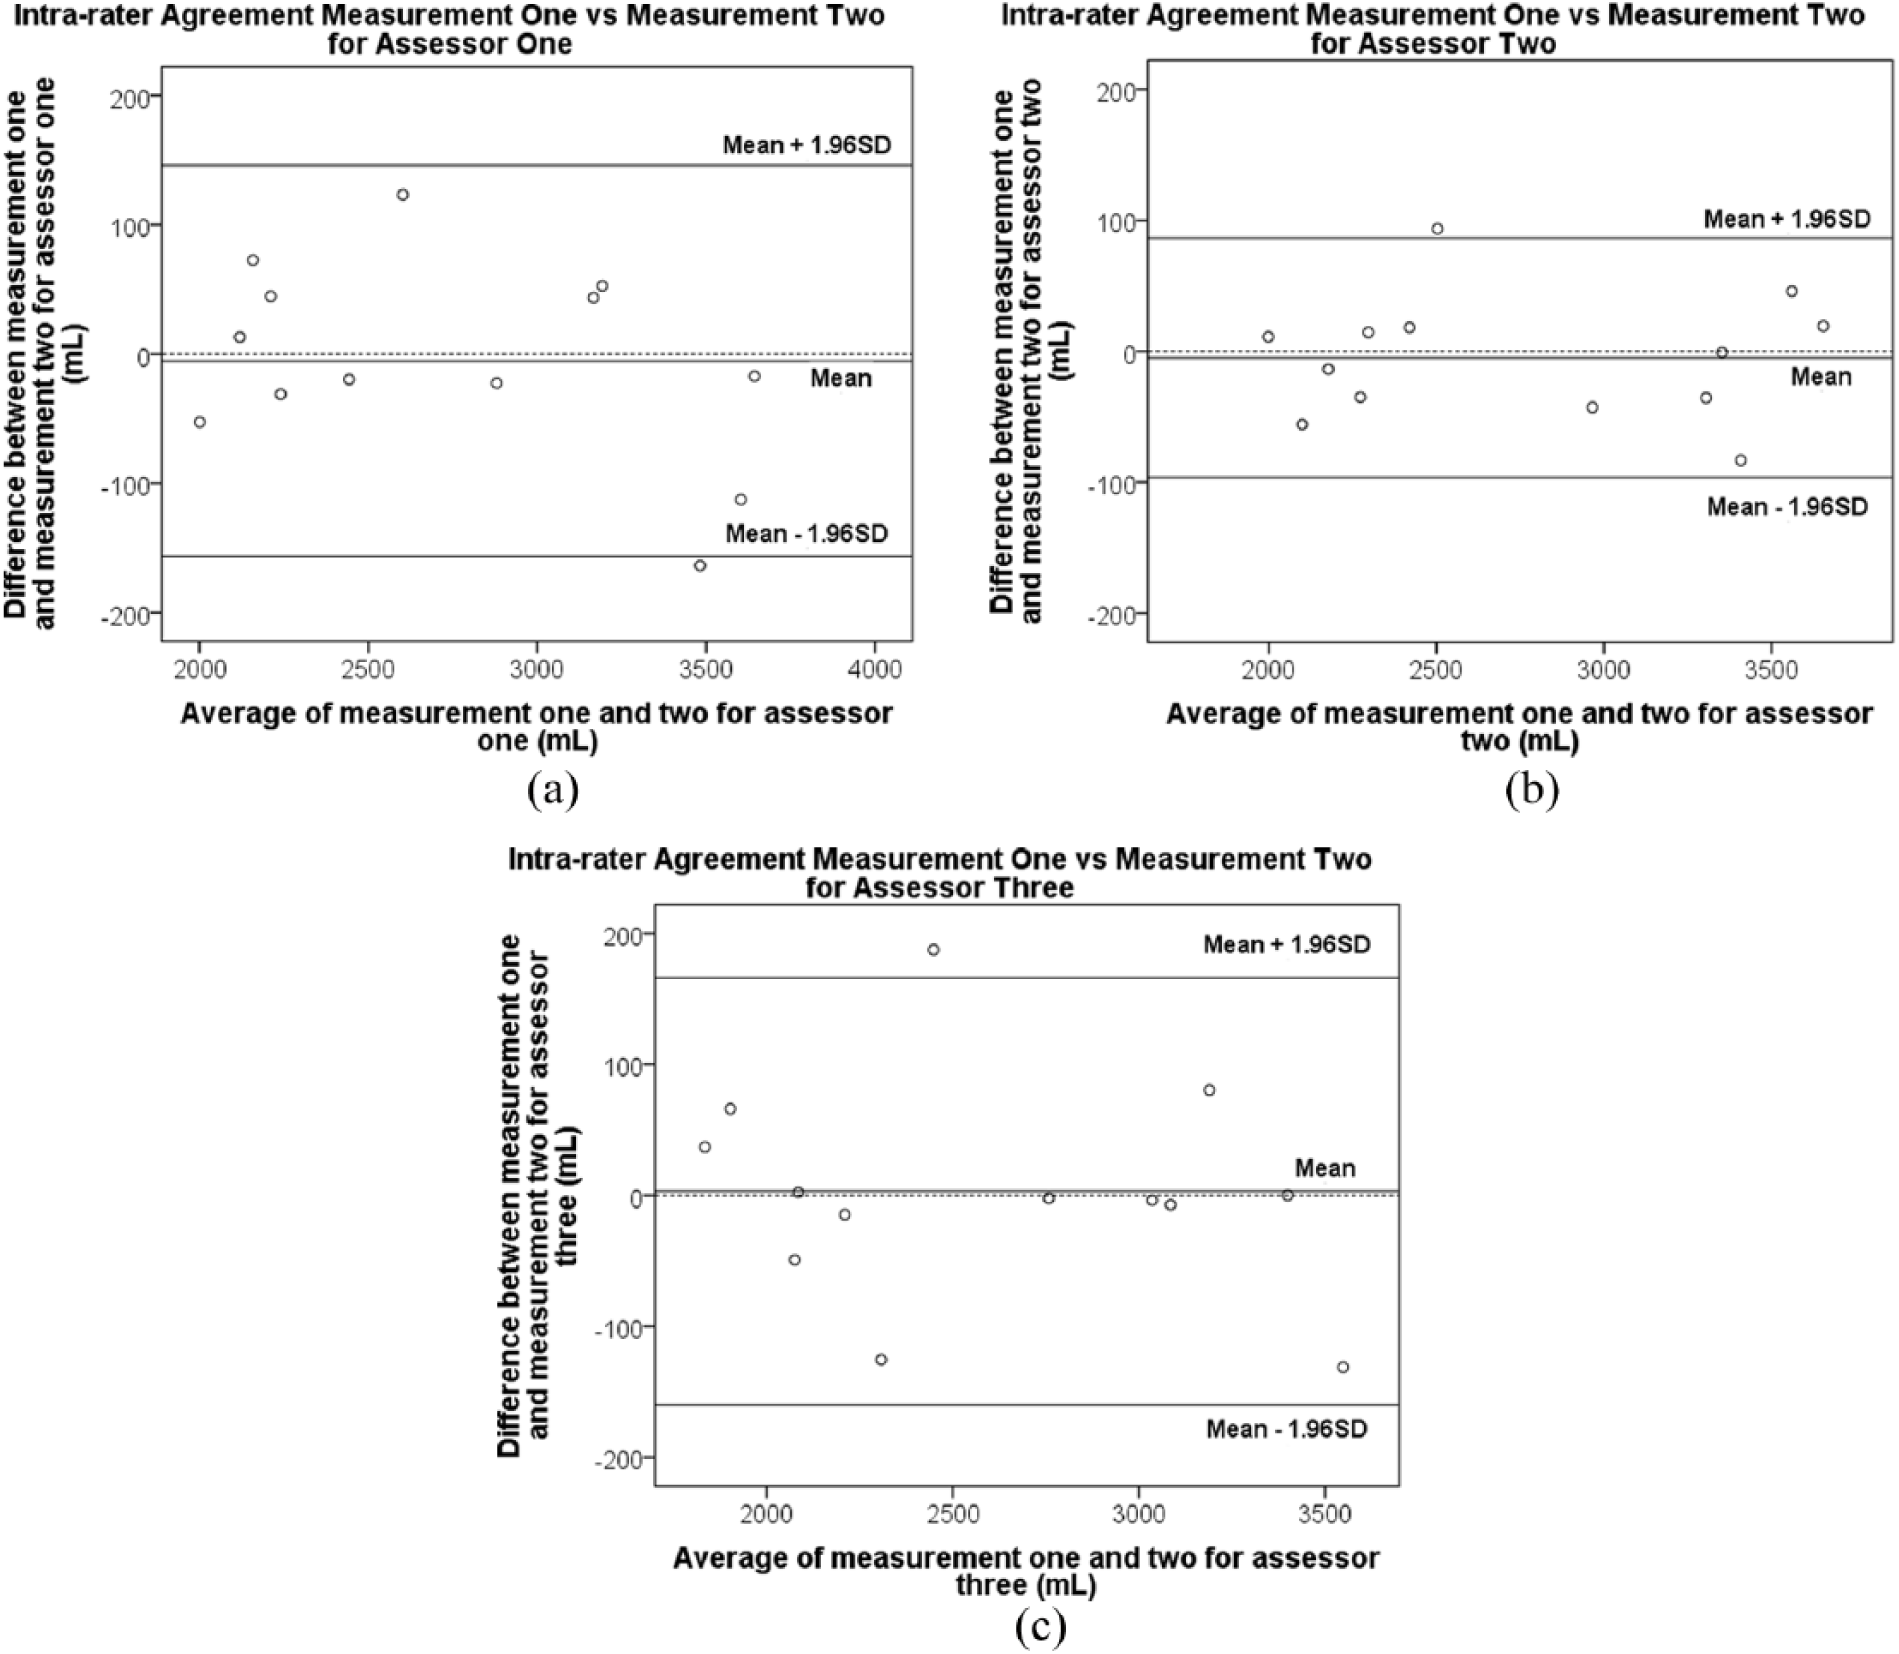
Intra rater agreement for repeated measurements by (a) assessor 1, (b) assessor 2, and (c) assessor 3.
Results for inter-rater reliability were variable. Between assessors 1 and 2, inter-rater reliability was excellent (ICC = 0.986, 95% CI: 0.955–0.996). There was also good agreement between these raters, as visualised in the Bland Altman plots in Figure 3. However, the inter-rater reliability between assessors 1 and 3 and between assessors 2 and 3 were poor (see Table 1). Poor agreement was also observed in the Bland-Altman plots (see Figure 3). Analysis of variance (ANOVA) results suggested that there were statistically significant differences between measurements of assessors 1 and 3, and measurements of assessors 2 and 3. Mean differences (SD) in volume between assessors were large and ranged from −20.74 (104.03) mL to 159.86 (105.95) mL.
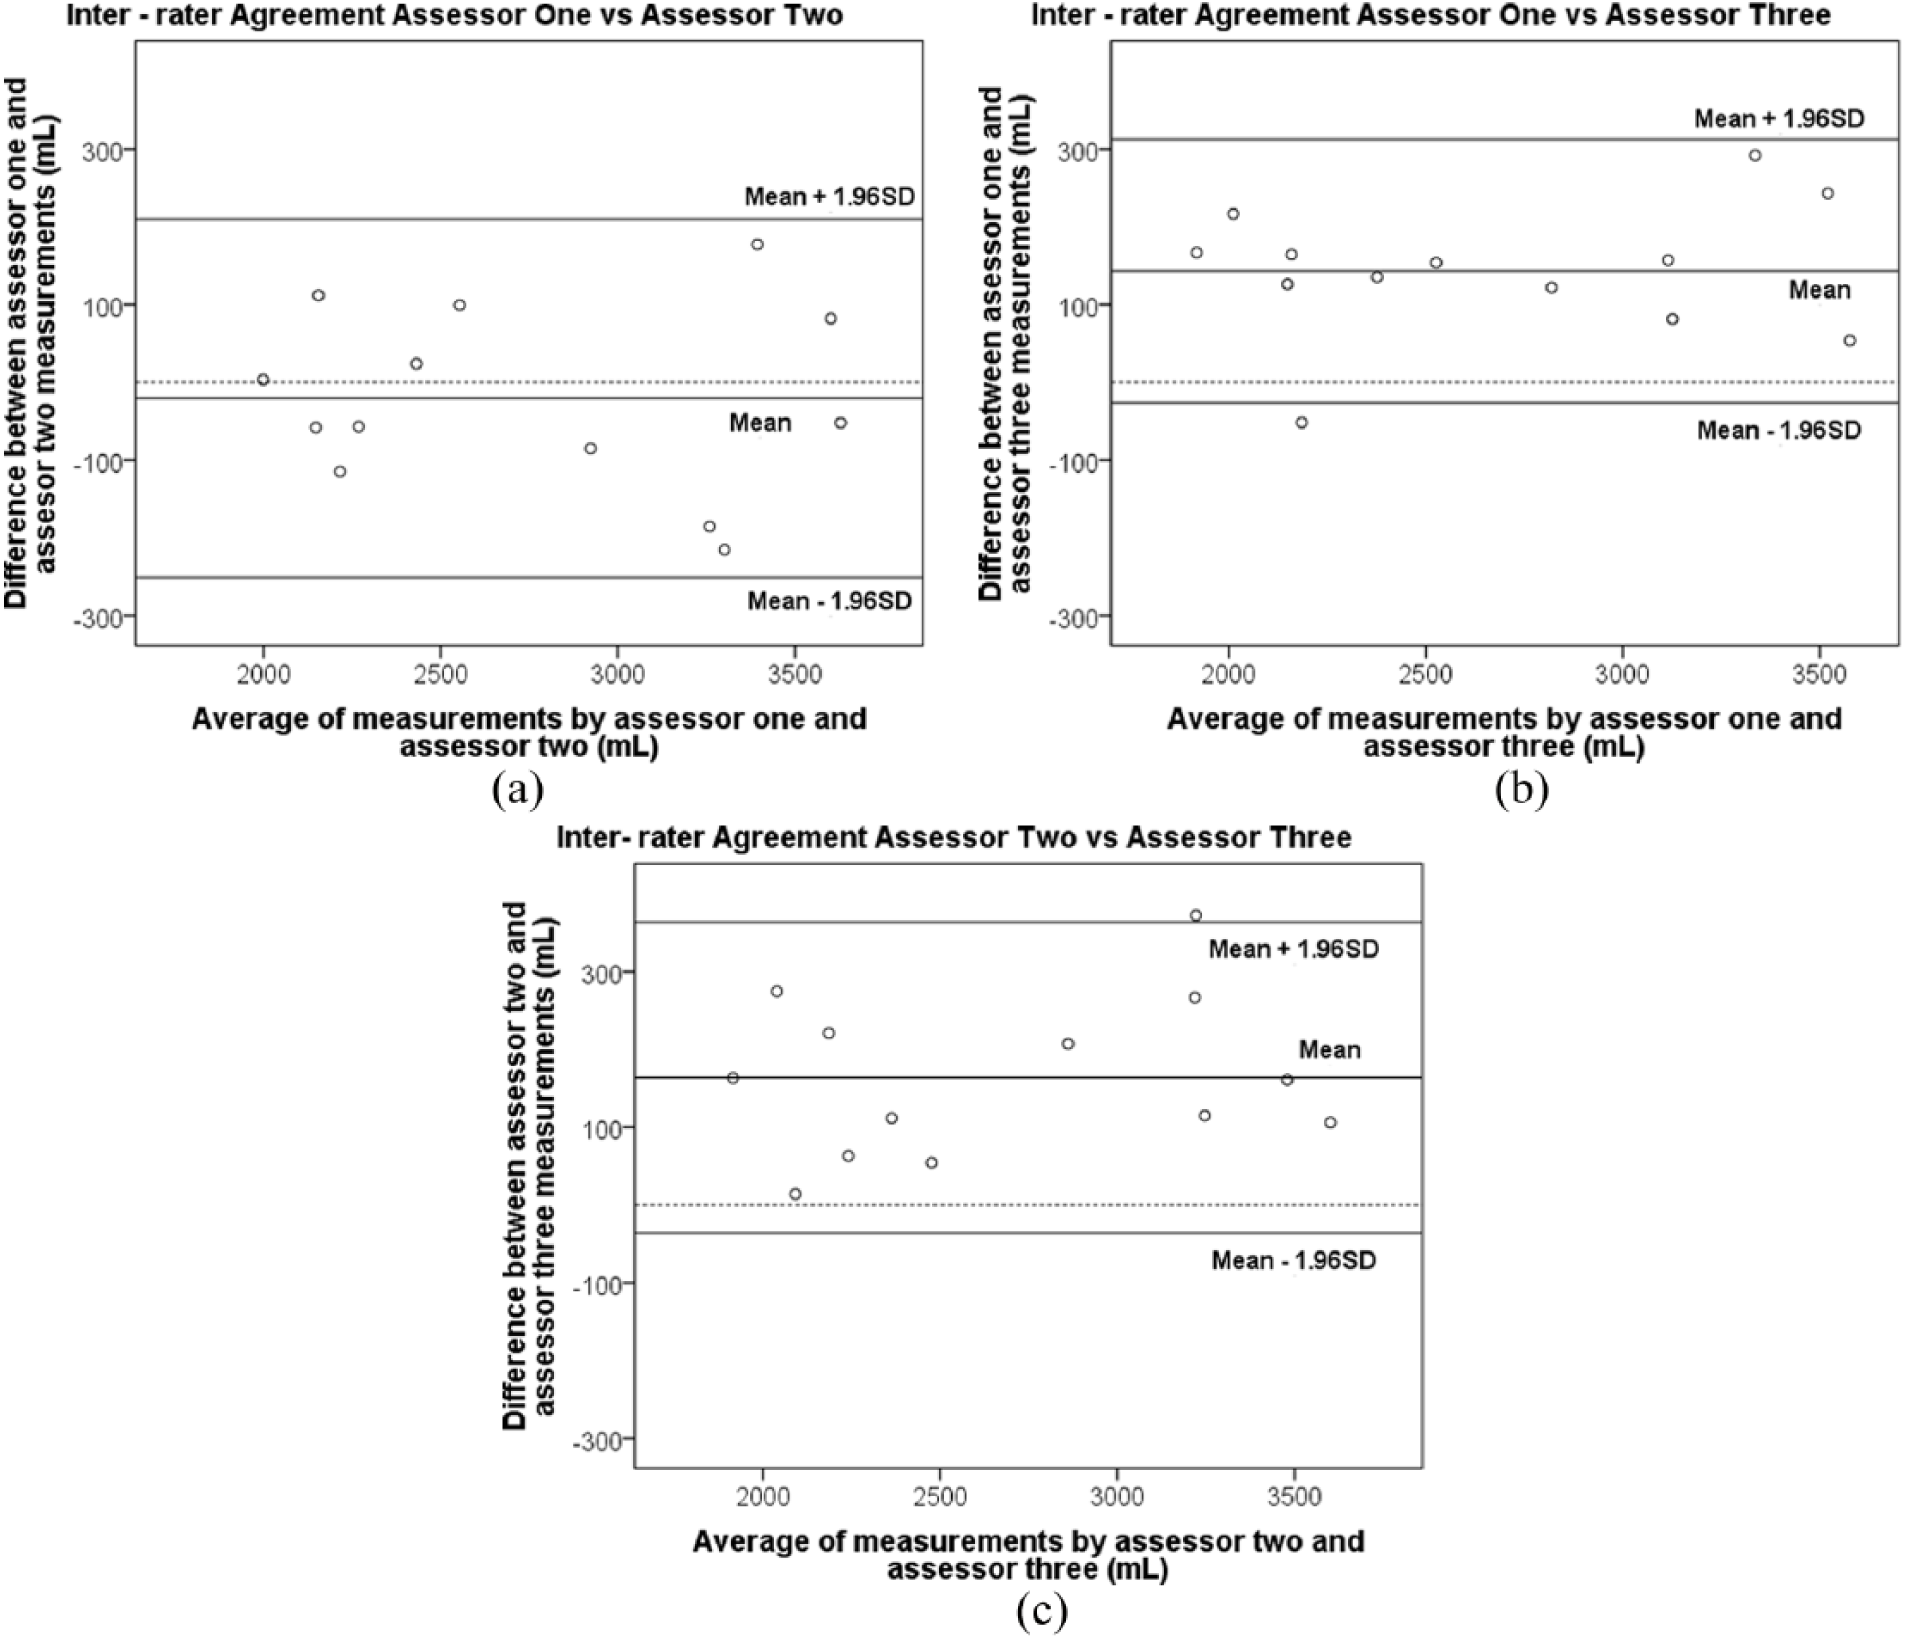
Inter rater agreement between (a) assessors 1 and 2, (b) 1 and 3, and (c) 2 and 3.
In assessment of criterion validity, a t-test found a statistically significant difference between the measured volumes and the true volume of the rod phantom (mean difference 221.18 mL; p < 0.001, 95% CI: 163.8–278.6 mL). There is systematic overestimation of volume by the iSense (Figure 4). This overestimation is also demonstrated in length and average diameter measurements (Table 2, Appendix 1).
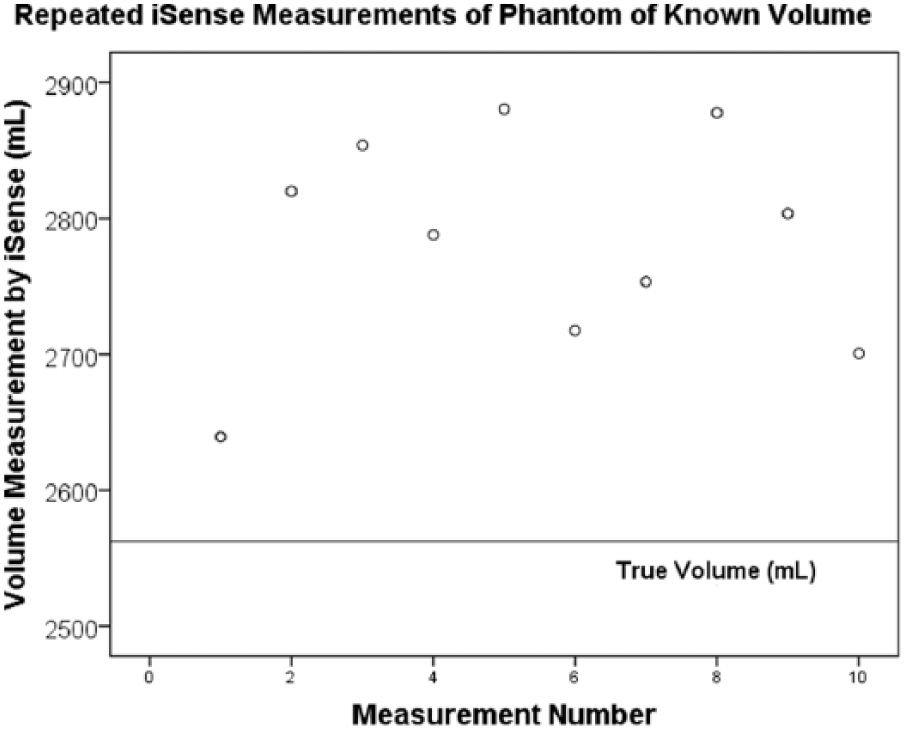
Comparison of iSense volume measurements to true volume.
Discussion
To the best of the authors’ knowledge, this is the first study to investigate the reliability and criterion validity of the iSense scanner for the measurement of residual limb volume. The iSense demonstrated excellent intra-rater reliability, though this was not consistently shown for inter-rater reliability. Criterion validity of the iSense was very poor; results indicate that the iSense overestimated volume measurements by a significant difference of ~220 mL.
Several studies have investigated the reliability of optical or laser scanners.3 –9,12,16 –19 However, only one of these studies provided appropriate reliability estimates (i.e., ICC) to allow comparison with our study. Dickinson et al. 5 tested the intra-rater and inter-rater reliability of three laser scanners (VIUScan, GoScan and Sense) on 20 transtibial limb models. All three scanners demonstrated excellent intra-rater (ICC = 0.998, 95% CI of ICC = 0.993–0.999) and excellent inter-rater (ICC = 0.996, 95% CI of ICC = 0.990–0.998) reliability. Our results are similar for intra-rater reliability, but not for inter-rater reliability. Although the ICCs for inter-rater reliability in our study appear excellent (i.e. ICCs > 0.95), the 95% CIs of ICCs were too wide between assessors 1 and 3 (95% of ICC = 0.113–0.994), and between assessors 2 and 3 (95% of ICC = 0.249–0.990) for us to conclude that the iSense has acceptable inter-rater reliability. We are uncertain of the reasons why the measurements of assessor 3 were markedly different from the measurements of assessors 1 and 2. To identify if the problem with assessor 3’s measurements was in the scanning or the post-processing phase, assessor 1 conducted post-processing on assessor 3’s scans and compared results with that of assessor 1. Inter-rater reliability remained poor (ICC = 0.852; 95% CI of ICC = −0.022–0.973). This suggested that the scanning procedure used by assessor 3 was the likely cause of variability in results.
It is possible that expansion of the study to include more and more experienced assessors may have resulted in improved inter-rater reliability. It is also possible that improved training of assessor 3 may have improved inter-rater reliability. This result suggests that the iSense scanner volume measurement should be used with caution, particularly by less experienced assessors. Future studies can explore using more experienced assessors or standardising levels of training to assess the effect of levels of experience on reliability results.
Although all three assessors spent 2 h undertaking training and practice with the iSense, assessors 1 and 2 had slightly more practice with the iSense. Both assessors were involved in two other research projects which required them to use the iSense to scan the volume of objects and the residual limb volume of people with transtibial amputations. It was estimated that assessors 1 and 2 had conducted 15 additional scans each and perhaps, this amount of training was required to ensure consistent reliability results.
Our results revealed that the iSense overestimated volume measurements by a large margin of ~220 mL. Previous research had identified anything above a 5% change in volume to be clinically significant.2,8 This represented the change in volume associated with the addition or removal of one sock to the person’s residual limb. 20 In our study, a 5% change in volume corresponded to a volume between ~80 and 160 mL. Considering the difference between the mean iSense measurement and the true rod volume was greater than 160 mL, we surmised that the iSense may have limited ability in detecting clinically meaningful volume changes, particularly between assessors.
Validity results for laser scanners have been mixed in the literature. Some studies demonstrated that the scanners had sufficient precision for clinical use and were substantially equivalent to other measurement modalities (e.g. circumferential measures or water displacement) with errors ranging from 2.5% to 6% of measured volume,4 –7,16 while others found substantial differences between scanner methods and these measurement modalities, most of which were systematic differences that could be accounted for.3,12 Our study found that the iSense was not a valid tool for measuring the volume of regularly shaped cylindrical objects, with errors in the range of 3%–6%. Specifically, it tended to overestimate volume. This agrees with other studies examining optical surface scanners.3,7,21 If the overestimation is systematic regardless of geometry, it can be accounted for by subtracting the known overestimation from the total volume. It is not clear from our study if the overestimation is consistent for geometry that is more complex than a cylindrical rod. Other studies have found that errors increase when more complex geometry, such as that of a residual limb, is measured. 22 This eventuality needs to be considered when evaluating the clinical utility of the iSense scanner. We hypothesise that the iSense overestimation may be attributed to factors such as inadequate resolution. It was designed for recreational use and marketed towards the general public and therefore would not require extreme accuracy in most expected applications. Variation in scan time and positioning may also have affected the accuracy of the volume measurement. Finally, the scanner identifies the point at which to segment the geometry of interest from surrounding objects based on the initial set up position controlled by the assessor. As the rod was placed on a workbench to perform the measurements, it is possible that some section of the workbench was taken to be part of the base of the rod by the scanner thereby resulting in a larger volume. Therefore, other scanners that have been validated in this application may be a more appropriate clinical choice than the iSense.4 –7
The use of clinical gold standards as reference volumes for validity assessment has had different approaches in the literature.3,5,8,12,23,24 Water displacement volumetry is the most commonly used method and despite the presence of errors, 3 it is the best available clinical method at this time, 8 and has been shown to be reliable and valid.8,12,23 Other studies have used an object of known volume to assess the criterion validity of a measurement method.5,24 Our study adopted this method due to the availability of a machined steel rod, lack of access to a volumeter, and the suggestion that water displacement volumetry can be prone to errors.3,8
Limitations
Our study had several limitations. Scanning time for each measurement by each assessor was not standardised. Different durations for scans may have resulted in different resolutions of the geometry captured, which may affect volume measurements.18,25 Future studies may consider standardising the time for each scan. Second, the limb models were inverted in the study and did not resemble the position of residual limbs in clinical practice. This could have been considered in this study protocol, by positioning the model with the rounded end of the limb facing downwards to simulate standing, or horizontally to simulate a supine position. Third, the geometry of the rod used in validity testing may have affected the results; in particular, right angles may introduce error. Future studies should use a geometry of known volume, free from right angles. Finally, although we have included a physiotherapist and engineers as assessors in the study, having a prosthetist might increase the representativeness of assessors who might use the iSense in future. Future studies may also consider testing the validity of the iSense with water displacement volumetry.
Conclusion
Although intra-rater reliability was excellent for the iSense scanner, we did not find similar results for inter-rater reliability and validity. These results suggest that further testing of the iSense scanner is required prior to use in clinical practice.
Footnotes
Appendix 1
iSense measurements of rod dimensions.
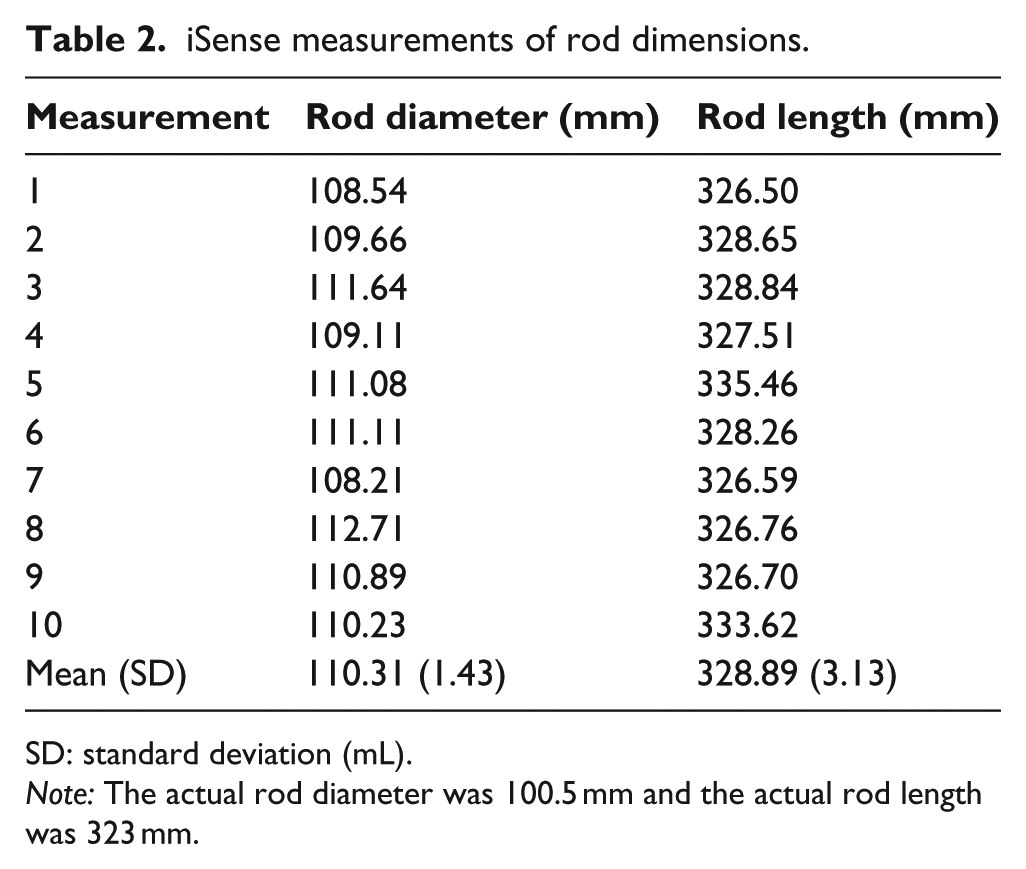
| Measurement | Rod diameter (mm) | Rod length (mm) |
|---|---|---|
| 1 | 108.54 | 326.50 |
| 2 | 109.66 | 328.65 |
| 3 | 111.64 | 328.84 |
| 4 | 109.11 | 327.51 |
| 5 | 111.08 | 335.46 |
| 6 | 111.11 | 328.26 |
| 7 | 108.21 | 326.59 |
| 8 | 112.71 | 326.76 |
| 9 | 110.89 | 326.70 |
| 10 | 110.23 | 333.62 |
| Mean (SD) | 110.31 (1.43) | 328.89 (3.13) |
SD: standard deviation (mL).
Note: The actual rod diameter was 100.5 mm and the actual rod length was 323 mm.
Author contribution
All authors contributed equally in the preparation of this manuscript.
Declaration of conflicting interests
The author(s) declared no potential conflicts of interest with respect to the research, authorship, and/or publication of this article.
Funding
The author(s) disclosed receipt of the following financial support for the research, authorship, and/or publication of this article: LA was supported by an Australian Government Research Training Program Scholarship as part of her doctoral studies, other authors received no financial support for the research, authorship and/or publication of this article.