
Abstract
Background:
Dynamic elastic response prosthetic feet are designed to mimic the functional characteristics of the native foot/ankle joint. Numerous designs of dynamic elastic response feet exist which make the prescription process difficult, especially because of the lack of empirical evidence describing the objective performance characteristics of the feet.
Objectives:
To quantify the mechanical properties of available dynamic elastic response prosthetic feet, specifically the stiffness and hysteresis.
Study design:
Mechanical testing of dynamic elastic response prosthetic feet.
Methods:
Static Proof Testing in accordance with ISO 10328 was conducted on seven dynamic elastic response prosthetic feet. Load–displacement data were used to calculate the instantaneous stiffness in both the heel and forefoot regions, as well as hysteresis associated with each foot.
Results:
Heel stiffness was greater than forefoot stiffness for all feet. The heel of the glass composite prosthetic foot was stiffer than the carbon fiber feet and it exhibited less hysteresis. Two different carbon fiber feet had the stiffest forefoot regions.
Conclusion:
Mechanical testing is a reproducible method that can be used to provide objective evidence about dynamic elastic response prosthetic foot performance and aid in the prescription process.
Clinical relevance
The quantitative stiffness and hysteresis data from this study can be used by prosthetists to aid the prescription process and make it more objective.
Background
The primary goal of prosthetic components is to restore the functional capabilities of an amputee patient. In the case of lower extremity prostheses, this goal manifests itself in restoring an individual’s gait. Individuals desire improved functionality of their prosthesis to allow participation in sports and other physically demanding activities, beyond the original intent to restore functional ambulation. A demand for prosthetic components that allow for a more active lifestyle, and thereby an improved quality of life, prompted the emergence of a new class of prosthetic feet.1–3 dynamic elastic response (DER) feet or dynamic storage and return (DSR) prosthetic feet are designed to mimic the energy storage and return properties of the native foot and ankle joint. Drawing inspiration from the native ankle joint, the heel of a DER prosthetic foot absorbs energy at heel strike during the gait cycle. The DER foot is designed so that this energy is then returned by the forefoot and used to propel the body forward at toe off, improving gait because of this feature.1,4 Since DER feet are passive devices, they are not able to exactly replicate the native ankle joint, which can provide upward of 500 times the work that was input during gait.1,5 The prosthetic materials absorb energy and the amount of energy lost to friction as heat and sound is great.2,6 Regardless, in efforts to improve functionality, various manufacturers have released DER feet using unique materials and designs with the goal of meeting the requests of active patients with limb loss.
Numerous manufacturers and models of DER feet have made the prescription process difficult and often subjective.7–9 A clinical consensus on the prescription of prosthetic feet has not been reached, and currently insufficient quantitative evidence exists to support a consensus.4,7–9 The prescription process typically involves assessing one or more of the following patient characteristics: age, activity level, ability, gait dynamics, and amputation level.2,3,7,10 However, not only patient characteristics must be taken into account but also the intrinsic properties and potential performance of the prosthetic feet must be considered. Currently, manufacturers often assign prosthetic feet a specific category. Categorizations are not consistent across manufacturers, adding another level of complexity when deciding upon the ideal prosthetic foot for an individual.
In efforts to distinguish prosthetic feet, many functional studies have been conducted comparing the different types of DER feet, with varying study designs and patient populations.10–13 However, the wide variety of study methodologies makes comparing foot performance difficult. Some have worked on correlating in vivo gait studies with compliance and stiffness mechanical testing data.4,13,14 Few of these aforementioned studies report the specific mechanical properties of the feet tested which could provide objective, quantitative measures to classify prosthetic feet. Mechanical properties, such as stiffness and hysteresis, are not influenced by intersubject variability when measured in vitro; thus, they are more representative of the potential performance of the prosthetic foot itself. However, as with the in vivo gait studies, significant variation exists in the current mechanical testing literature since there are numerous possible characteristics to analyze using a plethora of methods.3,4,15–21 Utilizing a repeatable and reliable testing method, such as an International Organization for Standardization (ISO) standard, will minimize the data variation, leading to the emergence of readily comparable results that can be used to differentiate prosthetic feet.
The purpose of this study was to quantify the mechanical properties, specifically instantaneous stiffness and hysteresis, of commonly prescribed DER prosthetic feet. ISO standard 10328 was used to assess the heel and forefoot regions. It was hypothesized that the glass composite prosthetic foot would be less stiff when compared with carbon fiber prosthetic feet. Furthermore, it was hypothesized that the glass composite prosthetic foot would exhibit less hysteresis.
Methods
Seven DER prosthetic feet (Figure 1; Table 1) were tested in compression, complying with ISO 10328. 22 These prostheses were sourced for a hypothetical high activity, 90.7 kg, male patient with a right side transtibial amputation. All prosthetic feet were 27 cm and coded L5986 and L5987. Each foot was tested with the manufacturer-provided foot covering to better represent actual clinical usage.
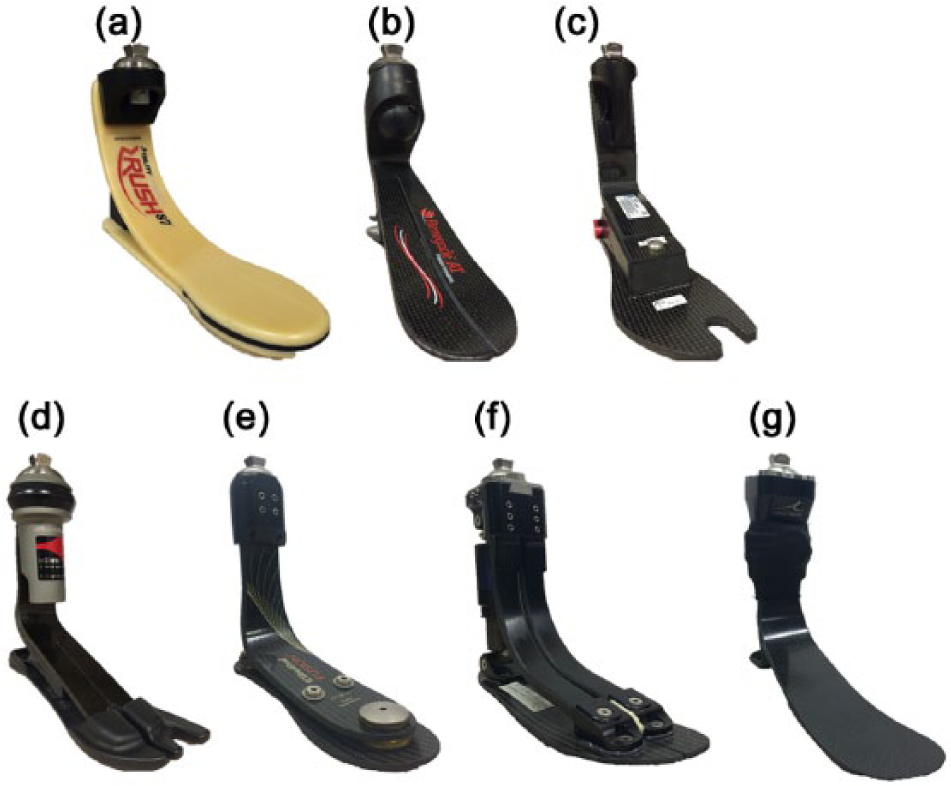
Prosthetic feet tested: (a) Ability Dynamics RUSH 87, (b) Freedom Innovations Renegade AT, (c) Össur Talux, (d) Ottobock Triton 1C61, (e) Ohio Willow Wood Fusion, (f) Ohio Willow Wood Pathfinder II, and (g) TaiLor Made Prosthetics foot.
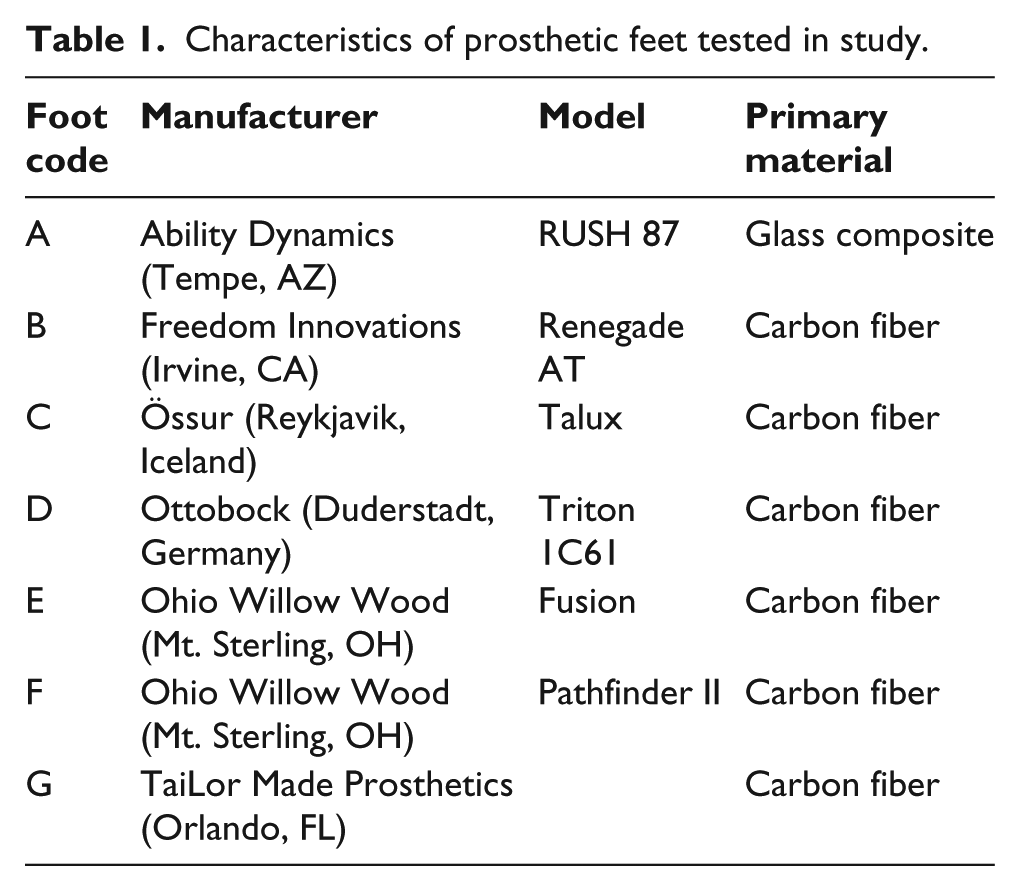
Characteristics of prosthetic feet tested in study.
The “Static Proof Test for Ankle-Foot Units” from ISO 10328, Section 17.2.3, was conducted for both the heel (Figure 2(a)) and forefoot (Figure 2(b)) of all aforementioned prostheses. Per ISO 10328, a vertical compressive force was applied at 100 N/s to a maximum load of 2240 N, then completely unloaded at the same rate using a servohydraulic test system (MTS 858 Mini Bionix II, Eden Prairie, MN). Three consecutive loading/unloading trials were conducted where the applied load and resulting axial displacement were recorded. Multipurpose TestWare software (MTS, Eden Prairie, MN) was used to control the loading and unloading of the system, as well as record the data (20 Hz).
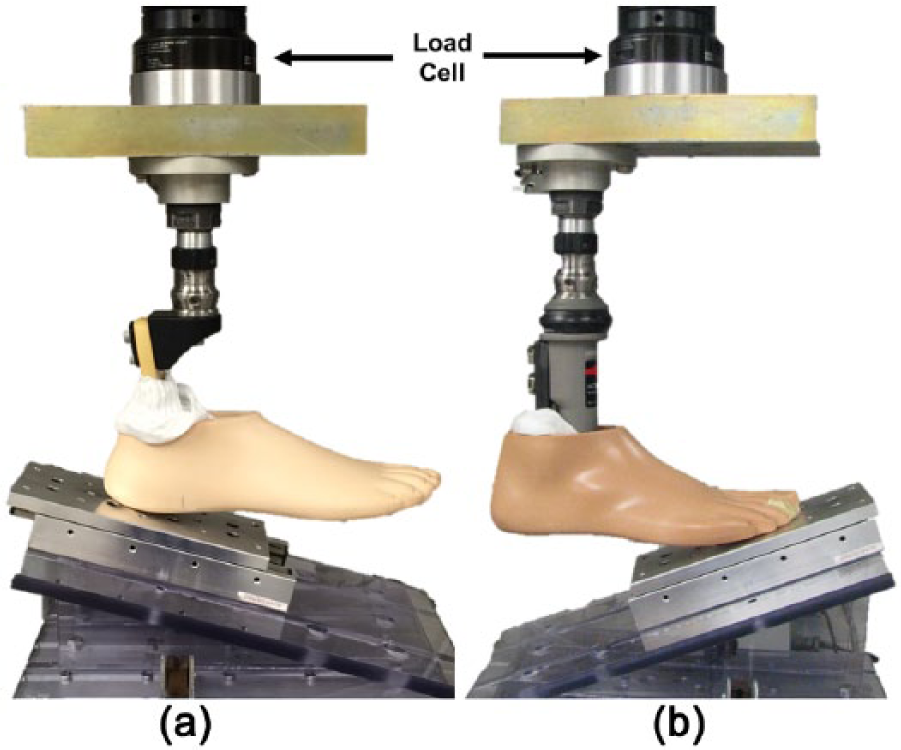
Vertically loaded prosthetic foot for (a) heel and (b) forefoot region. Inclination angle of 15° for heel and 20° for forefoot with a foot alignment of 7° toe out, per ISO 10328. Frictionless plate included under the foot to reduce shear forces acting on the foot.
For all prosthetic feet evaluated, instantaneous stiffness at both the heel and forefoot was determined using linear regression. The regression was over ±5% body weight (BW) for loads typically experienced during walking and moderately paced running, 1.2 × BW and 2.0 × BW, respectively. 23 Hysteresis, or energy loss, of each DER prosthetic foot was calculated as the difference between the loading input energy and unloading energy for both the heel and forefoot regions. Graphically, this can be visualized as the area enclosed by the loading and unloading curves.
Results
At the heel region, prosthetic foot A (glass composite) was the stiffest at both loading levels. It also exhibited the second greatest forefoot stiffness at both loads. This is apparent graphically by the steeper slopes of both load–displacement curves (Figure 3). At both loading levels, prosthetic feet with the least stiffness, or the most compliance, were feet D and F. The heel region of prosthetic foot D was the most compliant at a walking load, while the forefoot of foot F was the most compliant under the same loading conditions. Under the running load, prosthetic foot F had the most compliant heel and the forefoot of prosthetic foot D was the most compliant. Overall, heel stiffness was greater than forefoot stiffness, regardless of the loading level. As the loading level increased, the instantaneous stiffness of all prosthetic feet also increased.
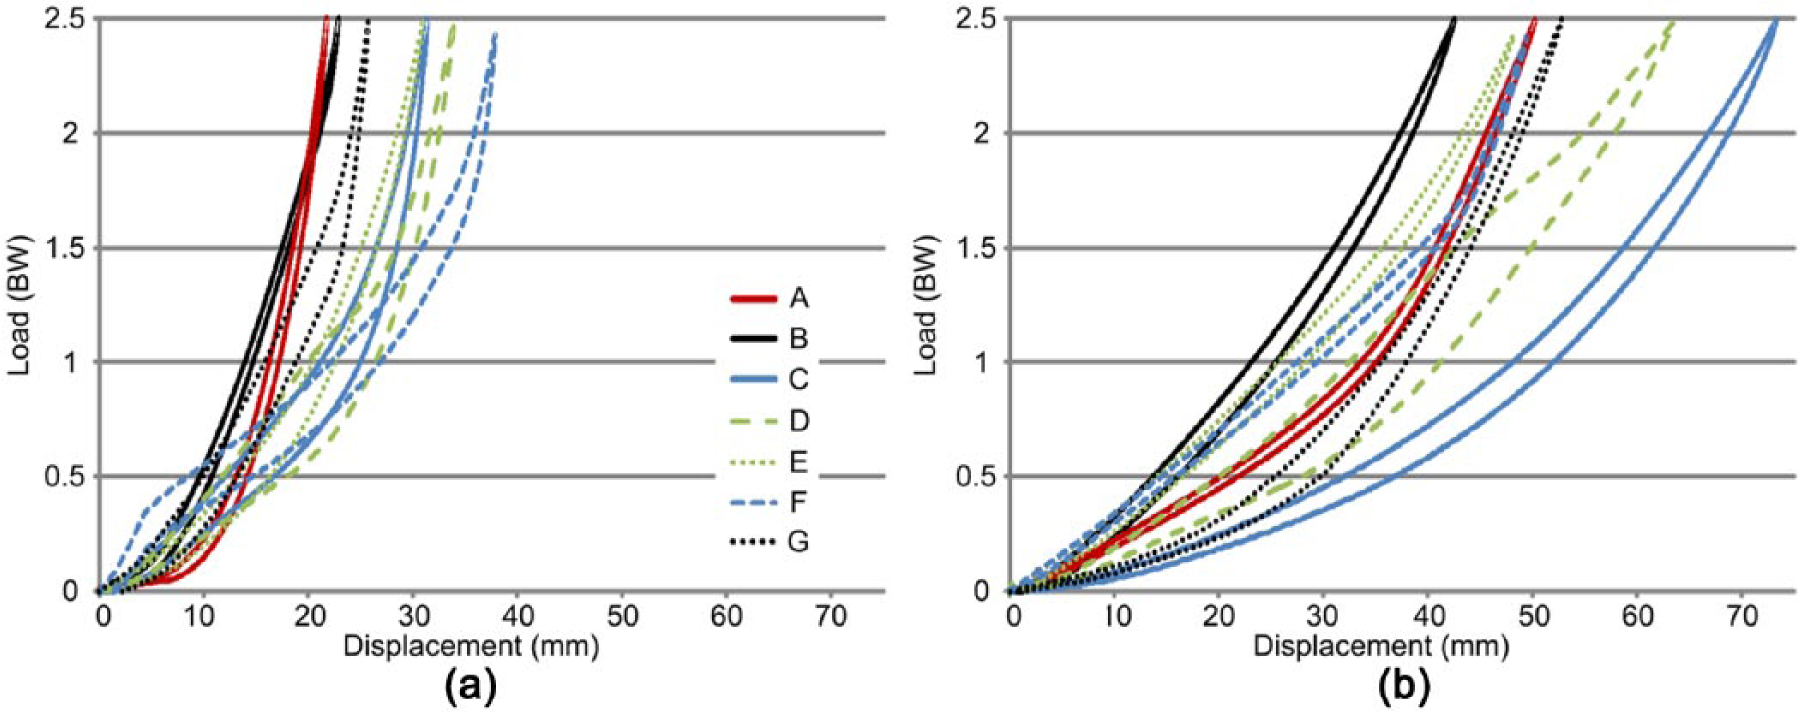
Load–displacement relationship for (a) heel and (b) forefoot regions. See Table 1 for prosthetic foot A-G information.
The looped load–displacement curves indicated hysteresis occurred in all prosthetic feet (Figure 3). When compared with the majority of carbon fiber DER prosthetic feet, prosthetic foot A did not lose as much energy, except when compared with the forefoot of foot F (Figure 4). The stiffer prosthetic feet, A and B (Table 2), had less absolute energy loss hysteresis compared to the other prosthetic feet. Foot D had both the greatest absolute hysteresis and percent hysteresis in the heel and forefoot regions.
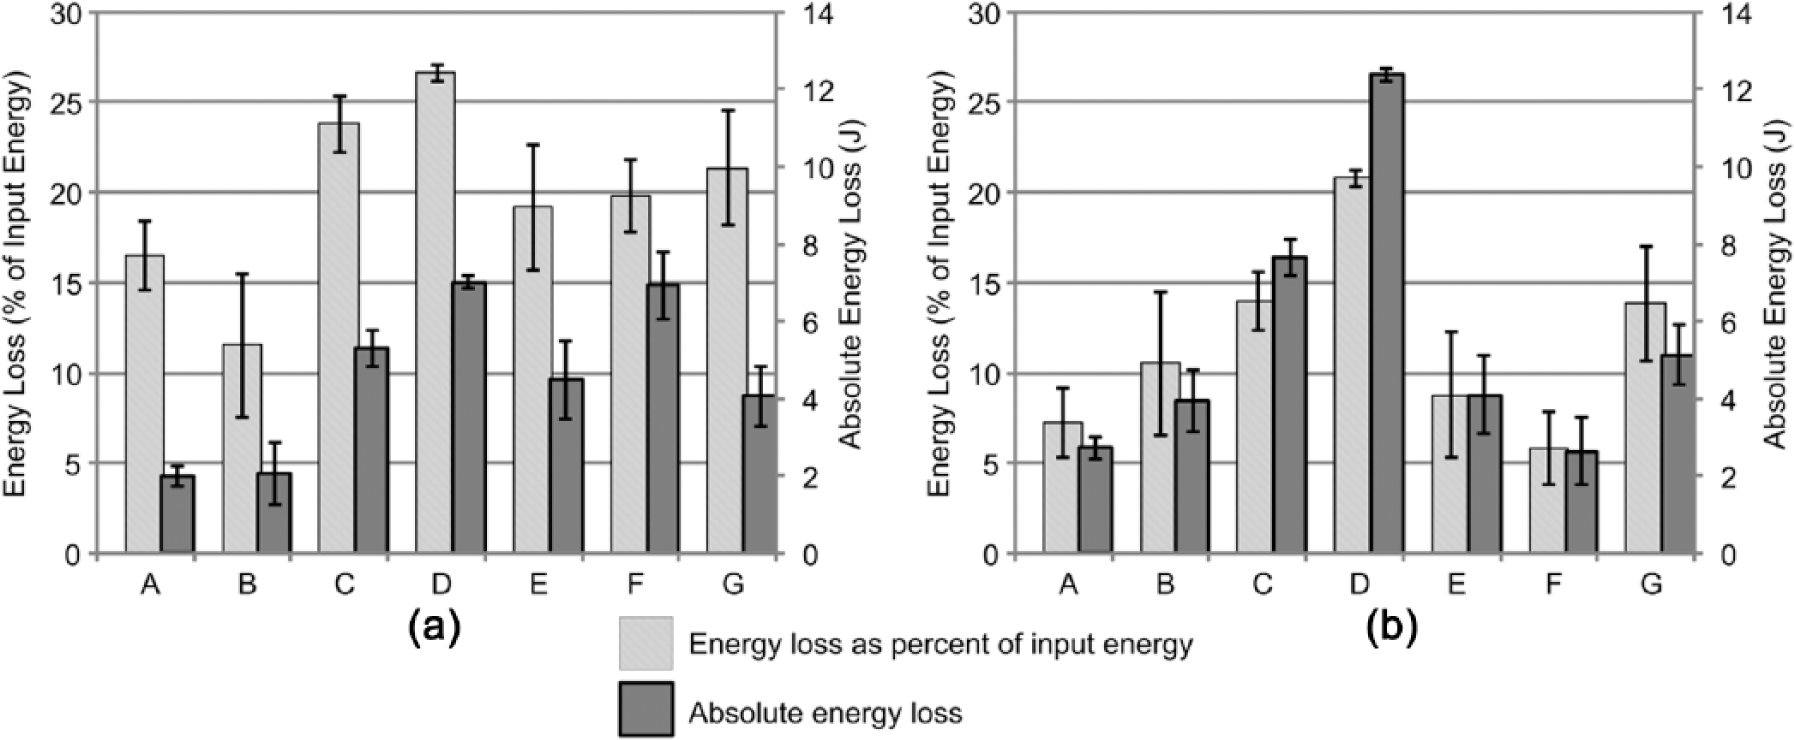
Hysteresis for (a) heel and (b) forefoot regions expressed as both percent of input energy (light gray) and absolute energy loss (dark gray). Error bars are the standard deviation. See Table 1 for prosthetic foot A-G information.
Instantaneous stiffness values ± standard deviation (SD) at 1.2 × BW and 2.0 × BW, representative of typical walking and running loads, respectively.
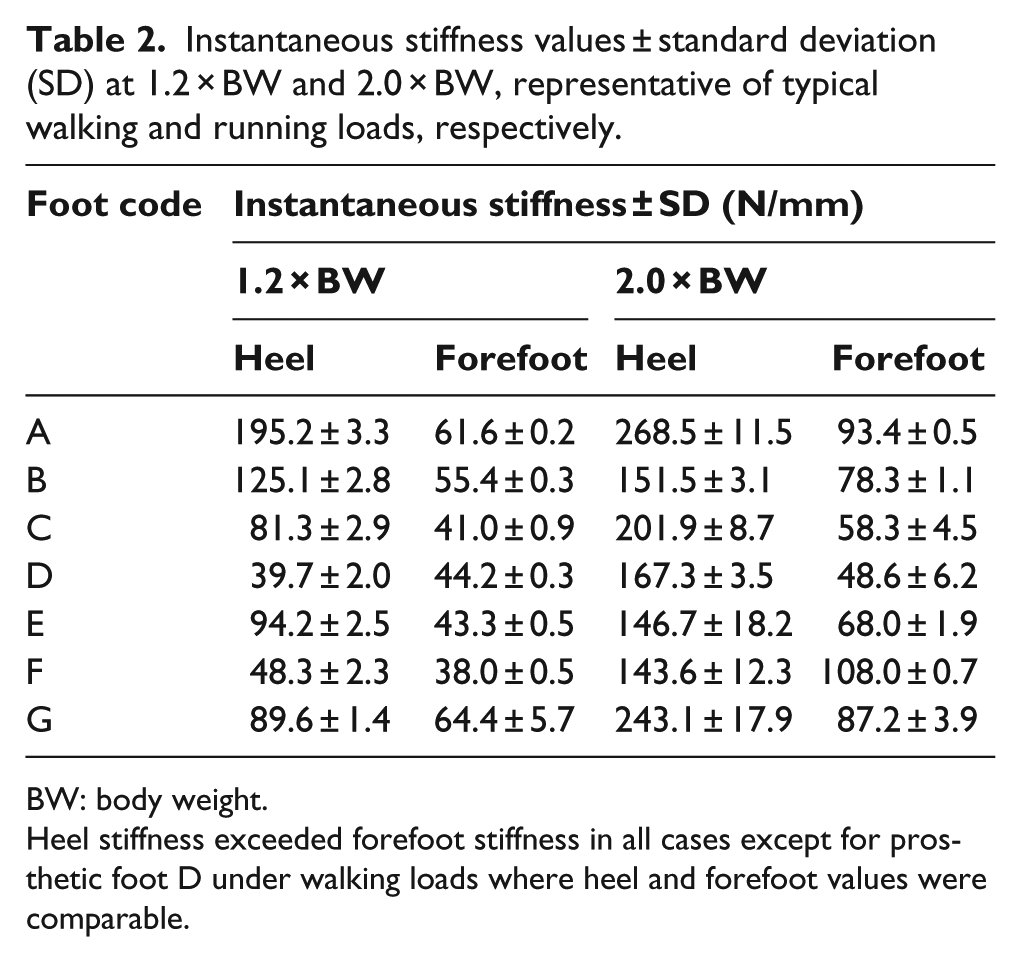
BW: body weight.
Heel stiffness exceeded forefoot stiffness in all cases except for prosthetic foot D under walking loads where heel and forefoot values were comparable.
Discussion
This study compared the mechanical properties of currently available prosthetic feet using an ISO standard. The stiffness ranged from 38.0 to 268.5 N/mm (Table 2) and the absolute hysteresis ranged from 2.0 to 12.4 J. It was hypothesized that the glass composite foot would have the lowest stiffness and least hysteresis. These hypotheses were rejected, except in the case of absolute hysteresis at the heel where foot A lost the least amount of energy.
The tested DER feet all exhibited nonlinear stiff-ness characteristics across the loading range applied. Consequently, to make a meaningful comparison between the feet, the instantaneous stiffness was calculated at two different loading levels, corresponding to walking and running. The shapes of the load–displacement curves reveal significant design information about each prosthetic foot. For example, foot A includes a rubber stopper at the heel that rests slightly above the bottom foot plate of the prosthesis. Thus, there are two distinct regions of stiffness for this foot (Figure 3) that correspond to the displacement of the bottom foot plate. When the foot plate came in contact with the rubber stopper, the stiffness of the heel increased significantly. The large amount of hysteresis evident for foot D (Figure 4) suggested that there was an energy absorbing component in the design of this prosthetic foot. The shock absorber included in the design of foot D dissipated part of the input energy, thereby decreasing the amount of energy released during unloading.
Stiffness of the human body and joints has been studied in vivo using linear and angular methods. A spring-mass system was utilized when analyzing stiffness in vivo.24–26 The body was assumed to be a point mass located at the center of mass, attached to a spring. Vertical stiffness and leg stiffness were calculated by dividing the ground reaction force by the displacement of either the center of mass or the displacement of the leg, respectively. 26 Both of these measures are linear. In contrast, joint or torsional stiffness provides insight into the demands placed on the muscles and soft tissues that cross a joint and is calculated by dividing the joint moment by the change in joint angle.27,28 Since this is an angular measure,27,29 it cannot be compared to the stiffness values reported in this study.
Leg stiffness (kleg) has been studied extensively in vivo under running and hopping conditions. Investigators have explored how kleg changes in response to varying step frequencies in running,26,29 as well as the response of kleg to different surface stiffness.30,31 In these studies and others,32,33 kleg has been reported over a range of approximately 6–55 N/mm. These in vivo reports offer points of comparison for this study. In most conditions, the in vitro stiffness values measured in this study are substantially greater than the in vivo values calculated by other investigators. This is particularly evident at the heel. At the load experienced while running, heel stiffness of all prosthetic feet tested was at least double the reported in vivo values. Forefoot stiffness under the running load was elevated when compared to in vivo values as well. When analyzed under loads typically experienced during walking, the heels of prosthetic feet D and F exhibited stiffness values comparable to the in vivo running and hopping values. But, given the differences in the assumed conditions, this is a weak comparison. From the observed differences between native stiffness and prosthetic stiffness in this study, it is reasonable to question if some prosthetic feet are too stiff. Nonetheless, there is a trade-off between stiffness and patient-reported stability that needs to be considered during the prescription process. Further investigation into the clinical outcomes of the stiffness of prosthetic feet under walking and running conditions is warranted to determine the appropriate comparison between in vitro and in vivo stiffness values.
Literature reporting in vitro stiffness values associated with different prosthetic feet is limited and their methods vary significantly, along with the specific prosthetic feet tested. ISO Standard 10328 was utilized by Mason et al. 16 to conduct load–displacement testing on three different DER prosthetic feet. Stiffness was calculated as a linear regression over data from the entire loading cycle. While this calculation varied from that used in this study, the stiffness values for DER feet tested were of the same magnitude. Geil 18 tested prosthetic feet in compression and reported their stiffness and hysteresis. The maximum load applied (800 N) to the feet was significantly less than that applied in this study (2240 N). However, when a linear regression was conducted about 800 N for data from this study, the resulting instantaneous stiffness values were of the same order of magnitude as graphically presented by Geil. 18 ISO standard 10328 was used by Jensen and Treichl 17 to evaluate prosthetic feet from developing countries. The deformation characteristics of these feet were reported; however, the stiffness and hysteresis values were not, so a direct comparison cannot be made with this study.
This study has some limitations. The repeatability and reproducibility of utilizing a mechanical testing standard such as ISO 10328 allows for the comparison of different products. However, the standard was designed to simulate the loads and loading rates experienced in the ideal gait cycle. Most conditions experienced in the free living environment deviate from this central assumption. Terrain is idealized to level ground and loading is simplified to uniaxial. Both of these assumptions are likely to be invalidated in everyday life of high activity individuals with amputations, where uneven terrain and torsional loading is probable. In this study’s implementation, only static proof testing was conducted. This does not provide information such as the failure load or longevity and durability which the other protocols outlined in ISO 10328 could provide. Furthermore, the prosthetic feet in this study were tested with manufacturer-provided foot covering and without the use of socks or shoes. The type of shoe has a significant impact on the load–displacement relationship and energy dissipation of the entire foot/shoe system. 19 Use of shoes would likely decrease the stiffness and increase the hysteresis observed.
Mechanical testing alone cannot fully characterize the performance and energy characteristics of a prosthetic foot for a given individual. Instead, it is a standardized and repeatable testing method that complements existing functional gait studies to describe a particular prosthetic foot. To fully characterize the commercially available prosthetic feet tested in this study, it is suggested that testing in patients with limb loss be conducted. These independent characterizations of prosthetic feet, coupled with input from the patient, will allow for the optimization of the prescription process.
Conclusion
The stiffness of the glass composite DER prosthetic foot was greater than that of the carbon fiber feet, contrary to what was hypothesized initially. However, the absolute hysteresis in the heel region of the glass composite foot supported the hypothesis and was the least compared to the carbon fiber feet. Mechanical properties of prosthetic feet are not influenced by intersubject variability, thus provide a description of the intrinsic behavior of the prosthesis. These data, along with functional gait studies, can give prosthetists a more complete description of specific DER feet, aiding in the prescription of these prosthetic feet.
Footnotes
Acknowledgements
The authors thank the prosthetic foot manufacturers who provided products for testing.
Author contribution
All authors contributed equally in the preparation of this manuscript.
Declaration of conflicting interests
The author(s) declared no potential conflicts of interest with respect to the research, authorship, and/or publication of this article.
Funding
The author(s) disclosed receipt of the following financial support for the research, authorship, and/or publication of this article: Fellowship funding (C.M.W.) was provided by the Mayo Graduate School.