
Abstract
Background:
Most amputees live with their prostheses for a long time. Therefore, quality of life is an important outcome for lower limb amputees.
Objective:
To translate the Prosthesis Evaluation Questionnaire (PEQ) and evaluate psychometric properties.
Study Design:
Methodological research.
Methods:
Lower limb amputees responded to electronic versions of the PEQ and SF-36v2 at baseline (n=64), after two weeks (n=51), and after 12 weeks (n=50). Reliability was assessed using Cronbach’s alpha and intraclass correlation coefficient (ICC) analyses of the baseline and two weeks test-retest data. Estimates for standard error of measurement (SEM) were calculated based on reliability estimates. Construct validity was evaluated by testing using hypotheses testing.
Results:
Reliability estimates (ICC/Cronbach’s alpha) for the nine subscales were: Social Burden (0.85/0.76), Appearance (0.85/0.72), Residual Limb Health (0.80/0.69), Well-Being (0.78/0.90), Utility (0.76/0.89), Frustration (0.74/0.90), Perceived Response (0.62/0.80), Ambulation (0.61/0.94), Sounds (0.51/0.65). Construct validity was supported in three out of four subscales evaluated.
Conclusions:
The subscales Social Burden, Appearance, Well-Being, Utility and Frustration had consistent high reliability, supporting their use in assessing the prosthesis related quality of life in lower limb amputees. Results were mixed on three other scales (Residual Limb Health, Perceived Response, and Ambulation), while one scale, Sounds, had consistent low reliability.
Clinical relevance
For the first time a patient reported disease specific quality of life measure for lower limb amputees is available in Danish. Health care providers can now identify patients with reduced quality of life and measure treatment and rehabilitation effects over time.
Background
A total of 240 major lower limb amputations were conducted in Denmark in 2014. 1 While the in-hospital mortality rate for major lower limb amputation is relatively high (16.8%), 2 most amputees live with prostheses for a long time. 3 Therefore, quality of life is an important outcome for lower limb amputees.
Social support, social burden, satisfaction with the prosthesis, mobility, activity level, level of phantom pain, and limb pain are some of the factors found to have relevance for the amputee’s quality of life4–8 Prosthesis-related quality-of-life measures have been developed to assess these domains.9–12 Each of these questionnaires has their advantages and drawbacks, and none of the questionnaires seems to be superior in terms of the psychometric properties. 13 The Prosthesis Evaluation Questionnaire (PEQ) was developed for investigation of prosthesis-related quality of life in lower limb amputees and is widely used in the evaluation of prosthetic care. When a questionnaire is translated into another language, it is important to consider any cultural differences and cross-culturally adapt the questionnaire in order to maintain content validity and measurement equivalence with the original questionnaire. 14 Such measurement equivalence is important for cross-cultural comparisons and multi-center studies. PEQ has been cross-culturally translated and adapted into a numerous of languages, including Spanish, 15 Italian, 16 Turkish, 17 and Arabic 18 but has not been translated and validated in Danish.
The objectives of this study were to (1) translate and culturally adapt the PEQ into Danish, (2) evaluate test–retest reliability, (3) evaluate internal consistency reliability, and (4) evaluate construct validity by testing hypotheses regarding the associations between subscales in the PEQ and the Short Form-36 Health Survey (SF-36).
Methods
Subjects and data collection
Subjects were recruited during September 2015 to October 2015, from four amputee organizations’ online forums. Participants were eligible for inclusion if they had (1) unilateral lower limb amputation at transtibial-level or above, (2) had used their current prosthesis for at least 4 weeks, and (3) provided informed consent to participate.
At baseline, after 14 days, and after 12 weeks, participants received emails with links to an electronic survey containing demographic questions, the PEQ, the SF-36, and global rating scales related to each subscale. In case of non-response, remainder emails were sent after days 2 and 7.
Ethics
The study complied with ethical principles for medical research as described in the Helsinki Declaration and with the practices of the Danish National Committee on Health Research Ethics. 19 Participation in this study was voluntary, anonymous, and confidential. The Danish Data Protection Agency approved the handling of data (RH#35-3561).
PEQ
The original version of the PEQ consists of 82 items of which 41 items form nine subscales concerning Prosthesis Utility (UT), Residual Limb Health (RL), Appearance (AP), Sounds (SO), Ambulation (AM), Perceived Response (PR), Frustration (FR), Social Burden (SB), and Well-Being (WB). The remaining 41 items are analyzed as single items. 10 All items that form subscales use a recall frame over the past 4 weeks. These items are scored on a 100-mm visual analog scale with descriptors at the extremes (e.g. never and all the time). The scales are calculated as averages of the items on a metric from 0 to 100 with higher scores indicating better health. In previous studies, the nine subscales have shown good internal consistency reliability (Cronbach’s alpha = 0.73–0.89), but variations in test–retest reliability (Intraclass Correlation Coefficient (ICC) = 0.56–0.90). PEQ has shown moderate concurrent validity when compared to the SF-36, the Sickness Impact Profile (SIP), and the Profile of Mood States—Short Form (POMS-SF). 10
Cross-cultural translation and adaptation
The PEQ was translated according to a six-step guideline for cross-cultural translation and adaptation: 14
Step 1: Translation into Danish. Two Danish native–speaking physiotherapists independently translated the questionnaire into Danish. The first translator worked with amputees on a daily basis and the second translator never worked with amputee rehabilitation. The two translators translated the questionnaire and made additional comments, highlighted challenging phrases, and marked uncertainties.
Step 2: Synthesis of the Danish translation. The two translators and the project manager (J.C.) discussed discrepancies between the two translations. Consensus of the translated version was reached, and a written report of the synthesis process was produced.
Step 3: Back-translation. Independently, and blinded for the original American version, two translators back-translated the Danish version into English. The translators were native English–speaking persons without expertise regarding rehabilitation of amputees.
Step 4: Expert committee review. The expert committee reached consensus on a pre-final version based on all the translations and reports. The expert committee consisted of translators, expert within amputee rehabilitation, languages’ professional, a psychometric methodologist, and the project manager.
Step 5: Pretesting. The pre-final version was tested on 21 patients through cognitive interviews. 20 The informants were asked to answer the pre-final version and at the same time to think-out-loud while answering. Subsequently, the informants were asked how the questions were interpreted and to specific words of interest pointed out by the expert committee.
Based on the results from these interviews, the questionnaire was revised during this process with focus on semantic, idiomatic, experimental, and conceptual equivalence. Idiomatic questions were identified leading to revisions of questions (e.g. patients did not know how to rate “blisters and sores” if they had problems with one and not the other. Therefore, the item was revised to only ask about “blisters”). The last three cognitive interviews did not result in any revising of the questionnaire.
Step 6. Submission of reports to the developers. All written reports and translations were sent to the original developers of PEQ. The developers approved the translation, and no adaptions were made in this process.
Other questionnaires
The SF-36v2 comprises 36 items scored as eight subscales measuring physical function, role limitations due to physical health, bodily pain, general health perception, vitality, social function, role limitations due to emotional problems, and mental health. Each scale is normed so that the US general population has a mean of 50 and a standard deviation of 10. Higher scores indicate better health. 21
Statistical analysis
Interpretability
Floor and ceiling effects were assessed using baseline data by calculating the percentage of informants that scored 0 (floor effect) or 100 (ceiling effect) on the PEQ subscales at the first assessment. A proportion of more than 15% scoring at the floor or at the ceiling was regarded as a noticeable effect. 22
Reliability
Cronbach’s alpha was used to evaluate the internal consistency reliability of the nine PEQ subscales using data from the baseline assessment. Cronbach’s alpha coefficients of 0.7 or higher were interpreted as acceptable. 23
Test–retest reliability of all subscales in PEQ was examined using the baseline and 14-day scores. A two-way analysis with random effects was used for calculating the ICC 24 and a 95% confidence interval (CI). The recommended 0.70 was used as the minimum standard for reliability. 25
To assess the absolute agreement for individual subjects, the standard error
of measurement (SEM) was used.26,27 SEM was calculated
using the formula
The mean score difference between baseline and 2 weeks follow-up was used to evaluate systematic measurement error over time. The magnitude of score differences was evaluated through the effect size (difference/baseline standard deviation) according to the criteria proposed by Cohen: 29 effect size < 0.2 = ignorable, 0.2–0.5 = small, 0.5–0.8 = moderate, and >0.8 = strong.
Only subjects who reported to be having no change in their conditions related to each of the subscales were included in the ICC analysis, calculations of SEM, and analyses of mean differences.
Construct validity
Construct validity was assessed in baseline data by evaluating a priori defined hypotheses regarding correlation between subscales in PEQ and SF-36. Moderate-to-high (0.40–0.75) correlation coefficients were expected between PEQ WB and SF-36 Mental Health, PEQ WB and SF-36 General Health, PEQ RL and SF-36 Bodily Pain, and PEQ SB and SF-36 Social Functioning. Pearson’s correlation coefficient was used to quantify the relationship between the subscales.
Results
In all, 74 participants volunteered to participate in the study and were mailed the final version of PEQ along with the rest of the questionnaire booklet. Four of the amputees did not fulfill the inclusion criteria and were excluded from the study, and six patients never returned the questionnaire booklet (see Figure 1). Table 1 shows the demographic distribution of the sixty-four included amputees.
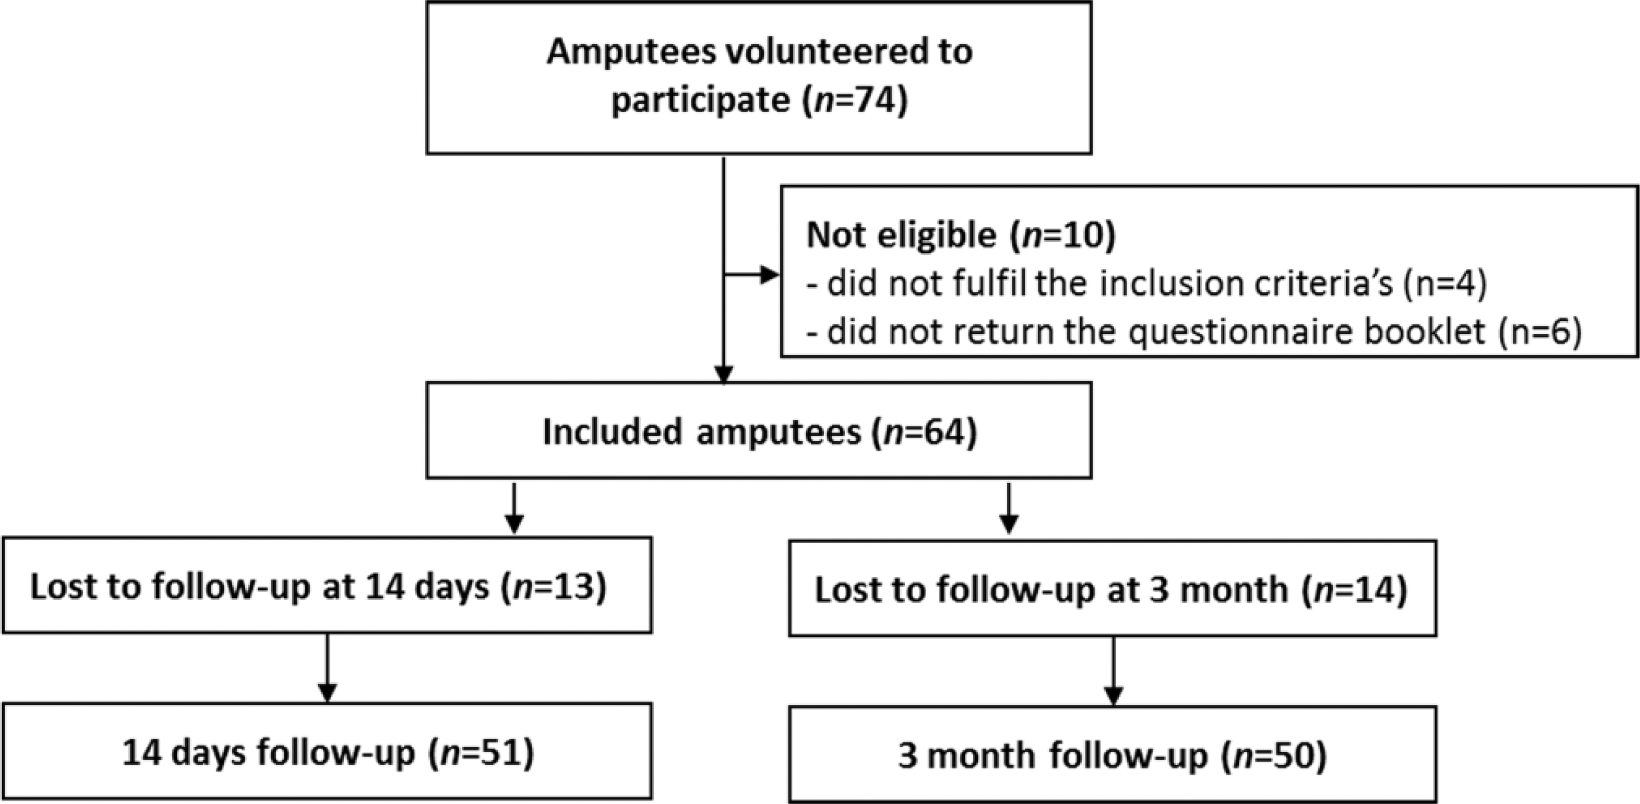
Flow diagram of the progress through the phases of enrollment, inclusion, follow-up, and data analysis.
Patient characteristics at baseline.
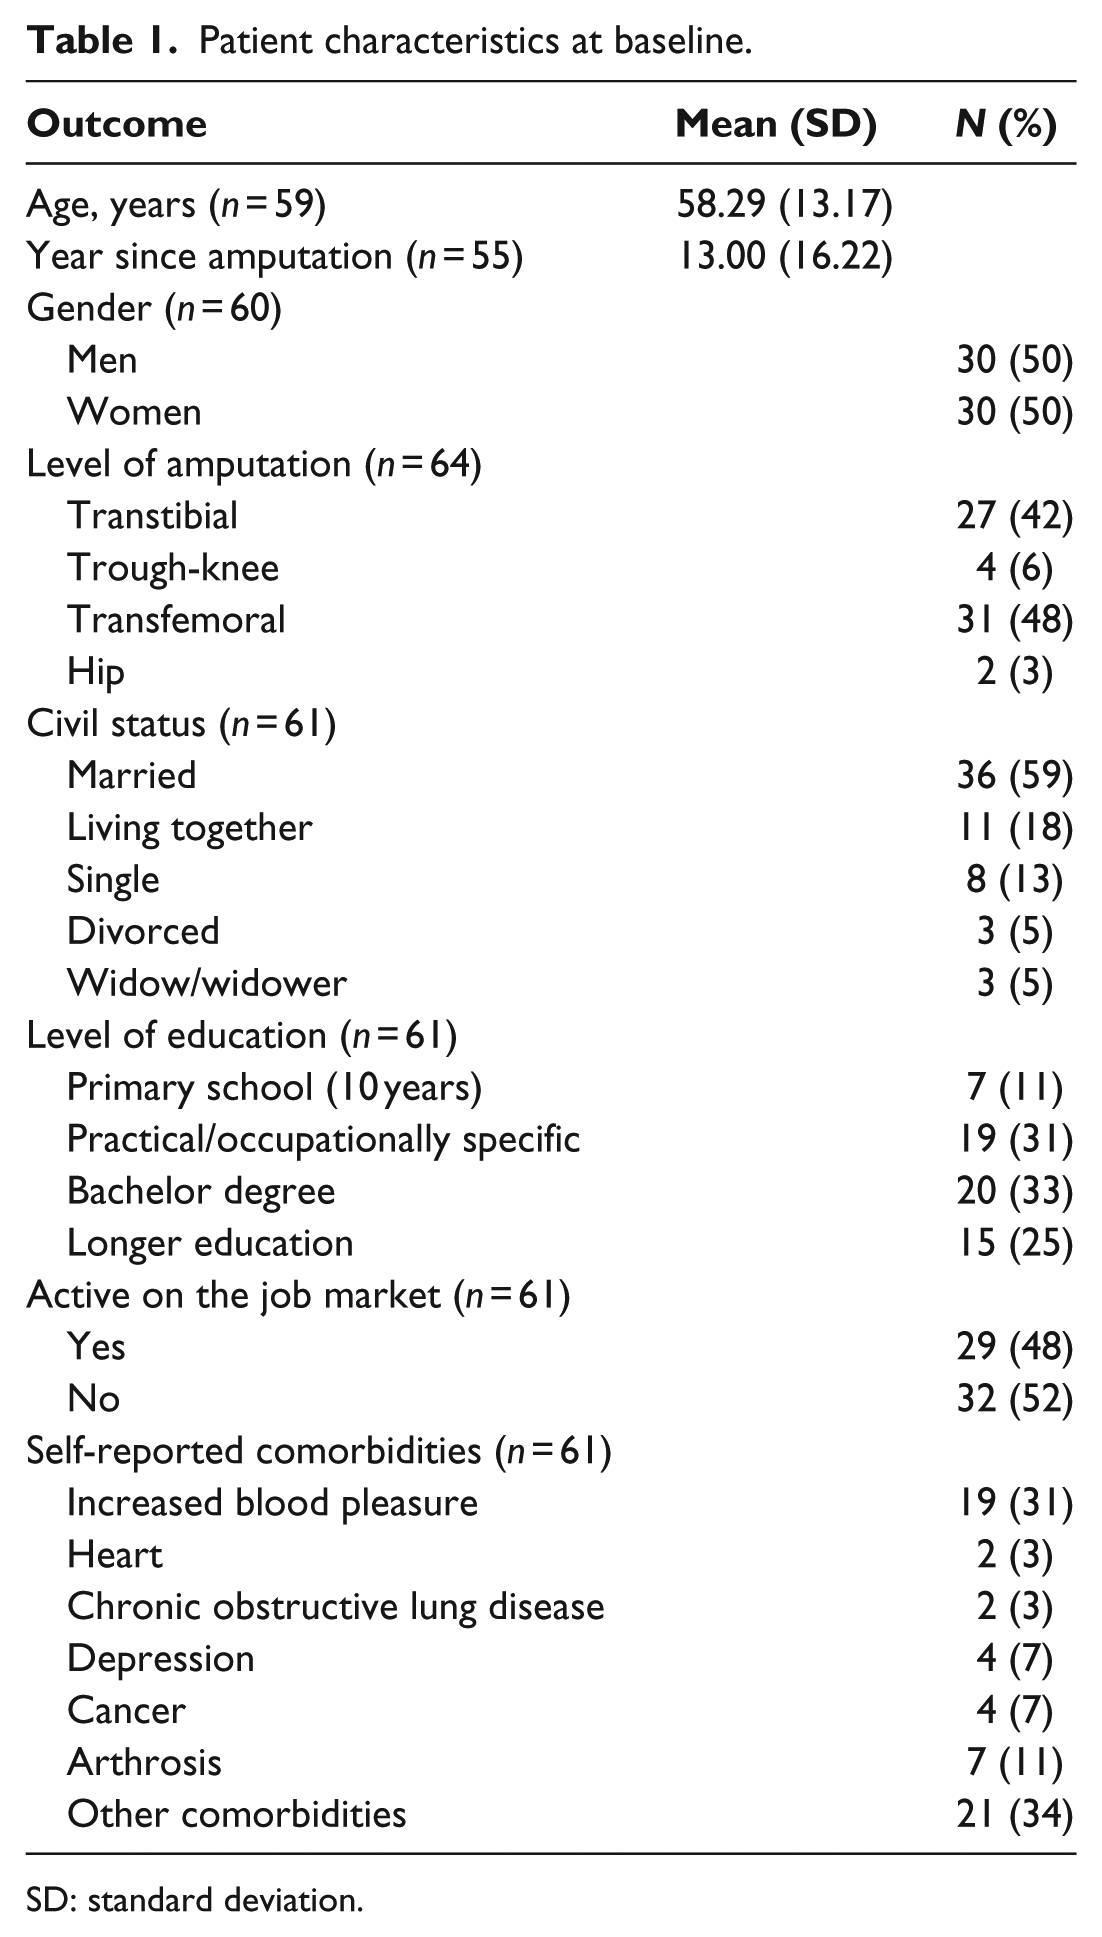
SD: standard deviation.
Interpretability and internal consistency
No floor effect was found in any of the PEQ subscales. Ceiling effects were found in the subscales SB, WB, and PR. Acceptable internal consistency reliability was found for all subscales except for the RL and SO subscales (Table 2).
Baseline mean and standard deviation (SD), floor and ceiling effects, and internal consistency of Prosthesis Evaluation Questionnaire scales.
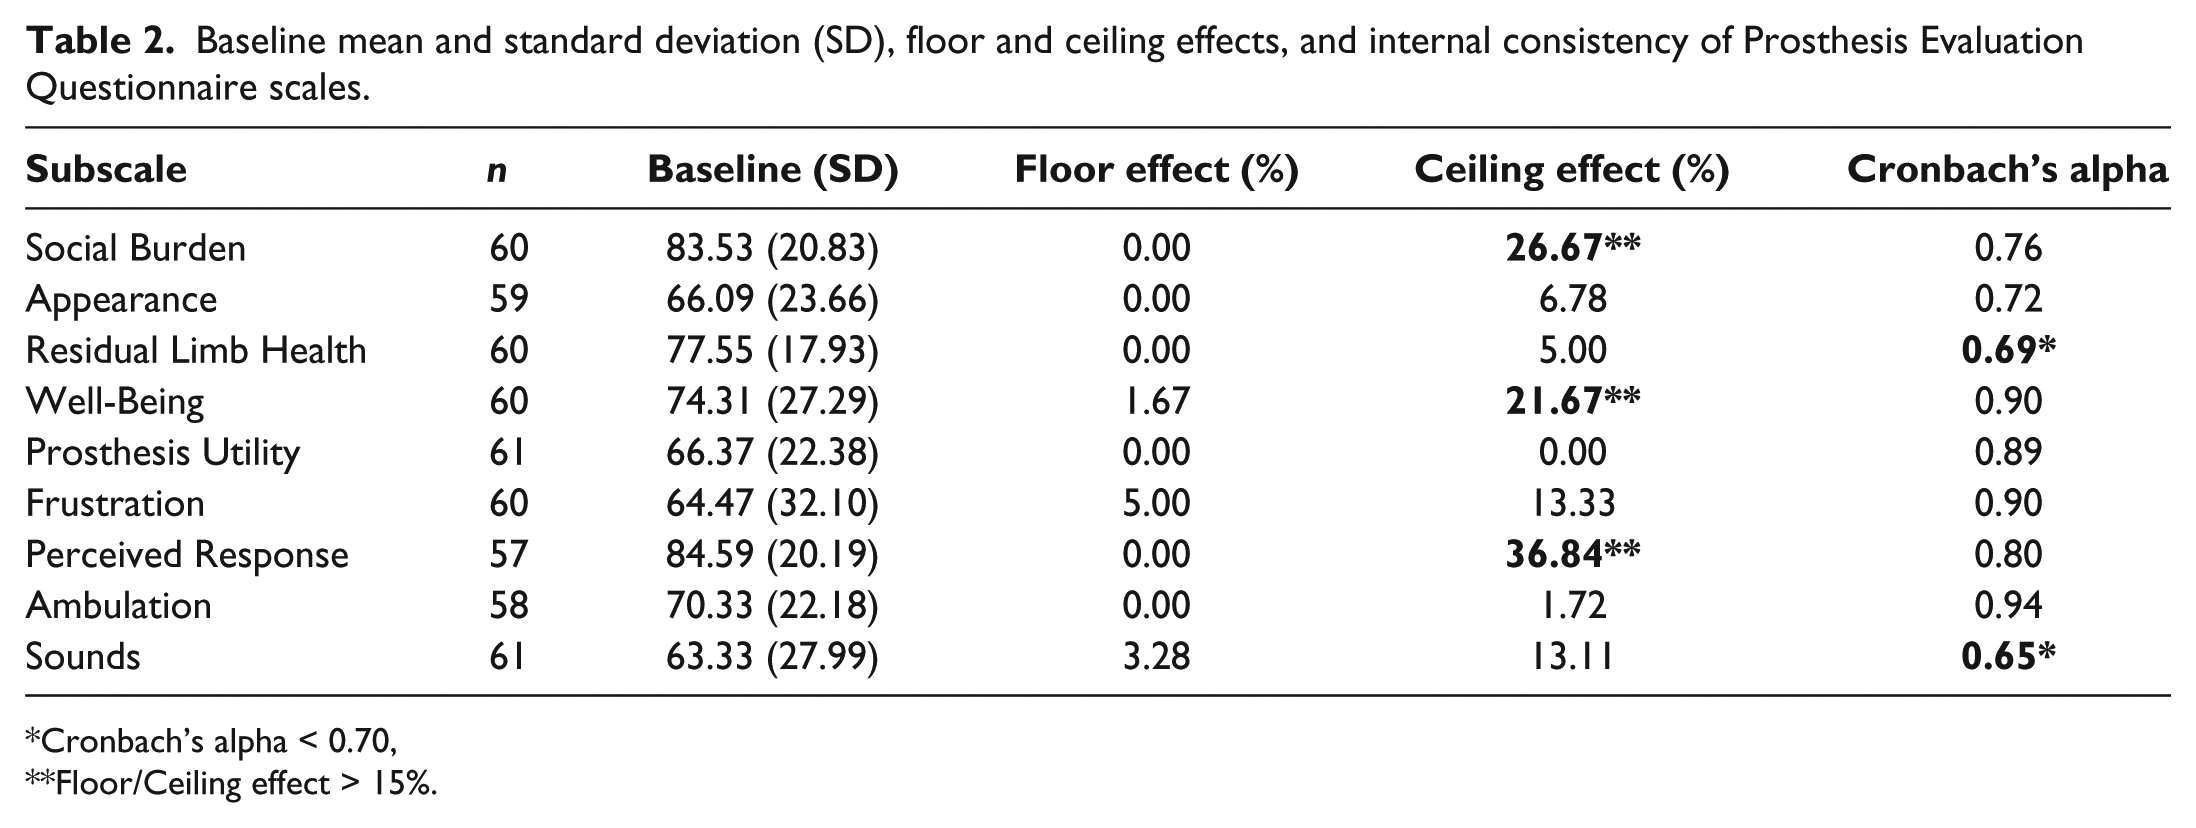
Cronbach’s alpha < 0.70, **Floor/Ceiling effect > 15%.
Test–retest reliability
Six subscales showed acceptable test–retest values (SB, AP, RL, WB, PU, and FR) and three were found to be below the acceptable level (PR, AM, and SO). For the scales with acceptable reliability, the standard error of measurement ranged between 7.49 and 16.48 points. The mean score differences showed no indications of major score change over time. The largest mean change was 5.42 (for SO) equivalence to an effect size of 0.19 (Table 3).
Test–retest reliability, standard error of measurement, minimal detectable change, and mean score difference over time of Prosthesis Evaluation Questionnaire scales.
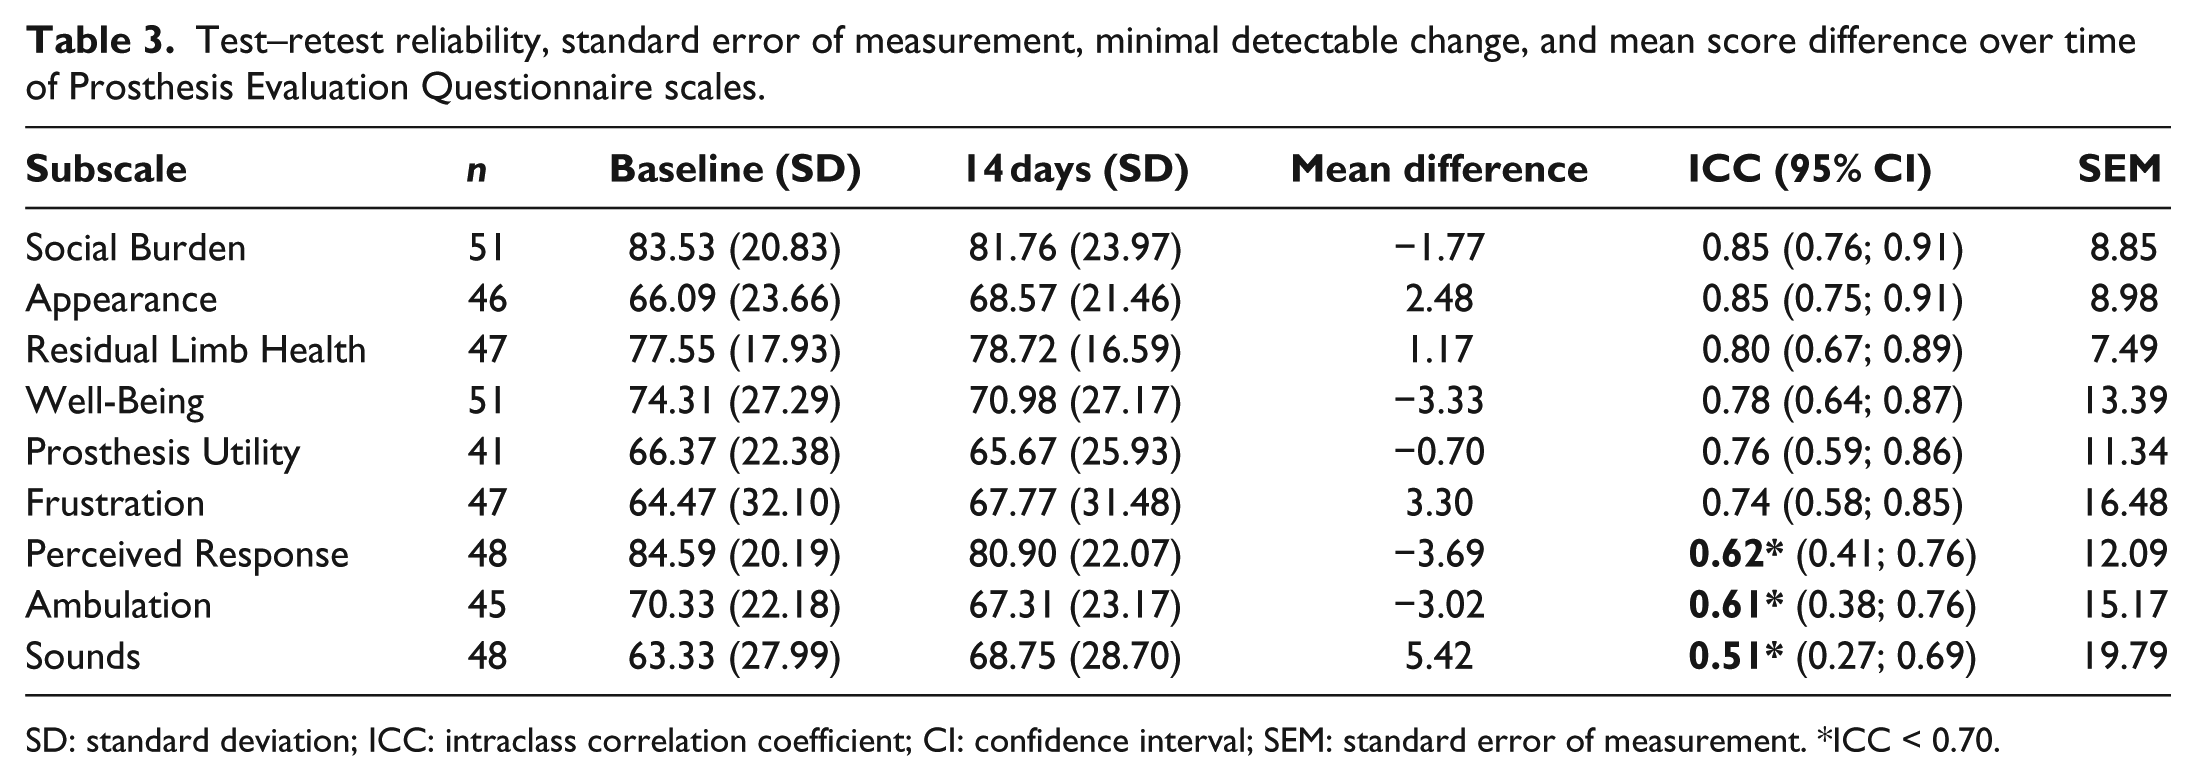
SD: standard deviation; ICC: intraclass correlation coefficient; CI: confidence interval; SEM: standard error of measurement. *ICC < 0.70.
Construct validity
The a priori expected moderate-to-high correlation coefficients were found between the PEQ SB and the SF-36 Social Functioning subscales and between the PEQ WB and two SF-36 subscales: General Health and Mental Health (Table 4). The subscale RL did not correlate with the expected degree with the SF-36 Bodily Pain.
Hypothesis testing of subscales in PEQ.
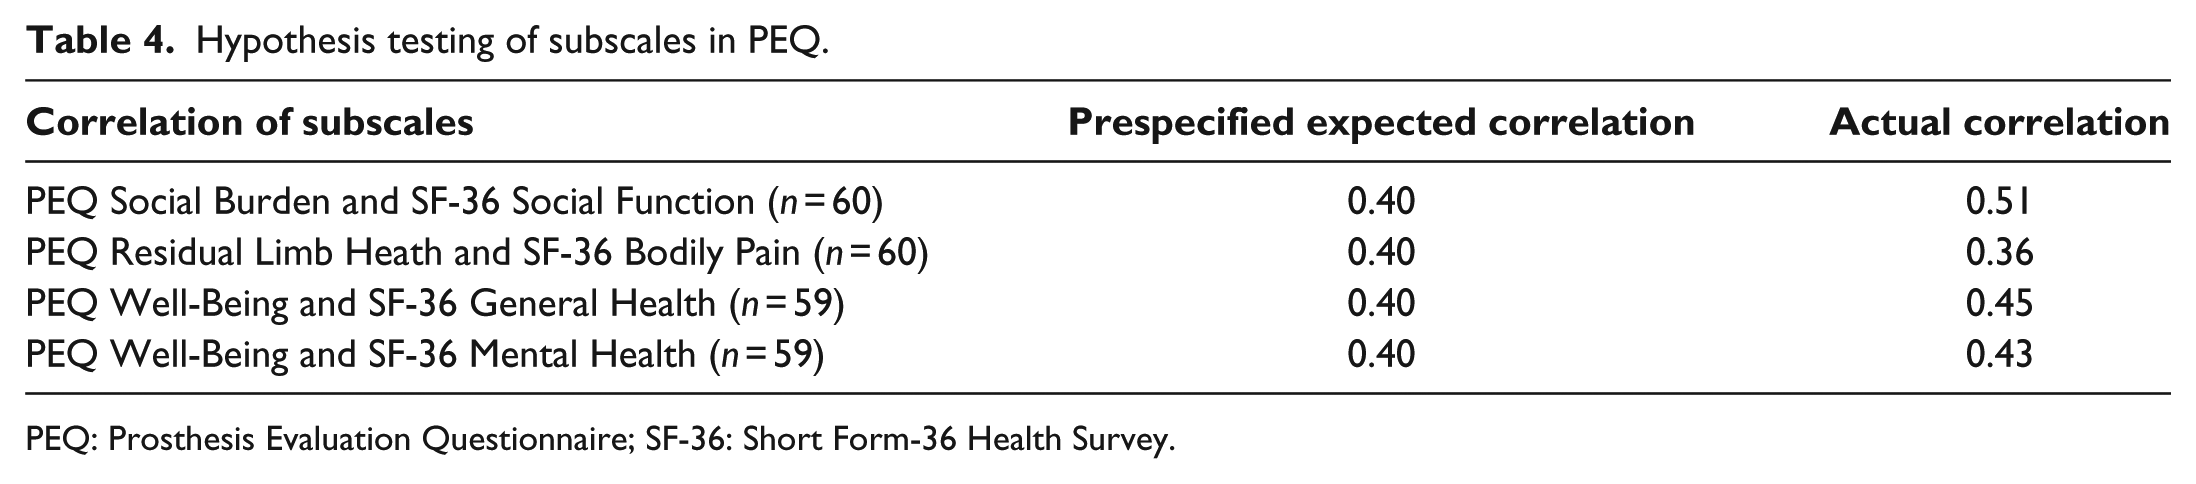
PEQ: Prosthesis Evaluation Questionnaire; SF-36: Short Form-36 Health Survey.
Discussion
In a Danish sample of lower limb amputees, five PEQ subscales showed acceptable reliability according to both internal consistency and test–retest methods: SB, AP, WB, UT, and FR. Internal consistency reliability was found acceptable for seven of nine subscales: SB, AP, WB, UT, FR, PR and AM. Acceptable ICC coefficients were found for six of nine subscales: SB, AP, RL, WB, UT, and FR. No systematical discrepancy between baseline and 14 days was found for any subscale. Tests of prespecified hypotheses showed the expected moderate-to-high correlations between the PEQ and subscales in SF-36 with the exception of the PEQ subscale of RL and SF-36 Bodily Pain. This result suggests that the underlying construct in the RL subscale may not be fully related to pain.
Test–retest reliability of the PEQ has been investigated in other samples, and our results are in line with findings in a Turkish sample. 17 However, the subscale of SB was not found acceptable in a US sample ICC = 0.64. 30 In terms of internal consistency, the subscale of WB was not found acceptable in the Turkish sample (Cronbach’s alpha = 0.64) nor in a Spanish sample (Cronbach’s alpha = 0.58). 15 Furthermore, the subscales AP and SB were not found acceptable in the Spanish sample with Cronbach’s alphas of 0.37 and 0.59, respectively. Differences in the translation process and test–retest period and differences in the sample investigated (e.g. age, level of amputation, and comorbidities) could have caused these differences.
Our research has revealed some psychometric challenges in four of the nine subscales in PEQ, although consistent poor performance was only shown by the SO subscale.
Methods
PEQ was originally developed for pen-and-paper data collection. However, the Danish version of PEQ was administered electronically. It is unknown how this transformation affects the amputees’ scoring of PEQ, but in general patient-reported outcomes show high correlations between data from electronic platforms and data obtained from paper administration. 31
The sample characteristic in this study varies from those in the original US sample. 10 The percentage of men and transtibial amputations was higher in the original US sample compared to the Danish sample. On the other hand, the samples showed comparable age, work employment, civil status, and comorbidity rates.
During the translation process of PEQ, a couple of idiomatic questions were identified. The wording of the idiomatic question was edited based on patient’s specific answers in the pretesting (e.g. “blisters and sores” was translated into “blisters”). This has potentially resulted in a higher reliability of the questions for the specific questions.
Limitations
The sample size in this study is limited leading to wide CIs for the reported estimates of reliability and correlations with other instruments. The study did not evaluate structural validity, that is, whether the questionnaire scales adequately reflect the dimensionality of the construct to be measured. 32 Structural validity could have been investigated in a factor analysis, but this type of analysis requires a substantially larger sample than the one investigated in this study. As the structural validity was not investigated, the assumption of unidimensionality of the nine subscales has not been investigated, but this was assumed in the calculation of Cronbach’s alpha.
The sample investigated in this study consisted of amputees that varied in time since amputation. The ceiling effect observed in the subscales of SB, WB, and PR could indicate that the sample to some degree is rehabilitated in relation to these constructs.
The minimal detectable change that is an estimate of the smallest amount of change that can be detected by a measure that corresponds to a noticeable change in the current domain could have been calculated from the SEM. However, we decided not to calculate the minimal detectable change as this would be misleading due to the limited sample size. Another important descriptor is the minimal clinical important change (MCIC): the smallest amount of change that is clinically relevant. In order to calculate the MCIC, patients need to report a change in symptoms regarding the specific subscale. Unfortunately, only a minor percentage of the sample reported a change at the 12 weeks follow-up. Calculation of the MCIC would therefore be misleading.
Further research
Additional psychometric testing of PEQ is necessary to see whether the structure of the questionnaire is the same in the Danish version as in the English. Furthermore, proper estimates for minimal clinical important difference have to be established.
Conclusion
In conclusion, the findings of this study indicate that the PEQ subscales SB, AP, WB, UT, and FR are reliable and can be used in assessing the prosthesis-related quality of life in lower limb amputees. However, our findings also indicate conflicting results concerning the subscales RL, AM, and PR. The reliability and validity of these scales should be evaluated in larger samples. The SO subscale showed poor test–retest and internal consistency reliability.
This is the first prosthesis-related quality-of-life questionnaire that is available in Danish for testing of patients with lower limb amputation. Health providers in clinical practice can now identify patients with reduced quality of life and measure treatment and rehabilitation effects over time through a patient-reported outcome measure. However, the healthcare providers should be aware of the psychometric challenges related to the subscales RL, AM, PR, and SO.
Footnotes
Author contribution
The authors acknowledge Sidsel Bertelsen, Malene Skade, and Kajsa Lindberg for their contributions in the cognitive interview process. All authors contributed equally in the preparation of this article.
Declaration of conflicting interests
The author(s) declared no potential conflicts of interest with respect to the research, authorship, and/or publication of this article.
Funding
The author(s) disclosed receipt of the following financial support for the research, authorship, and/or publication of this article: This study is part of a PhD funded by a strategic grant from the Danish Defense Agreement 2013–2017 and by the Association of Danish Physiotherapists.