
Abstract
Background and aim:
The need of comfortable and safe prosthetic systems is an important challenge for both prosthetists and engineers. The aim of this technical note is to demonstrate the use of three-dimensional digital image correlation to evaluate mechanical response of two prosthetic systems under real patient dynamic loads.
Technique:
This note describes the use of three-dimensional digital image correlation method to obtain full-field strain and displacement measurements on the surface of two lower limb prostheses for Chopart amputation. It outlines key points of the measurement protocol and illustrates the analysis of critical regions using data obtained on specific points of interest.
Discussion:
The results show that the use of three-dimensional digital image correlation can be a tool for the prosthetist to optimize the prosthesis considering features related to the material and design, in order to bear with real patient-specific load conditions.
Clinical relevance
Three-dimensional digital image correlation can support decision-making on new designs and materials for prosthetics based on quantitative data. Better understanding of mechanical response could also assist prescription for appropriate prosthetic systems.
Background and aim
In recent years, the therapeutic success of partial foot amputation has improved, thanks to new surgical techniques and antibiotics. 1 This type of amputation is chosen to preserve the functioning of the remaining limb as it allows direct weight loading on the residual foot. 2 However, there is a predisposition for re-amputation. 3
The challenge for clinicians and engineers is to develop prostheses that give the user mobility, confidence, 4 and to distribute loads applied to the residual limb during gait. Materials of choice have been leather, polyurethane foams, silicone, and polypropylene, in addition to composites as reinforcement.2,5
Although there have been several attempts to achieve proper fitting and mechanical resistance for lower limb prostheses,6,7 the biomechanics of this prosthetic system (PS) are still not completely understood.8,9 New designs are to be tested under dynamic loads to improve function and durability; however, most of these materials are not suitable for surface instrumentation due to their high elastic deformation ranges. 10 In order to increase the understanding of the interaction between amputee and PS during gait, our work uses three-dimensional digital image correlation (3D DIC) to evaluate the mechanical response of a PS under real dynamic loads.
Case description
Two PS M1 and M2 were manufactured for a subject with Chopart amputation, recruited from the hospital Amputees Rehabilitation Service. The subject was a 24-year-old female, weighing 79 kg and able to walk without the use of mobility aids. Time since amputation was 3 years; the residual limb was mature and free of pressure points. The Research Committee of the Instituto Nacional de Rehabilitación Luis Guillermo Ibarra Ibarra, in Mexico City, approved the study and the participant signed an informed consent form.
The M1 and M2 PS consisted of a two-piece device, composed of a socket and an ankle–foot orthosis (AFO), which is made of polypropylene (Figure 1(a)). The M2 AFO piece was reinforced with a laminated composite based on carbon fiber, nylon/fiber glass, cotton cloth, and epoxy resin. These PS were fabricated for size 38 European shoes (7 1/2 USA, 25.4 cm).
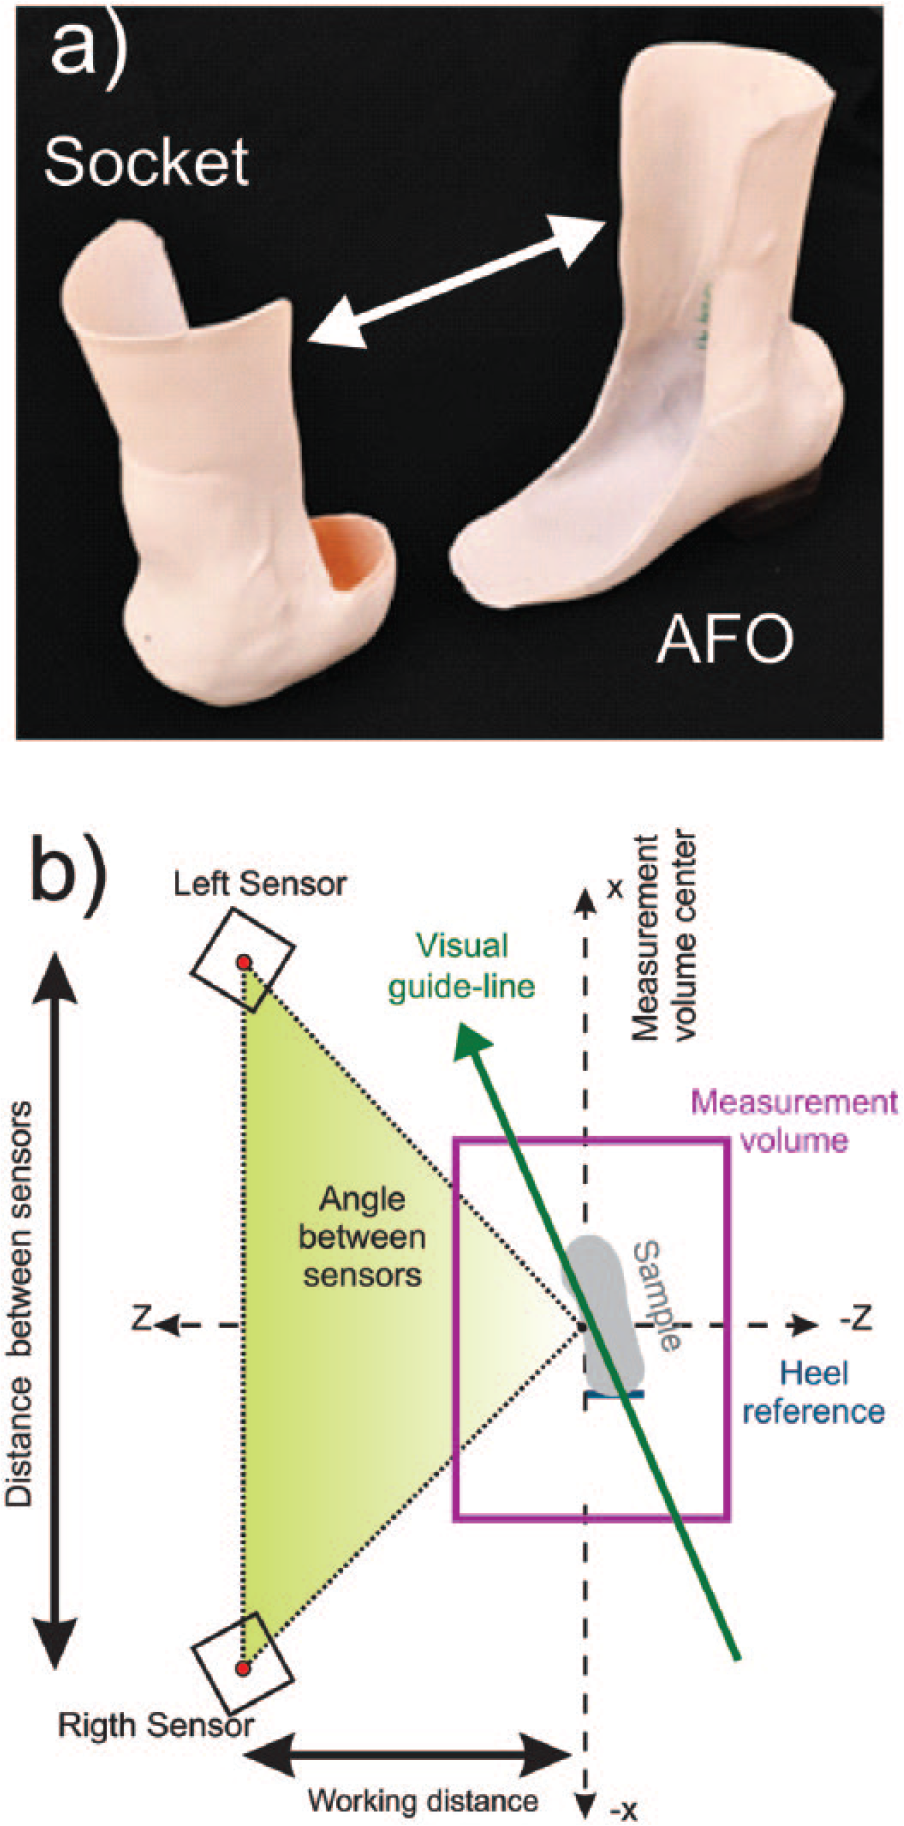
Experimental setup for displacement/strain measurements on a prosthetic system: (a) AFO prosthetic system and (b) relevant parameters to succeed in 3D displacement/strain measurements using digital correlation.
This particular design avoids high pressure points by closely fitting the natural near spherical shape of the residual limb. The AFO forefoot has the function of shoe filler and was fabricated with an external rotation of 7.5°, to promote stability and visual symmetry during standing and walking.
From each, the medial and the lateral wall of M1 and M2, a region of interest, that comprises the area from the malleoli to the metatarsal heads and to the floor, were chosen for detailed analysis. These regions were selected because AFO often exhibits failure along the surface. 6
Technique
Equipment for strain measurements
For this test, an Aramis 3D 5M LT system (GOM mbH, Germany) and its processing software version 6.3 was used. 3D DIC is a non-contact technique which is able to measure complete 3D surface displacement field on curved or planar specimens with accuracy on the order of ±0.01 pixels. The displacement field is estimated using a cross-correlation function between pairs of images. The images are segmented in small regions of interest that are known as facets. The software ARAMIS 11 matches each acquired images considering a maximum correlation index between facets; this is achieved by comparing a reference image (without strain) with subsequent images with different level of strain. From the displacement field, the deformation gradient tensor strain is calculated.
The system has two charge-coupled device (CCD) cameras as sensors with a resolution of 2448 × 2050 pixels; 8-bit gray scale; and two 17 mm lenses and two illumination sources. Distance between the sensors was 300 mm, angle between the sensors was 25°, and working distance from the sensor to the sample was 765 mm. The election of the 17 mm lenses and the configuration parameters allowed a measuring volume of 350 × 290 × 350 mm. The field of view considered a PS (24.5 cm in size) with enough clearance so that a patient’s step remains within the measuring area. Image acquisition rate was 15 Hz, pixel size of images was 0.16 mm, and permissible error was <0.04 pixels according to the applied calibration procedure.
The working environment is an important factor in strain measurements using 3D DIC. 12 To minimize effects of illumination changes, the experiments were carried out in a room with controlled light conditions avoiding sunlight variation and shadows.
Procedures
Sample preparation and protocol of dynamic test
A vertical focal plane for displacement/strain measurement was selected at the prosthetics surface within the region of interest. To align this plane with the measurement volume center, a visual guideline was marked on the floor and used as a reference to help on reducing the location of the residual limb out of plane during the test (Figure 1(b)). This visual guideline indicated the direction of the walking and had a reference for the heel, it was drawn on the walking surface (wood platform: 5 m long, 1.5 m wide, and 15 cm high), and the subject was instructed to step on it during the test.
For each M1 and M2, the lateral and medial faces were prepared with a white paint background and a speckle pattern sprayed on the surfaces using black acrylic paint. 13 The preparation was verified in a static test with the acquisition of five images of each sample without load. Error of <0.0035 mm was calculated for the static images for M1 and M2 on both faces in the region of interest.
Before measurements were taken, several practice trials were completed to allow the participant to familiarize herself with the prosthesis and the visual guideline. The participant was then asked to walk along the walking surface stepping on the floor guideline at a comfortable pace. In all, 60 pairs of images, one for each sensor, involving a complete gait cycle were acquired.
Data were taken for each M1 and M2, for the medial and lateral region. From the complete gait cycle set of images, those corresponding to the stance phase of gait were segmented for analysis.
From each pair of images, or stage, the system computes the 3D coordinates of the speckle pattern points on the prostheses surface by triangulation. As shown in Figure 1(b), x- and y-axes describe the vertical focal plane of measurement; meanwhile, the z-axis describes the displacement in the lateral–medial direction.
The strain and displacement analysis were done by considering the initial and final configuration of the speckle patterns; for our test, the stage corresponding to foot flat on the floor was used as reference, and compared with each following stage; in particular, midstance and terminal stance were chosen for comparison between prostheses. Midstance was determined when the contralateral midfoot was directly underneath the residual limb and terminal stance was determined when the residual limb heel raised from the floor.
Results
For each stage, full-field strain and displacement measurements were calculated. Figure 2(a1) and (b1) shows full-field displacement of M1 and M2 in the medial face of the prostheses. To present displacement data, two points on the medial faces of each PS surfaces were used to describe rigid body motion in the lateral–medial direction (z-axis). In Figure 2(a2) and (b2), displacement data of the two points are shown from the foot flat (stage 0) to terminal stance phase (stage 18).
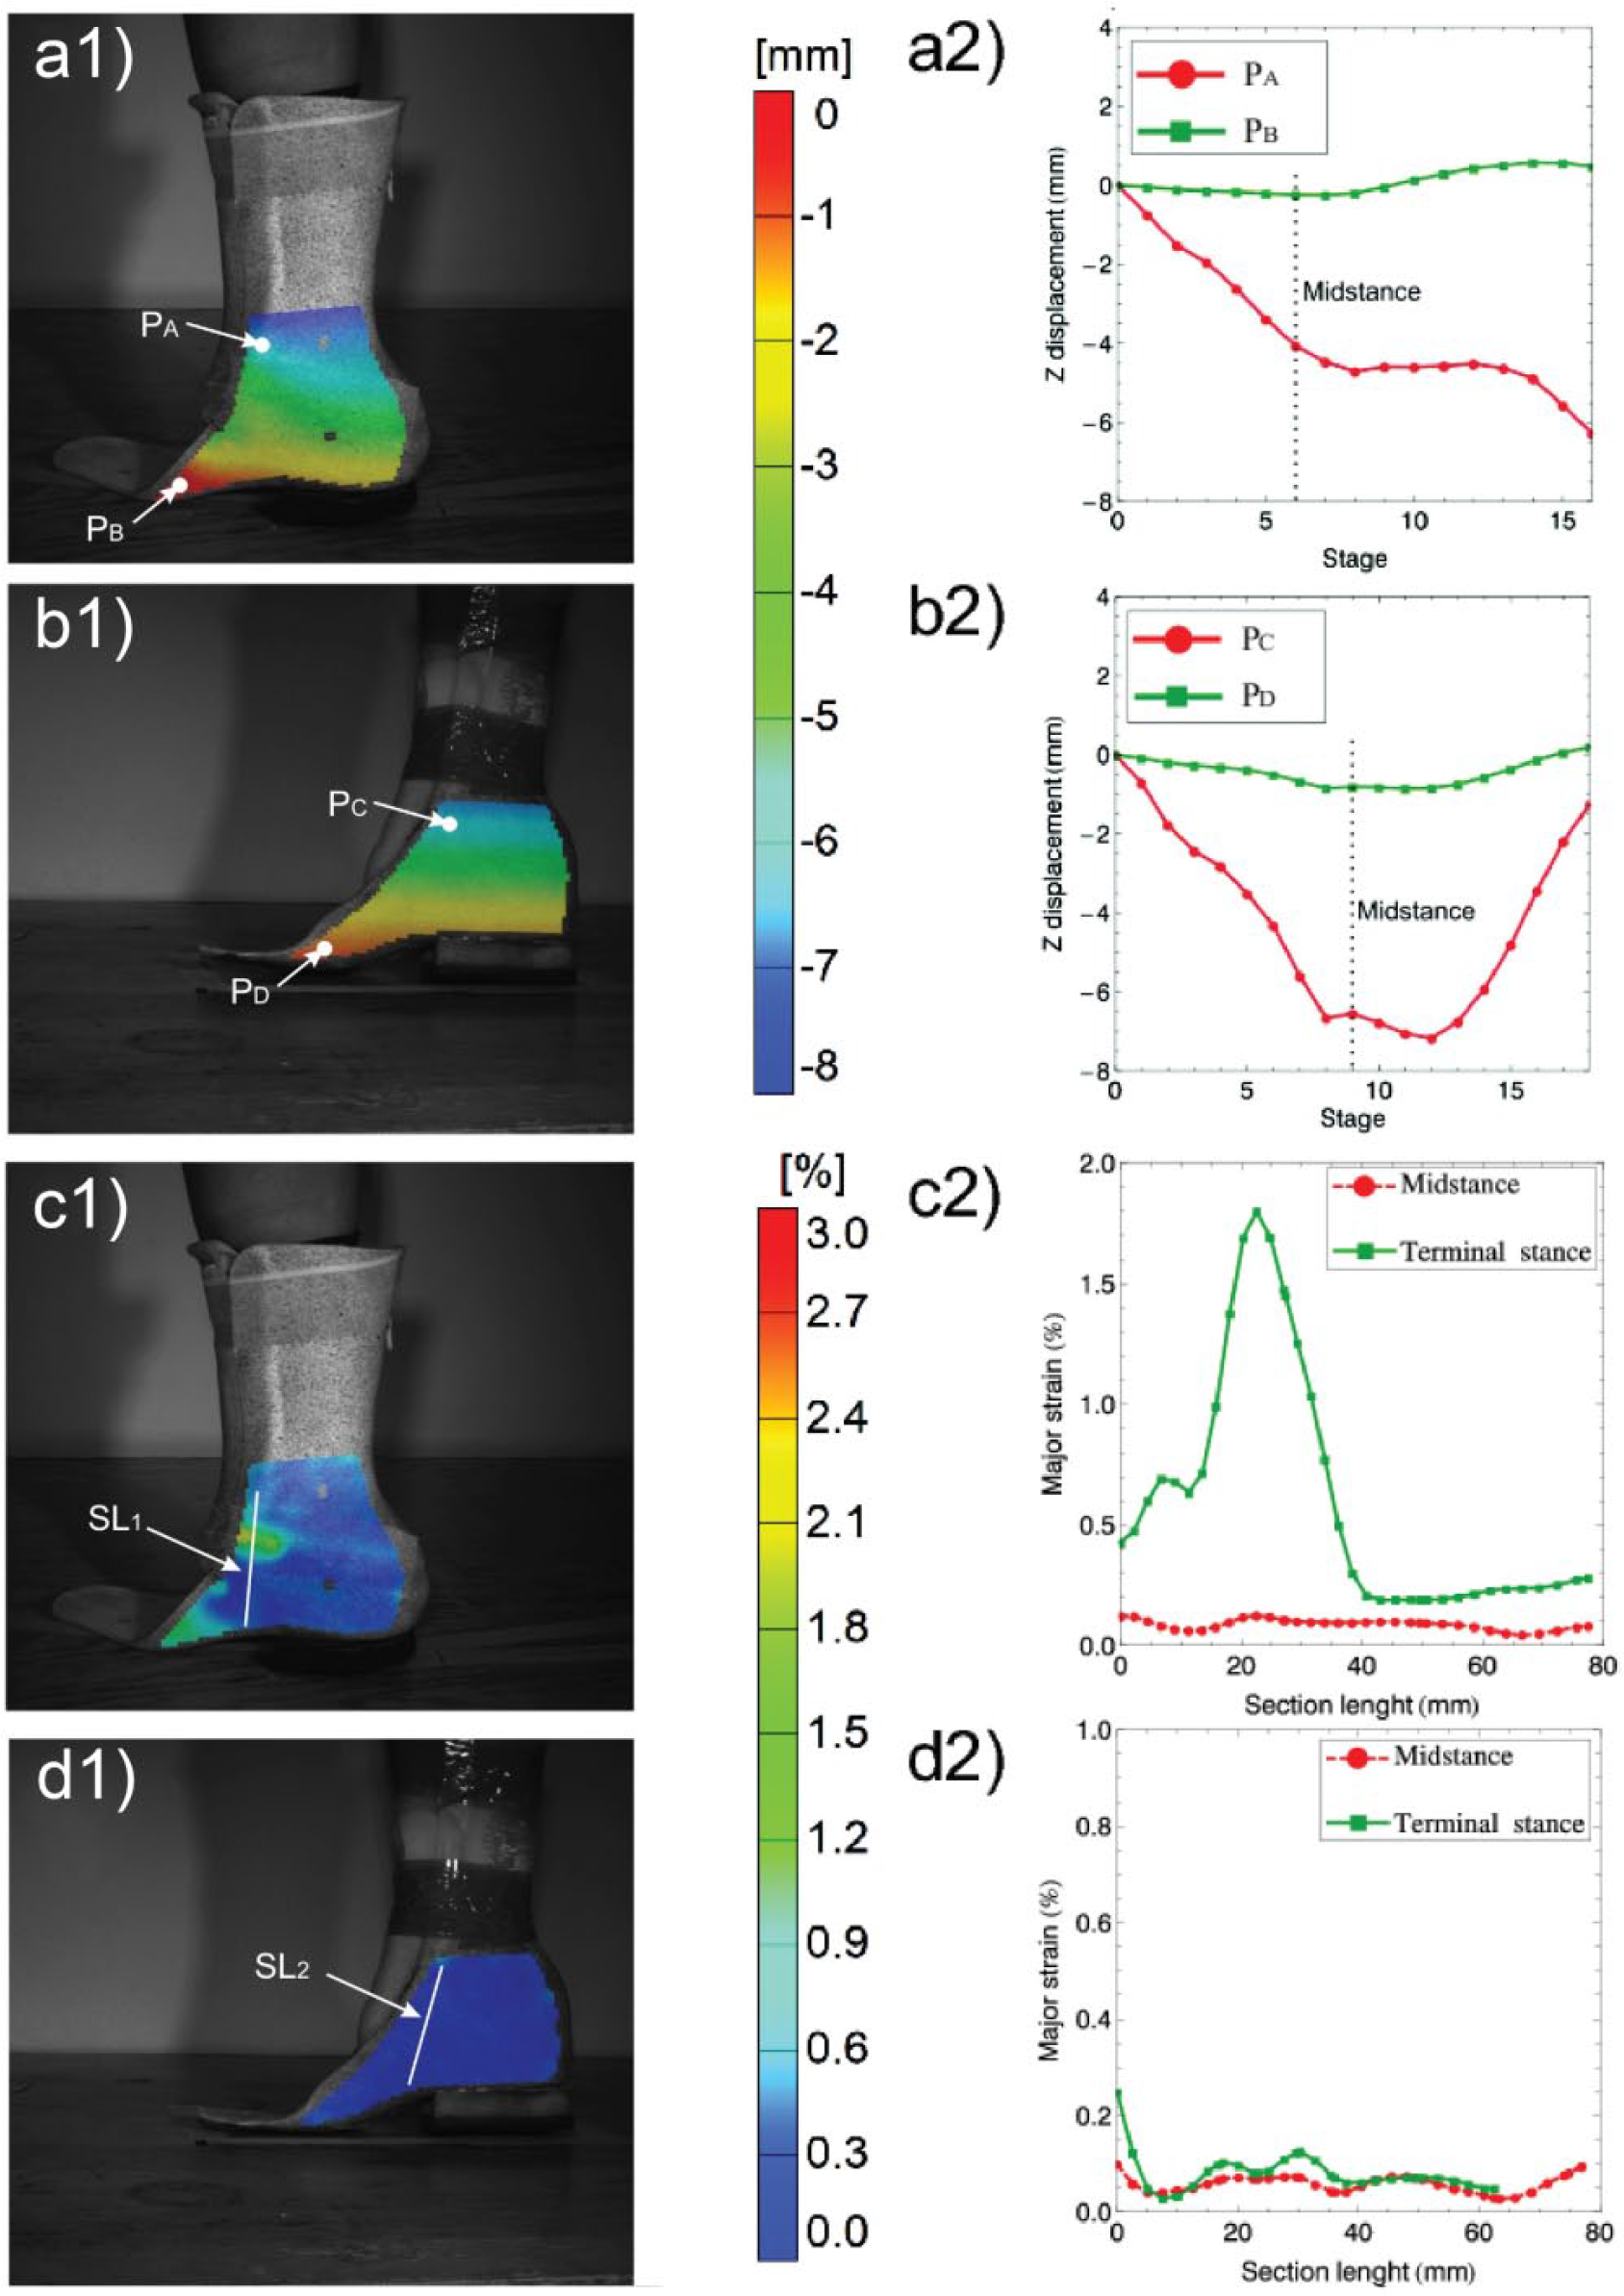
Strain and displacement measurements of the prosthetic system undergoing real dynamic loads: (a1) M1 full-field displacement, midstance; (a2) points PA and PB displacement analysis from foot flat on the floor to terminal stance; (b1) M2 full-field displacement, midstance; (b2) points PC and PD displacement analysis from foot flat on the floor to terminal stance; (c1) M1 full-field major strain, terminal stance, and vertical section SL1; (c2) major strain analysis of section SL1, midstance, and terminal stance; (d1) M2 full-field major strain, terminal stance, and vertical section SL2; and (d2) major strain analysis of section SL2, midstance, and terminal stance.
We observed a lateral displacement of both PS during stance phase. For M1 (Figure 2(a2)), displacement reaches a peak of 7 mm at terminal stance. In the case of M2 (Figure 2(b2)), displacement peaks at midstance and returns to zero. The amplitude of the displacement observed here suggests lateral instability of both PS and could be due to misalignment in the bench stage of manufacture.
As shown in Figure 2(c1) and (d1), the location of strain concentration points and the effect of the composite reinforcement were observed on the surface of both PS. A vertical section, from the malleoli to the floor, was selected for detailed deformation analysis during midstance and terminal stance.
It was observed that the M1 reached a peak strain of 2.7% at terminal stance, when the heel rises from the floor (Figure 2(c2)). For M2 reinforced with a composite, the maximum strain was around 0.2% (Figure 2(d2)).
Discussion
This is the first report to address a method to assess strain and displacement of a prosthetic device under real user loads. One of the main advantages of 3D DIC is a real full-field study, which does not rely on the number of sensors attached to the surface. It permits analysis of a wide region of interest and the identification of specific regions for further evaluation. The use of 3D DIC has increased the understanding of the PS mechanical response.
In clinical practice, the prosthetist does not have feedback on the resistance of the manufactured devices and relies on over-specification of the material to avoid failure. This has two disadvantages. First, the cost of the PS increases as more material is used; second, increased rigidity and weight could make the PS uncomfortable for the user.
In prosthetics, a common methodology to evaluate mechanical response of PS under user loads is based on sensors attached to the socket surface. Some disadvantages of this method include cost, time, temperature sensitivity, position of the sensor in the relevant regions, and curvature of the socket wall and have been discussed fully by other authors.10,14
Although 3D DIC methodology avoids instrumentation, we found that a particular limitation of strain measurements with Aramis 3D 5M LT was the sample rate (15 Hz); in this work, the analysis of the prostheses was limited on the mechanical response while the entire PS was supported on the floor, and the system was static as the load was applied. To obtain data of other gait subphases such as weight acceptance or after heel rise, a higher sample rate CCD sensor is needed. A higher sample rate would permit to follow the angular velocity of the hip, knee, and ankle, and their correlation with the strain concentration on the PS.
The technique presented in this note permitted the quantification of deformation and displacement in partial foot amputation prostheses, and it is generally enough to be implemented in other amputation levels.
Key points
The mechanical response of a prosthetic device under real user dynamic loads can be measured using 3D DIC.
The measurement technique allows the evaluation of changes in design such as composite reinforcement.
3D DIC technique can be a useful tool to assess stability and resistance of prosthetic devices for a specific user needs.
Footnotes
Acknowledgements
The authors are grateful to Alvaro Elizalde Paz who manufactured the prosthetic test devices.
Author contribution
The authors contributed equally in the preparation of this manuscript.
Declaration of conflicting interests
The author(s) declared no potential conflicts of interest with respect to the research, authorship, and/or publication of this article.
Funding
The author(s) disclosed receipt of the following financial support for the research, authorship, and/or publication of this article: This work was developed with the financial support from Conacyt program through grant (FOSISS—2010—141036).