
Abstract
Background:
Over-the-counter foot orthoses are a cost-effective alternative to custom-made devices. However, few studies have compared over-the-counter devices and most biomechanical research involving orthoses has focused on rearfoot biomechanics.
Objectives:
To determine changes in multi-segment foot biomechanics during shod walking in three commercially available over-the-counter devices: SOLE, SuperFeet and Powerstep when compared to no orthotic.
Study design:
Repeated measures, cross-sectional study.
Methods:
Retroreflective markers were placed on the right limb of 18 participants representing forefoot, midfoot, rearfoot and shank segments. Three-dimensional kinematics were recorded using an eight-camera motion capture system while participants walked on a treadmill and the order of condition was randomized between four conditions: SOLE, SuperFeet, Powerstep and no orthotic.
Results:
All over-the-counter devices exhibited significant decreases in plantar fascia strain compared to no orthotic and only Powerstep exhibited significant decreases in peak rearfoot eversion. Medial longitudinal arch deformation was not reduced for any over-the-counter device.
Conclusion:
Different over-the-counter devices exhibited specific alterations in rearfoot kinematics and all reduced plantar fascia strain by varying amounts. These over-the-counter-specific kinematic changes should be taken into consideration when recommending these devices as a treatment option.
Clinical relevance
Over-the-counter orthoses are a cost-effective alternative to custom-made devices. We demonstrated that three commonly used over-the-counter devices influence foot kinematics and plantar fascia strain differently. Clinicians can use these results to provide more tailored treatment options for their patients.
Background
Over-the-counter (OTC) foot orthoses are a cost-effective alternative to custom-made devices.1,2 However, few studies have compared different OTC devices to either a no orthotic condition or among other OTC devices that are commercially available. For example, Zifchock and Davis 3 reported that a semi-custom orthotic device is a feasible alternative to the custom orthotic device with respect to a comfort and ability to control rearfoot motion. Moreover, Davis et al. 4 reported that comparisons between custom and semi-custom orthotic devices produced few differences in rearfoot motion control and comfort for healthy individuals. However, one limitation to these aforementioned studies is that they focused on rearfoot mechanics and did not consider other aspects of foot kinematics. Most orthotic devices have some type of arch support that either conforms to the shape of the medial longitudinal arch to control arch deformation. 5 Indeed, previous studies have hypothesized that orthoses may function to minimize strain to the plantar fascia tissue through arch control.6,7
To test whether OTC control arch deformation or strain, Ferber and Benson 8 investigated changes in multi-segment foot biomechanics during shod walking with and without a SOLE OTC device. The findings indicated that this semi-custom moulded orthotic device reduces plantar fascia strain (PFS) by 35% compared to walking without an orthoses but does not control peak rearfoot eversion (RFEV), tibial internal rotation (ROT) or arch deformation.
Considering the number of OTC devices available, and the different construction materials of these devices, it seems prudent to better understand how different OTCs influence foot biomechanics. However, to our knowledge, no studies have compared different commercially available pre-fabricated or semi-custom OTCs. Therefore, the primary purpose of this study was to determine changes in multi-segment foot biomechanics during shod walking in three commercially available OTC devices: SOLE, SuperFeet and Powerstep compared to no orthotic (NO). Based on previous research 8 and construction of the OTCs, we hypothesized significantly reduced PFS for SOLE and SuperFeet compared to NO. We also hypothesized that SuperFeet and Powerstep would significantly reduce RFEV, ROT and medial longitudinal arch deformation (MLAD) angle compared to NO.
Methods
For this repeated measures, cross-sectional study, 18 healthy individuals (10 males, 8 females; age = 29.7 ± 6.6 years; height = 171.8 ± 8.2 cm and mass = 62.9 ± 9.9 kg) volunteered to participate in the study. All participants were currently free from lower extremity injury, had no prior history of surgery and were familiar with treadmill walking. The institutional Conjoint Health Research Ethics Board (CHREB: Ethics ID REB14-0258) approved the study, and written informed consent was obtained from all participants.
Three different OTC, pre-fabricated or semi-custom orthotic devices were used in this study (Figures 1 to 3): The SOLE, Inc. (Calgary, AB, Canada) Softec Response orthotic, the Superfeet (Ferndale, WA, USA) Green orthotic and the Powerstep (West Chester, OH, USA) Pinnacle orthotic. All manufacturer instructions were followed during the fitting and/or moulding process. For all participants, the right limb was chosen for analysis but orthoses were worn in both shoes.
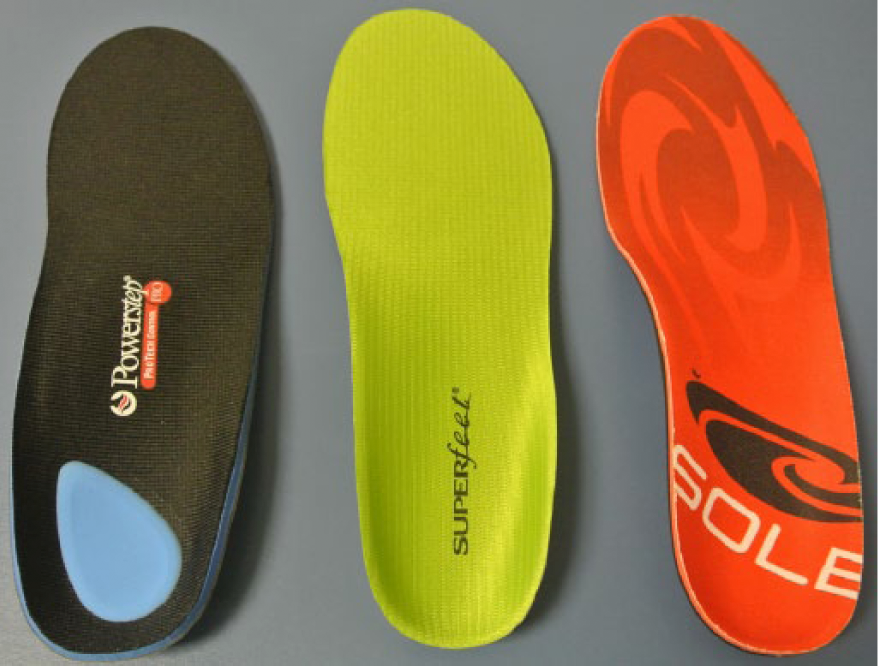
Top view of the three over-the-counter devices used in this study: Powerstep (left), SuperFeet (middle) and SOLE (right).
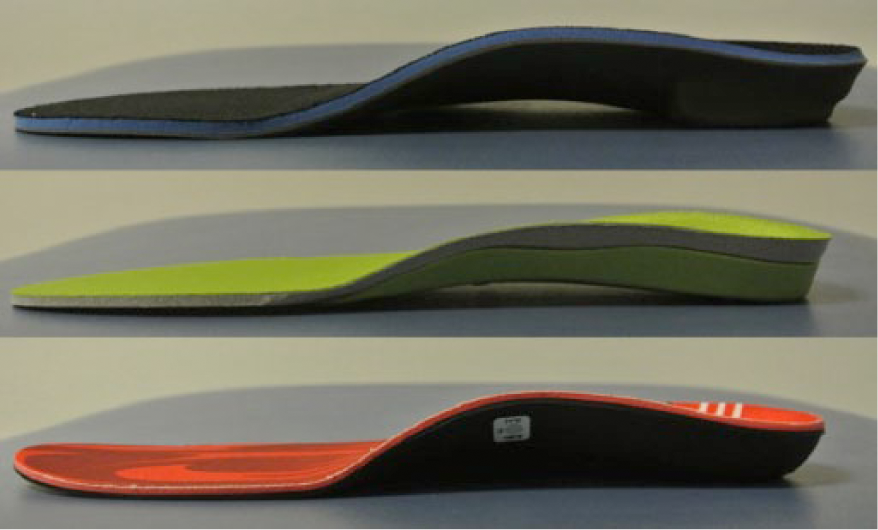
Side view of the three over-the-counter devices used in this study: Powerstep (top), SuperFeet (middle) and SOLE (bottom).
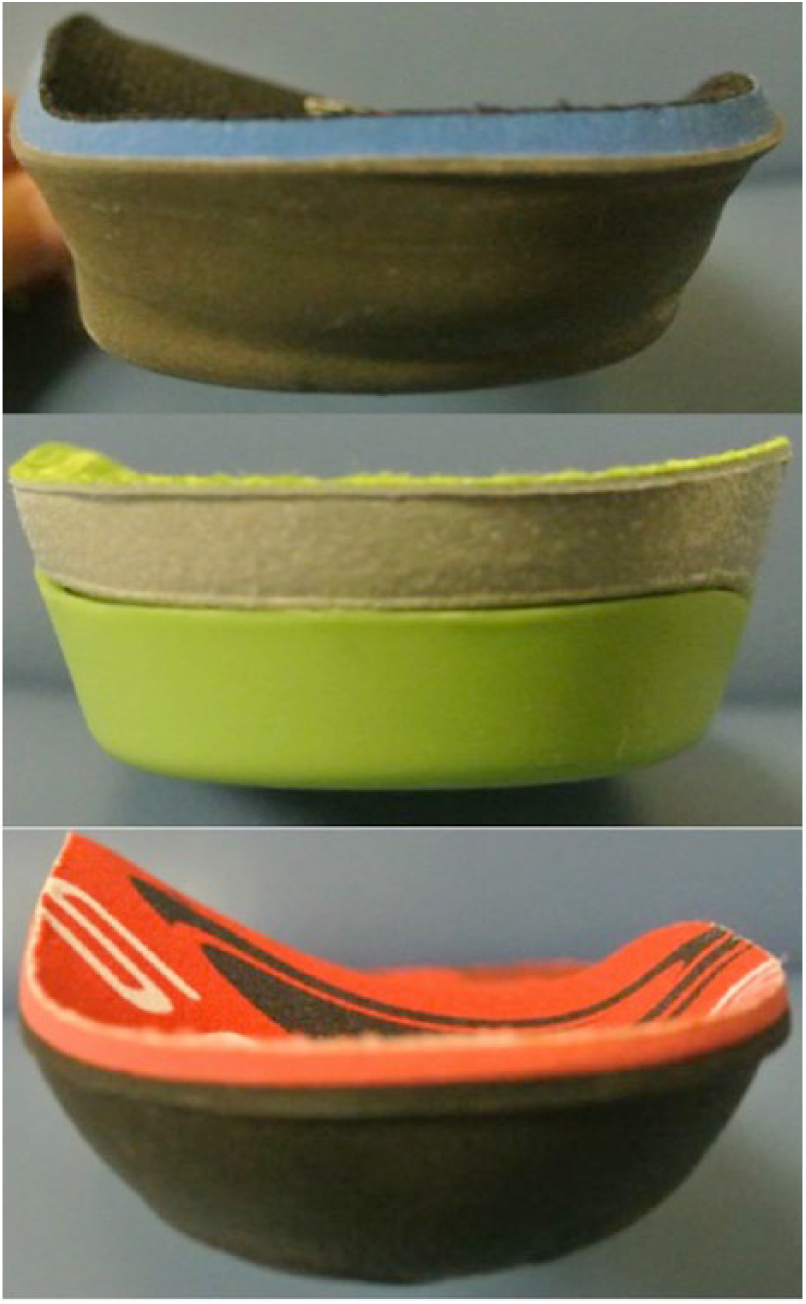
Posterior view of the three over-the-counter devices used in this study: Powerstep (top), SuperFeet (middle) and SOLE (bottom).
All participants were initially screened based on measures of arch height index (AHI) and were only included if they fell within the normative range reported by Butler et al. 9 These authors 9 reported that the mean AHI for a group of recreational runners was 0.363 ± 0.030 for sitting and 0.340 ± 0.030 for standing and the AHI between genders was similar. Thus, the AHI values for the 18 participants fell within these values for both sitting and standing and this inclusion criterion was similar to that used by Ferber and Benson. 8
AHI was measured using a custom-built Arch Height Index Measurement System. Two boards were placed under the foot, one under the calcaneus and other under the forefoot to allow the midfoot to achieve maximum deformation. The measure of AHI is unitless and was defined as the ratio of dorsum height at 50% of total foot length, divided by the foot length from the back of the heel to the head of the first metatarsal, defined as the truncated foot length. 10 Seated AHI was obtained with the participant seated, with hips and knees flexed to 90°, and approximately 10% of total body weight on the foot. Standing AHI was obtained with the participant standing with equal weight on both feet. The AHI measurement was deemed an appropriate measurement of static foot structure and its reliability has been reported as very good to excellent.9,10
Three-dimensional (3D) treadmill walking data were collected using an eight-camera motion analysis system (Vicon Motion Systems Ltd, Oxford, UK). All participants were fitted with 9 mm retroreflective markers adhered directly to the skin on various anatomical landmarks of the tibia, fibula and foot (Figure 4). Specifically, a hard plastic shell with four markers was placed on the lower one-third of the tibia/fibula to represent the shank segment. The rearfoot segment was defined using a cluster of three tracking markers with two markers placed superiorly and inferiorly along the long axis of the calcaneus (SCAL, ICAL) and one placed near the sustentaculum tali on the medial aspect of the calcaneus (MCAL). Additional tracking markers were placed on the navicular tuberosity (NAV), distal aspect (head) of the first metatarsal (D1MT) and distal and superior aspect of the shoe. Two additional anatomical markers were placed on the lateral and medial malleoli to represent the ankle joint and establish the local joint coordinate system. Specific holes were cut in the neutral laboratory running shoes (Brooks Glycerin, Seattle, WA, USA) to allow the tracking markers to be recorded by the cameras and measure rearfoot and midfoot kinematics. Kinematic data were collected for four shod walking conditions (NO, SOLE, SuperFeet and Powerstep) and the order of condition was randomized among the participants.
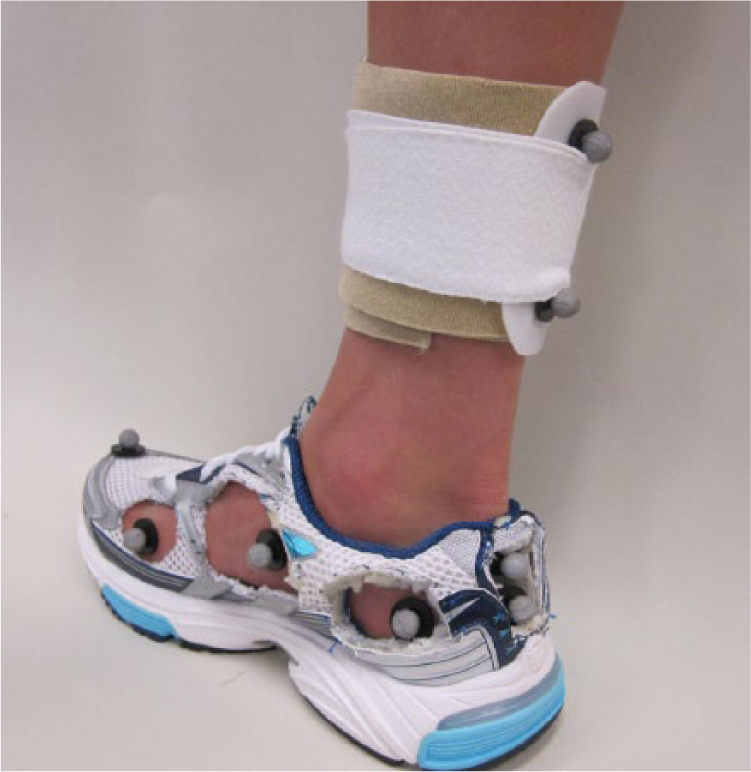
Marker set-up for kinematic data collection.
Between the four conditions, the D1MT, MCAL and NAV markers were removed from the foot while the orthotic condition was changed. To ensure near-identical marker placement for each walking trial, a circle the size of the marker base was stamped on the foot and the marker was placed in the centre of this circle for each trial.
A standing calibration of 1 s was obtained with the participant’s feet placed 0.30 m apart and pointing directly forward and orthogonal to the global laboratory coordinate system. Following the standing calibration, the participants were provided a 1-min warm-up period to walk on the treadmill at 1.2 m/s. Following the familiarization period, marker trajectory data were captured at a rate of 120 Hz for 30 s equating to approximately 40 footfalls.
A total of 10 continuous footfalls of the treadmill walking trial were selected for analysis. Raw marker trajectory data were filtered using a fourth-order low-pass Butterworth filter at 12 Hz. Anatomical coordinate systems were created for the shank and rearfoot segments using custom written MATLAB software (MathWorks, Natick, MA, USA). Only the stance phase of gait was analysed and all kinematic data and raw marker trajectories were normalized to 101 data points prior to data processing. Stance phase was defined as initial heel contact to toe off using a kinematic velocity-based algorithm 11 applied to the SCAL marker and toebox marker, respectively.
Cardan angles were used to calculate 3D angles for the rearfoot and shank. RFEV and tibial rotation were expressed as frontal plane and transverse plane motion of the foot relative to the shank segment. Raw marker trajectories in the global coordinate system were exported for the D1MT, NAV and MCAL markers for the purpose of calculating PFS and MLAD angle values.
The MLAD angle was calculated in a manner similar to previous research investigations.8,12,13 The MLAD angle was defined as the angle subtended by two lines, one from the marker on the MCAL to the navicular tuberosity (NAV) and the other from the head of the first metatarsal (D1MT) to the NAV marker (Figure 5). PFS is a unitless measure calculated by approximating the plantar fascia as spanning between the first metatarsal head (D1MT) and medial calcaneus marker (MCAL) and determined as change in relative marker position.
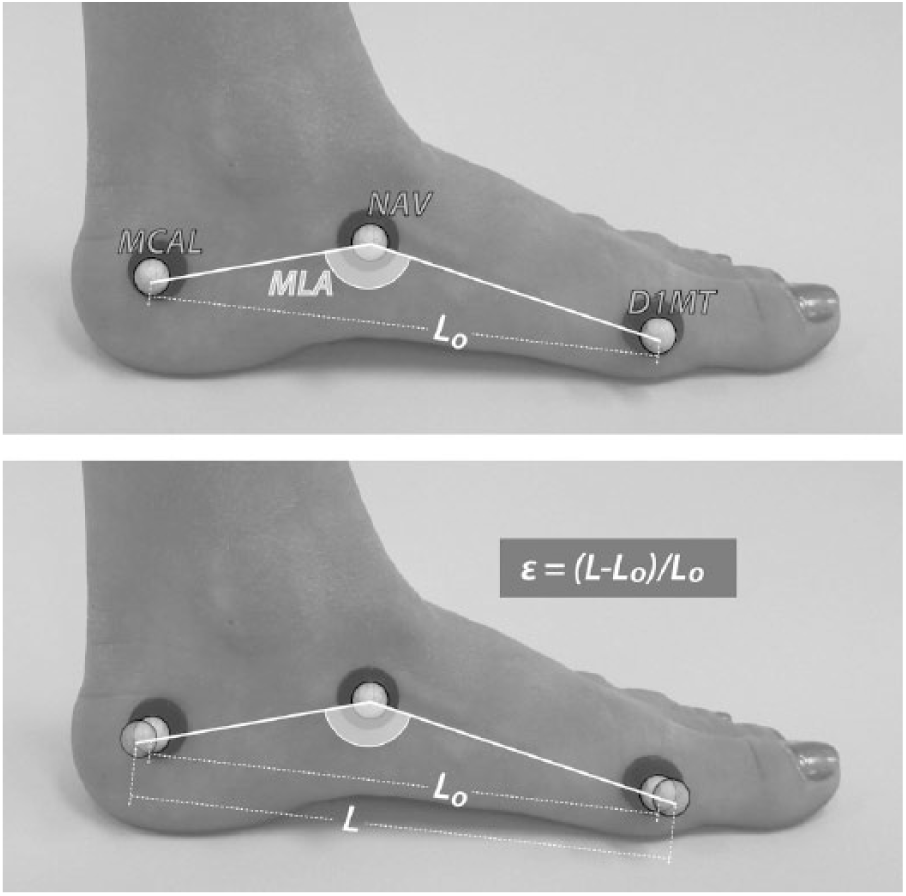
Representation of how MLA angle and PFS values were calculated using the retroreflective markers. Top: calculation of medial longitudinal arch (MLA) angle. Bottom: calculation of plantar fascia strain (PFS or ε) as the change in marker position.
Similar to a previous study, 14 the root mean squared error of 1.1° was measured for changes in measures of forefoot sagittal plane angles as a result of removing the D1MT marker. Also, the between-condition measurement error for PFS, as a result of removing and then placing the markers back within the stamped circles, was similar to Ferber and Benson 8 with the average change in distance between the D1MT and MCAL markers of 0.15 mm (±0.01) and the average change in PFS equal to 14.46% (±5.38).
The discrete kinematic variables of interest included the following: (1) peak RFEV, (2) peak ROT, (3) peak MLAD angle and (4) peak PFS. Between-condition differences were determined using 1 (group) × 4 (condition) repeated measures analyses of variance (ANOVAs) and a priori post-hoc testing (p ⩽ 0.05). All analyses were undertaken using SPSS 17.0 (SPSS, Inc., Chicago, IL, USA).
Results
A summary of between-orthoses changes in the variables of interest is provided in Table 1. There were significant decreases in peak RFEV for Powerstep (F1,7 = 6.87; p = 0.04) but not for SOLE (F1,7 = 2.11; p = 0.19) or SuperFeet (F1,7 = 3.01; p = 0.08) compared to NO. There were no significant differences in peak ROT for any OTC (SOLE: F1,7 = 0.99; p = 0.44, SuperFeet: F1,7 = 1.79; p = 0.29 and Powerstep: F1,7 = 2.81; p = 0.08) compared to NO. There were no significant differences in peak MLAD for any OTC (SOLE: F1,7 = 0.97; p = 0.49, SuperFeet: F1,7 = 1.01; p = 0.55 and Powerstep: F1,7 = 0.99; p = 0.53) compared to NO. There were significant decreases in PFS for all three OTC devices (SOLE: F1,7 = 7.65; p = 0.01, Powerstep: F1,7 = 6.78; p = 0.01 and SuperFeet: F1,7 = 5.85; p = 0.05) compared to NO (Figure 6).
Summary of the variables of interest (Mean, (SD)) for peak rearfoot eversion (RFEV) angle, peak tibial internal rotation (ROT) angle, medial longitudinal arch deformation (MLAD) angle and plantar fascia strain (PFS) across the three orthoses and no orthotic conditions.
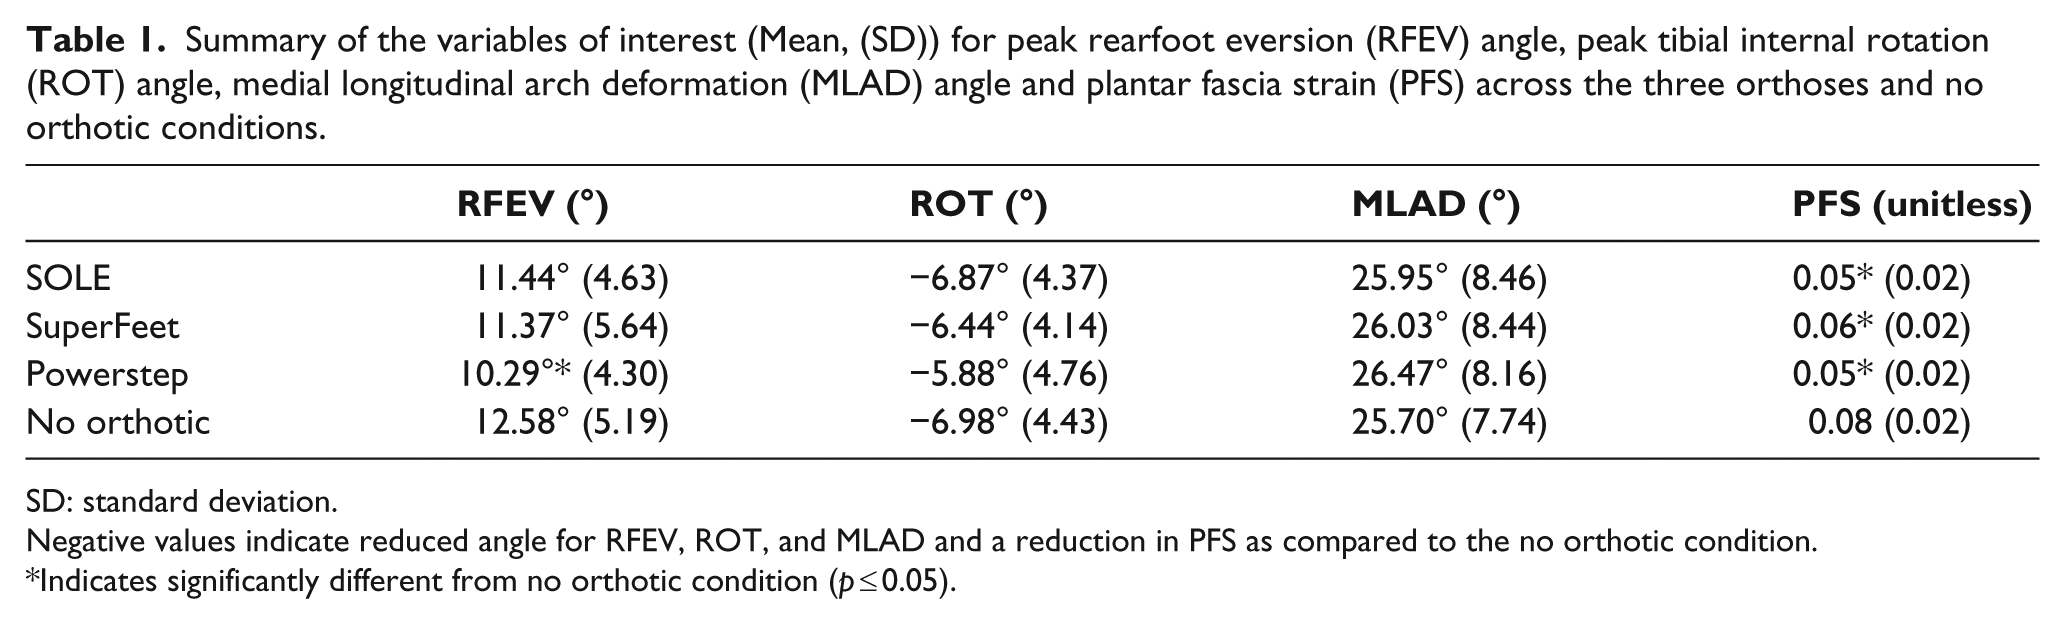
SD: standard deviation.
Negative values indicate reduced angle for RFEV, ROT, and MLAD and a reduction in PFS as compared to the no orthotic condition.
Indicates significantly different from no orthotic condition (p ≤ 0.05).
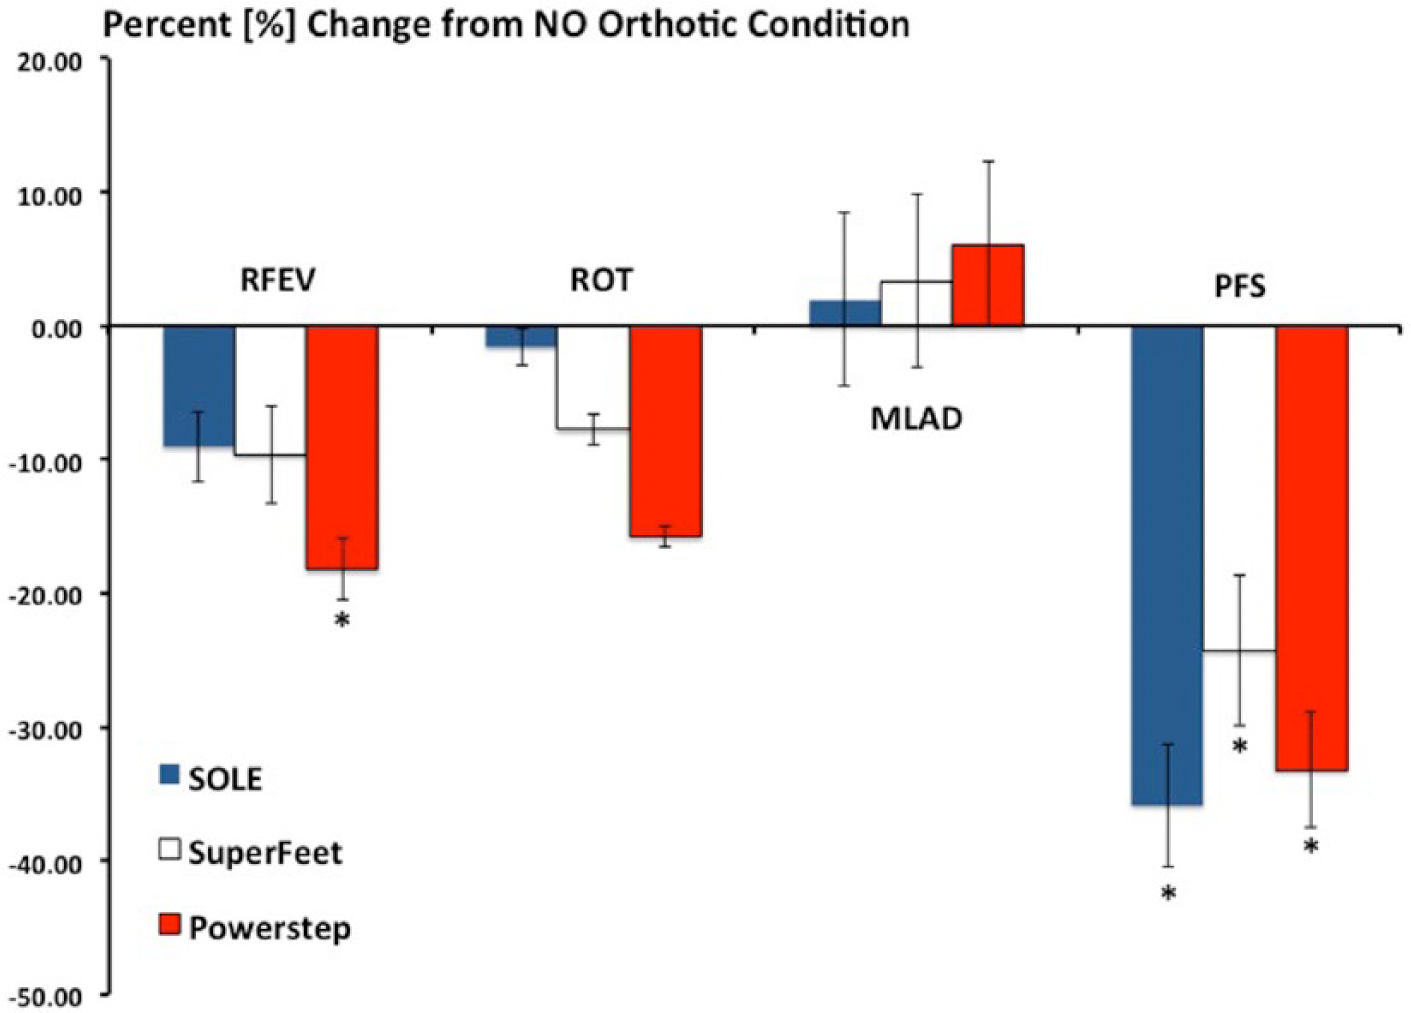
Percent change in peak rearfoot eversion (RFEV), peak tibial internal rotation (ROT), medial longitudinal arch deformation (MLAD) angle and plantar fascia strain (PFS) for the three over-the-counter devices as compared to the no orthotic condition.
Discussion
The purpose of this study was to determine changes in multi-segment foot biomechanics during shod walking in three commercially available OTC devices. To our knowledge, this is the first study to investigate the influence different OTCs have on multi-segment foot gait biomechanics.
In support of the hypothesis, all three of the OTC orthoses reduced PFS as compared to walking with no orthoses. Specifically, the Powerstep OTC resulted in a 33.19% reduction in PFS, the SuperFeet OTC exhibited a 24.24% reduction and the SOLE device resulted in a 35.85% reduction in strain (Figure 6). Inspection of Figure 2 shows that the Powerstep and SOLE devices had the highest arch from a construction standpoint while SuperFeet had a lower overall arch height. Thus, the results of this study appear to be concomitant with how these OTC devices are manufactured and one could conclude that a higher or more aggressive arch results in greater reductions in PFS. Therefore, walking in any of the three devices resulted in greater than the 14.46% between-condition measurement error suggesting these OTC devices have a biological effect on PFS.
Based on these findings, it seems reasonable that using any of these OTC devices would be beneficial for the treatment, or prevention, of musculoskeletal injuries such as plantar fasciitis. Indeed, the use of an orthotic device has been recommended as the primary method for the treatment of plantar fasciitis.15–18 Future studies are therefore necessary to better understand the clinical efficacy of OTC orthoses.
A potential limitation to this study is that the plantar fascia runs from the calcaneal tuberosity to the heads of the first through fifth metatarsal bones 18 and encounters tensile and torsional stress as components of normal physiological function. 19 We modelled the tissue and approximated its location from sustentaculum tali on the MCAL to the head of the first metatarsal, which is a simplified representation. Future research involving finite element modelling 19 and/or direct measures of plantar fascia tissue strain 15 are necessary to provide more accurate measures and better understand the clinical efficacy of orthoses for the treatment and prevention of foot-related injuries.
In partial support of the hypotheses, the Powerstep OTC resulted in 18.20% reduction in peak RFEV while the SOLE orthotic did not control rearfoot kinematics. However, and in contrast the hypothesis, the SuperFeet orthotic did not control rearfoot motion. Inspection of Figure 3 reveals that the PS device has significant medial posting to the rearfoot, which led us to hypothesize that it would reduce peak RFEV. However, the flat, non-cambered surface of the SF device (as opposed to the cambered SOLE rearfoot) also led us to hypothesize that it would also control rearfoot motion. These results are similar to Mündermann et al. 20 who investigated four different orthotic conditions during over-ground running consisting of medial posting, custom-molding and the combination of medial posting and custom-molding of foot orthotics as compared to a control condition. These authors 20 reported that the posted orthotics condition significantly reduced maximum RFEV whereas the moulded condition did not. It was also reported the posting had similar effects on maximum RFEV across the 21 participants involved in their investigation. Therefore, we hypothesize that medial posting is necessary to reduce rearfoot motion and a flat rearfoot surface is not sufficient to significantly control and minimize peak rearfoot kinematics. Future research, similar to Mündermann et al. 20 and this study, is necessary to confirm, or refute, this hypothesis.
Contrary to the hypothesis, we found no differences in peak tibial rotation across the three orthotic conditions, although the Powerstep OTC device approached significance (p = 0.08; Table 1). While several studies21–23 have assessed the effect of foot orthoses on tibial (shank) motion and reported 2°–4° decreases in peak ROT, other studies have reported that orthoses have little influence on foot mechanics.8,24–26 More importantly, previous research has shown that reductions in RFEV do not necessary equate to concomitant reductions in tibial rotation or vise versa. Specifically, Nawoczenski et al. 22 studied the effects of semi-rigid posted orthoses on 3D kinematics and reported no significant change in RFEV but peak ROT was reduced by 2° compared to not using orthoses. In contrast, Rodrigues et al. 26 reported that orthoses reduced peak RFEV for injured and non-injured runners but there were no differences in peak ROT, rotation velocity or rotation excursion. Moreover, while these authors investigated running kinematics and this study investigated walking, they used a similar methodology and placed retroreflective markers directly on the heel and projected them through a window cut into the shoe. These authors 24 did not, however, utilize a multi-segment foot model and did not therefore investigate other variables such as PFS similar to this study. Future research is therefore necessary.
Across the three OTC conditions, no changes in MLAD were measured and these results are similar to previous research. 8 Since the change in position of the D1MT and MCAL markers were used to calculate the PFS, and since PFS was significantly decreased (indicating a change in marker position), one must assume that the only reason the MLAD angle was not significantly different among the three conditions studied was lack of movement of the NAV marker. Tranberg and Karlsson 27 used 2-D roentgen photogrammetry to better understand navicular kinematics during gait. They reported that the navicular bone moves up to 1.97 mm in the superior-inferior direction, which can influence MLAD measurement accuracy. Thus, future research using such technology as real-time fluoroscopy, in parallel with motion capture, is necessary to better understand whether orthoses influence MLAD during walking gait.
Similar to the results from a previous study, 8 the SOLE orthotic did not control RFEV, tibial rotation and MLAD but it did significantly reduce PFS. Specifically, Ferber and Benson reported that when following the manufacturer’s instruction, the heat-moulding process reduced strain by 34.77% and in this study there was a 35.85% reduction. The similar results, across two separate experiments and involving similar participants, suggest that this multi-segment marker placement methodology can be replicated and provides further evidence that the SOLE OTC device reduces PFS.
Based on the results of the current investigation, several clinically relevant recommendations can be drawn. For example, based on an assessment by a health professional, individuals who may benefit from an orthotic designed to reduce RFEV could walk in a Powerstep OTC device. Moreover, for those individuals who may only need reductions in PFS without any control of rearfoot kinematics, the SOLE or SuperFeet devices could be recommended.
Several limitations are acknowledged. First, this study did not involve custom orthoses, derived from a plaster cast of the foot or other individualized approaches so comparisons with previous investigations involving custom-moulded orthotics are difficult. However, previous studies have reported few differences between custom and non-custom orthotic devices in rearfoot motion control and comfort for healthy individuals.3,4 Second, the present investigation was limited by the fact that the AHI was the only structural measurement of the foot. Future research, whereby other clinical measures such as first ray mobility and involving individuals with excessive arch deformation, is necessary to better understand the role of orthoses in other populations. Moreover, since many chronic injuries, such as plantar fasciitis, occur in response to atypical loading, future research involving injured individuals is necessary to understand the clinical efficacy of these OTC devices.
Conclusion
This is the first study to investigate how different commercially available OTC orthoses influence multi-segment foot kinematics. Our findings indicate that a SOLE OTC orthotic does not control peak RFEV or peak MLAD but does reduce PFS. In addition, the Powerstep and SuperFeet devices also reduce PFS compared to walking without an orthotic. Partially supporting the hypotheses, Powerstep reduced peak RFEV but contrary to the hypotheses, SuperFeet orthoses do not control rearfoot or tibial kinematics.
Footnotes
Acknowledgements
SOLE, Inc. and Powerstep donated the orthoses used in this investigation and for that we are grateful. SuperFeet orthoses were purchased by the researchers.
Author contribution
Both authors contributed equally in the preparation of this manuscript.
Declaration of conflicting interests
The authors declare that they have no competing interests or conflicts of interest.
Funding
This work was supported, in part, by a research grant from Alberta Innovates: Health Solutions ((Grant/Award Number: ‘200700478’).