
Abstract
Background:
Symptomatic flexible flatfoot causes alterations in gait, but exactly how this condition affects the intersegmental motion of the foot during the gait cycle remains unclear. Previous studies have examined the kinematics, yielding inconsistent findings. Therefore, the objective of this study was to investigate how flexible flatfoot deformity, defined as Johnson and Strom classification staging II, affects the intersegmental motion of the foot during fast walking based on a comparison with the matched control group.
Methods:
Eleven participants with symptomatic flexible flatfoot and 11 healthy matched control participants were recruited using a foot screening protocol incorporated through a foot physical examinations and radiographic measurements. All demographic characteristics exhibited comparable profiles between the groups. During controlled walking, kinematic outcomes pertaining to the hallux, hindfoot, forefoot, and tibia were collected using the multisegmental Oxford Foot Model.
Results:
All spatiotemporal parameters were comparable between the groups. In comparison to the control group, individuals with symptomatic flexible flatfoot demonstrated increased hallux valgus and plantarflexion, increased forefoot abduction, heightened hindfoot eversion, and internal rotation. Notably, no significant major differences were observed in the tibia motion segment. Further, significant correlations were identified between static foot measurements and the extent of the maximum deviation observed during dynamic kinematic assessments.
Conclusion:
Compared with age- and gender-matched controls, participants with symptomatic flexible flatfoot exhibited significant gait pattern deviations. A significant correlation also exists between static foot deformity measurements and dynamic kinematic deviations. Collectively, these findings have implications for developing targeted therapeutic interventions to address flexible flatfoot.
Level of evidence:
Level III, diagnostic study.

Introduction
Flatfoot deformity is a common cause of chronic foot pain and disability. 23 Beyond the impact on arch height, flatfoot deformity often leads to a complex 3-dimensional deformity involving hindfoot eversion, forefoot supination, and forefoot abduction, 1 resulting in reduced shock absorption and decreased gait efficiency. 37 The established Johnson and Strom classification staging system (JSCS) and the recently introduced progressive collapsing foot deformity (PCFD) classification stratifies flatfoot based on the extent of deformity and its severity.10,19 In stage II in JSCS (stage 1A in PCFD), the deformity is characterized by concurrent signs of tendinopathy alongside the manifestation of flexible flatfoot deformity. We are particularly interested in this stage because of its being characterized by tendinopathy and incompetent soft tissue structures associated with foot deformities, rather than involving the bony structures. To achieve successful treatment outcomes, a comprehensive understanding of the specific kinematic alterations associated with this pathology is necessary, which can be accomplished through qualitative clinical assessments. Such an understanding could facilitate the formulation of effective treatment strategies for managing this deformity.
More recently, a multisegmental foot model has emerged as a reliable method for dynamic assessment of flatfoot deformity via gait analysis.7,12,17,25,27,29 This method offers a heightened level of precision in quantitative clinical evaluations in flatfoot individuals. 20 Although a limited number of kinematic investigations have compared individuals with flatfoot to those exhibiting a normal-arch foot posture,17,20,27,29,35 these inquiries have produced inconsistent outcomes. 3 This variance can be attributed to the diversity in the inclusion criteria employed for participants in the flatfoot category. Earlier studies also included wide-ranging and diverse factors related to participants and often lacked a well-matched control group in terms of demographic characteristics,7,20,29 an aspect that could impact the magnitude of significance observed in the outcomes related to intersegment motion as well.14,16
With the aim of providing greater clarity regarding the kinematic assessment of individuals presenting with flexible flatfoot conditions, particularly within the context of stage II in the JSCS, the purpose of this study was to investigate how flexible flatfoot deformity affects the intersegmental motion of the foot during walking, as compared to the matched control group, using the multisegmental Oxford Foot Model. Furthermore, the study aimed to assess the correlation between static deformity and dynamic kinematic deviations in the examined individuals. We hypothesized that individuals with flexible flatfoot would manifest kinematic alterations in the intersegmental motion, particularly within the forefoot and hindfoot segments compared with participants with normal-arch feet. Additionally, we anticipated a significant correlation between static and dynamic parameters.
Materials and Methods
Study Design and Participants
The controlled-laboratory gait analysis study was conducted at the College of Sports Science and Technology, Mahidol University. Participants with normal-arch and flexible flatfoot were recruited from local volunteers who responded to a flatfoot educational campaign conducted within our college. Inclusion in the flexible flatfoot group required matching foot symptoms associated with flatfoot. For each participant, foot posture was assessed through a comprehensive foot screening protocol. The protocol involved thorough physical examinations conducted by an experienced orthopaedic surgeon, supplemented by radiographic measurements obtained from weightbearing foot radiographs.
To be categorized within the flexible flatfoot group, participants had to exhibit 1 or more of the following signs of tendinopathy: (1) palpable tenderness in the area of the tibialis posterior tendon, (2) swelling of the tibialis posterior tendon sheath, and (3) pain along the course of the tibialis posterior tendon elicited during a single heel-rise test. The physical examinations needed to reveal a reduction in the medial longitudinal arch height, accompanied by hindfoot valgus and discomfort during single heel-rise test. 8 Notably, the diminished arch and hindfoot eversion could revert to their normal states following active tiptoe-standing on both feet, as demonstrated by the double heel-rise test. Additionally, to meet the criteria for this group, a participant’s talus–first metatarsal angle (Meary angle) and talonavicular coverage angle had to exceed 7 and 10 degrees, respectively, as measured via weightbearing radiographs. 29 Inclusion criteria for the normal control group required that participants have no current history of foot or ankle discomfort. The determination of normal-arch conditions was established through physical examinations alongside the exhibition of radiographic measurements within the normal range in a weightbearing radiograph. The exclusion criteria for both groups sought to omit participants with the following attributes: (1) neurologic pathologies that affect walking and balance; (2) previous history of orthopaedic surgery on the lower extremities or back; (3) previous major injuries on both legs; (4) skin lesions on both sides of the legs; and (5) a change in the ankle joint or foot due to osteoarthritis, assessed from the weightbearing radiograph.
Based on the mean difference in maximum abduction of forefoot relative to the hindfoot (FFHF) as reported in the study conducted by Levinger et al, 17 a prior sample size calculation was performed, indicating that a minimum of 10 participants per group would be necessary to achieve 90% statistical power at a significance level of alpha = 0.05. To enhance the volume of available data for subsequent analysis, an additional 1 extra participant was added to each group. A total of 22 participants were enrolled in the study. The participants’ demographic characteristics were comparable between the groups (Table 1). The mean age of all participants was 19.05 ± 1.36 (range, 18-23) years. This study was ethically approved by our university’s institutional research board committee (IRB number MU-CIRB 2021/037.2501). Finally, all participants provided informed consent prior to participation. All methods were performed in accordance with the Helsinki guidelines and relevant CIOMS guidelines.
Basic Demographic Characteristics, Foot and Ankle Measurements, and Functional Assessment Score in Participants With and Without Flexible Flatfeet.
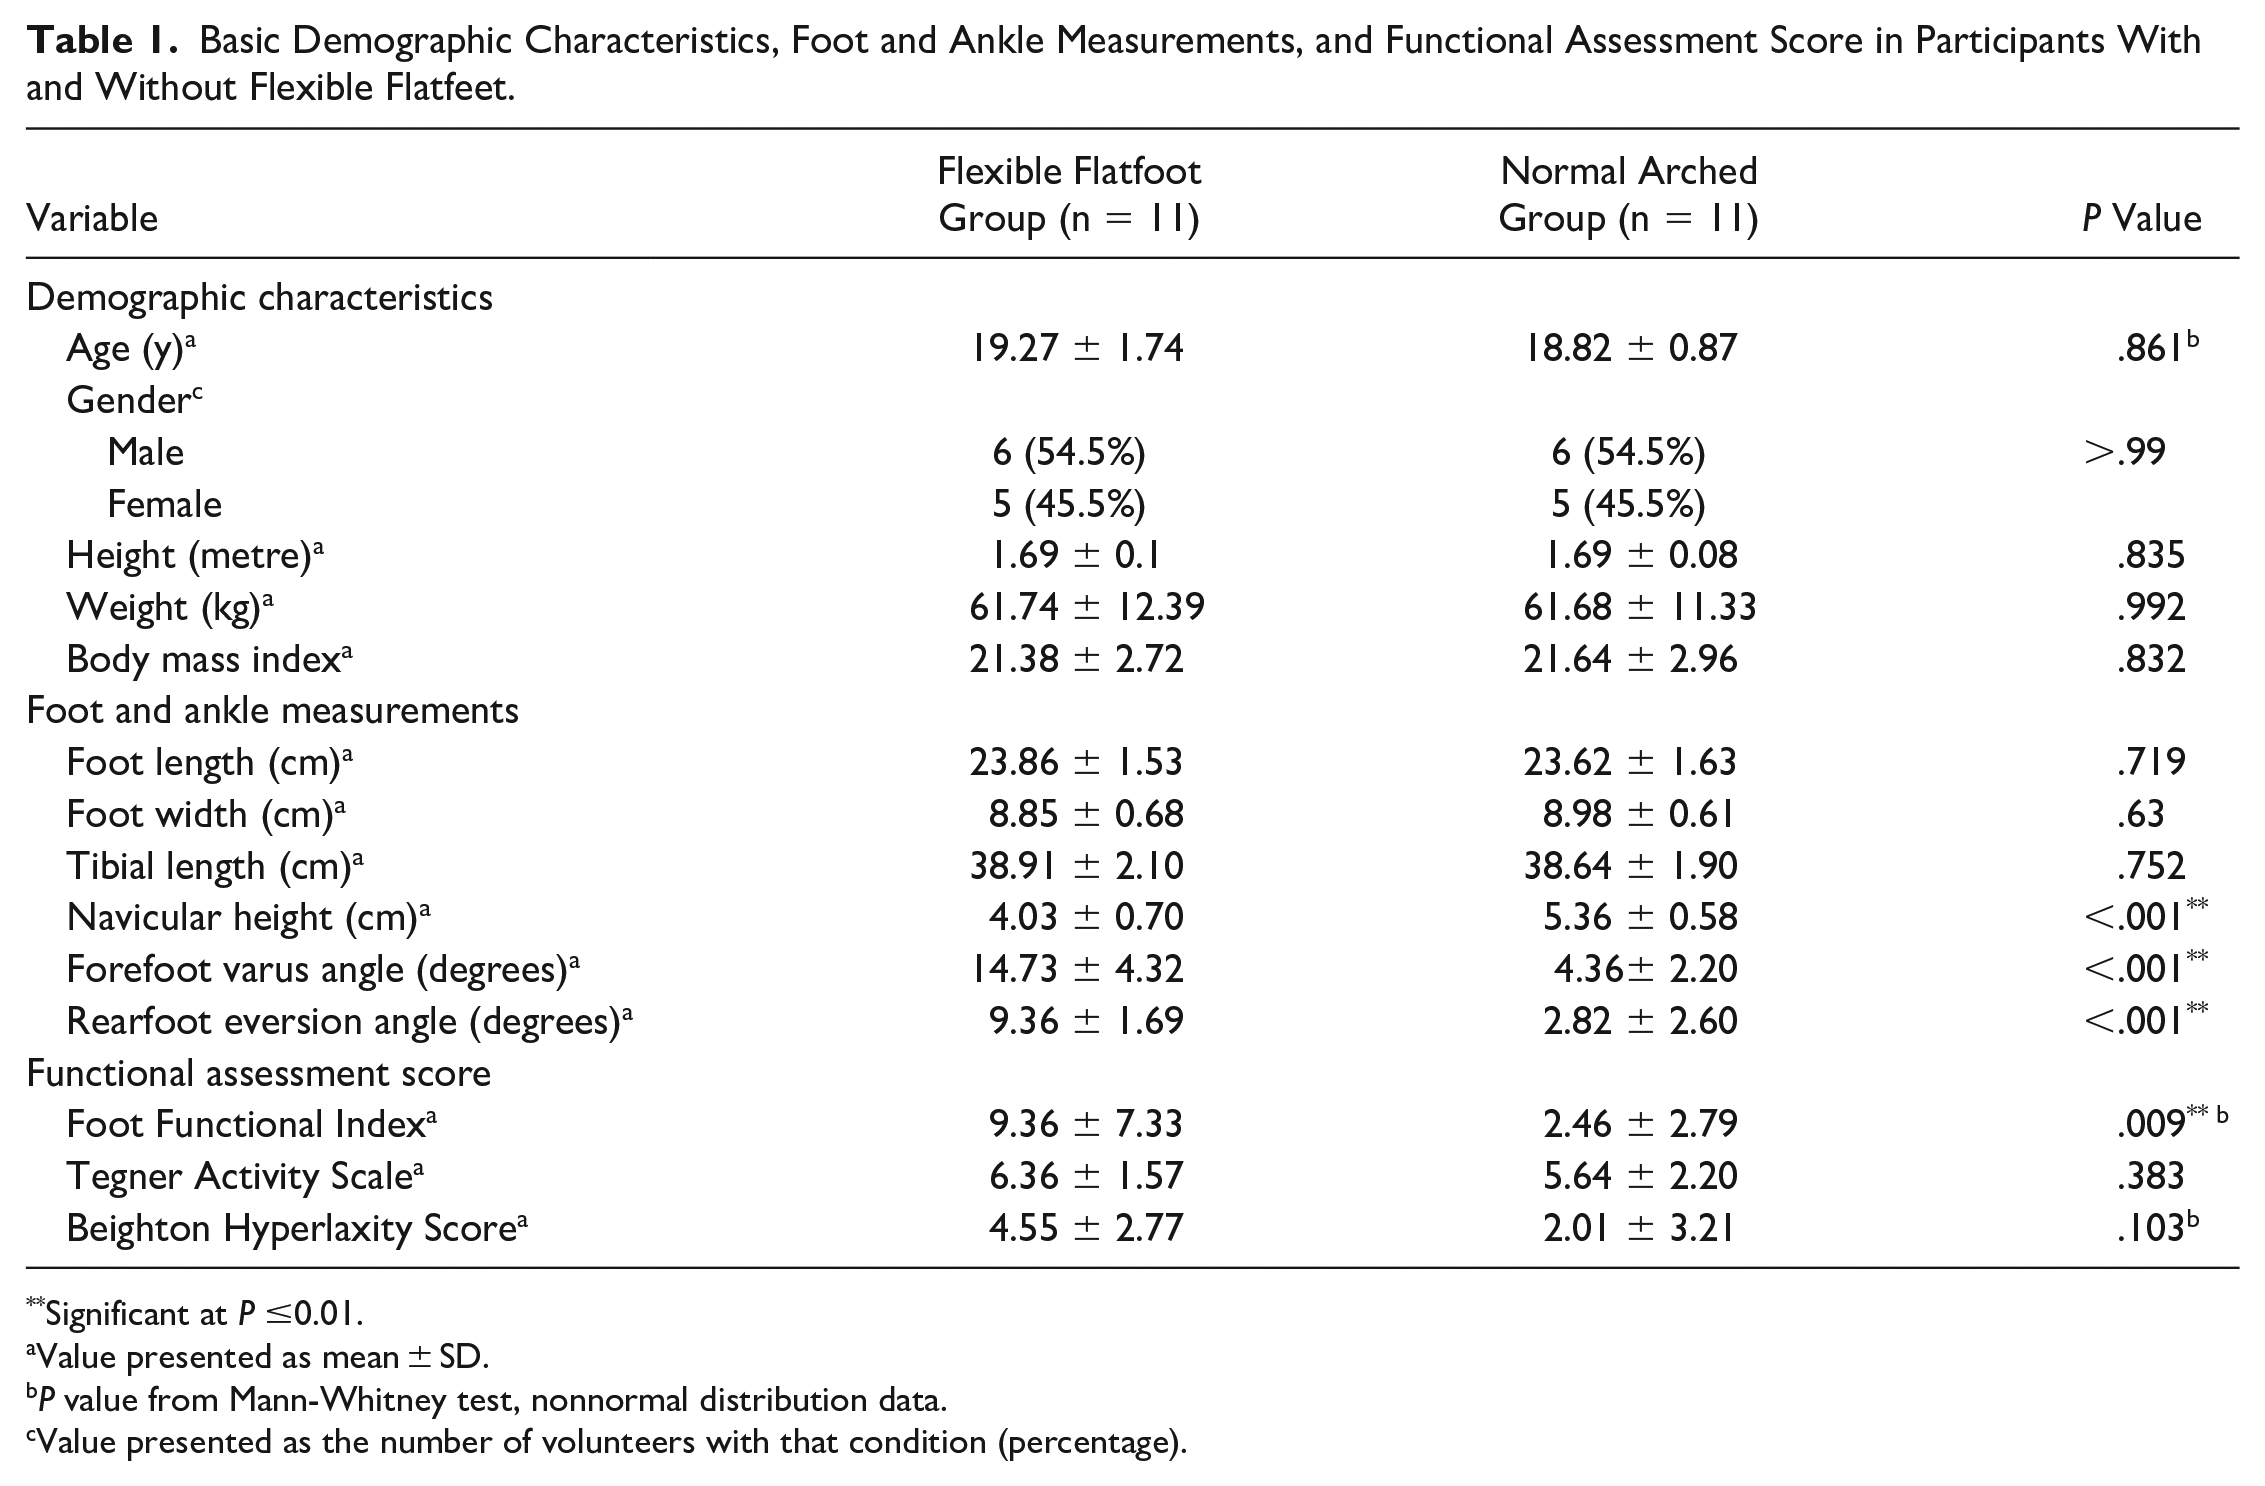
Significant at P ≤0.01.
Value presented as mean ± SD.
P value from Mann-Whitney test, nonnormal distribution data.
Value presented as the number of volunteers with that condition (percentage).
Data Collection and Outcome Measurement
The fundamental demographic characteristics were age, gender, height, weight, body mass index, and Beighton Hyperlaxity Score. Notably, individuals within the control group were subjected to a selection process, employing a frequency matching method, to ensure precise matching with the case group. Regarding the assessment of foot and ankle metrics through physical examinations, the gathered data consisted of the key variables, including foot length, foot width, tibial length, navicular height, forefoot varus angle, and rearfoot eversion angle. We measured the variables in accordance with previous literature.26,30
Foot radiographic images with participants in an upright, full weightbearing position were obtained from both the flexible flatfoot and control groups. All radiographic measurements were performed by an orthopaedic surgeon using a goniometer tool in the Picture Archiving and Communication System (PACS) software, as shown in Figure 1. These measurements within the normal range include the talus–first metatarsal angle (<0 degrees), calcaneal inclination angle (20-30 degrees), calcaneal–fifth metatarsal angle (150-165 degrees), talonavicular coverage angle (0 degrees), talus–second metatarsal angle (5-15 degrees), and talus–first metatarsal alignment (medial to shaft). All radiographic measurements were performed in accordance with established methodologies outlined in previous investigations.4,6

On lateral weightbearing foot radiograph: (A) talus–first metatarsal angle (Meary angle), (B) calcaneal inclination angle, and (C) calcaneal-fifth metatarsal angle (CA-MT5). On anteroposterior weightbearing foot radiograph: (D) talonavicular coverage angle, (E) talus–second metatarsal (T2M) angle, and (F) talus–first metatarsal alignment.
Gait Lab Instrument
A 3-dimensional motion analysis system (BTS Bioengineering, Italy), equipped with a 9-camera configuration (BTS SMART DX 5000) at the height of 1 m with an optical motion capture system was used to evaluate intersegmental motion of the foot during walking. This setup operated at a sampling frequency of 200 Hz. In tandem, 2 force plates (Kistler, type 9286BA; Winterthur, Switzerland) operating at a frequency of 1600 Hz were deployed to record ground reaction forces and precisely determine gait cycle events. Visual 3D software (C-motion, version 6) was used to analyze kinematic outcomes.
Experimental Procedures
To evaluate the intricacies of intersegmental foot motion within a 3-dimensional framework, we employed the Oxford Foot Model, a methodology originally introduced by Stebbins et al, 31 as demonstrated in Figure 2. Regarding the experimental procedure, participants were instructed to perform barefoot walking for 5 minutes at our preferred range of speed, set between 130 and 150 cm/s. Notably, this velocity range exceeds the gait speed observed within our population. 13 We selected this range based on the presumption that notable differences could potentially become more evident when an experiment involved a higher gait speed. 5 Subsequently, after we conducted a calibration trial, participants were instructed to conduct a walking trial at our preferred pace along an 8-m track. Five conducted trials without any unconstructed data from markers were collected; the peak values were individually extracted. Three representative strides from 5 separate trials were collected, and the average values from those strides were used for the subsequent analysis.

Marker placement for the multisegment Oxford Foot Model. Nineteen markers were positioned around the foot and ankle. (A) Front view of marker placement, (B) rear view of marker placement, (C) lateral view of marker placement, and (D) medial view of marker placement.
Gait Kinematic Outcome
Gait spatiotemporal parameters, the cadence, cycle time, proportion of stance phase, gait velocity, stride length, and step width were collected. To reduce potential intersubject variability attributed to differences in body size, we divided the speed (cm/s), stride length (cm), and step width (cm) by height (m), which resulted in designated normalized values referred to as n speed, n stride length, and n step width, respectively.22,29
For the kinematic outcomes, segmental excursions (peak-to-peak range of motion), position at initial contact, and peak maximum and minimum kinematic values across the gait cycle for the sagittal, coronal, and transverse planes were extracted for the hallux relative to forefoot (HLFF), forefoot relative to the hindfoot (FFHF), hindfoot relative to tibia (HFTB), and tibia relative to the laboratory (TBLB). The marker coordinates underwent zero-phase lag filtering through a fourth-order Butterworth digital filter, with a cutoff frequency set at 6 Hz. Kinematics were subsequently calculated using Visual 3D based on the filtered marker coordinates.
Statistical Analysis
Statistical analyses were calculated using Stata 15 software (StataCorp, College Station, TX). Data were analyzed for completeness and normality using the Shapiro-Wilk test combined with a normal distribution plot. Statistical analysis was conducted using the independent Student t test for continuous variables that exhibited conformity with the normal distribution, whereas the Mann-Whitney test was used for continuous variables that did not satisfy normality. Differences of kinematic outcome between groups were determined using multilevel mixed effects linear regression analysis. Correlations between significant measurements and maximum motion data from 3-dimensional foot kinematics were assessed with the Pearson correlation coefficient method. A P value less than .05 was considered statistically significant.
Results
Participants’ Foot Assessment
Regarding foot measurements, the flexible flatfoot group demonstrated significant diminished navicular height, increased forefoot varus angle, and increased rearfoot eversion angle compared to the control group (P value < .001). For foot functional assessment, the Foot Functional Index in the flexible flatfoot group was significantly higher compared to that of the control group (9.36 ± 7.33, 2.46 ± 2.79, respectively, P value = .009). Significant differences were found across all radiographic measurements between the groups, as shown in Table 2 (P value < .01).
Radiographic Characteristics and Gait Spatiotemporal Parameters in Participants With and Without Flexible Flatfoot.

Value presented as mean ± SD.
Value presented as the number of volunteers with that condition (percentage).
n: normalized data with participant’s height (gait velocity, stride length, and step width divided by participant’s height).
Significant at P ≤.01.
Gait Kinematics
Basic spatiotemporal parameters exhibited similarity between the groups (Table 2). Most kinematic differences were observed in the forefoot and hindfoot segments. Generally, no significant difference was found with the total range of motion between groups except for with the sagittal plane of HLFF, HFTB, and TBLB (P value = .015, <.001, and .043 respectively). Similarly, concerning the initial contact, no statistical significance was found between groups except for with the transverse plane of HLFF and FFHF (P value = .047 and .001 and respectively) (Table 3, Figure 3).
Three-Dimensional Foot Kinematics in Terms of Maximum Motion, Angle at Initial Contact, and Range of Motion for the Hallux Relative to the Forefoot, Forefoot Relative to the Hindfoot, Hindfoot Relative to the Tibia, and Tibia Relative to the Laboratory in Participants With and Without Flexible Flatfoot.
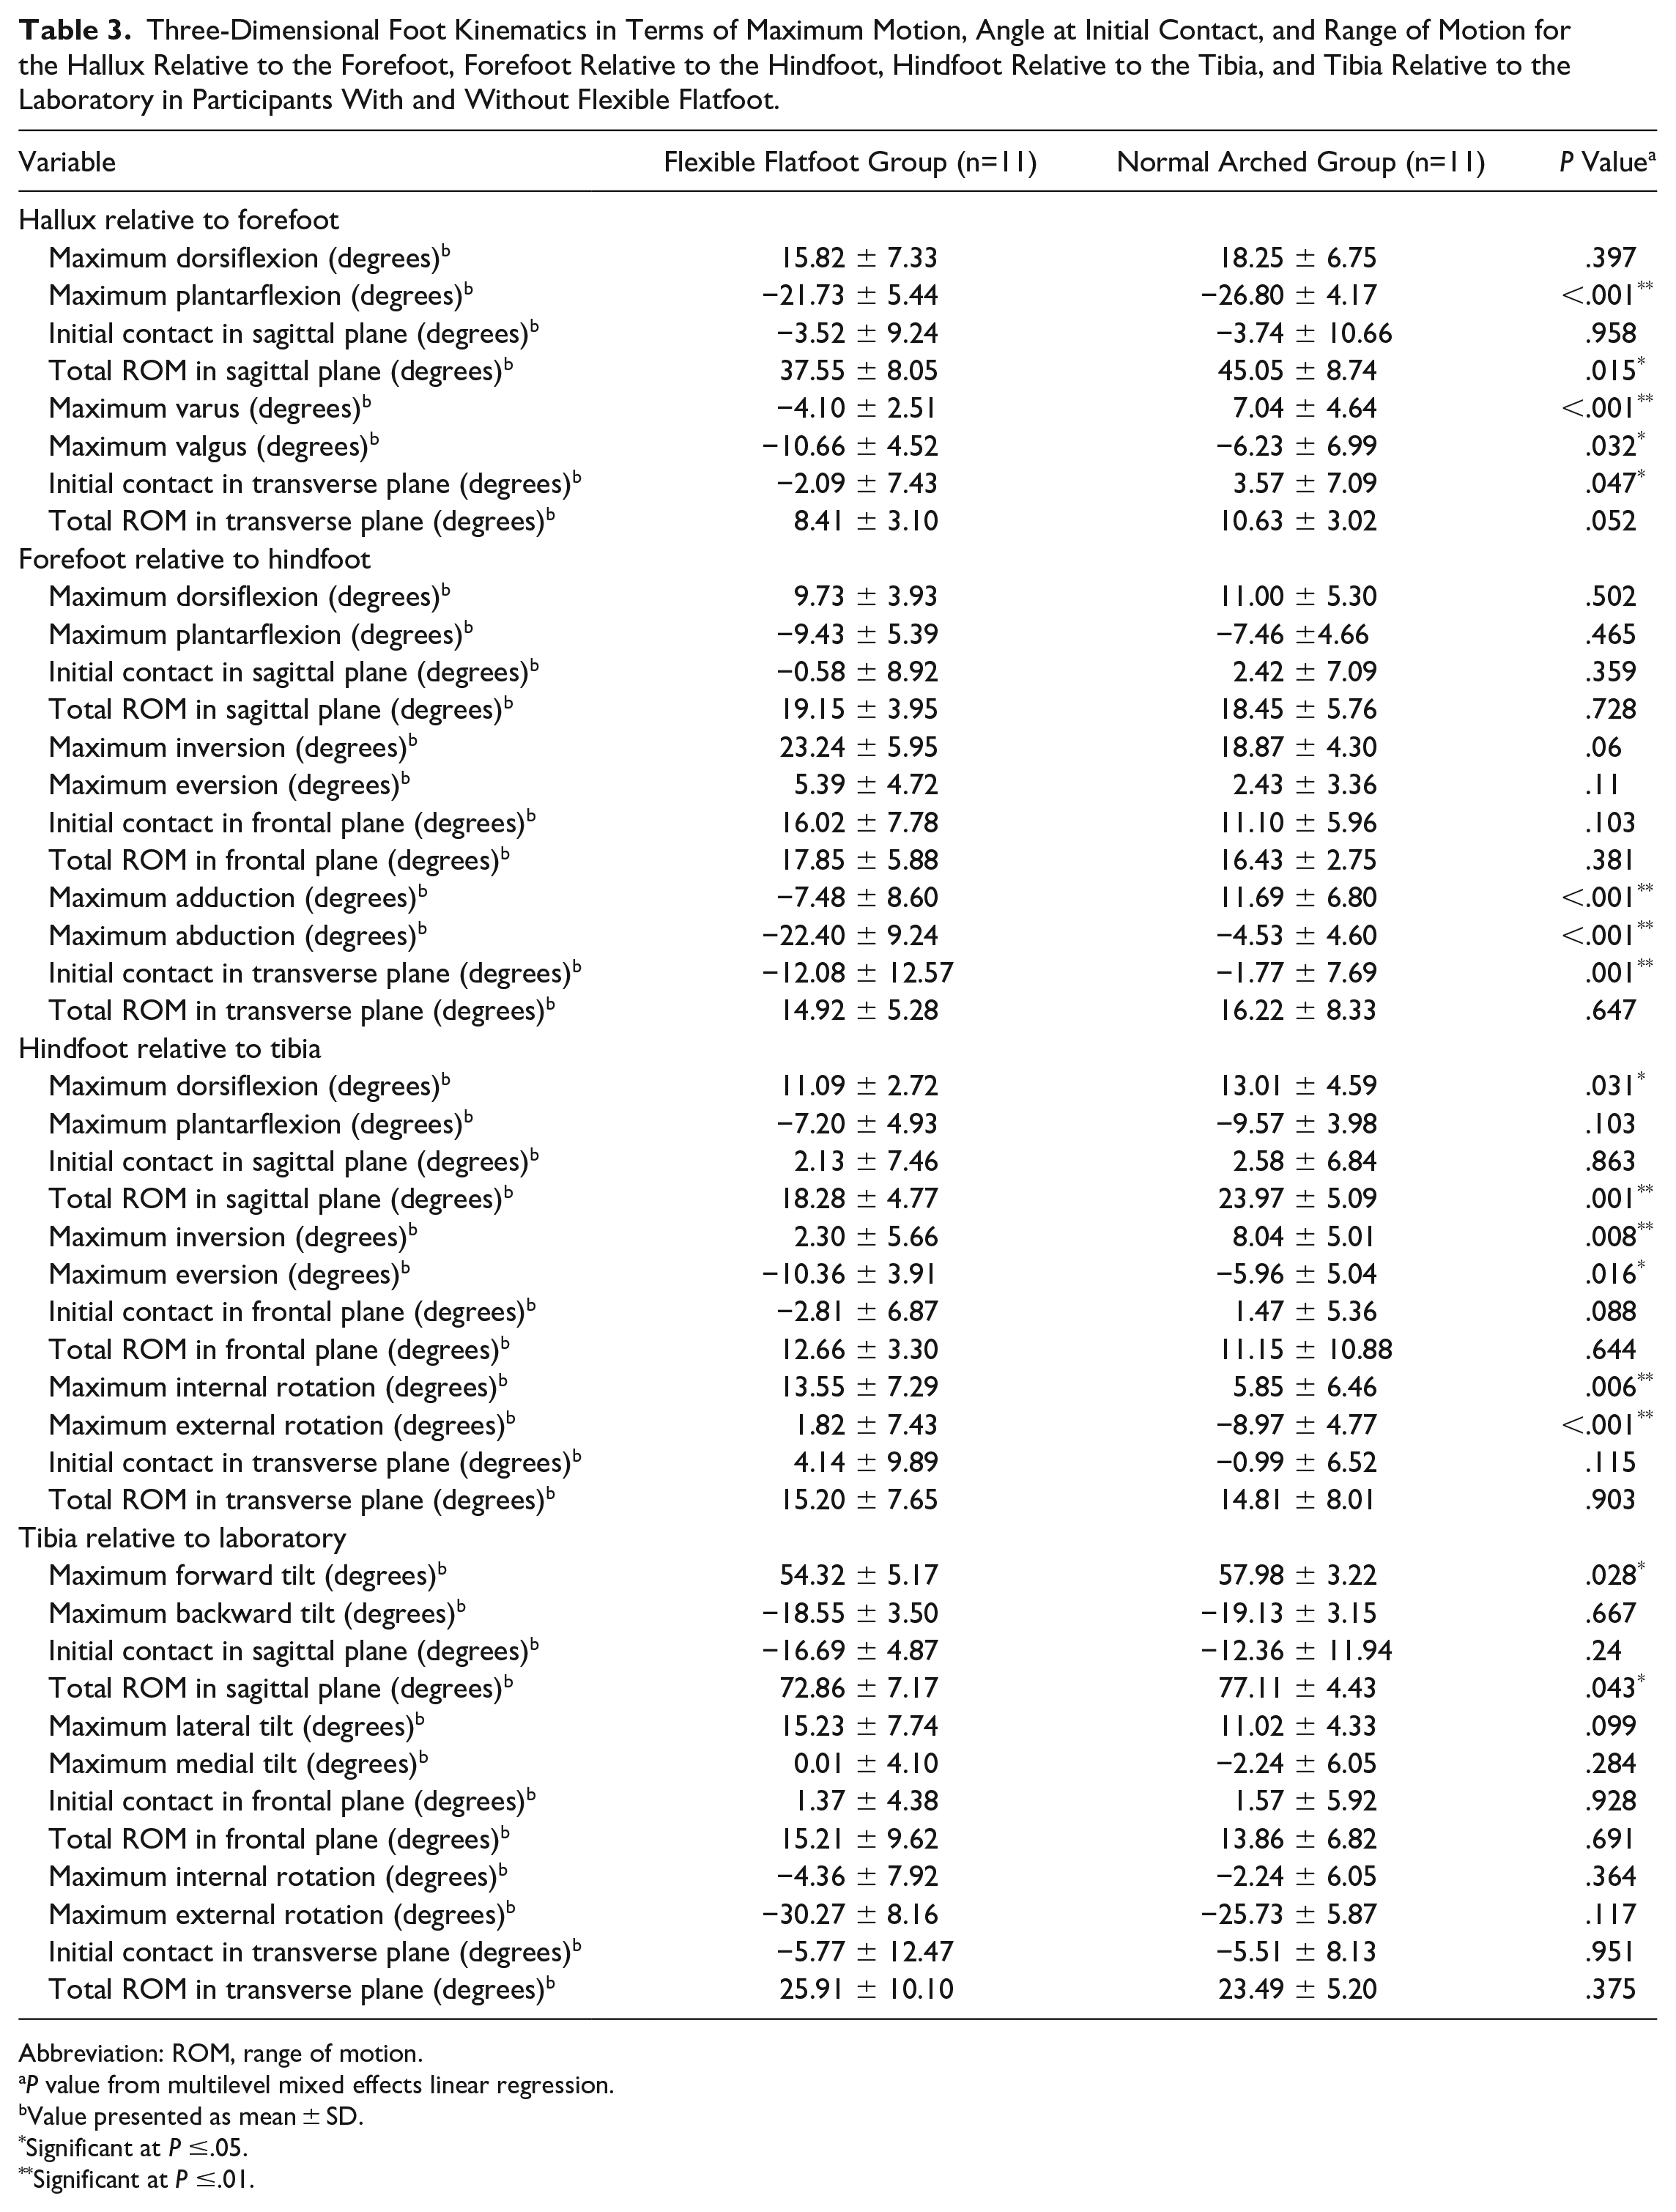
Abbreviation: ROM, range of motion.
P value from multilevel mixed effects linear regression.
Value presented as mean ± SD.
Significant at P ≤.05.
Significant at P ≤.01.
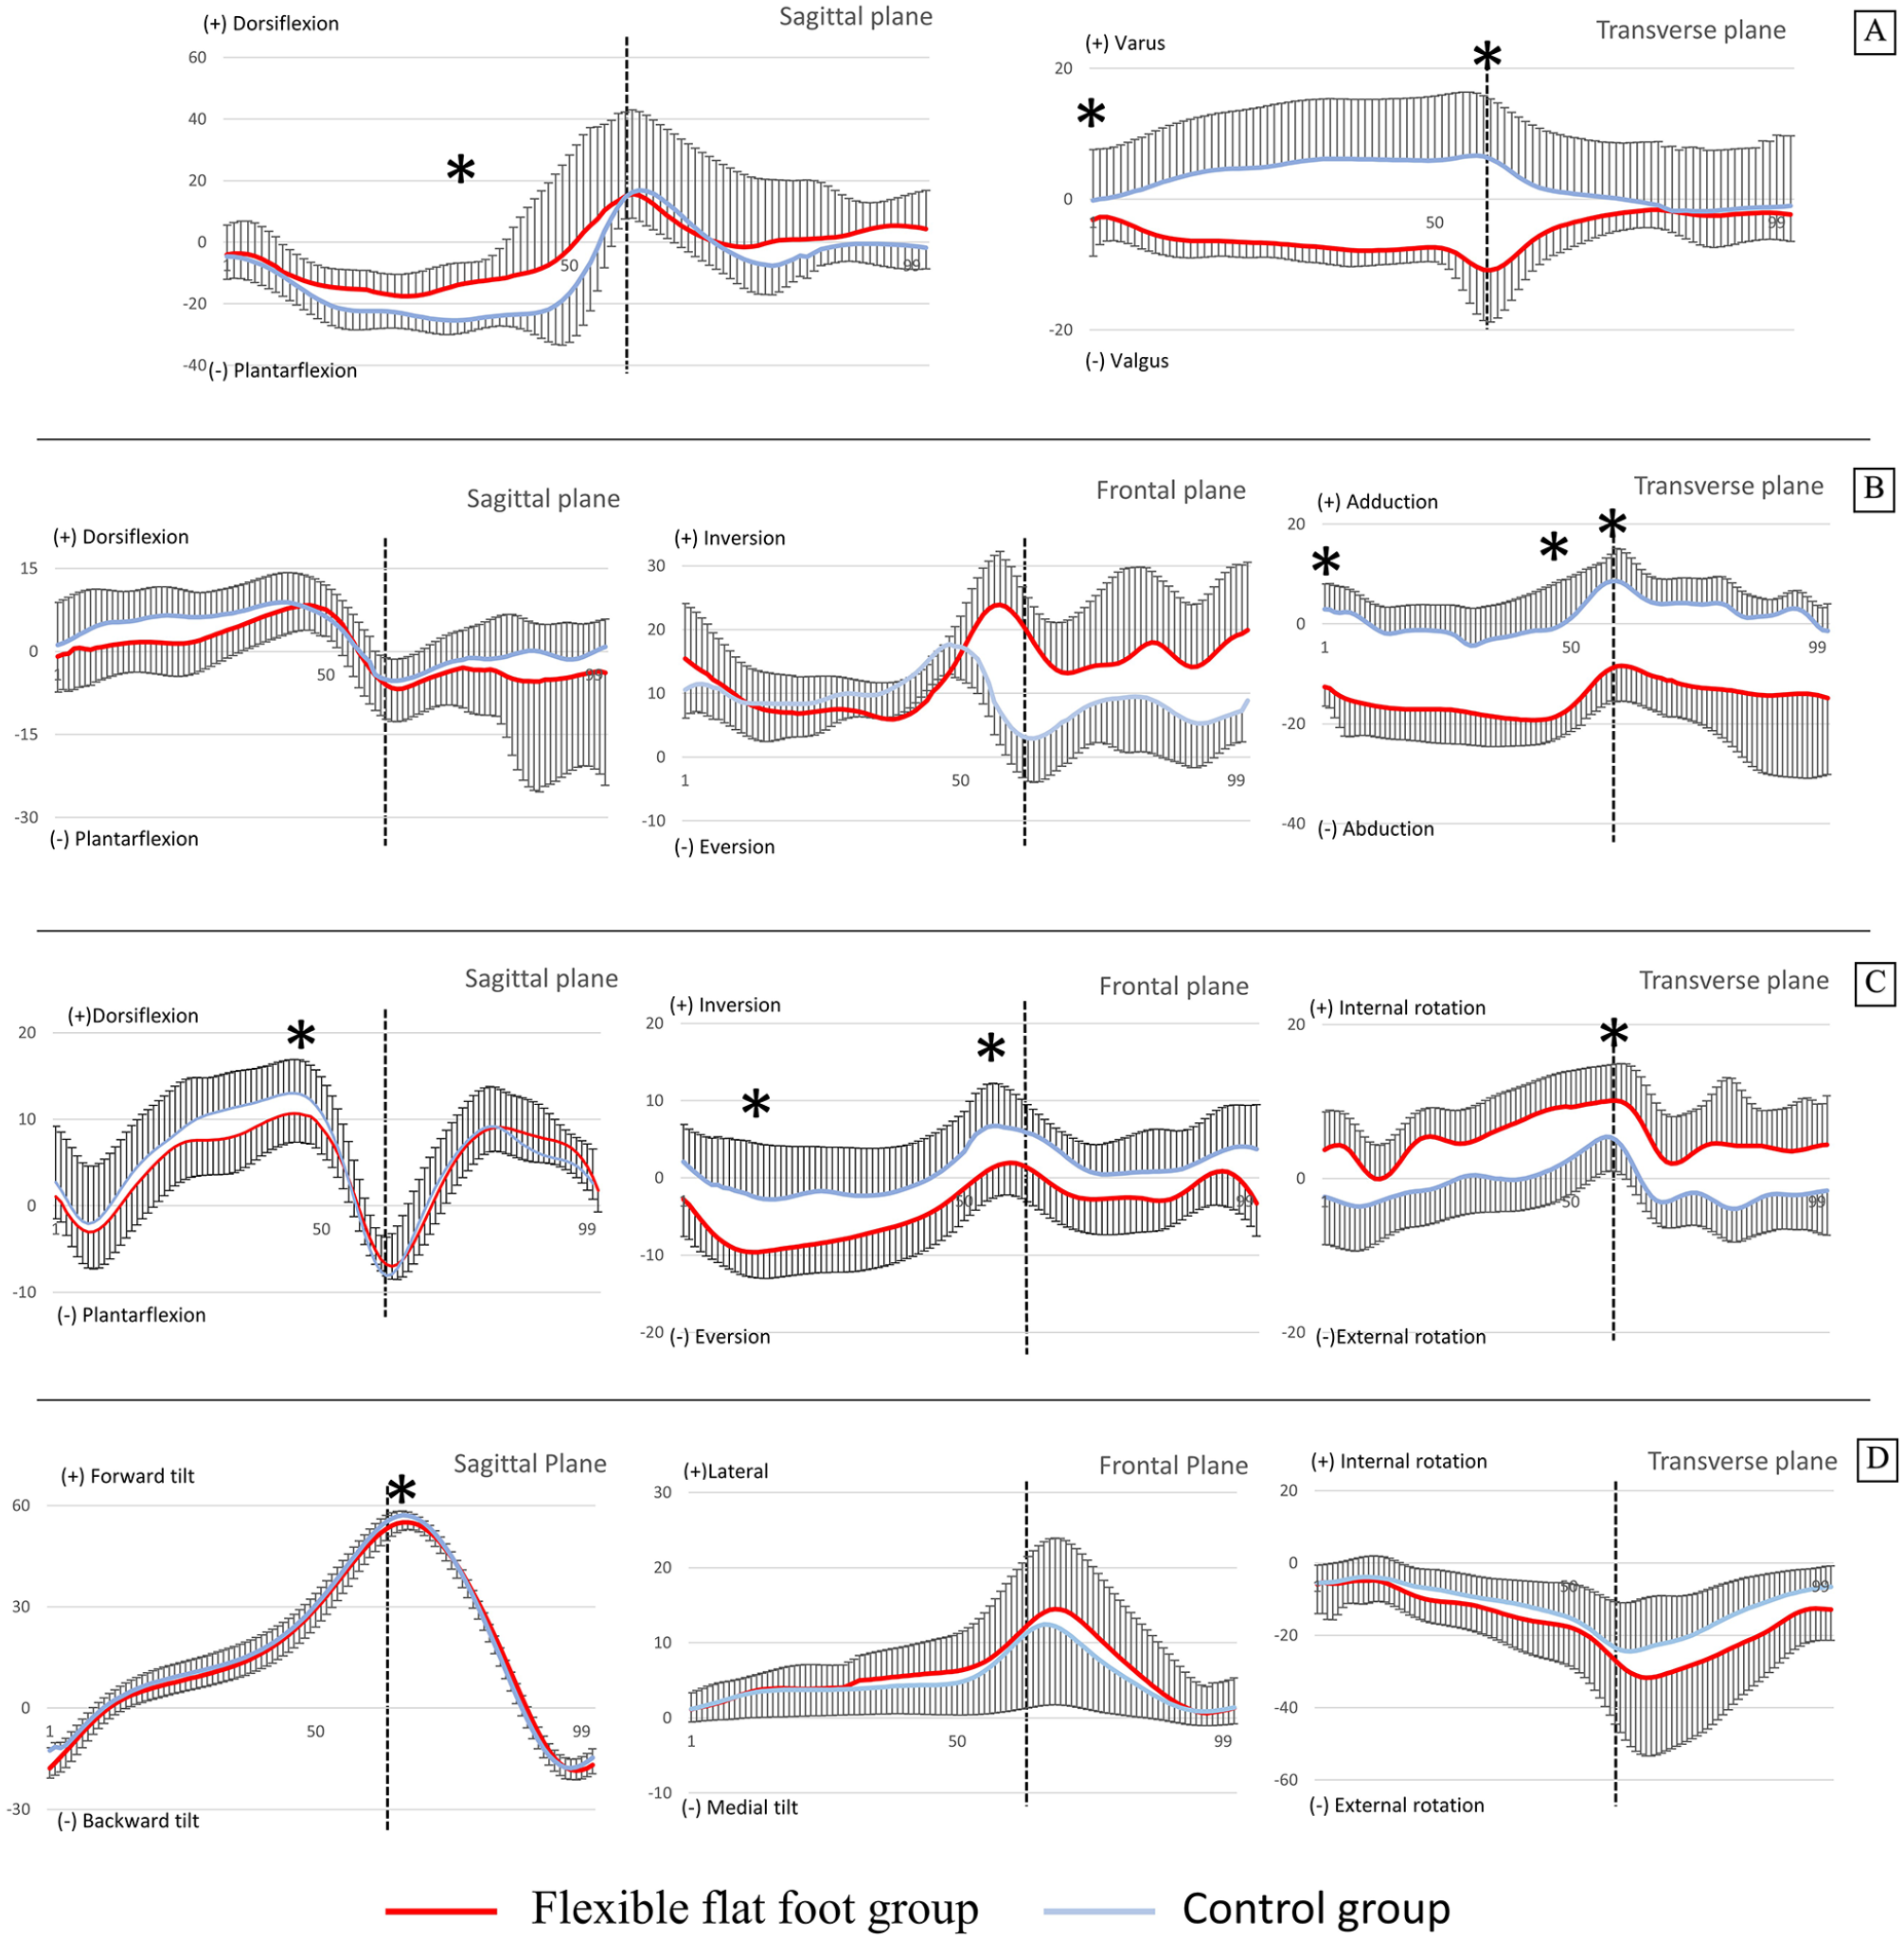
The line graphs illustrate an average of the intersegmental motion of the foot throughout the entire gait cycle. The y axis represents the degree of motion, whereas the x axis denotes the percentage of the gait cycle: (A) hallux relative to forefoot, (B) forefoot relative to hindfoot, (C) hindfoot relative to tibia, and (D) tibia relative to the laboratory. *Significant at P ≤.05. The SDs are shown in 1 direction. Vertical dashed line represents transition time from stance to swing phase (toe-off).
For hallux relative to forefoot, the hallux valgus angle consistently demonstrated a higher value within the flexible flatfoot group (vs control group) throughout the gait cycle. Moreover, significant differences were observed within the late stance phase, wherein the flexible flatfoot cohort exhibited higher valgus, lesser plantarflexion and varus motions, with statistical significance (P value = .032, <.001, and <.001, respectively) when compared to the control group (Figure 3A).
For forefoot relative to the hindfoot, forefoot abduction consistently demonstrated a higher value within the flexible flatfoot group (vs control group) throughout the gait cycle. The flexible flatfoot group exhibited significantly greater forefoot abduction during midstance and lesser forefoot adduction during late stance (P value ≤ 0.001) when compared to the control group (Figure 3B).
For hindfoot relative to tibia, the hindfoot internal rotation consistently demonstrated a higher value within the flexible flatfoot group (vs control group) throughout the gait cycle. The flexible flatfoot group exhibited significantly greater hindfoot eversion and internal rotation (P value = .016 and .006, respectively), and lesser hindfoot dorsiflexion, inversion, and external rotation (P value = .031, .008, and <.001, respectively) when compared to the control group (Figure 3C).
For tibia relative to the laboratory, no statistically significant differences between groups were detected across any kinematic parameters within this segment except maximum forward tilt (Figure 3D). We also identified correlations between significant measurements and the peak motion data from 3-dimensional foot kinematics, as shown in Table 4.
The Relationship Between Significant Measurements and Maximum Motion Data From 3-Dimensional Foot Kinematics.

Significant at P ≤.05.
Significant at P ≤.01.
Discussion
This study represents an investigation into the disparities of intersegment motion during barefoot gait between individuals with normal-arch and flexible flatfoot using a robust protocol, exclusively classifying flatfoot deformity according to stage II of the JSCS, through an assessment involving physical examinations and radiographic measurements. Consistent with our hypothesis, individuals exhibiting flexible flatfoot present kinematic deviations in intersegmental motion when compared to participants with a normal-arch foot. Noteworthy differences were observed within the sagittal and transverse planes of HLFF, as well as within the frontal and transverse planes of FFHF and HFTB kinematics, signifying statistically significant distinctions between groups. Our findings are consistent with the conclusions drawn from prior research examining how flatfoot conditions affect both gait and foot kinematics,7,8,15,17,20,29 though some of our findings are contrary to prior research. These discrepancies in findings may be due to variances among subjects, including variations in age groups and the severity of flatfoot conditions. Additionally, inconsistencies in the definition and classification of flatfoot, as well as variations in the methods employed for motion measurement, could also contribute to incongruities.3,9,17,29,34,37
The significant transverse plane motion of the FFHF displayed a homogeneous pattern when compared to prior studies employing the Oxford Foot Model and other multisegment foot models.9,17,24,29,31,33,34 In congruence with the conclusions drawn by prior study, 17 we observed a notable reduction in maximum forefoot adduction during toe-off among individuals in the flatfoot group. Considering that forefoot adduction plays a pivotal role in the foot’s supination process during push-off, this diminishment could influence the biomechanical functionality of the foot, impacting its supination mechanics during the propulsive phase of the gait cycle. Moreover, forefoot inversion is widely accepted as constituting an element of flatfoot deformity, yet previous research that has investigated the frontal plane of FFHF has yielded incongruous outcomes. Although certain investigations have reported altered forefoot inversion during the gait of individuals with flatfoot,7,20,29 other has documented no difference. 17 In our study, individuals with flatfoot demonstrated a trend toward increased maximum forefoot inversion (P value = .076). Given the expanded sample size, this observed value may have potentially attained the threshold of significant relevance.
Current designs for foot orthotics and braces predominantly concentrate on the correction of hindfoot alignment and medial longitudinal arch, 33 with limited consideration given to the more distal aspects of the foot, particularly the forefoot area. 21 Our findings potentially serve as data revealing innovative paradigms in orthotic and bracing design, emphasizing the prospect of addressing this specific forefoot segment during dynamic motion. These revelations beckon the possibility of pioneering orthotic and bracing solutions in the future, thereby refining therapeutic interventions for stage II flexible flatfoot condition.
Prior studies have also identified excessive hindfoot eversion as an important factor concerning deviations in lower extremity kinematics within participants presenting with flexible flatfoot.17,32 In the current study, our findings align with this premise as the cohort characterized by flexible flatfoot traits exhibited a notable inclination toward heightened hindfoot eversion and diminished hindfoot inversion in contrast to the control group. This observation is further supported by the considerable magnitude of the hindfoot eversion angle measured during static standing, corroborated by a statistically significant moderate correlation between the parameters (r = 0.654, P value < .001; Table 4). These outcomes are consistent with the investigations conducted by prior studies.8,11,17,20,37 Further, in our study, the flatfoot group exhibited an increased degree of internal rotation in the hindfoot during the late stance phase. Increased hindfoot internal rotation coupled with hindfoot eversion results in a flattening of the medial longitudinal arch. This phenomenon finds additional support in the measurement of the talonavicular coverage angle in our study, which differed between the flatfoot and normal groups (18.82 ± 11.29, 6.18 ± 4.42 respectively, P value = .002; Table 2), indicating a greater degree of internal rotation for both the calcaneus and talus. Consequently, the combination of heightened hindfoot eversion, concurrent hindfoot internal rotation, and forefoot abduction could increase the energy expenditure needed for the resupination and inversion processes during the propulsion phase of gait.
In theory, an increase in hindfoot internal rotation could correspond with a concurrent increase in internal tibial rotation, owing to the anatomical linkage between the tibia and the talus. This interconnected motion could potentially contribute to lower extremity issues, such as patellofemoral pain syndrome. 2 Nonetheless, in the present study, we did not observe any statistically significant disparities in the frontal and transverse planes of TBLB, which aligns with findings from previous research.20,28 These findings thus plausibly suggest that flexible flatfoot may not significantly influence the kinematic patterns of the previously mentioned joints during the gait cycle, as per our observations.
Furthermore, a finding in our study was the identification of a significant correlation between static deformity and dynamic assessments. It is noted that this significant correlation was not confined to a specific intersegment alone; for example, the rearfoot eversion angle, a parameter representing hindfoot deformity in the coronal plane, exhibited a correlation with dynamic parameters extending beyond the hindfoot segment. This observation suggests a complex interconnected linkage among all intersegments, indicating that static deformity influences dynamic deviations across the entire area.
Our study has several strengths. First, our approach to identifying flexible flatfoot was robust, encompassing comprehensive clinical observations alongside foot radiographic measurements. We particularly considered the functionality of the tibialis posterior tendon when classifying individuals within the flatfoot group. This method adheres to a protocol designed to specifically identify individuals within the stage II category of the JSCS.8,10 Second, we selected age- and gender-matched control groups for our study. The importance of age and gender matching in control groups had been previously postulated to address potential limitations related to false positives in unmatched control studies.14,16
Our study also has several limitations. We employed a skin-based method for sensor placement, which can introduce minor measurement errors due to skin movement. These errors may have contributed to larger SDs in certain parameters. However, our protocol aligns with the common practices applied in many prior kinematics studies that use a simplified marker placement to evaluate intersegmental foot motion.7,17,20,29 We opted for this approach to ensure comparability and facilitate an understanding of the results within the context of existing research. Second, although prior publications have suggested the accuracy and reliability of this model,18,31,36 differences of 2 to 3 degrees in position and motion should be interpreted cautiously because such discrepancies could be due to an inherent error of marker placement in the multisegmental foot model. 29 Third, the scope of our study is only confined to stage II JSCS. This may pose constraints on the generalizability of the findings. Further studies would benefit from expanding the investigations to encompass various types within JSCS. Finally, notably, controlled-speed barefoot walking may not fully represent the participants’ gait patterns during daily activities when participants are wearing shoes.
Conclusion
Symptomatic flexible flatfoot participants, classified as stage II according to the JSCS, demonstrated greater hallux valgus, increased forefoot abduction, heightened hindfoot eversion, and internal rotation when compared to age- and gender-matched control group. Additionally, a significant correlation was found between static foot deformity measurements and the extent of maximum deviation observed during dynamic kinematic assessments. These findings hold relevance for developing targeted therapeutic interventions to address flexible flatfoot.
Supplemental Material
sj-pdf-1-fao-10.1177_24730114241231245 – Supplemental material for Comparison of Foot Kinematics Between Normal Arch and Flexible Flatfoot Using the Oxford Foot Model: A Matched Case-Control Study
Supplemental material, sj-pdf-1-fao-10.1177_24730114241231245 for Comparison of Foot Kinematics Between Normal Arch and Flexible Flatfoot Using the Oxford Foot Model: A Matched Case-Control Study by Chaiyanun Vijittrakarnrung, Atipong Mongkolpichayaruk, Weerawat Limroongreungrat and Bavornrit Chuckpaiwong in Foot & Ankle Orthopaedics
Footnotes
Acknowledgements
The authors would like to thank College of Sports Science and Technology, Mahidol University, for all of the kindly help and permission to carry out the study.
Declaration of Conflicting Interests
The author(s) declared no potential conflicts of interest with respect to the research, authorship, and/or publication of this article. ICMJE forms for all authors are available online.
Funding
The author(s) received no financial support for the research, authorship, and/or publication of this article.
Ethical Approval
This study was approved by the Institutional Review Board: MU-CIRB 2021/037.2501. This work was performed at College of Sports Science and Technology, Mahidol University, Thailand. Each author certifies that his or her institution approved the protocol for this investigation and that all investigations were conducted in conformity with ethical principles of research.
References
Supplementary Material
Please find the following supplemental material available below.
For Open Access articles published under a Creative Commons License, all supplemental material carries the same license as the article it is associated with.
For non-Open Access articles published, all supplemental material carries a non-exclusive license, and permission requests for re-use of supplemental material or any part of supplemental material shall be sent directly to the copyright owner as specified in the copyright notice associated with the article.