
Abstract
Background:
Prosthetic socks are expected to decrease in thickness and have reduced volume accommodation with normal use. It is unknown, however, to what degree they reduce in thickness over time.
Objective:
The goal of this study was to determine a correlation between the age of a prosthetic sock (defined as the out-of-package time) and the resulting change in thickness under standardized weight-bearing and non-weight-bearing conditions.
Study design:
Experimental, mechanical assessment.
Methods:
Used prosthetic socks were donated by donors with transtibial amputation. Sock thickness was measured on a custom instrument under conditions representative of normal use. Stress-thickness response was compared to that of equivalent new socks to quantify the effects of use on sock performance.
Results:
Sock thickness changed non-linearly over time. On average, socks were 75% ± 17% of their initial thickness after 1 month, while socks older than 1 month were 72% ± 18% of their initial thickness. The elasticity of socks did not change with age.
Conclusion:
The volume accommodation provided by used socks cannot be reliably predicted by ply or age. Direct measurement of total sock thickness may provide meaningful insight to quantify prosthetic users’ socket fit and guide volume accommodation recommendations.
Clinical relevance
The mean difference in thickness between 3-ply and 5-ply used socks was equal to the standard deviation of each ply group (0.3mm). Therefore, it is possible that a 3-ply sock worn for as a little as 1 month could have a greater thickness than a 5-ply sock worn for a month.
Background
Changes in residual limb volume detrimentally affect socket fit and may consequently cause discomfort, gait instability, and skin problems for persons with trans-tibial amputation. 1 The addition and removal of prosthetic socks over the course of a day is the most common method for accommodating limb volume fluctuations. Knowledge of sock thickness and use is needed to provide evidence-based recommendations to prosthetists who manage patients with lower limb loss.
Prior research testing new prosthetic socks has shown that ply is not a direct indicator of thickness. 2 Therefore, measuring or describing sock thickness in units of distance (e.g. 1.8 mm) may be preferable to using units of ply (e.g. 5-ply). A subsequent study 3 showed that the total thickness of socks stacked together was equivalent to the sum of the individual sock thicknesses (i.e. the stack thickness of sock A and sock B was simply the thickness of sock A plus the thickness of sock B). These studies provided important results for guiding volume management practices, but only included new socks. Since people with limb loss typically use socks for months and the mechanical properties of textiles change with use, 4 a next objective was to determine how used sock thickness changed over time.
The purpose of this study was to measure the thicknesses of new and used prosthetic socks so that we could investigate from a clinical perspective what changes could be inferred using only information that may be available at the time of a routine office visit (e.g. manufacturer, model, ply, and age of the sock). In this study, two specific questions were posed: (1) can a sock’s thickness be predicted by its age and (2) how does a sock’s resistance to compression change with use? To address these questions, age was defined as the time accrued since the sock was removed from the factory package. Resistance to compression was defined as the absolute change in thickness between unloaded and stance-phase loading conditions. Knowledge of how sock properties change with use can inform clinical activities such as instructing patients in use of prosthetic socks, determining when to replace socks, and troubleshooting volume management issues.
Methods
Testing apparatus
A custom designed instrument (Figure 1) was used to measure sock thickness. Compressive pressures were applied by a 20-mm circular pressure plate loaded with custom weights. Loads were applied through a pillow block bearing (8649T3; McMaster-Carr, Elmhurst, IL, USA) to ensure a pure compressive pressure. Sock thickness was measured by an inductive position sensor (IPS) (BAWM12MF2-UAC40F-BP00-2-GS04; Balluff, Florence, KY, USA) with a resolution of 0.01 mm and measurement range of 0.4–3.4 mm. To prevent the sensor from bottoming out (i.e. at compressed thicknesses less than 0.4 mm), four 0.1-mm acetate sheets were placed under a sock if its initial thickness was less than 1.5 mm. Details regarding the testing apparatus have been previously published.2,3
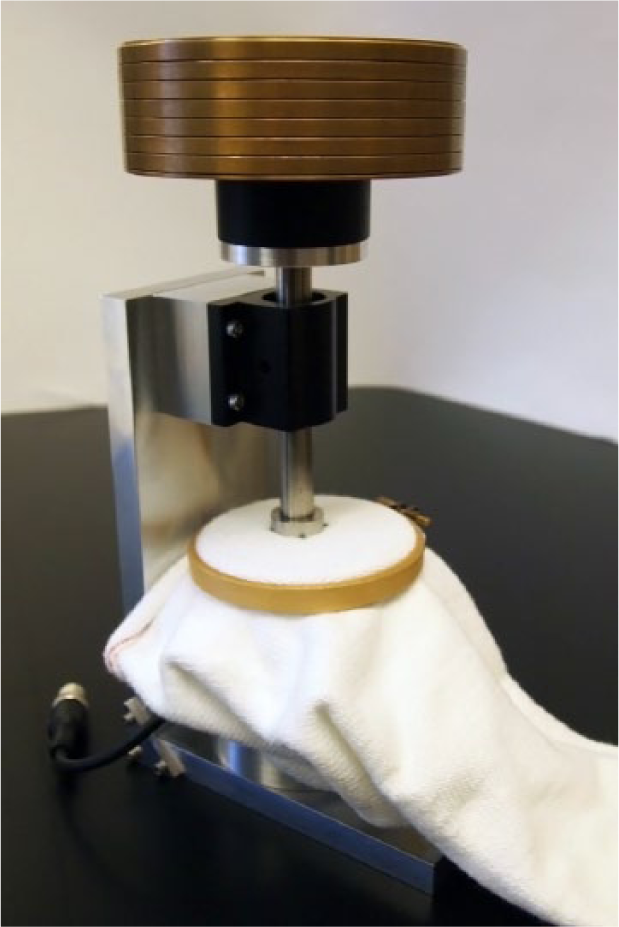
Test system.
Testing procedure
Specimens for this study included new and used socks from Knit-Rite (Kansas City, KS, USA) and Royal Knit (Lee’s Summit, MO, USA). Data for new Knit-Rite socks were obtained in a previous study 2 and included thicknesses from seven different sock material models and six different sock ply (Table 1). Royal Knit socks included three different sock material models and five different sock ply (Table 2). Thickness data for new Royal Knit socks were acquired in this study using the same instrument and test procedure as the Knit-Rite socks tested previously. 2
New Knit-Rite socks tested.
New Royal Knit socks tested.
Used socks were donated from volunteer prosthesis users. Donors were recruited from local prosthetic clinics, hospitals, and support groups using study flyers. Selection criteria included any prosthetic sock that was used by a donor for the purpose of providing a comfortable socket fit or accommodating changes in residual limb volume. Socks were excluded if they had never been worn or had not been worn within the previous week. Donors were requested to provide the sock manufacturer, model, ply, and date of first use (i.e. age of the sock) for each donated sock. Typically, manufacturer, model, and ply could be verified by a tag or label, while the date of first use was dependent on the donor’s memory.
Socks were stretched so that they could be tested under conditions that reflected their state inside the user’s prosthetic socket. To prepare the socks for testing, subjects were asked to doff their prosthesis, but to leave all socks donned. A washable marker was used to ink four dots onto each sock in a 12.7-mm square pattern using a standardized template. Dots were applied to socks on the anterior lateral region of the residual limb about 6 cm distal to the mid patellar tendon. If multiple socks were worn by the donor, the outer sock was doffed after being marked, and the next sock was then marked while it was in a donned state. Once all socks were doffed, a digital caliper (CD-8″ CSX; Mitutoyo, Kawasaki, Kanagawa, Japan) was used to measure the unstretched distance between the dots. Both radial and axial strains were calculated using donned and doffed lengths of the four edges of the square pattern. The donned, in-plane biaxial strain was calculated with equation (1) as the mean of all four strains and defined as the conditioned sock strain:
Socks were then placed into a wooden embroidery hoop (CNEH; Norden Crafts, Schaumburg, IL, USA) and stretched to replicate the donned condition (i.e. the dots were stretched to form a 12.7-mm square). If a subject was wearing multiple socks, then each sock was tested separately. The embroidery hoop and sock were then installed into the instrument with the inked square centered directly below the pressure plate. The initial thickness of the sock was measured by an electronic height gauge (570–212; Mitutoyo) prior to dynamic testing.
Stretched socks were preconditioned to simulate an initial wear period so that the test would evaluate the steady-state compression response. Socks were preconditioned by adding and removing a 1.6-kg weight stack (54.3 kPa) at 5 s intervals for a total of three cycles. After the socks were preconditioned, the study thickness test was performed as an incremental (quasi-static) load cycle; one 200.7 g (6.3 kPa) and seven 405.4 g (12.7 kPa) brass weights were sequentially added at 8 s intervals. Weights were then sequentially removed to complete the test cycle.
Data processing and analysis
The initial thickness of the sock was taken as the output of the electronic height gauge. The change in thickness was measured by the IPS. The technical data sheet for the IPS suggests a linear relationship between voltage and distance for the range of 1–4 mm. However, we found non-linear regions at both minimum and maximum ends of the range. Additionally, the maximum measurable output was limited to 3.4 mm. Therefore, a custom calibration curve was used to convert the IPS output voltage into distance. The calibration curve combined the absolute thickness measured by the electronic height gauge with the voltage output from the IPS for 205 sock samples distributed across the IPS’s operating range. Data fit with a sixth-order polynomial relating voltage to distance had a mean error of <0.01 mm with a standard deviation of 0.04 mm (Figure 2).
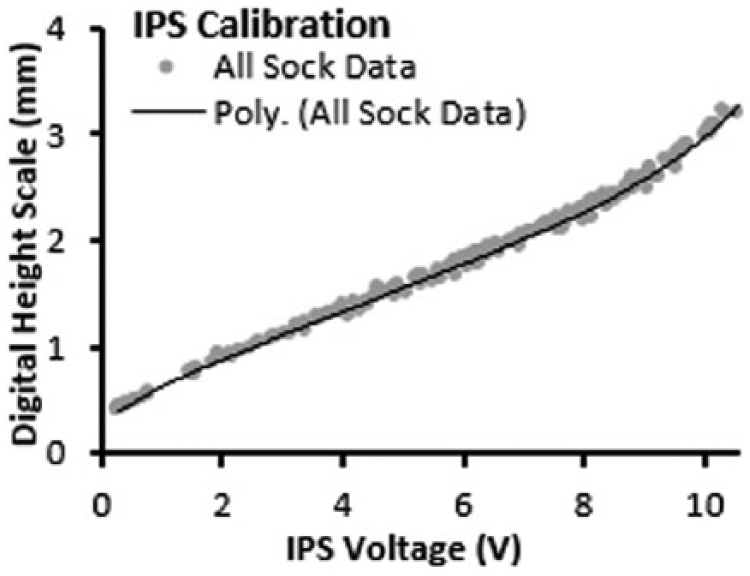
Voltage profile for the IPS was non-linear, particularly near the minimum and maximum ends of the measurable range.
Once measured, voltage was converted to thickness and test data were imported into MATLAB (R2012b; Mathworks, Natick, MA, USA). Each sock test was validated before analysis: a sock was considered preconditioned and the test valid if the change in thickness after the third preconditioning cycle was less than the repeatability error of the instrument (0.04 mm). If the test was considered valid, then the thickness at each load level was the mean load 4 s after load application (i.e. the incremental addition or subtraction of a weight). If the difference between the third and fourth preconditioning cycles was greater than the repeatability error of the instrument, then the sample was considered unconditioned and was then retested.
Of the nine applied compressive pressures, values of 6.3 and 101.6 kPa were selected for single-point analysis. These pressures were selected to be representative of donned and stance phase conditions, respectively. They were selected based on interface stress investigations on subjects with trans-tibial limb loss reported in the literature.5–7
Change in sock thickness was defined as the used sock’s thickness expressed as a percentage of its new thickness. To perform this calculation, used socks were paired with their corresponding new sock of matching manufacturer, model, and ply. New sock data were sourced from our prior study 2 . A direct comparison of used and new socks in the current study would have required that we purchase new socks for each donor and require that donors return to the laboratory to don the new sock so as to establish the appropriate donned (stretched) test condition. Given the increased burden, such an approach was deemed to be beyond the scope of this study. Also, because new socks from our prior study were tested at 0% and 60% biaxial strain (loose and stretched, respectively) and used socks in this study were tested at a biaxial strain that replicated donned conditions of the individual donor, new and used thicknesses could not be directly compared. Therefore, new sock thickness at individual stresses was estimated by linear interpolation between the loose and stretched biaxial strain conditions.
Results
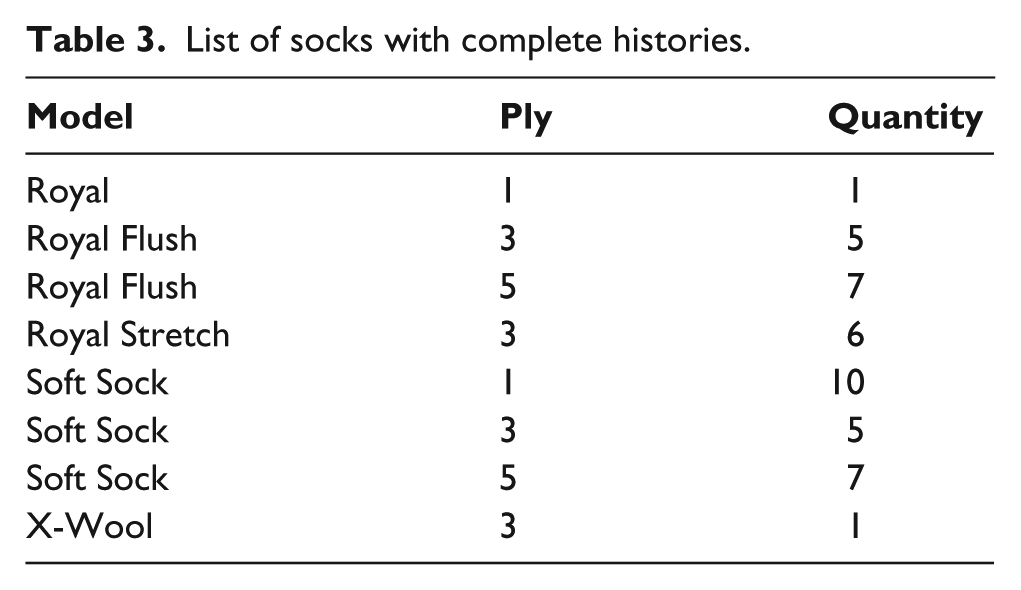
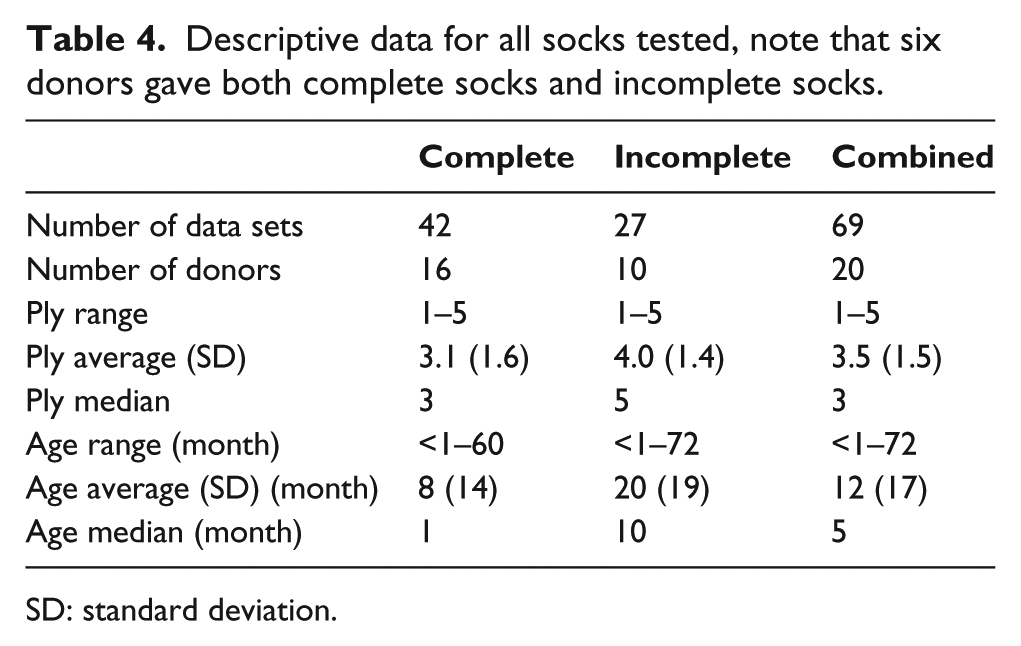
In total, 20 donors provided a total of 69 used socks for testing. A complete history (i.e. manufacturer, model, ply, and age) was only available for 42 socks (Table 3). Overall, socks ranged from 1- to 5-ply and <1–72 months in age. Of the socks with complete histories, 36 were woven with a Lycra® Spandex (Invista, Witchita, KS, USA) component and termed ‘thin socks,’ and 6 were not and termed ‘thick socks’. The 42 socks with complete histories had a mean of 3.1 ± 1.6 ply with a mean age of 8 months (Table 4).
List of socks with complete histories.
Descriptive data for all socks tested, note that six donors gave both complete socks and incomplete socks.
SD: standard deviation.
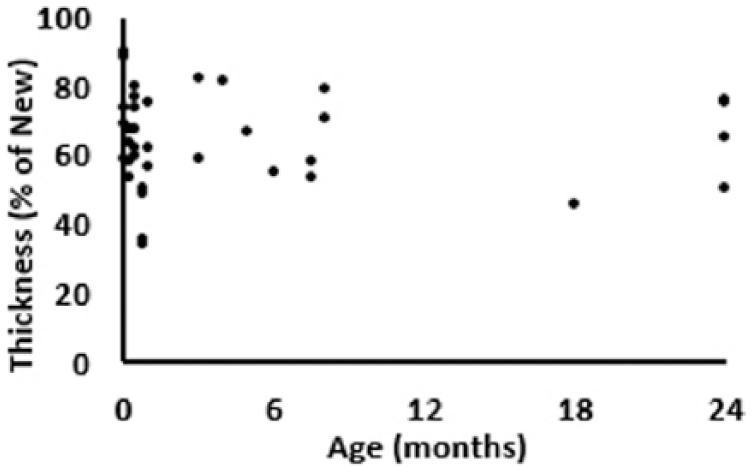
Used sock thickness as a percentage of new sock thickness did not well correlate with age (Figure 3). Of the socks with complete histories, socks less than 1 month old (n = 19) were 75% ± 17% of their equivalent new thickness, while socks older than 1 month old (n = 23) were 72% ± 18% of their equivalent new thickness. Of the socks that were less than 1 month old, three were greater than 90% of equivalent new thickness and four were less than half of equivalent new sock thickness.
Change in used sock thickness as a percentage of equivalent new sock thickness for used socks in a donned loading condition.
Used sock thickness was not a multiple of ply (Figure 4). For example, a 3-ply sock was not 3 times thicker than a 1-ply sock. The mean thickness in a donned state was 0.8 ± 0.3 mm for 1-ply socks, 1.2 ± 0.3 mm for 3-ply socks, and 1.5 ± 0.3 mm for 5-ply socks. Similarly, the mean thickness under stance-phase walking conditions was 0.5 ± 0.2 mm for 1-ply socks, 0.9 ± 0.3 mm for 3-ply socks, and 1.2 ± 0.3 mm for 5-ply socks. The mean age of used 1-ply socks was 8 months, while used 3-ply socks averaged 10 months old, and used 5-ply socks averaged 15 months old.
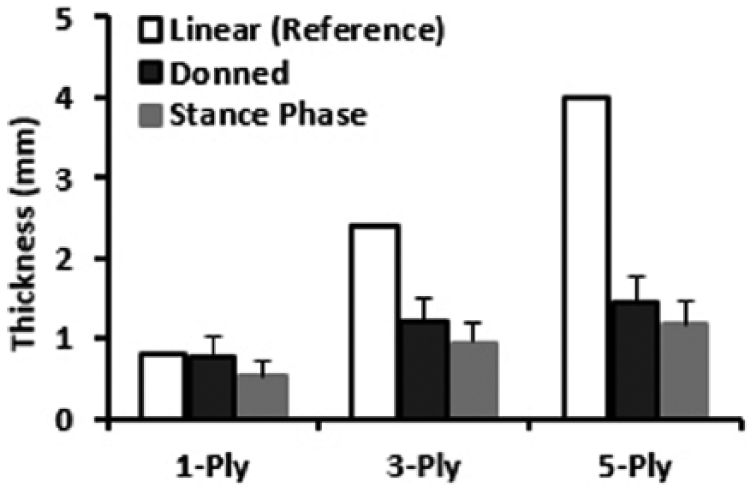
Average used sock thickness for different plies, “Linear (Reference)” illustrates a true linear trend (e.g. if a 3-ply sock was three times the thickness of a 1-ply sock).
The mean total in-plane biaxial strain was 20%± 14% for used 1-ply socks, 15% ± 9% for used 3-ply socks, and 15% ± 15% for used 5-ply socks. Surprisingly, there was no difference in the donned biaxial strain between Lycra Spandex containing (i.e. “thin”) and not Lycra Spandex containing (i.e. “thick”) socks. Across all used socks, the mean axial strain was 15% ± 15%, while the mean radial strain was 19% ± 9%.
The stress-thickness response, or the percent thickness compressed between unloaded and loaded conditions at each tested pressure, decreased as sock ply increased (Figure 5). When compressed to stance-phase walking pressures (101.6 kPa), 1-ply socks were 67% ± 5% of donned thickness. Similarly, 3-ply socks were 78% ± 7% and 5-ply socks were 80% ± 6% of donned thickness. While sock initial thickness decreased with age, the stress-thickness response remained consistent between used and new donned equivalent (Figure 6). Across all loading conditions (donned and stance-phase walking), used sock stress-thickness points had a mean difference of +0.5% ± 4.6% when compared to new donned equivalent sock thickness.
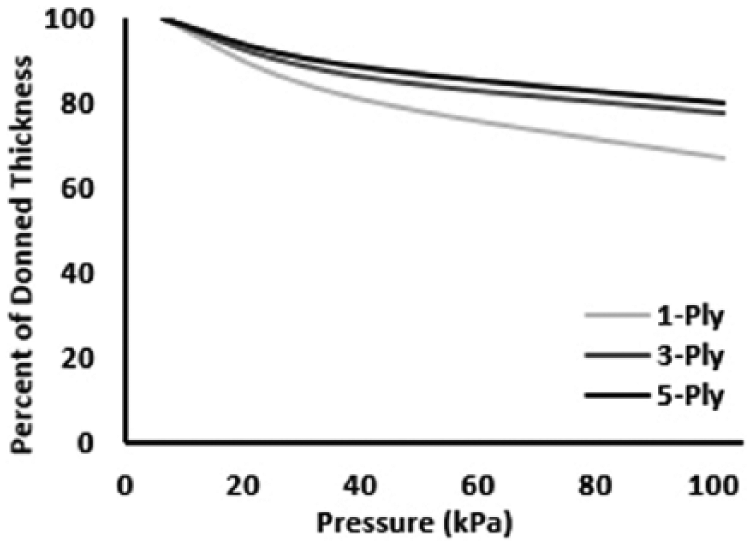
Stress-thickness response decreased as sock ply increased. The ply-specific sock groupings are the same as those used in Figure 4.
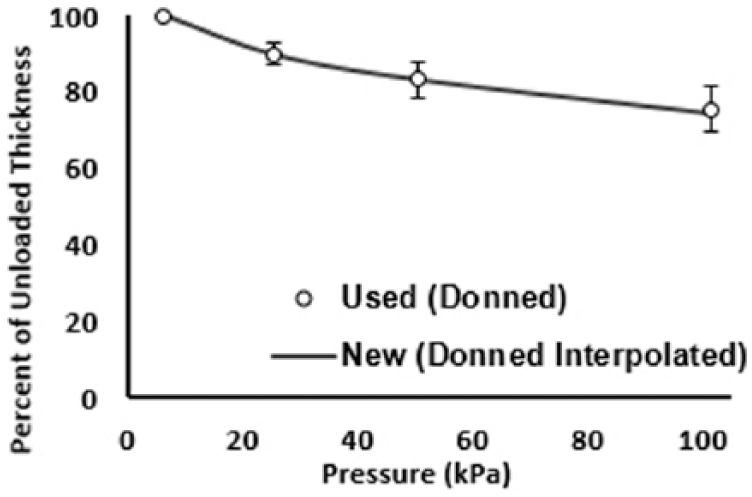
Stress-thickness response for used socks was equal to that of new socks, as long as the in-plane biaxial strain was compensated using linear interpolation.
Discussion
Socks, like many textiles, are anticipated to decrease in thickness with age and use. Reduced thickness changes a sock’s ability to accommodate shape differences between a residual limb and a prosthetic socket. Furthermore, as prosthetic users often don multiple socks, 8 assessment of socket fit may be challenging if each sock changes with age. Our current research measured the thicknesses of used socks provided by amputee donors and sought to answer two questions. First, can the change in thickness of a sock be predicted by its age? Second, does a sock’s resistance to compression change with normal use?
Can a sock’s thickness be predicted by its age?
Results showed that socks experienced a non-linear decrease in thickness with normal use that, contrary to our hypothesis, did not correlate well with age. Sources of variability in the collected data (e.g. reported sock age, fiber wetting, and peak socket pressures) may have influenced this finding. Below, we review several potential limitations that may have affected the study and evaluate their potential impact on the results obtained.
One potential source of uncertainty in the data was reported age of each sock specimen. As might be expected, precision of the reported age decreased as the age of the socks increased. However, the wide variation in thicknesses measured in socks less than 1 month old (i.e. those socks most likely to be accurately reported) indicates that imprecision in reported age of socks was probably not significant enough to change the primary results of the study. Second, used socks measured in this study may have been exposed to two potential sources of moisture: water and sweat. However, few subjects reported washing their socks over the duration of the study. Furthermore, most donors (i.e. 19 of 20) wore their socks outside of the prosthetic liner. The liner presumably acted as a sweat barrier between the limb and the sock and mitigated the need for socks to be washed. Finally, socks that experienced higher peak stresses during normal use would be expected to decrease in thickness more rapidly that those with lower peak stresses. Literature reported values for the range of measured peak socket stresses in the region of the socks tested (i.e. anterior proximal) are 30–200 kPa.5–7 With these considerations in mind, the observed result that age alone cannot be used to predict sock thickness appears to be valid.
In light of the above findings, an alternative hypothesis may be that changes in sock thickness are correlated to the total number of load cycles (e.g. step count) rather than to age. A random group of donors, like those who provided specimens for this study, is anticipated to vary in activity level and sock use. 9 However, it was beyond the scope of this experiment to monitor individual users’ activity. The results of this study could be used to inform a prospective study that evaluated a single sock model that is known to be commonly in use and evaluate the relationship between step count and change in sock thickness.
How does a sock’s resistance to compression change with use?
Results showed that resistance to compression decreased as socks aged (Figure 7). These data suggest that socks would likely feel harder from a patient’s perspective. Furthermore, the ratio of used-to-new donned thickness was approximately the same as the ratio of used-to-new resistance to compression (Figure 8). For example, consider a new sock that is 1.0-mm thick in a donned state and compresses 0.4 mm when loaded to stance-phase walking pressure. When normal use has fatigued the sock to half of its new thickness (0.5 mm), the same sock would then proportionally compress half as much (0.2 mm) under the same pressure. The similar ratios of used-to-new thickness and used-to-new resistance to compression were presumably because the sock’s stress-thickness curve remained constant. Thus, as socks aged, they offered less cushion (resistance to compression) while they retained a consistent material response.
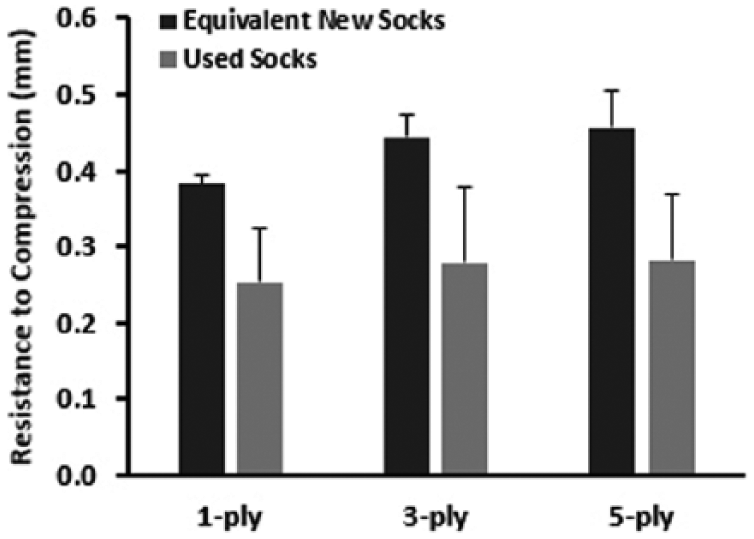
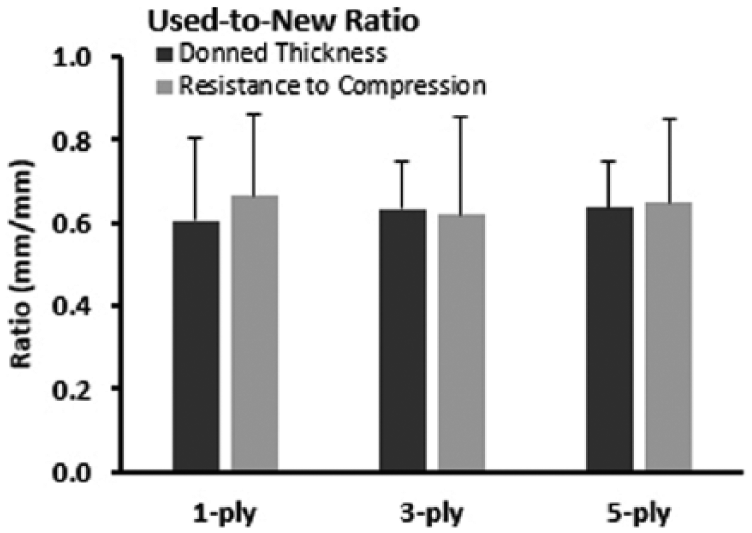
Ratio of used-to-new donned thickness was about the same as the ratio of used-to-new resistance to compression.
Two relationships observed in this study on used socks were consistent with results seen in previous research on new socks. 2 The most notable point of agreement was that sock thickness (new or used) was not a multiple of ply. On average, a 3-ply sock was only 1.8 times thicker than a 1-ply sock, and a 5-ply sock was only 1.3 times thicker than a 3-ply sock. Another result that matched previous findings was that the relationship between percentage change in thickness and pressure was dependent on ply. At stance-phase walking pressures in a donned replicated biaxial strain, 1-ply socks compressed 11% more than 3-ply socks and 13% more than 5-ply socks. In a previous study, 2 1-ply sock compressed 6% more than 3-ply socks and 7% more than 5-ply socks at stance-phase walking pressures at a loose (0%) biaxial strain.
Unlike results found in previous studies on new socks, 2 there was no relationship between the thicknesses of used socks made with Lycra Spandex and those not made with it. In previous research, new socks made with Lycra Spandex were on average 43% thinner than socks made without it. In this research, the mean thickness of a used 3-ply sock without Lycra Spandex (i.e. “thick”) was 0.9 ± 0.1 mm, while the mean thickness of a used 3-ply sock with Lycra Spandex (i.e. “thin”) was 1.0 ± 0.3 mm. Additionally, this difference was not explained by age; the mean age of a used 3-ply sock without Lycra Spandex in this study was 2 months, while the mean age of a sock with Lycra Spandex was 11 months. Further analysis between socks with and without Lycra Spandex was not possible in this study because of a lack of 1-ply and 5-ply not Lycra Spandex containing sock samples.
Clinical relevance
Results from this and prior research show that it may be difficult to accurately assess socket fit based on sock ply alone. The mean difference in both donned and stance-phase thickness between 3-ply and 5-ply used socks was equal to the standard deviation of each ply group (0.3mm).This means it is possible that a 3-ply sock worn for as a little as 1 month could have a greater thickness than a 5-ply sock worn for a month. An instrument that could easily take a single thickness measurement would carry meaningful insight for day-to-day clinical practice. Such an instrument would provide clinicians a quantitative method for evaluating current socket fit.
Conclusion
This study provides several insights to inform clinical practice. First, socks changed thickness in a way that was not well predicted by age. Therefore, it may be difficult to estimate the amount of volume accommodation a sock provides for an individual prosthetic user knowing only sock information that is readily available to a practitioner (ply, material, age). Second, as socks aged, their stress-thickness response remained consistent. The net effect was that socks only became harder from a user’s perspective (resistance to compression), and not from a material perspective (stress-thickness). A potential direction of future research would be to evaluate the change in sock thickness while tracking amputee activity to determine whether measured changes in sock thickness and resistance to compression are related to load cycles.
Footnotes
Author contribution
John C Cagle—study design, data analysis and interpretation, and manuscript preparation; Krittika J D’Silva—data collection, processing, analysis, and interpretation; Brian J Hafner—study design, data interpretation, and manuscript preparation and editing; Daniel S Harrison—data collection; Joan E Sanders—study design, data analysis and interpretation, and manuscript editing.
Declaration of conflicting interests
The authors declare no conflict of interest.
Funding
This study was funded by the National Institute of Child Health and Human Development (grant no. R01HD069387).