
Abstract
Background:
It is clinically known that shape is important when selecting or designing a wheelchair support surface for the prevention of pressure ulcers (a £2 billion annual cost to the National Health Service, UK); however, the effect of different levels of shape contouring has not been adequately studied.
Objectives:
To investigate the effect of seat shape on the risk of pressure ulcers using discomfort and interface pressure measurements.
Study design:
Randomised, repeated trial.
Methods:
Thirty able-bodied participants sat with restricted movement for 30 min in three sessions to evaluate two cushion shapes against a flat baseline surface. Visual Analog Scaling and pressure mapping were used to measure surrogates for pressure ulcer risk, discomfort and interface pressures, respectively.
Results:
Linear regression revealed a reduction in discomfort (p < 0.05) on the custom contoured shapes. Interface pressures measured were also lower (p < 0.05) on the custom contoured shapes, and a negative Pearson’s correlation (p < 0.05) indicated an association between smaller hip widths and increased discomfort for the commercially shaped cushion.
Conclusions:
The results of this study confirm that custom contoured shapes were effective at reducing pressure ulcer surrogate measures in the participants of this study and therefore suggests that the contribution of a cushion’s three-dimensional contours on pressure ulcer risk should be further researched.
Clinical relevance
The measurement of seat shape, discomfort and interface pressure in surrogate participants can help inform the design of wheelchair seating for individuals who are insensate or otherwise at risk of developing pressure ulcers. This knowledge can now be implemented using modern three-dimensional shape acquisition, analysis and fabrication technologies.
Background
The design and manufacture of customised wheelchair seating have historically employed labour-intensive, hand-sculpted techniques, which have received limited scientific evaluation. The ability to understand and quantify cushion shapes is improving due to more affordable and advanced technologies. Three-dimensional (3D) scanners can now capture a patient’s 3D shape within minutes, and a cushion can be fabricated using computer-aided manufacturing (CAM) processes within an hour. Quantitative 3D comparison software can also provide detailed shape analysis, which in combination with improved manufacturing techniques allows new research avenues to be explored.
A pressure ulcer (PU) is defined as a ‘localised injury to the skin and/or underlying tissue, usually over a bony prominence, as a result of pressure, or pressure in combination with shear and/or friction’. 1 PUs can be a significant problem for individuals who use a wheelchair, and they can impact greatly on their quality of life. Treating PUs is very costly to health-care organisations, estimated to cost the National Health Service (NHS), UK, between £1.4 and £2.1 billion a year. 2
Although it is clinically known that the shape is important when selecting or designing a support surface for PU prevention, the effect of support surface shape has not been adequately studied. There is a vast array of wheelchair cushion products that claim to be pressure relieving or to distribute pressure more effectively; however, there is minimal detail provided regarding the shape and contours of the particular cushion and how this influences the risk of PUs. This was highlighted by Brienza and Geyer 3 who asks, in relation to mattress support surfaces, what is the ideal geometry to manage optimum tissue integrity? Finite element studies and other work investigating the aetiology of PUs4–9 often eliminate extrinsic factors such as support surface shape. A possible reason for this is to reduce the complexity of intricate theoretical models or methodologies.
Interface pressure (IP) is commonly used to assess the ability of a support surface to relieve and distribute pressure; it is accepted that pressure mapping technology is a valuable clinical tool10 –12 and has been considered as a measure for ischaemic risk and PU development.13,14 A recent systematic review reported that there is a qualitative link between IP and PU incidence. 12 Brienza and Geyer 3 and others10,15,16 recommend that only relative pressure measurements are used to compare and optimise support surfaces due to the systems being susceptible to creep and hysteresis.17,18 IP is the only one factor in the aetiology of PUs; numerous extrinsic (e.g. shear pressure) and intrinsic factors (e.g. incontinence and malnutrition) have significant roles in the development of PUs; however, these factors are not considered here as they are covered extensively elsewhere and are outside the scope of this study.
The Peak Pressure Index (PPI), coefficient of variation (CoV) and contact area (CA) (or numbers of activated sensors) are considered some of the most reliable metrics for pressure mapping statistical analysis.11,19 The PPI is defined as the average of the four highest adjacent recorded pressure values within a 9–10 cm2 area (four sensors), the approximate CA of an ischial tuberosity. 17 The PPI does not provide a direct measure of pressure gradient; however, the ability to focus on a group of peak sensors can provide an appreciation of the gradient of pressure, which has implications on shear forces. A high gradient from peak to adjacent sensors indicates poor envelopment of the bony prominence. 10 This measure was not evaluated in this study as it is the focus of future work.
The measurement of discomfort as a surrogate has been previously used to understand the risk of ischaemia when evaluating different spinal immobilisation boards, specifically using the Visual Analog Scale (VAS). 20 The use of discomfort as a surrogate measure for PU risk has been used in this study because pain is a known physiological response to ischaemic tissue damage, which is triggered by nociceptors (pain receptors). 21 The use of this physiological response is translated into a clinical risk assessment tool, the internationally recognised Braden Scale, which evaluates an individual’s ‘ability to respond meaningfully to pressure-related discomfort’. 22 In addition, clinical guidelines from the European Pressure Ulcer Advisory Panel (EPUAP) make specific recommendations for skin assessment, stating that individuals should be asked to identify any areas of discomfort or pain that could be attributed to pressure damage as this is based on the ‘indication that pain over a site is a precursor to tissue breakdown’. 1 The terms discomfort and pain are used synonymously in the above-mentioned sources and in other clinical studies23,24 as pain can be considered as a form of discomfort.25,26 The length of sitting for this study was based on research regarding the duration until ischaemia occurs,27 –29 and restriction of movement was required to emulate a wheelchair user who is unable to reposition themselves.
This study seeks to advance knowledge in seating design for PU prevention utilising previously reported and validated computer-aided design (CAD) and CAM techniques for the fabrication of customised wheelchair seating systems. 30 The study described in this article has specifically focussed on investigating the empirical relationship between a support surface’s shape and PU risk. The hypothesis is that shapes that are more representative of custom contoured surfaces reduce PU risk when compared with a commercial cushion shape using measurements of discomfort and IP.
Methods
This study is a randomised, repeated measures prospective trial, evaluating two cushion shapes against a baseline (a flat surface) using two surrogates: (1) feeling of discomfort using the VAS and (2) IPs from 30 min of sitting with restricted movement.
Thirty-two able-bodied participants (with intact neurological sensation) (Table 1) were recruited according to criteria to ensure that the experimental sitting conditions would not cause any risk or injury, for example, history of back problems or deep vein thrombosis. The inclusion criteria were any able-bodied adults (18–60 years old) who were sensate in the buttocks/thigh area, and participants were excluded if there was a history of PUs or skin problems in this region.
Participant characteristics.
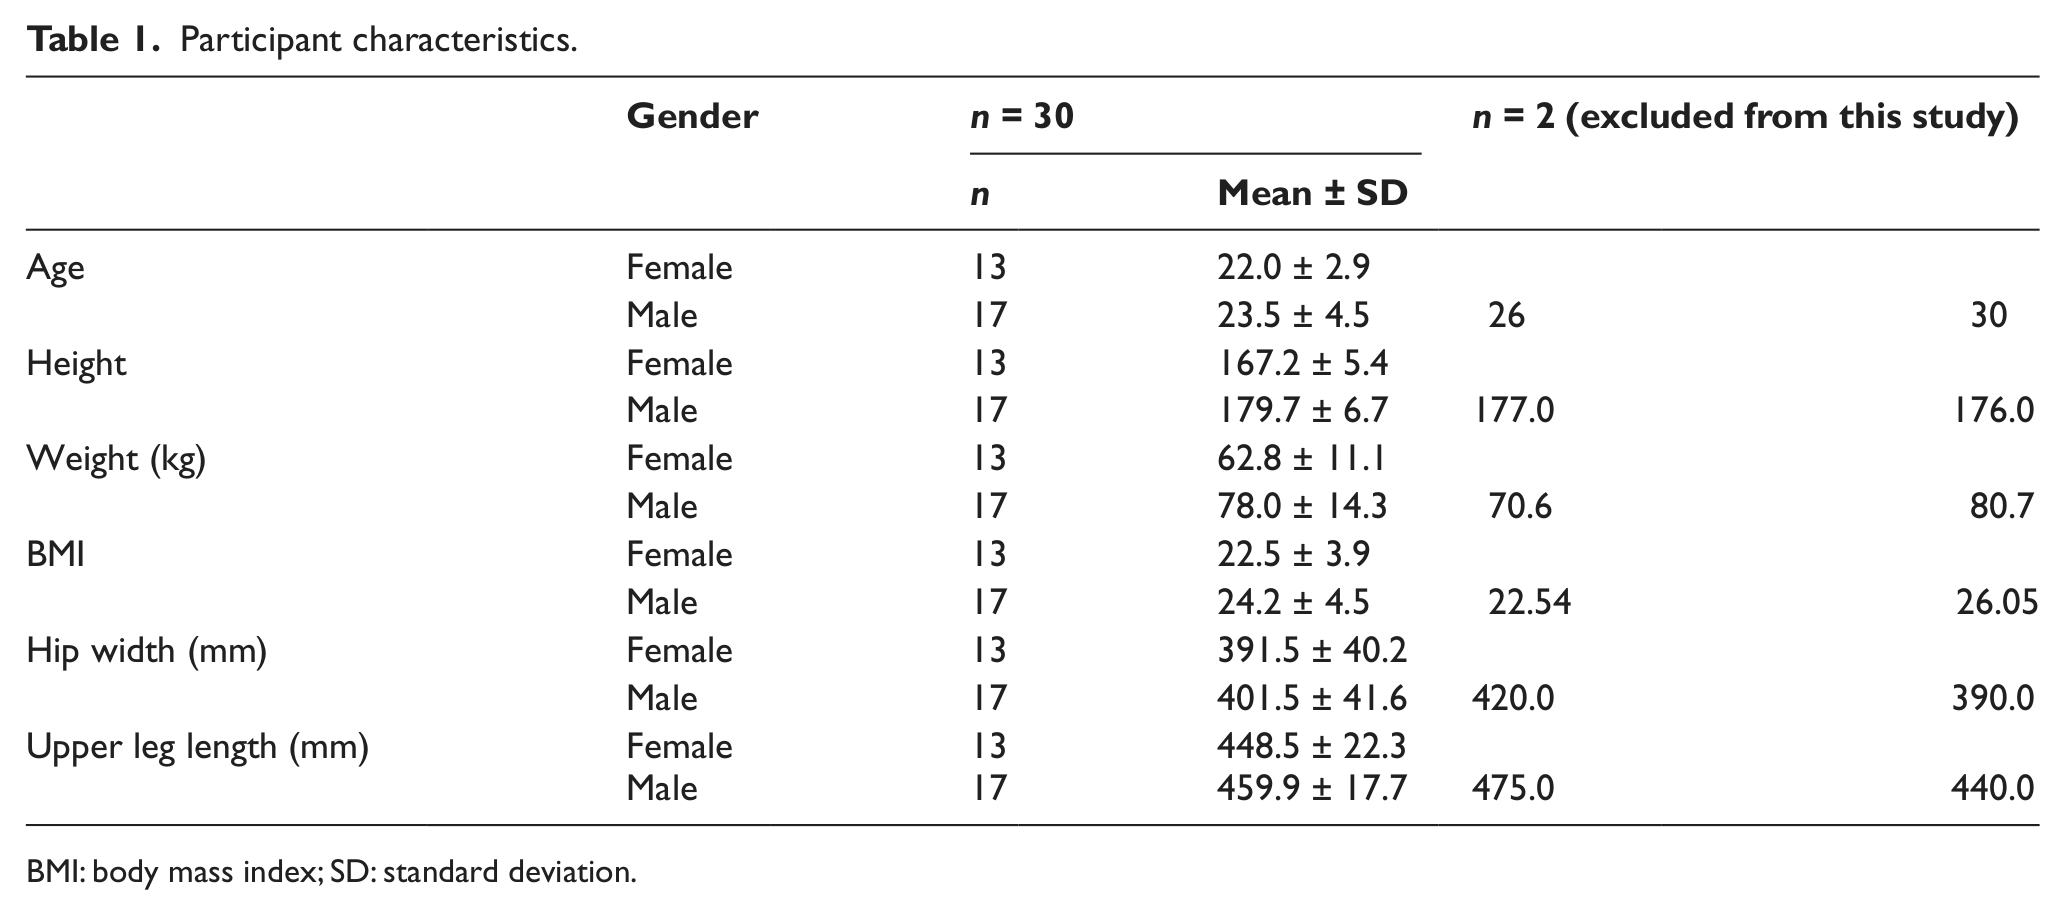
BMI: body mass index; SD: standard deviation.
Following approval from the South West Wales Research Ethics Committee, informed consent was obtained from all participants. Participants sat in a manual transit wheelchair (Figure 1) on the following non-deformable cushion shapes:
Flat (baseline; Shape X);
Commercially shaped cushion (Shape A). A commercially available generically shaped cushion was digitally scanned and scaled using 3D CAD software 30 based on the participant’s hip width and leg length to achieve the nearest commercially available size;
Custom-contoured shape (Shape B) – a latex bead bag was used to obtain each participant’s seated position in the wheelchair. This process and the subsequent CAD/CAM processes to fabricate Shape B have been published and validated elsewhere. 30
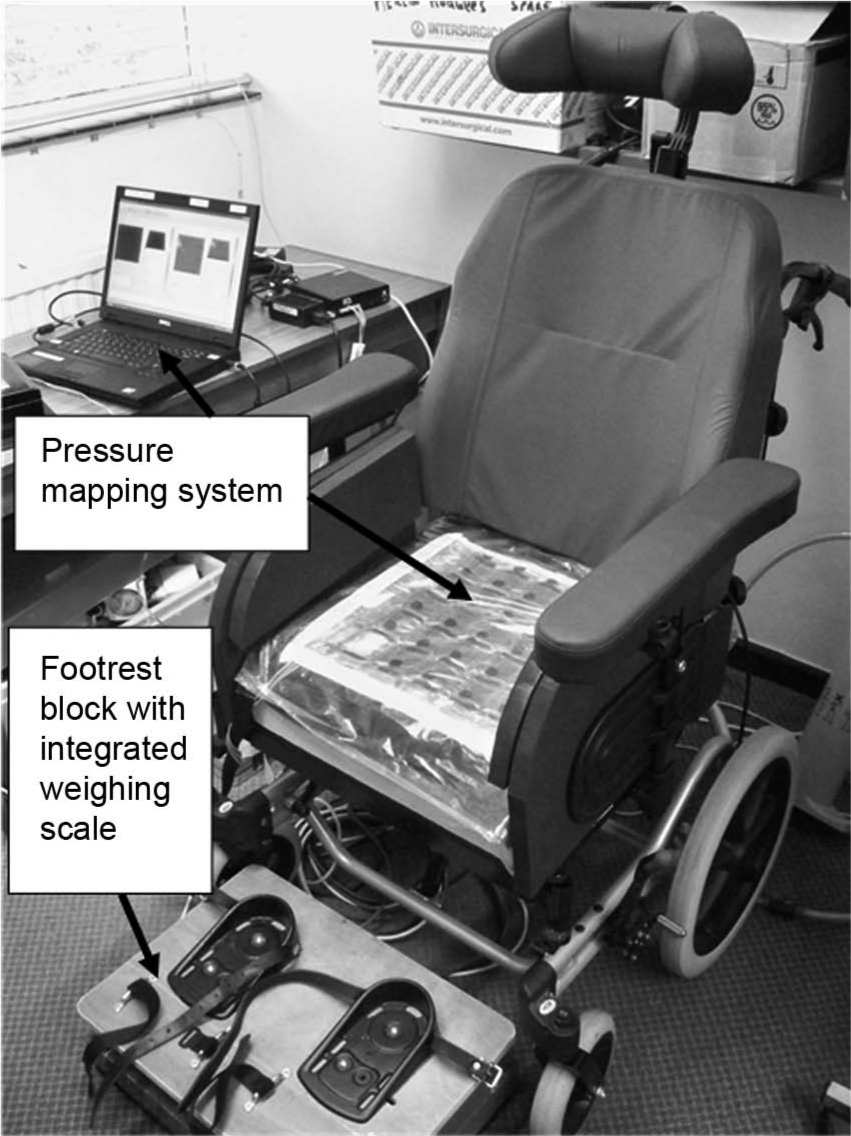
Experimental set-up and equipment used (showing cushion Shape X – flat).
All three shapes were fabricated of a rigid Styrofoam (extruded polystyrene, density of 35 kg/m3 and compressive strength of 300 kPa); 31 this ensured that the study was testing shape alone and did not allow any shape deformation to occur on any of the surfaces while the participants were seated. All three shapes were of the same overall thickness (120 mm).
All participants sat on the flat cushion (Shape X) at their first session in order to provide baseline measurements, allowing statistical adjustments to subsequent scores. The order of shapes (Shape A) and (Shape B) were randomised using a random number table, resulting in two groups of participants. A minimum 2-day wash out period was enforced to ensure that any residual discomfort had disappeared. The participants were given the opportunity to withdraw from the study at any point, and two participants were excluded from the study due to excessive movement at the first sitting causing a significant redistribution of pressure. This was identified by reviewing video camera footage and pressure recordings.
Participants were issued with a pair of cotton trousers to wear, ensuring a consistent interface between the support surface and skin and eliminating any potential artefacts or peak pressures caused by trouser seams. A footrest block with an integrated weighing scale was assembled to support the participant’s feet (as shown in Figure 1) to achieve 19%–25% of the participant’s total body weight and a reproducible seated posture.19,32 The participant’s feet were also constrained, and the backrest angle set at 10° reclined from vertical.
The discomfort VAS was a 100 mm line, marked with ‘Extreme comfort’ on the left-hand side and ‘Extreme discomfort’ on the right-hand side. Participants placed ‘X’ on the line at the position that represents their feeling of discomfort at 1, 10, 20 and 30 min. The investigator recorded the distance of the ‘X’ (to the nearest millimetre) from the left-hand side.
A pressure mapping mat, Force Sensor Array (FSA), (Vista Medical Ltd, Winnipeg, MB, Canada) was placed on the top surface of the cushion to record IPs (at 5 Hz) during the sitting sessions, as shown in Figure 1. The sensor mat contains 256 sensors, and each sensor is in the size of 25.4 mm. Pilot study results revealed that the magnitudes of pressure exceeded the maximum calibrated range of the pressure mapping mat (0–300 mmHg), and therefore, an ‘equilibrate’ conductance sensor array (Vista Medical Ltd) was used, which displayed pressure readings in percentage values. This is a custom sensor array where the output provides percentage values, which reflect the amount of conductance through each sensor. Higher IPs produce less resistance in the piezoresistive sensors and hence higher conductivity. It provides a relative measure of a greater range of IPs that would not be possible on a clinically calibrated system. IP data were collected at 30 min.
A linear mixed model regression analysis was performed to determine the effects of shape and time (independent variables) on discomfort scores (dependent variable). The mixed model comprised two fixed effects (shape and time) and a random intercept effect to represent a consistent trend of within-subject discomfort scores. This mixed model uses Shape X as a baseline and allows direct comparison with scores for Shape A and Shape B. A paired t-test and Wilcoxon test (non-parametric) were used to compare group means and medians, respectively, for the relative IPs. A non-parametric test was required as some IP data did not satisfy the normal distribution assumption. Statistical significance was defined at an alpha level of 0.05 for all tests.
Results
Discomfort
The discomfort scores for all three shapes are summarised in Table 2 and illustrated in Figure 2. Figure 2(a) clearly shows that the discomfort data were generally positively skewed, and this was confirmed using the Shapiro–Wilk test. A square-root transformation was found to normalise the data, as shown in Figure 2(b). The regression models use these transformed data.
Discomfort original means ± SD (mm) and mean square-root transformed scores ± SD (95% CI of the mean).
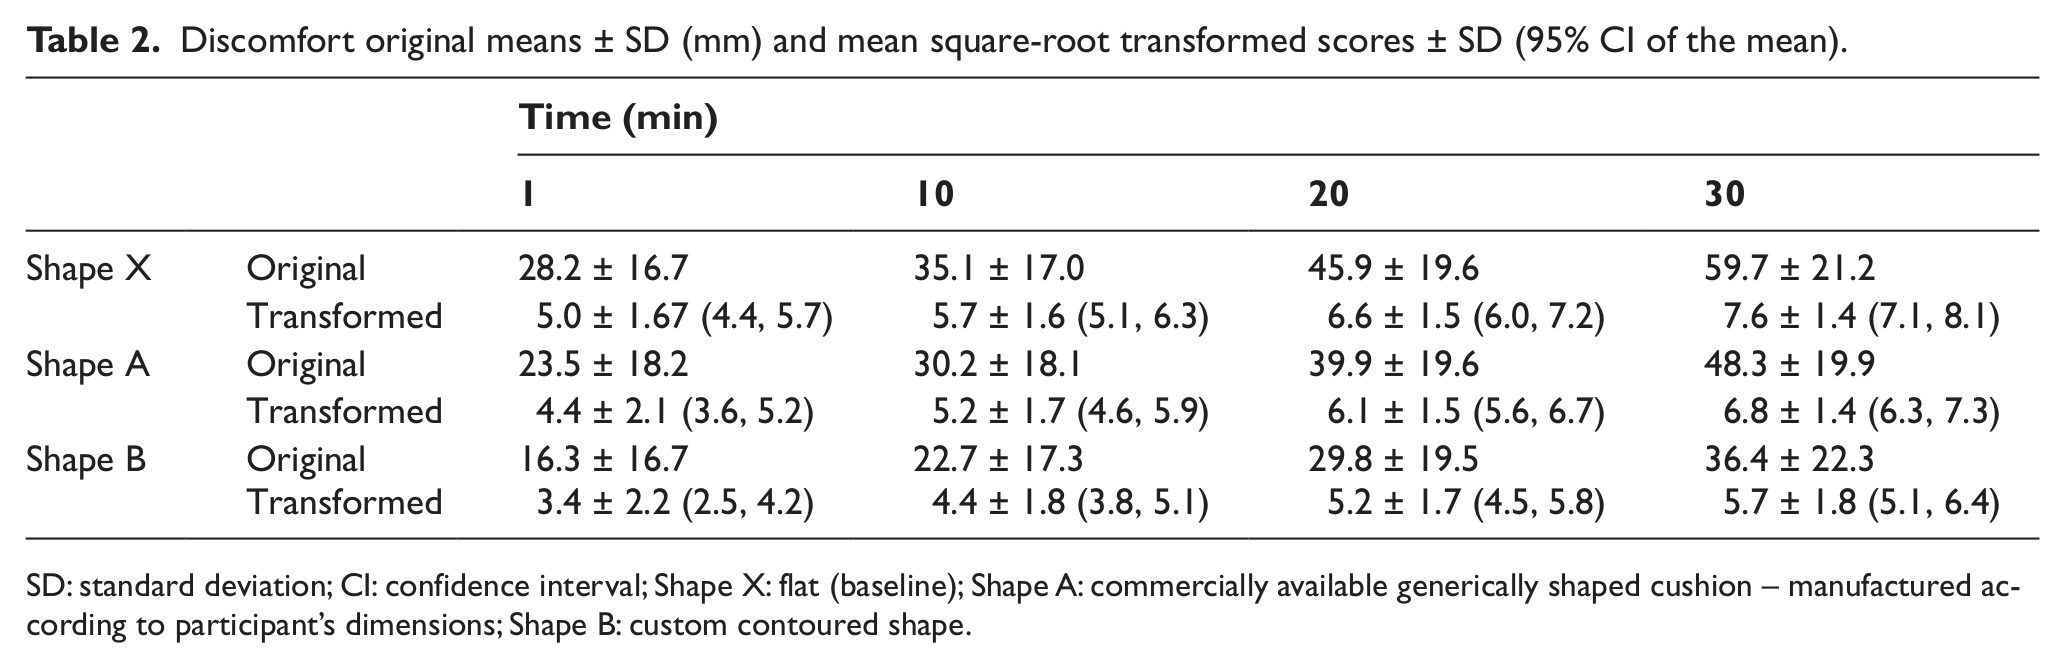
SD: standard deviation; CI: confidence interval; Shape X: flat (baseline); Shape A: commercially available generically shaped cushion – manufactured according to participant’s dimensions; Shape B: custom contoured shape.
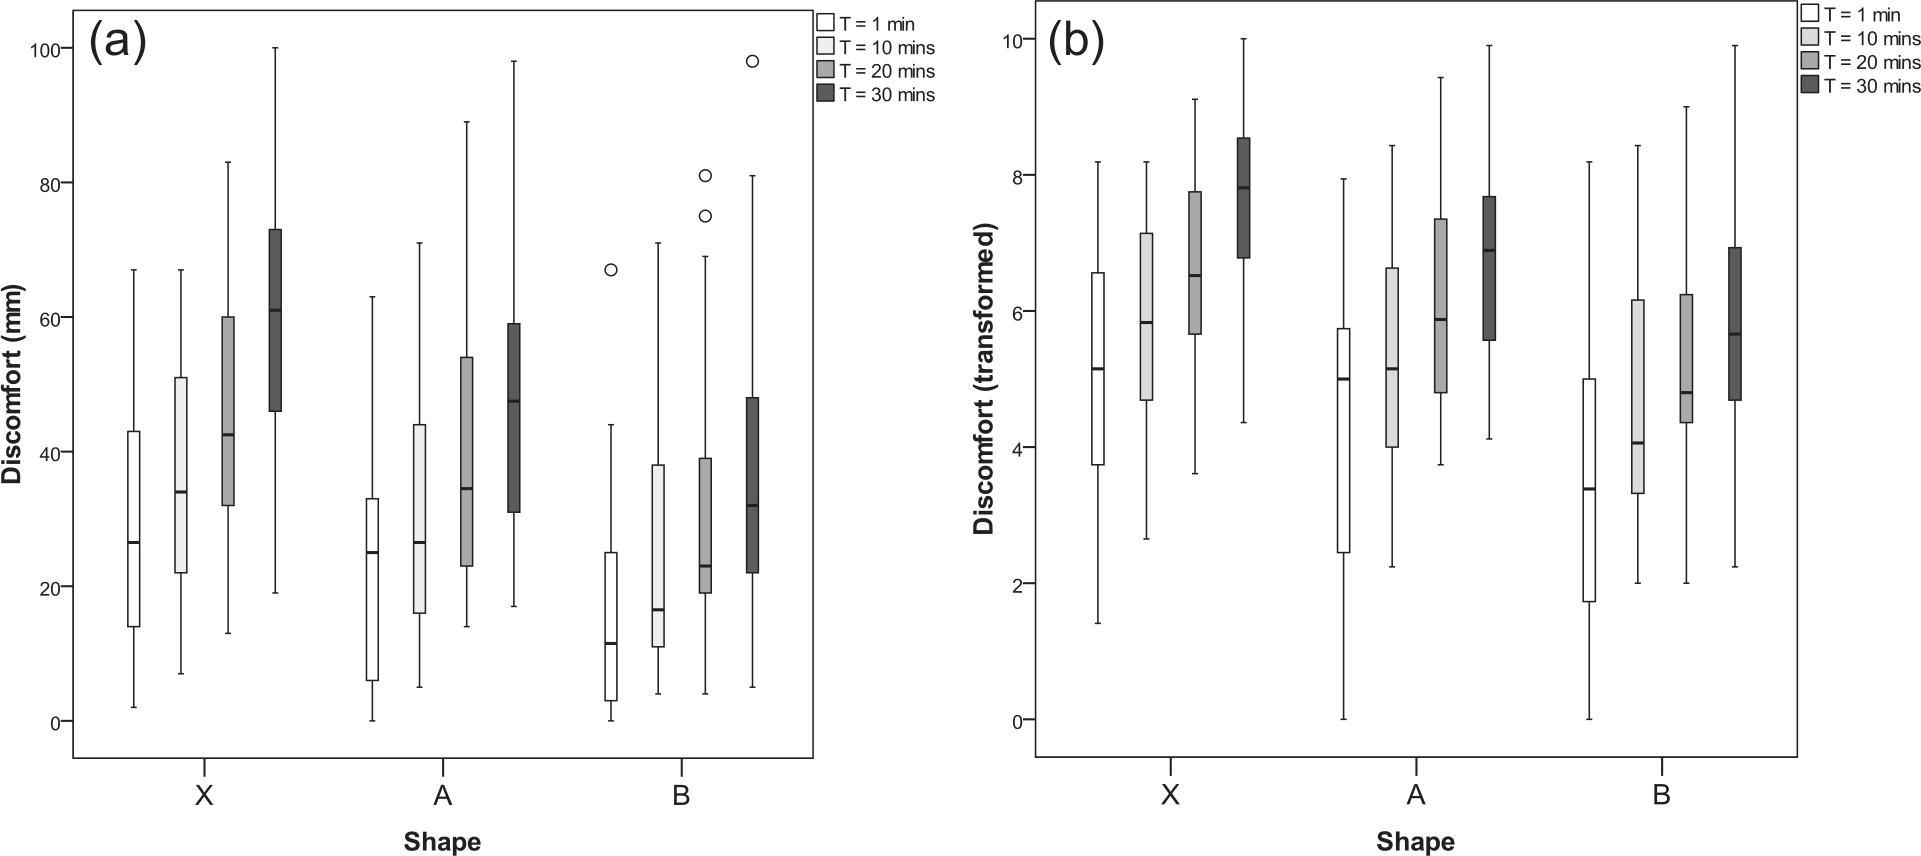
Comparison of (a) original discomfort results and (b) transformed discomfort results for Shape X, Shape A and Shape B.
The resultant regression slope for each shape, using time as the independent variable, provided consistent linear slope coefficients, indicating a common slope coefficient, estimated as 0.084 (p < 0.001) in the mixed model. The estimated reduction in (transformed) discomfort was 0.60 for Shape A (p < 0.001) and 1.55 for Shape B (p < 0.001) compared with X. Therefore, the estimated reduction of transformed discomfort for Shape B compared to Shape A is 0.95 (p < 0.001) as indicated by the intercept parameter.
Further analysis reveals a significant (p < 0.05) negative correlation between hip width and discomfort at 1, 10, 20 and 30 min (using the Pearson’s correlation coefficient), with relatively consistent values of −0.39, −0.48, −0.37 and −0.40, respectively.
IP
IP results are shown in Table 3. For each participant, relative PPI, CoV and CA results were calculated by subtracting each reading at 30 min from the participant’s respective Shape X reading at 30 min. A paired t-test revealed that the mean relative IP results were significantly higher (p < 0.05) on Shape B than on Shape A. In other words, the mean difference to the baseline (Shape X) was greater in Shape B than Shape A. These tests also revealed a significant difference (p < 0.05) in medians for the non-parametric tests between each pair, as shown in Table 3.
IP parameters and statistical results at 30 min (n = 30).
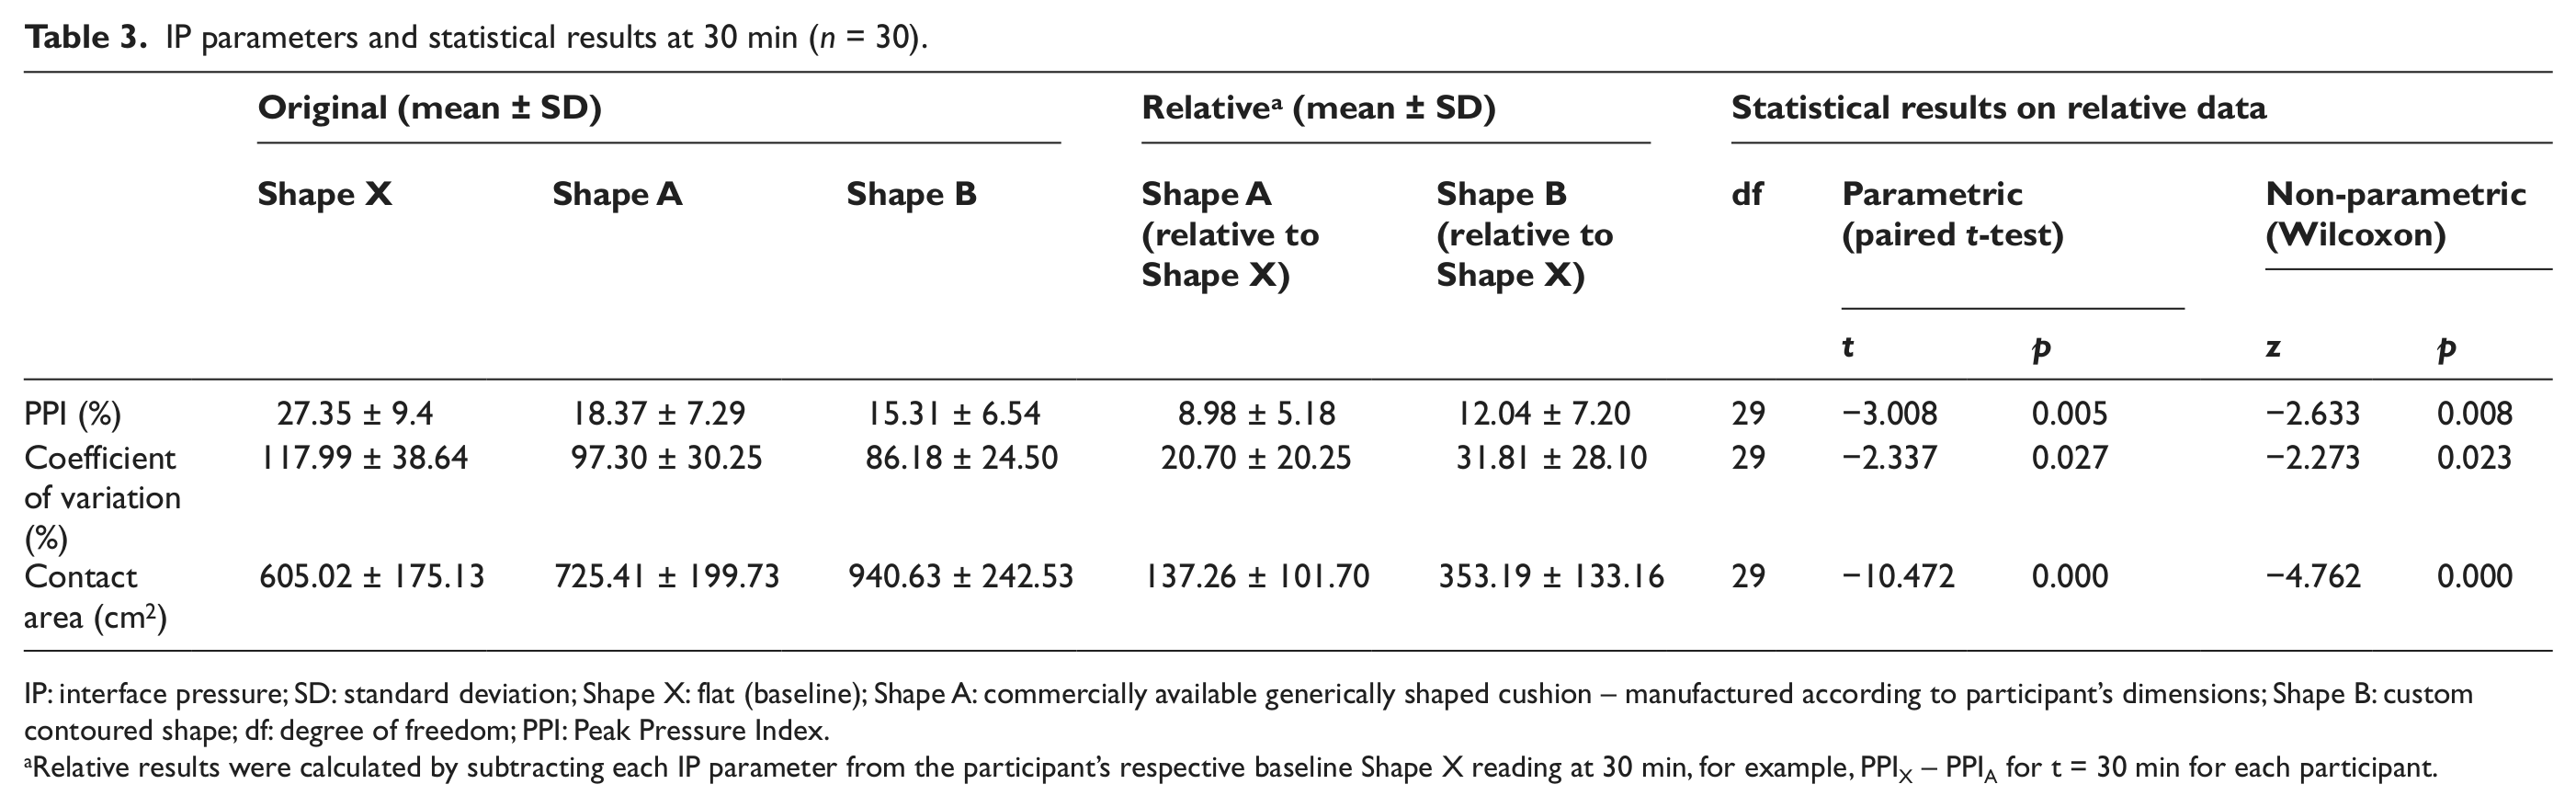
IP: interface pressure; SD: standard deviation; Shape X: flat (baseline); Shape A: commercially available generically shaped cushion – manufactured according to participant’s dimensions; Shape B: custom contoured shape; df: degree of freedom; PPI: Peak Pressure Index.
Relative results were calculated by subtracting each IP parameter from the participant’s respective baseline Shape X reading at 30 min, for example, PPIX – PPIA for t = 30 min for each participant.
Discussion
The results of this study confirm that custom contoured shapes, when compared to a commercially available cushion shape, are effective at reducing IP and discomfort for the subpopulation of able-bodied participants used in this study. Therefore, the use of IP and discomfort as surrogate measures for PU risk supports the hypothesis, suggesting that shapes that represent the contours and depths achieved in Shape B should be used to inform and advance wheelchair cushion design to reduce the risk of PUs.
Initial shape analysis has shown that Shape B’s mean depth (linear measurement taken using CAD software) from the top of the cushion to the location of the ischial tuberosities (lowest point) is 98.5 mm (standard deviation (SD) = 10.67) and 38 mm for Shape A. This would suggest depths that are double that of commercially shaped cushions should be considered to advance cushion shape design. Other 3D geometric differences are being analysed as part of future study to ascertain which qualities should be considered when designing cushion shapes.
These results confirm a long-standing clinical belief regarding the effectiveness of custom contoured shapes and also build upon research conducted in the early 1990s. 33 Sprigle et al.’s 33 study measured displacements on a flat and custom contoured cushion and concluded that contoured foam cushions provide a seat interface that is potentially less damaging to soft tissue than a flat cushion. Another study 34 evaluated custom contoured cushions against commercially available cushions such as ROHO and Jay cushions, where mean pressures were lower on the custom contoured cushions.
This article provides further quantification regarding the importance of cushion contours using 3D shape acquisition, fabrication and analysis techniques used in this study. The linear regression analysis revealed that the estimated reduction in discomfort magnitude is statistically significant (p < 0.05) between Shape A and Shape B. Interestingly, the effect of time on discomfort is consistent across all three shapes due to similar slope coefficients, indicating that the rate of increase in discomfort does not depend on shape.
The IP results, particularly the CA results, suggest that Shape B is creating a more uniform pressure profile as the shape redistributes the pressure across a larger surface area; this is thought to confirm that the cushion is contouring to the shape of the participants’ body, 35 distributing pressure away from the bony prominences to the surrounding tissue, thereby reducing IP. This process is known as envelopment.
A significant (p < 0.05) negative correlation between Shape A’s discomfort and participants’ hip width indicates an association between small hip widths and increased discomfort on Shape A. This finding could imply that the designed contours of Shape A do not accommodate smaller hip widths. The range of hip widths was 320–460 mm, and the results suggest that participants with hip widths of less than 420 mm reported greater discomfort. This correlation does not exist for Shape B, and therefore, further investigation would be required to ascertain whether this signifies that the contours for Shape B accommodate a larger range of hip widths.
The lack of sensation is clearly a highly influential factor in PU development for some wheelchair users as undetected discomfort is potentially a precursor to tissue ischaemia.1,21,22 The measurement of PU risk outcomes in this study has used participants with intact sensation who were instructed and monitored to ensure that no movement took place to relieve pressure at the seated area during the 30 min. Therefore, the results from sensate able-bodied individuals have the potential to inform the design of wheelchair seating for individuals who are insensate or are unable to reposition themselves. 36 However, it is recognised that the use of able-bodied participants may not be representative of some wheelchair users. It is known that spinal cord-injured wheelchair users often have minimal muscle bulk, and bone remodelling may have taken place at the ischial tuberosities. 37 These variations in body shape, and hence IPs, for different populations are outside the scope of this study but require consideration and additional research using the disabled population to inform the design of cushions for these individuals. The shape of a support surface can also have an important clinical role in posture, function and stability for the user, and the authors do recognise that the practical implications of deeper cushions could be detrimental to transferring methods used by some wheelchair users, and therefore, these clinical functions require extensive research with different clinical populations.
The limitations associated with the use of pressure mapping are well documented, and these have been minimised by adopting a consistent protocol using readings in a relative manner obtained at 30 min, which satisfies the requirement to account for creep of the sensors and tissue.19,38 A calibration procedure was not available for the custom sensor array used, and therefore, the effect of creep was quantified from 10 to 30 min for all participants. The effect of creep had the least effect on the CoV parameter (an average of less than 4%) and the greatest effect on PPI (an average of less than 13%). The potential for pressure mat hammocking in Shape B was minimised by manipulating the mat into the contours prior to sitting. It is also thought that hammocking is less likely to occur on Styrofoam than foam due to the stiffness and high friction properties, which allowed conformity of the mat.
PU risk is multifactorial, and this study has only investigated one aspect: support surface shape. This study evaluated the fundamental importance of the underlying shape addressing a gap in knowledge to inform future study in wheelchair cushion design. The shapes were non-deformable, and the aims of this study did not include the effect of cushion compliance, which is a highly variable factor that would be influenced significantly by body type and posture. The study of cushion materials is a large topic, and the load–deflection behaviour of a cushion can be complex. The interaction between a user, the cushion’s shape and material properties is future study.
Conclusion
This study has investigated the empirical relationship, using able-bodied participants, between a support surface shape and surrogate measures for PU risk. Statistically significant reductions (p < 0.05) in these measures (IP and discomfort) therefore suggest that the contribution of the 3D contours found in custom contoured cushions could provide a reduction in PU risk, when compared to the 3D contours represented by a commercially shaped cushion. Due to the developments in 3D shape acquisition technology and shape analysis methods, the evaluation and quantification of different levels and tolerances of cushion contouring are now possible, and the results from this article indicate that the contribution of a cushion’s 3D contours should receive further research in order to advance knowledge in seating design for PU prevention.
Footnotes
Acknowledgements
We acknowledge the Rehabilitation Engineering Unit and Medical Physics & Clinical Engineering department, ABMU Health Board for resources and support, and Posture & Mobility Service, c/o ALAS, Cardiff for CAD/CAM hardware and software funding. We also thank Zoe Hadley for assistance in data collection and Professor Ian Russell, College of Medicine, Swansea University for critical review of the study proposal and statistical analysis.
Conflict of interests
None declared.
Funding
This work was supported by the Abertawe Bro Morgannwg University (ABMU) Health Board’s Own Account Research Fund.