
Abstract
Background:
Increasing numbers of long jumpers with lower limb amputations choose to take off from their prosthetic limb. It is not yet known what difference in technique, if any, this requires, or which is more advantageous.
Objectives:
To investigate kinematic differences in long jump technique in athletes with a unilateral transtibial ampution (TT) who take off from their prosthetic limb versus those who take off from their intact limb.
Study Design:
Naturalistic, field-based, observational; independent group, nonparametric comparison.
Methods:
Two-dimensional sagittal plane kinematic analysis was performed on all athletes competing in the men’s Paralympic TT long jump finals. Five athletes took off from their prosthetic limb (TOprosth) and five from their intact limb (TOintact).
Results:
No differences were seen between the two groups in terms of jump distance, approach speed or vertical velocity at touch down. While in contact with the take-off board, the two groups gained a similar amount of vertical velocity. However, the TOprosth group appeared to conserve horizontal velocity by using the prosthesis as a ‘springboard’, minimizing the large hip and knee range of motion displayed by the TOintact group and athletes in previous studies.
Conclusions:
While differences in technique were observed, no difference was found for jump distance.
Clinical relevance
Athletes choosing to take-off from their prosthetic limb in long jump require a different technique to those who choose to take-off from their intact limb. Knowledge of the correct technique can help reduce excessive training which can lead to injury, particularly in the residual limb.
Background
The long jump event can be broken down into four main parts for the purpose of biomechanical analysis. First, an approach run which differs in length due to individual preference, the last three steps of which are used to prepare optimal body position for touch-down onto the take-off board. Second, touch-down to take-off where one foot is in contact with the take-off board and the athlete further adjusts body position for optimal take-off position. Third, flight where the athlete tries to adjust body position in the air to delay landing, and lastly, landing technique. Several long jump studies have provided information on the techniques used by athletes with a transtibial amputation (TT) during the approach run and from touch-down to take-off. While these athletes conform to the same long jump model as able- bodied athletes,1–3 male TT athletes have been found to exhibit a weaker approach speed/distance jumped relationship than their able-bodied counterparts, possibly as a result of having to modify their technique due to the prosthetic limb. TT athletes, even though their approach speed is slower than able-bodied athletes, have been found to touch down onto the take-off board with a disadvantageously high negative vertical velocity resulting in sub-optimal positioning of the body and reduced vertical velocity at take-off. The authors suggested this was associated with taking off from the prosthetic limb prior to touching down onto the take-off board, 1 but to date no studies have reported the effect the choice of take-off limb has on technique.
Previous studies on amputee long jump have included in their analyses a mix of athletes choosing to take off from their intact or prosthetic limb.2–3 It is not known what effect the choice of take-off limb has on technique and thus whether future studies need to group athletes by take-off limb. It is also not yet known whether recommendations can be made as to which take-off limb should be used to best improve long jump performance.
Individuals with lower limb amputations exhibit asymmetric running patterns, displaying a more flexed knee and hip when touching down and taking off from the prosthetic limb compared to the intact limb.4–6 They also take longer steps on their prosthetic limb compared to their intact limb on the long jump approach. 7 A recent study showed that residual shank length does not affect performance for TT athletes taking off from their intact limb, but results remain inconclusive for those taking off from their prosthetic limb. 8 Thus, it is possible that the choice of take-off limb may make a difference to technique due to constraints of the prosthetic and/or residual limb. The aim of this study was to investigate kinematic differences in long jump technique between athletes with a transtibial amputation who take off from their prosthetic limb and those who take off from their intact limb.
Methods
Subjects
All athletes with a unilateral transtibial amputation and carbon fibre prosthesis participating in the 2004 F44 (long jump) and P44 (pentathlon long jump) Paralympic Games finals were included in the study. If an athlete competed in both competitions, their longest jump was chosen to ensure that they were not included in the analysis twice. Five athletes took off from their prosthetic limb, while five took off from their intact limb. Performance characteristics are presented in Table 1.
Athletes’ best distance jumped and approach speed at the take-off board for the two groups (prosthetic limb and intact limb take off).
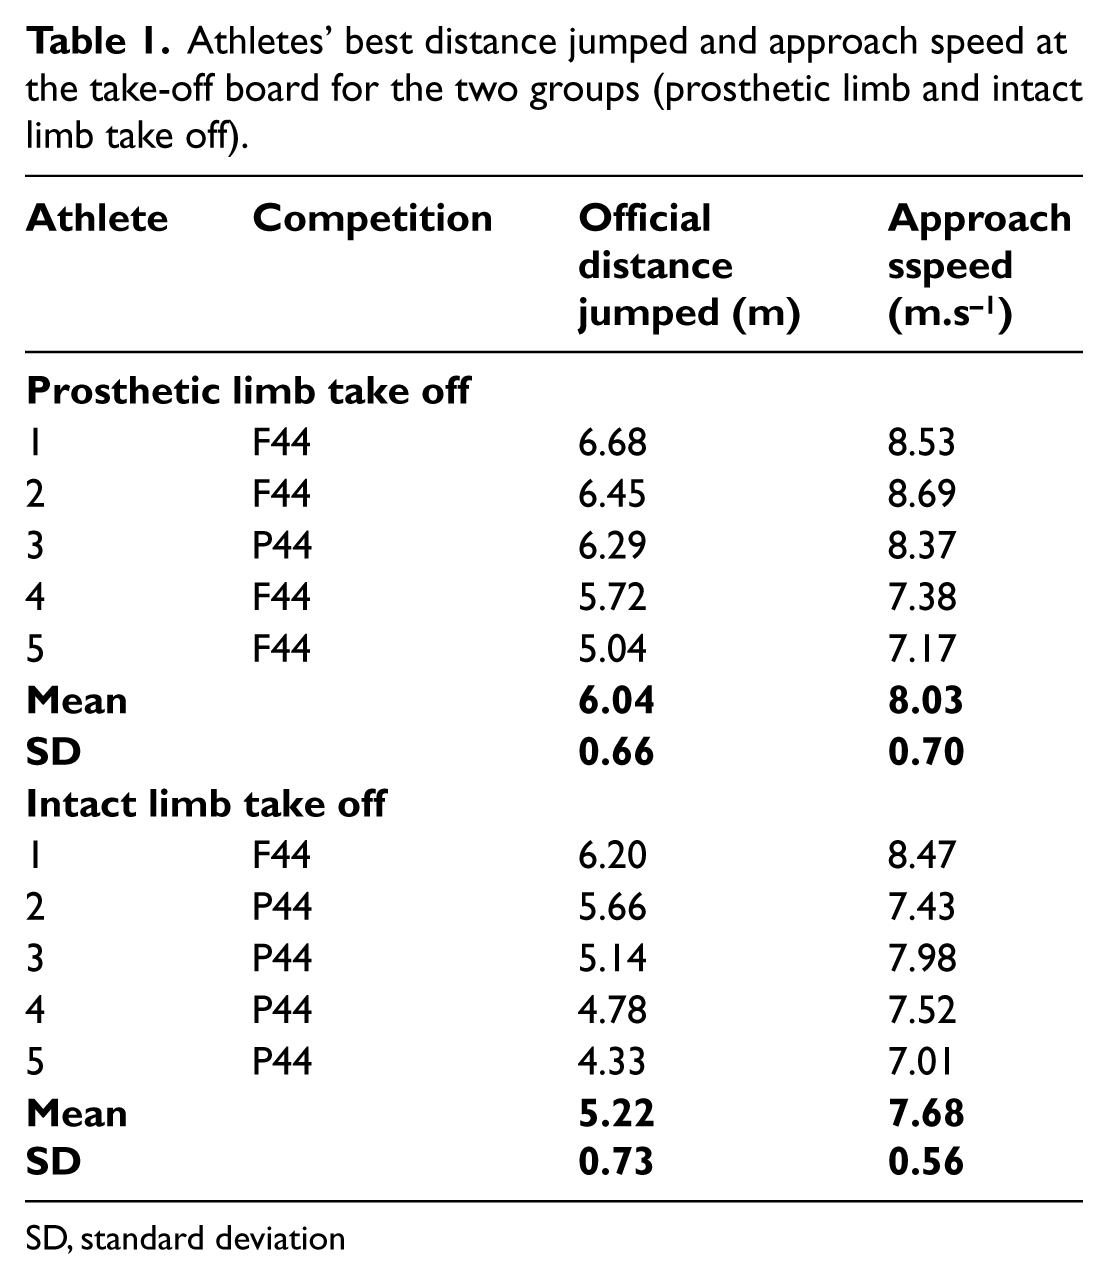
SD, standard deviation
Apparatus and procedure
A laser Doppler device (LDM 300 C Sport, Jenoptik Laser, Jena, Germany) recorded approach distance and speed during the run-up of each jump (100 Hz) (see 3 for details). The device was targeted on the torso of the athlete for the duration of their approach run. For each successful jump, speed data at the pre-calibrated point of take-off (the take-off board) were obtained and smoothed (13-point moving average) using Distance Evaluation Sport software (DAS3E v3.9).
Two digital video cameras (Sony, model DCR-TRV33E) were used to record all jumps in the sagittal plane (50 Hz) from the third last step on the approach run to take-off from the board. Prior to competition, a calibration frame was filmed at overlapping intervals along the approach run and board. During competition, the cameras were left running and all athletes’ jumps recorded. Distance jumped was recorded from the competition scoreboard.
The best jump (greatest official distance) for each athlete was selected for two-dimensional kinematic analysis. Video data for each jump from the third last step on the approach run to take-off were manually digitized using eHuman digitizing software (HMA Technology, Inc, Ontario, Canada) and analyzed using a standard 9-segment biomechanical model defined by 18 points.1–3 Adjustments to the anthropometric data 9 were made to account for the prosthetic limb. 1 The data were smoothed using a Butterworth fourth order digital filter and a cut-off frequency of 7 Hz. As measurements of the athletes’ heights were not available, each athlete’s estimated height was calculated as the sum of the length of their individual intact segments determined from the coordinates of the digitized data.3,10
Key events known to be important to long jump technique were identified for each athlete: touch-down (TD) and take-off (TO) for the third last step (3LS), second last step (2LS), last step (LS), touch-down on the take-off board (TDboard), the point of maximum knee flexion while in contact with the board (MKFboard), and take-off (TOboard). Selected kinematic variables were then calculated at each key event: horizontal (Hvel) and vertical velocity (Vvel) of the centre of mass, centre of mass height normalized to estimated height (%HCM), hip and knee angle, and leg angle (touch-downs only). The hip, knee and leg angles are defined in Figure 1. Hip and knee range of motion (ROM) were calculated as the absolute difference TD–TO for the respective joint angle at each foot contact. Step length and step duration were calculated between 3LSTD–2LSTD, 2LSTD–LSTD and LSTD–TDboard. Foot contact times were calculated for the stance phase of each step. ‘Effective distance jumped’ was calculated from official distance jumped plus the toe-to-board distance which was measured from the sagittal plane video one frame before take-off.
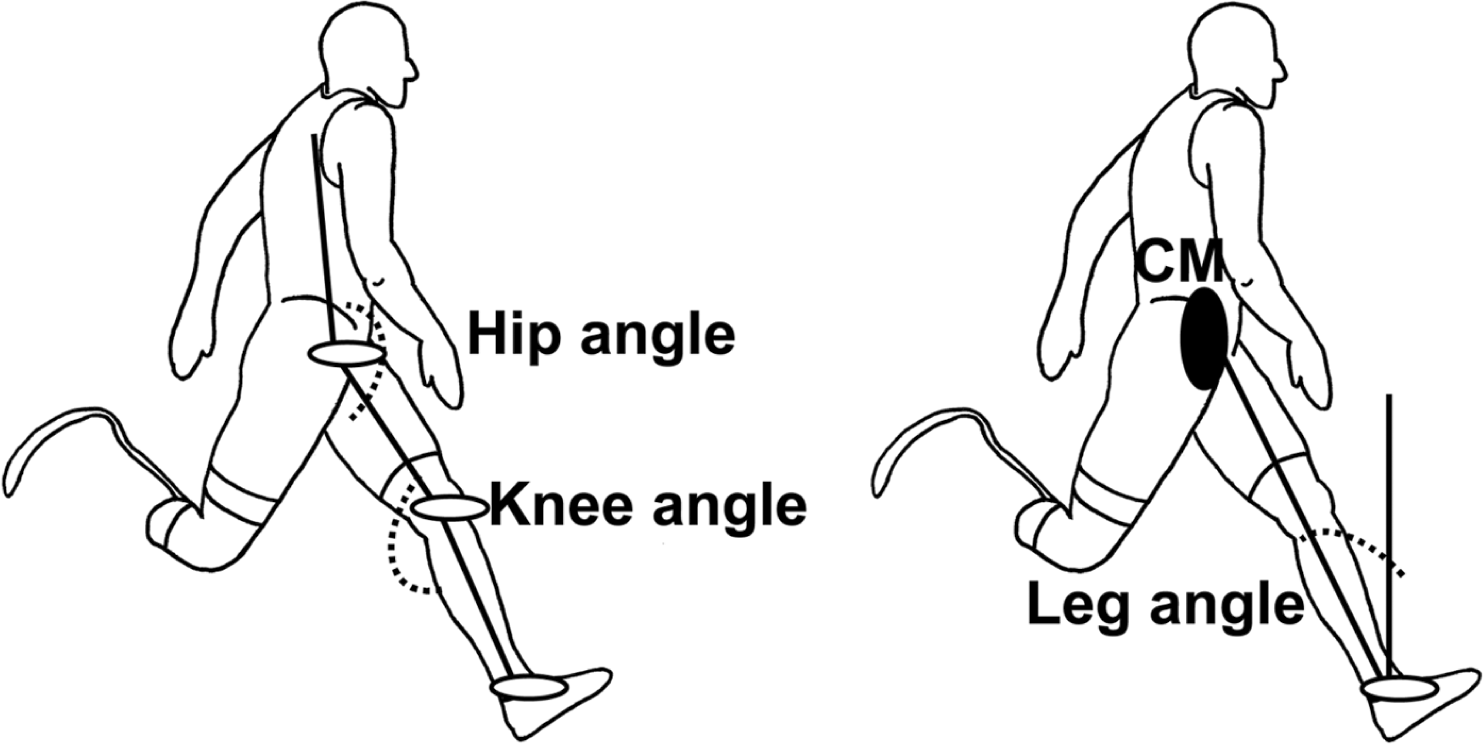
Hip, knee and leg angle conventions.
Statistical analyses
Groups were established consisting of a) those taking off from their prosthetic limb (TOprosth) and b) those taking off from their intact limb (TOintact). A Shapiro-Wilks test was used to test the normality of data. Pearson product moment correlation was used to determine the relationship between TO speed (recorded during the approach run) and effective distance jumped. A Wilcoxon test was used to assess differences between steps for each group. A Mann–Whitney U test established differences on each step between those who took off from their prosthetic limb and those who took off from their intact limb. The significance level was set at p<0.05 with trends in the data indicated by 0.05≤p<0.1.
Results
While those taking off from their prosthetic limb had a greater mean jump distance and approach speed (Table 1), there was no significant difference found between the groups. For those taking off from their prosthetic limb (TOprosth), there was a significant positive relationship (r = 0.943, p = 0.016) between approach speed and distance jumped, while for those taking off from their intact limb (TOintact), a positive, but non-significant relationship was seen (r = 0.800, p = 0.106) (Figure 2).
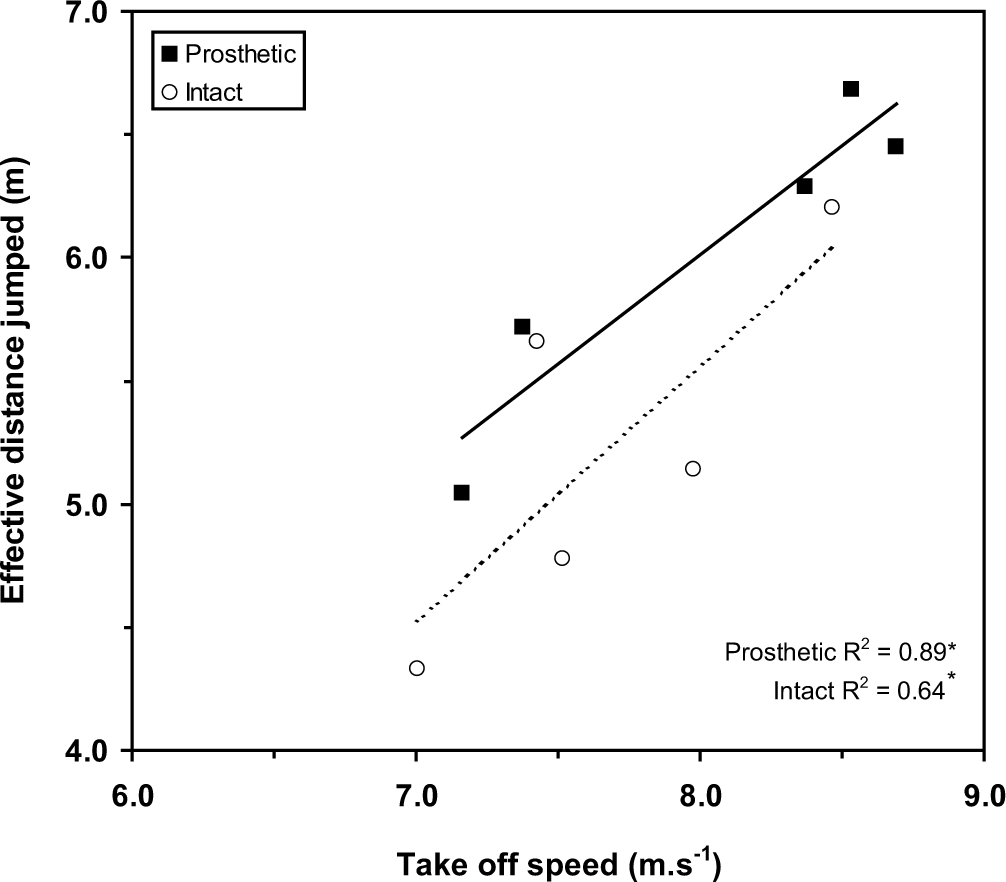
Relationship between approach speed and effective distance jumped for the TOprosth group (black square) and TOintact group (white circle). * indicates a significant relationship.
Approach velocities
There was a difference in horizontal velocity of the centre of mass (Hvel) between the two groups on the third last step of the approach only (Figure 3), the TOprosth group tending to be faster at TD (p = 0.076) and faster at TO (p = 0.034). No differences were seen between steps for the TOprosth group, while the only between step difference seen for the TOintact group was that they were slower (p = 0.043) taking off from their LS than from their 2LS.
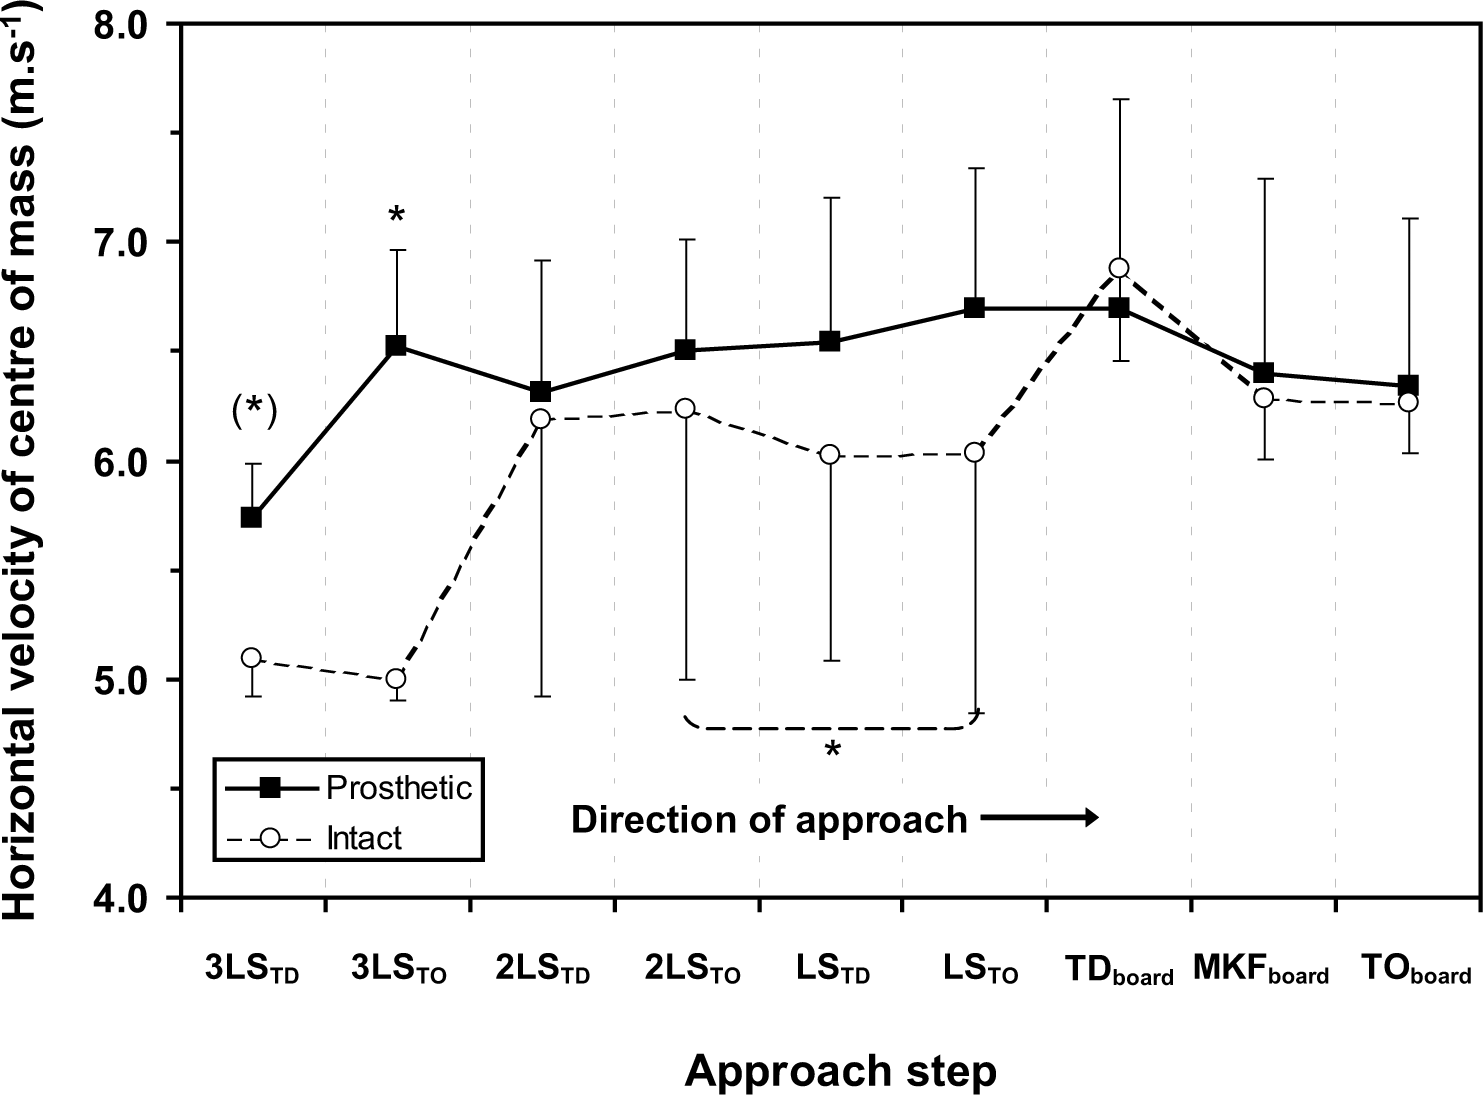
Horizontal velocity of the centre of mass from 3LSTD to TOboard for the TOprosth group (black square) and TOintact group (white circle). * indicates a significant difference and (*) a trend towards a difference. Between group differences seen at 3LSTD (p = 0.076) and 3LSTO (p = 0.034). Within group difference seen between 2LSTO and LSTO (p = 0.043) for the TOintact group.
No group differences in vertical velocity of the centre of mass (Vvel) on the approach run were seen (Figure 4). Both groups showed a reduction (p = 0.042 for the TOintact group; p = 0.074 for the TOprosth group) in Vvel between 2LSTO and LSTO.
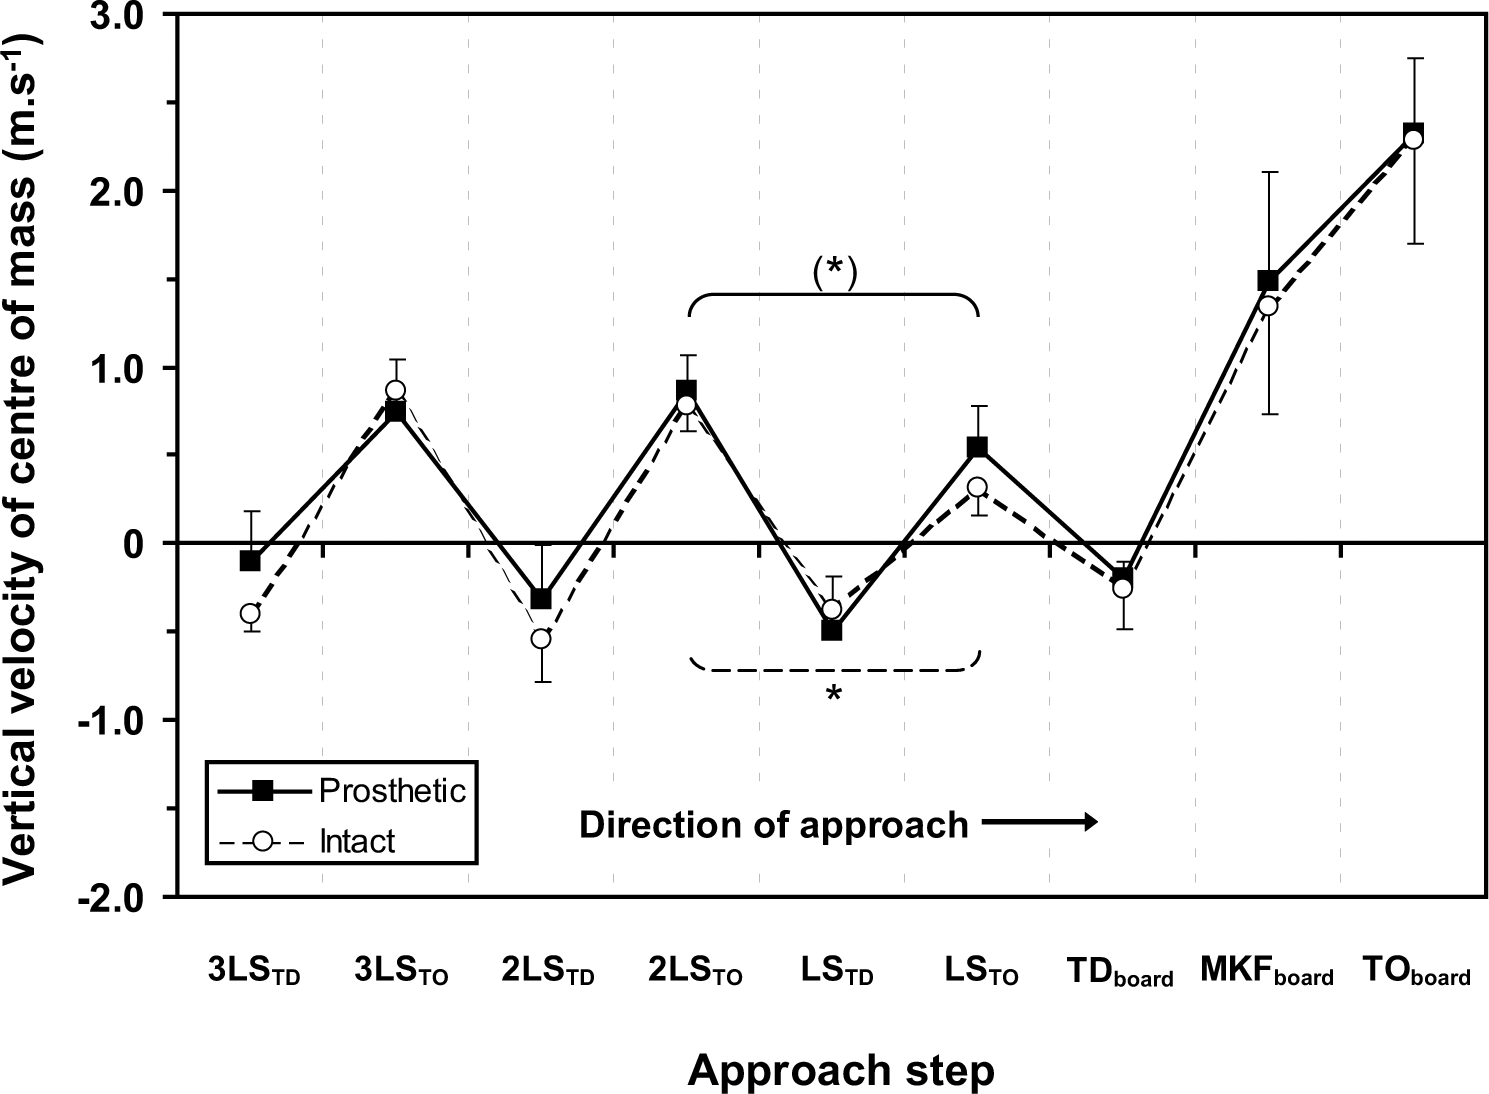
Vertical velocity of the centre of mass from 3LSTD to TOboard for the TOprosth group (black square) and TOintact group (white circle). * indicates a significant difference and (*) a trend towards a difference. Within group differences seen between 2LSTO and LSTO for the TOprosth (p = 0.074) and TOintact (p = 0.042) groups.
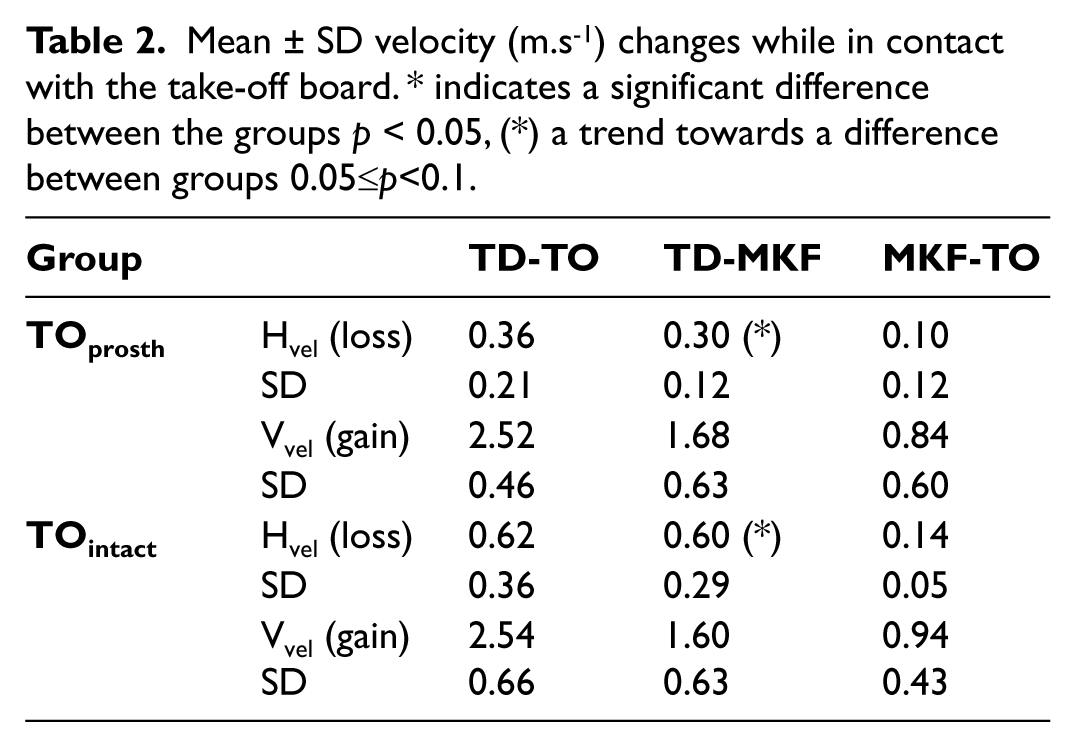
Both groups gained a similar amount of vertical velocity while in contact with the take-off board (Table 2). The TOintact group however, lost almost double the amount of horizontal velocity of the TOprosth group (TDboard–TOboard). This loss was seen to be greatest in the first part of the take-off phase (TD-MKF) where there was a trend towards a group difference (p = 0.091).
Mean ± SD velocity (m.s−1) changes while in contact with the take-off board. * indicates a significant difference between the groups p < 0.05, (*) a trend towards a difference between groups 0.05≤p<0.1.
Relative centre of mass height
No group differences were seen in terms of relative centre of mass height (%HCM) (Figure 5). Both groups exhibited a trend towards a lower (p = 0.080) %HCM at TDboard than they had at LSTD. The TOprosth group also exhibited a trend towards a lower (p = 0.080) %HCM at TDboard than at 2LSTD, and had a higher (p = 0.043) %HCM at LSTO than at 2LSTO.
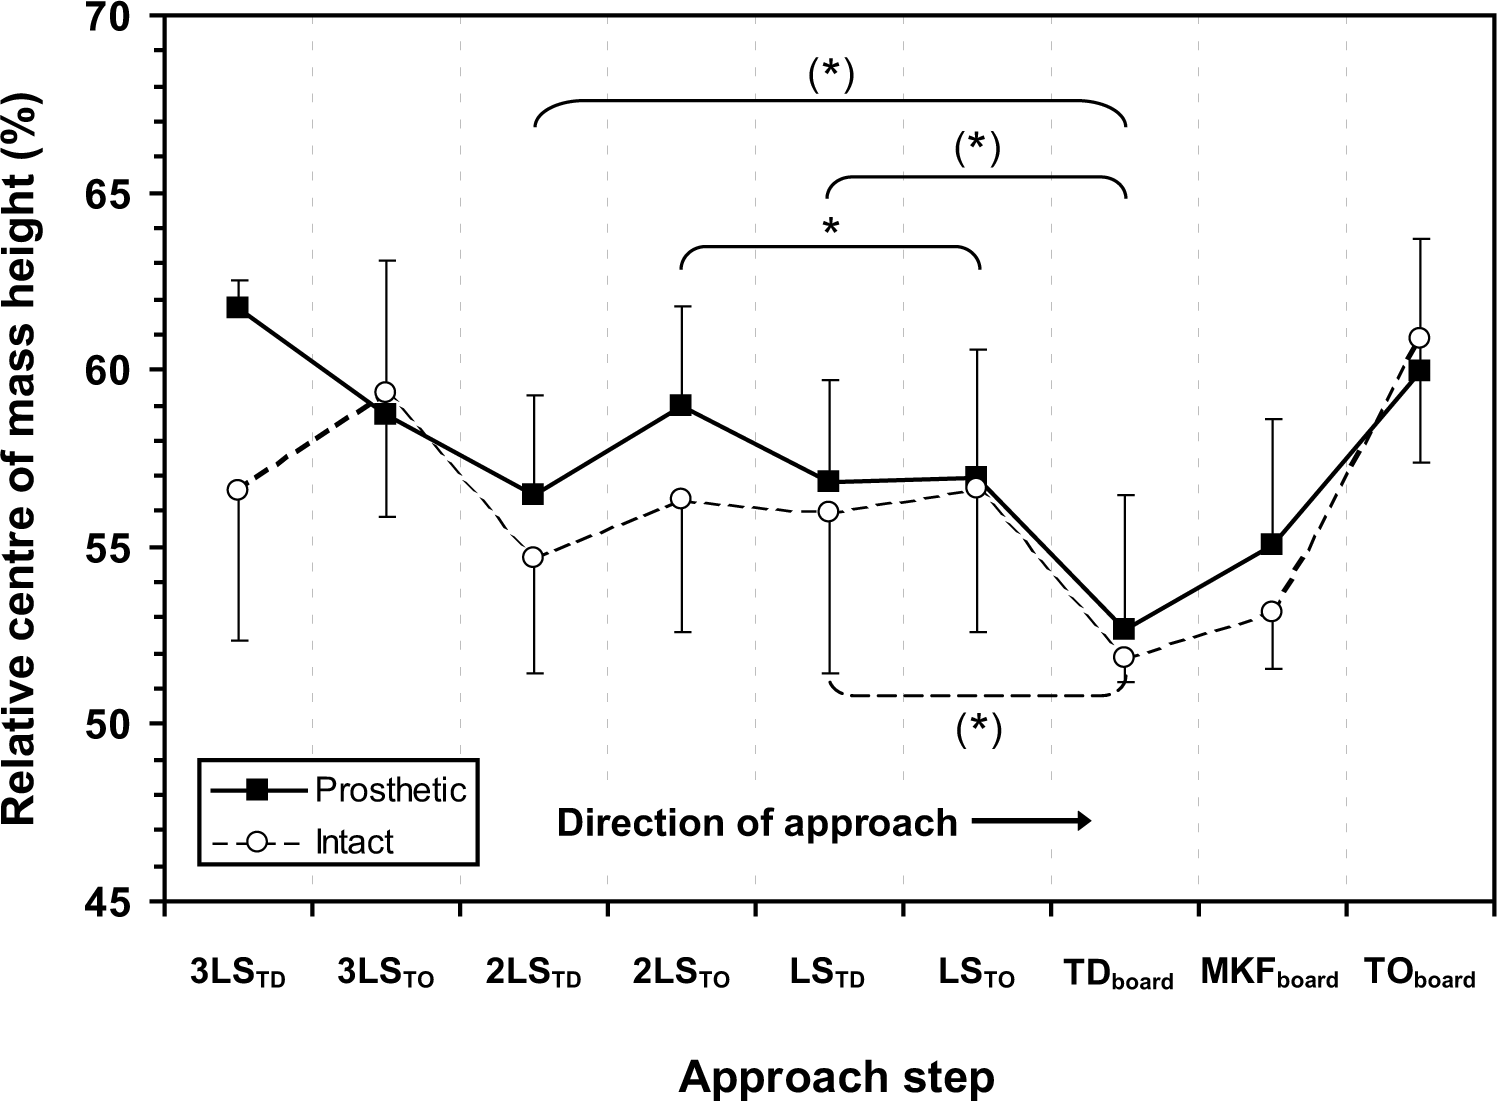
Relative centre of mass height (%HCM) from 3LSTD to TOboard for the TOprosth group (black square) and TOintact group (white circle). * indicates a significant difference and (*) a trend towards a difference. Within group differences seen between LSTD and TDboard for both groups (p = 0.080). Also, between 2LSTD and TDboard (p = 0.080) and 2LSTO and LSTO (p = 0.043) for the TOprosth group.
Joint angles
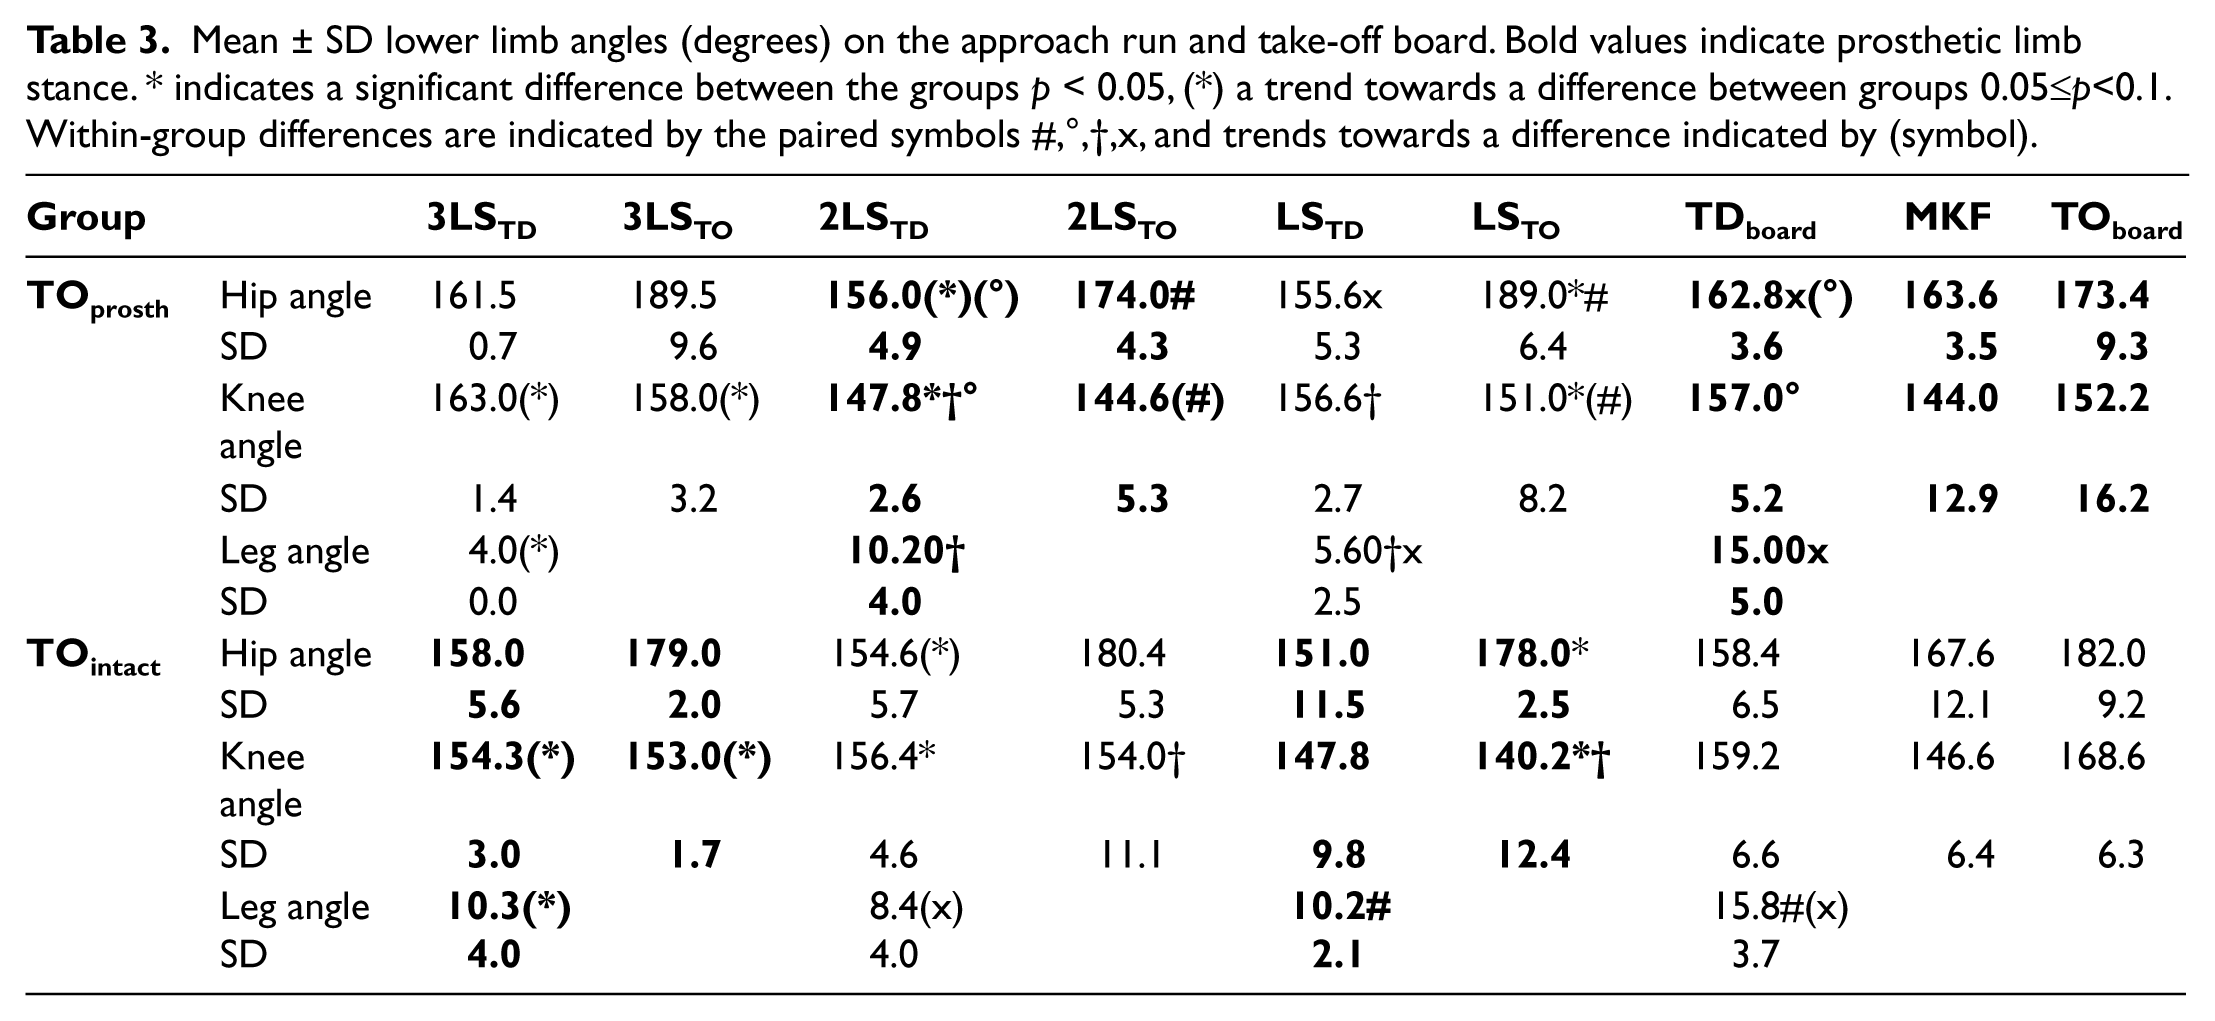
No joint angle differences were seen between the groups while they were in contact with the take-off board (Table 3). On 3LS, there was a trend towards the TOprosth group (intact limb stance) having a more extended knee (p = 0.083) and smaller leg angle (p = 0.076) at touch-down, and a more extended knee (p = 0.074) at take-off than the TOintact group. On 2LS, the TOprosth group (prosthetic limb stance) had a more flexed knee (p = 0.009) at touch-down, with a trend towards a more flexed hip angle (p = 0.076) at take-off compared to the TOintact group. On LS, the TOprosth group (intact limb stance) had a smaller leg angle (p = 0.023) at touch-down and a more extended knee (p = 0.047) and hip (p = 0.028) at take-off than the TOintact group. Thus, both groups exhibited a more ‘upright’ position touching down onto their intact limb, and a more flexed position touching down onto their prosthetic limb.
Mean ± SD lower limb angles (degrees) on the approach run and take-off board. Bold values indicate prosthetic limb stance. * indicates a significant difference between the groups p < 0.05, (*) a trend towards a difference between groups 0.05≤p<0.1. Within-group differences are indicated by the paired symbols #,°,†,x, and trends towards a difference indicated by (symbol).
This posture difference was also observed between steps for both groups. For the TOprosth group, a more extended knee (p = 0.042) and smaller leg angle (p = 0.043) on LSTD (intact limb stance) compared to 2LSTD (prosthetic limb stance), along with trend towards a more extended knee (p = 0.080) and a more extended hip (p = 0.043) at LSTO compared to 2LSTO was seen. For the TOintact group, a more extended knee (p = 0.043) angle on 2LSTO (intact limb stance) compared to LSTO (prosthetic limb stance) was seen.
At TDboard, no significant group differences in posture were seen. The TOprosth group displayed a trend towards a more extended hip angle (p = 0.083) and greater leg angle (p = 0.043) at TDboard compared to LSTD. As such, when touching down onto the board they were leaning back with a more outstretched leg than on the previous step. They also exhibited a more extended knee (p = 0.043) and trend towards a more extended hip (p = 0.074) at TDboard compared to 2LSTD, even though both of these steps were performed on their prosthetic limb. For the TOintact group, a greater leg angle (p = 0.043) at TDboard was seen compared to LSTD. The TOintact group also exhibited a trend towards a greater leg angle (p = 0.078) on TDboard than 2LSTD even though both of these steps were performed on their intact limb.
Hip ROM was smaller (p = 0.011) for the TOprosth group on the 2LS (prosthetic limb stance) compared to the TOintact group (intact limb stance) (Table 4). On the take-off board hip ROM was also smaller during TD-MKF (p = 0.034) and MKF-TOboard (p = 0.008) for the TOprosth group compared to TOintact group. Knee ROM was smaller (p = 0.009) for the TOprosth group from MKF-TOboard on the take-off board compared to the TOintact group. Thus while in contact with the take-off board, the TOprosth group exhibited reduced knee and hip ROM compared to the TOintact group.
Mean ± SD hip and knee ranges of motion (ROM, degrees) on the approach run and take-off board. Bold values indicate prosthetic limb stance. * indicates a significant difference between the groups p < 0.05, (*) a trend towards a difference between groups 0.05≤p<0.1. Within-group differences are indicated by the paired symbols #,†, and trends towards a difference indicated by (symbol).
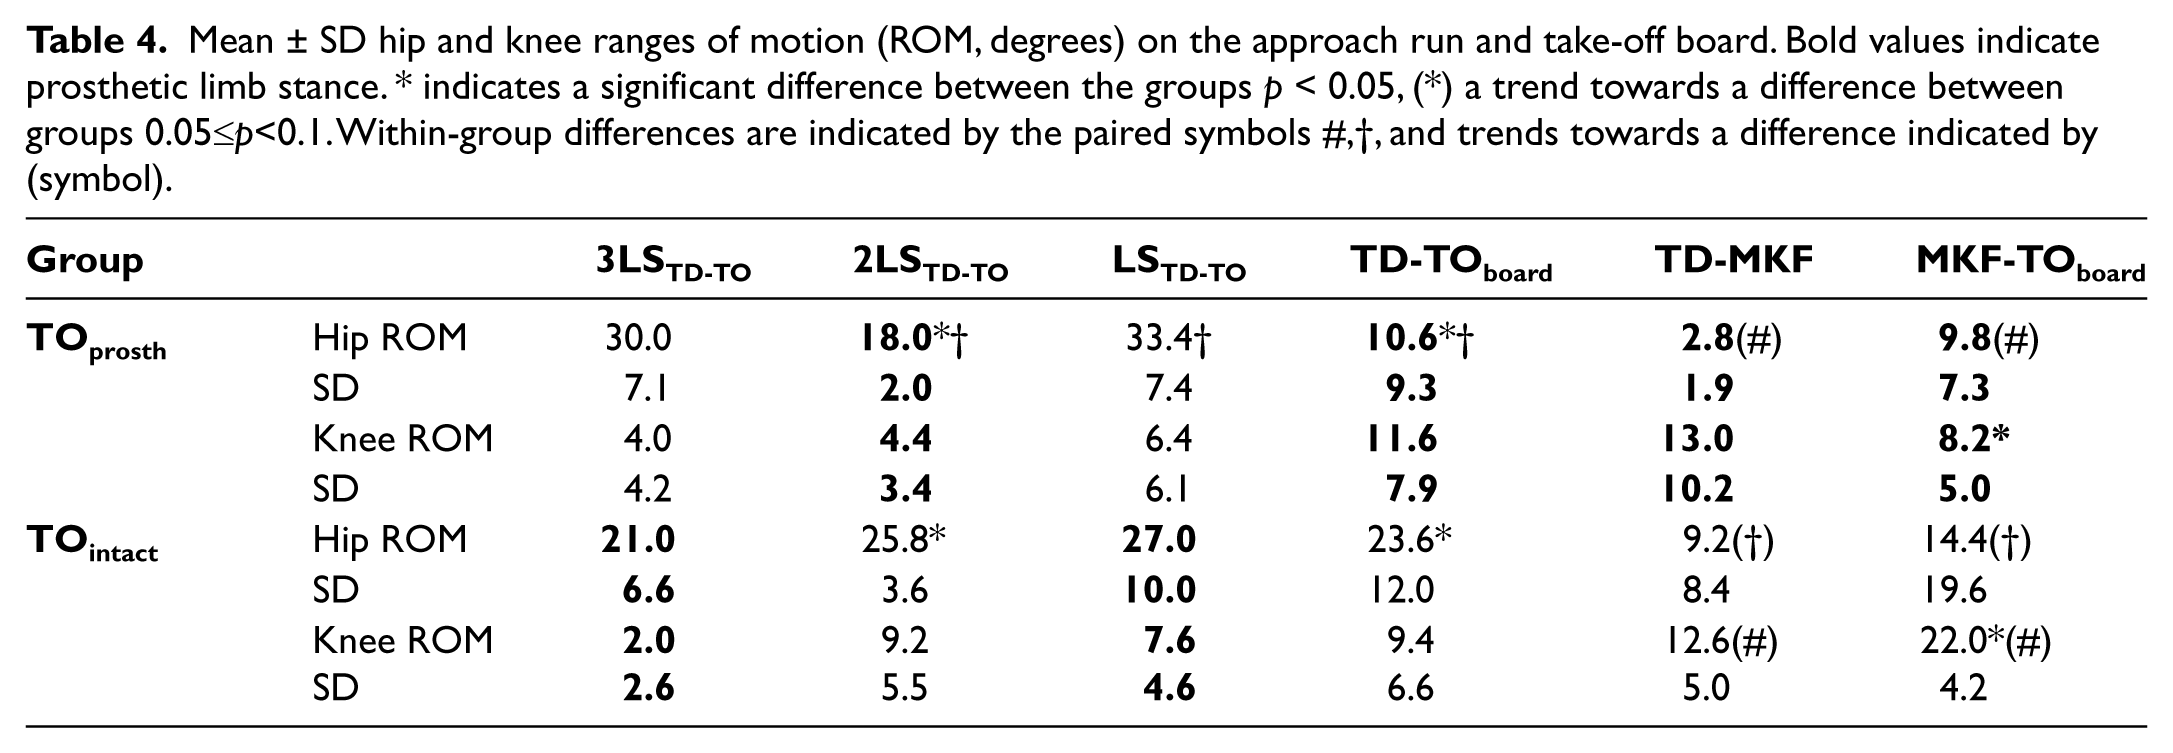
For between steps, the TOprosth group hip ROM was greater (p = 0.043) on the LS (intact limb stance) than both the 2LS and TD–TOboard (prosthetic limb stance). This group also exhibited a trend towards a larger hip ROM (p = 0.068) during MKF-TOboard compared to TD-MKF on the take-off board. The TOintact group also exhibited a trend towards a larger hip (p = 0.078) and knee ROM during MKF-TOboard compared to TD-MKF.
Step lengths, durations and foot contact
The only difference in step length between the two groups was observed when stepping 2LS–LS (Figure 6). Here, the TOprosth group tended to have a longer step length (p = 0.076) (stepping from prosthetic onto intact limb) than the TOintact group (stepping from intact to prosthetic limb). No differences were seen between the two groups in terms of step time duration.
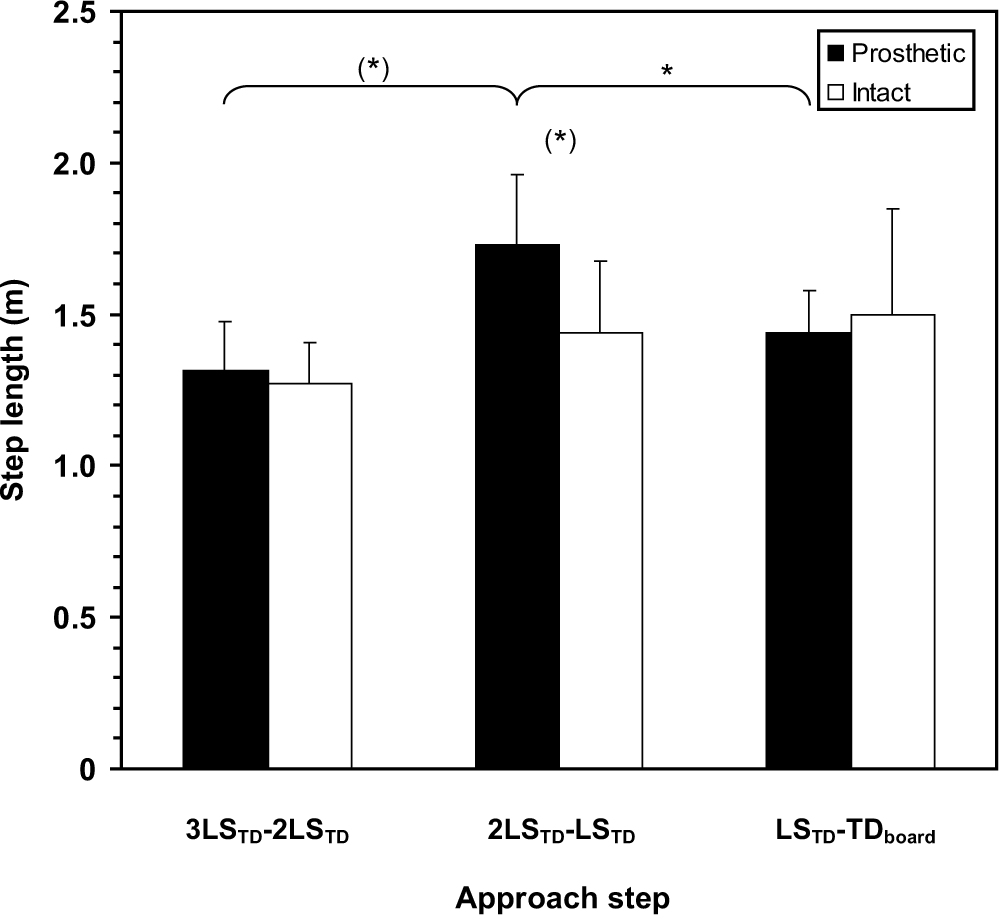
Step length on the approach run for the TOprosth group (black) and TOintact group (white). * indicates a significant difference and (*) a trend towards a difference. Between group differences seen at 2LS–LS (p = 0.076). Within group differences seen between 3LS–2LS (p = 0.068) and 2LS–LS (p = 0.043) for the TOprosth group.
For between steps, the TOprosth group had a longer (p = 0.043) 2LS–LS (prosthetic–intact limb) than LS–TDboard (intact–prosthetic limb) and a trend towards a shorter (p = 0.068) 3LS–2LS (intact–prosthetic limb) compared to both 2LS–LS and LS–TDboard. No significant differences were noted between steps for the TOintact group and no differences were seen for either group in terms of step time duration.
Foot contact time was shorter for the TOprosth group on their LS (p = 0.006) and tended to be shorter on their 3LS (p = 0.068) – both intact limb stance – compared to the TOintact group (Figure 7). For between steps, the TOprosth group had a trend towards a shorter foot contact time (p = 0.083) on LS (intact limb stance) compared to 2LS. For the TOintact group, a shorter foot contact time (p = 0.038) was seen on their 2LS (intact limb stance) compared to their LS.
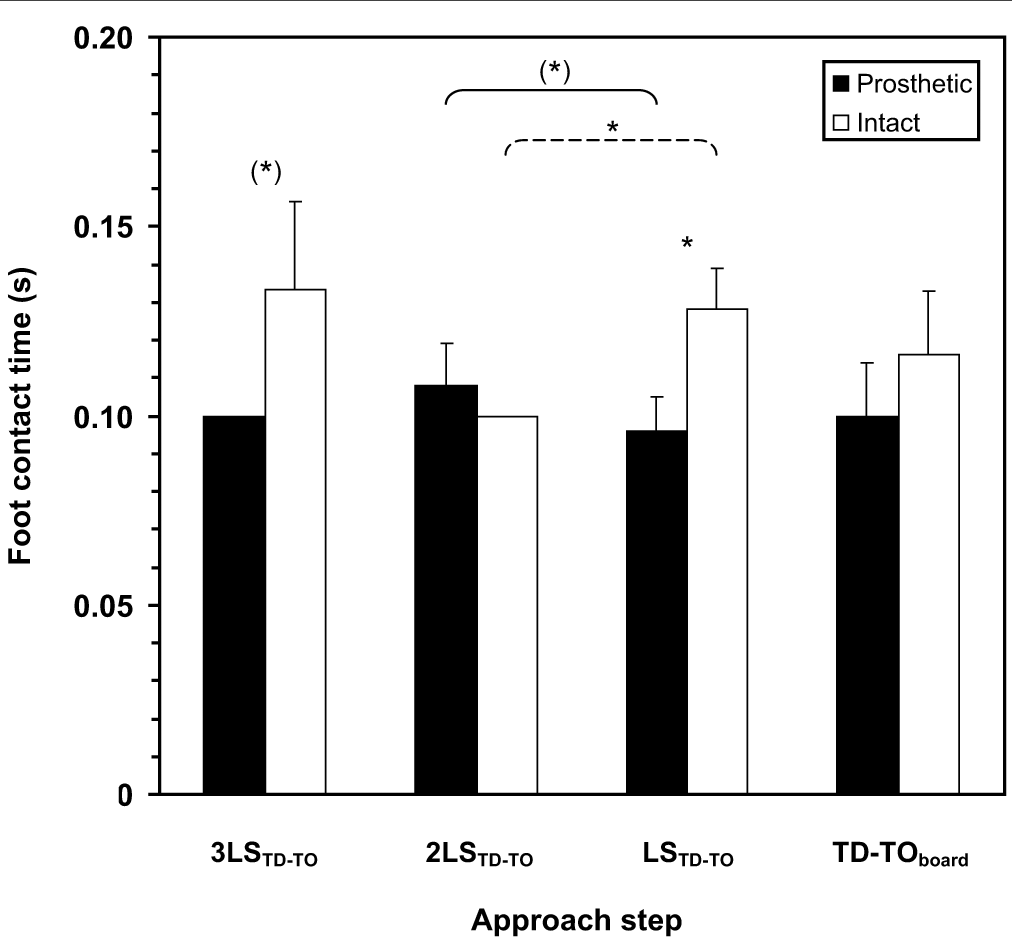
Foot contact times on the approach run for the TOprosth group (black) and TOintact group (white). For the TOprosth group (black), 3LS occurs on the intact limb, 2LS on the prosthetic limb, LS on the intact limb and TD–TO on the prosthetic limb. For the TOintact group (white), 3LS occurs on the prosthetic limb, 2LS on the intact limb, LS on the prosthetic limb and TD–TO on the intact limb. * indicates a significant difference and (*) a trend towards a difference. Between group differences seen at 3LSTD–TO (p = 0.068) and LSTD–TO (p = 0.006). Within group differences seen between 2LSTD–TO and LSTD–TO for TOprosth group (p = 0.083) and TOintact group (p = 0.038).
Discussion
The aim of this study was to investigate kinematic differences in long jump technique between athletes with a transtibial amputation who take off from their prosthetic limb and those who take off from their intact limb. As both groups exhibited similar postures and foot contact times when touching down onto the prosthetic limb, technique differences were seen on each step. While there was no significant difference found for official jump distance or approach speed between the groups, the TOprosth group jumped an average of 0.82 m further. The fact the difference was not significant was likely due to the low number of athletes in each group.
The lack of difference in running speed between the two groups is not unexpected as all athletes were competing at a similarly elite level. The horizontal approach velocity pattern is similar to that reported previously for both male and female long jumpers with a lower limb amputation.1-3 It has previously been reported that elite TT long jumpers have a greater negative vertical velocity at TDboard than elite able-bodied athletes. 1 While negative vertical velocity at touch-down was greater in the current study compared to elite able-bodied athletes 11 , no significant difference in vertical velocity at TDboard was seen between the groups (mean ± SD TOprosth = -0.20 ± 0.1 m.s−1, TOintact = -0.26 ± 0.23 m.s−1). If the residual limb/prosthesis was responsible for a lack of control at TDboard, a greater disparity in negative vertical velocity would likely have been seen. Thus taking off from the prosthetic limb does not appear to be a disadvantage in terms of lack of control of the residual limb.
High negative vertical velocity at TDboard stems from lowering the %HCM between LS and TDboard. To avoid this or to reduce the negative vertical velocity as much as possible, able-bodied long jumpers tend to lower their CM on 2LS-LS either by taking a longer step or increasing knee flexion.10, 12–14 It has been shown previously that TT athletes do not only lower their %HCM 2LS–LS, but also continue to lower it from LS–TDboard. 2 There were no significant differences between groups in terms of %HCM from 2LS–TDboard, with both groups lowering their %HCM significantly from LS–TDboard. This was despite using different take-off limbs which suggests that there is no disadvantage for athletes with a transtibial amputation to take-off from their prosthetic limb. On the contrary, as landing onto, and taking off from, their intact limb (LS) should not be a problem, athletes who take off from their prosthetic limb could be purposefully decreasing their %HCM between LS–TDboard thereby creating a greater negative vertical velocity in order to gain an advantage from rapidly loading and unloading their carbon fibre prosthetic foot.
Both groups exhibited a different body posture at TDboard than at TD on the previous steps. This posture was similar to that used by elite able-bodied long jumpers – a more extended hip and knee and greater leg angle.10–12,14 What the groups did next, however, showed a marked difference in technique while on the take-off board. The vertical velocity gain TD–TO
Another difference in technique used during TD–TOboard was observed. For the TOprosth group, hip ROM was significantly smaller, less than half that of the TOintact group, indicating that those who take off from their prosthetic limb do not need to rely heavily on the hip muscles to compensate for the partial loss of the limb observed during walking, running and jumping.1,4,15–16 Interestingly, the groups showed a very similar knee ROM TD–TOboard, but the TOprosth group exhibited significantly less knee ROM MKF-TOboard indicating that they may be stiffening their knee and using their prosthetic limb more like a ‘springboard’ than relying on the hip and knee extension seen in the TOintact athletes. Due to these differences, it is recommended that TT long jumpers be grouped by take-off limb in future studies.
A limitation of the study was the low subject numbers involved. However, as the athletes were filmed during competition finals and there were no semi finals, it was not possible to perform this study with a larger cohort of athletes. Even with such small numbers, significant differences and technique differences between the two groups were noted. While these present results should be used as preliminary findings on which to base further research, the results of this study provide useful insights into differing long jump techniques due to choice of take-off limb, where little data has previously been reported.
Conclusions
Differences in long jump technique are seen depending on whether the prosthetic or intact limb is used at take-off. The TOprosth athletes ‘stiffen’ their knee and use their prosthetic limb as a ‘springboard’, avoiding having to increase hip ROM, a compensation seen in TOintact athletes. It is not known, however, which technique is more advantageous. Further study where athletes swap take-off limb for comparison purposes is recommended. In addition, future studies should group TT long jumpers according to choice of take-off limb.
Footnotes
Funding
This research received no specific grant from any funding agency in the public, commercial, or not-for-profit sectors.
Conflict of interest
The authors declare that there is no conflict of interest.