
Abstract
Background: The term ‘sock ply’ may be a source of confusion in prosthetics practice because there may not be a consistent relationship between sock ply and sock thickness.
Objectives: The purpose of this study was to characterize how sock ply related to sock thickness for different sock materials commonly used in limb prosthetics. We also evaluated how sock thickness changed under loading conditions experienced while wearing a lower limb prosthesis compared with unstressed conditions.
Study Design: Experimental. Mechanical assessment.
Methods: Seven sock materials of varying ply and sheaths were tested using a custom instrument. Sock thickness under eight different compressive stress conditions and two different biaxial in-plane tensile strain conditions were measured.
Results: For socks woven from a single material, thickness under walking stance phase conditions averaged 0.7, 1.2 and 1.5 mm for 1, 3 and 5-ply, respectively. For socks woven from several materials, the corresponding results were 0.4, 0.7 and 0.8 mm, respectively. Sock ply did not sum, e.g. a 3-ply sock was not three times the thickness of a 1-ply sock.
Conclusions: Sock thickness and compressive stiffness are strongly dependent upon sock material, interface pressure, and in-plane biaxial strain.
Data may be useful towards selecting socks during fitting and towards understanding volume changes induced by adding socks. An alternative nomenclature for thickness based on sheath equivalence may be more intuitive to practitioners and to the industry.
Background
Sock thickness is important for people using prosthetic limbs because it is a factor controlling prosthetic fit. People with limb loss commonly adjust sock ply during the day to accommodate residual limb volume loss. 1
Manufacturers of amputee socks usually characterize their products by ply. Ply is a term that was developed in the textile industry when most knitting was done with one material, wool. Wool was spun into yarn of a consistent thickness. The industry developed a convention for material made from this yarn and termed it 1 ply (Figure 1A). 2 A technical definition of ply is the number of single yarns twisted together to make a fiber-like material (Figure 1B). This material is subsequently woven into sock fabric (e.g. Figure 1C). Thus a fabric made with 2 ply will have twice as much material per unit length as a fabric made with 1 ply.
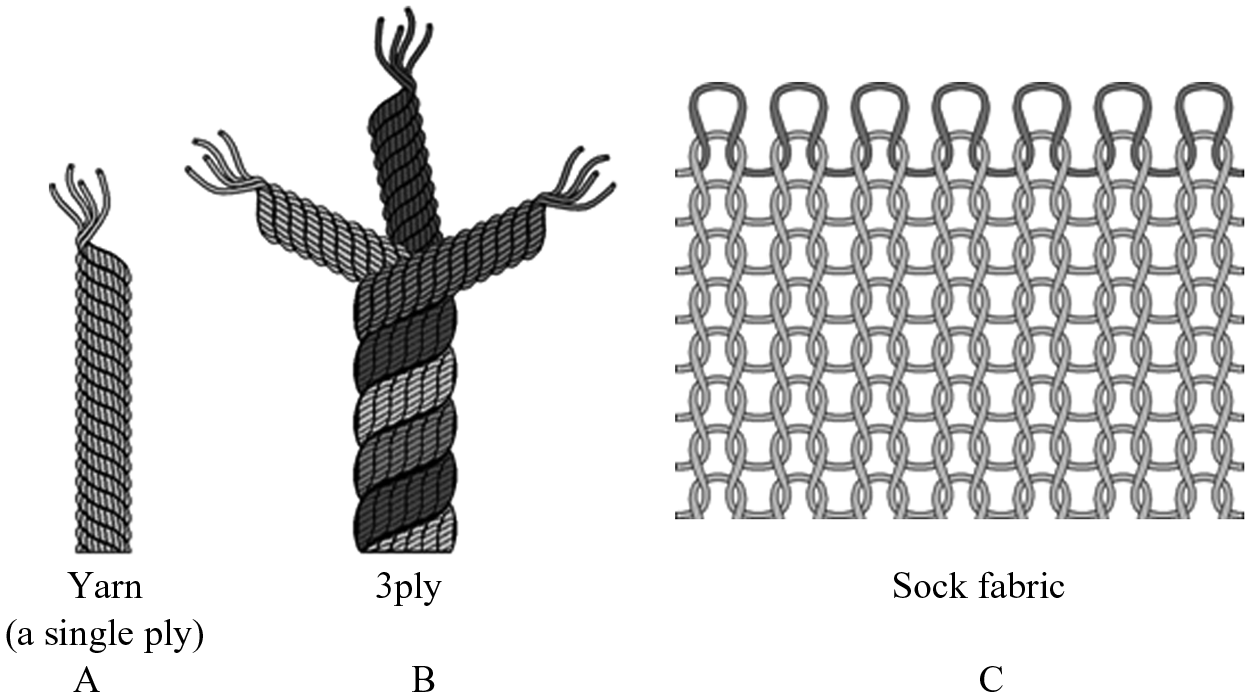
Sock architecture. (A) Yarn is a single ply. (B) One architecture for a 3-ply sock. Three single plies are twisted together in a helical pattern. (C) Sock fabric woven from a 3-ply material. The top is a different color from other rows so that the material path can be clearly seen.
Since the time wool dominated the fabric industry, many new materials have been introduced (e.g. cotton, polyester blends). These new materials typically have different thread counts and different yard-per-pound measures from wool. Thus 1 ply of the new materials is not the same thickness as 1 ply of wool. 3 This variability makes the meaning of amputee sock ply confusing, particularly for young prosthetists who are not familiar with the different materials and blends. The fit of a patient’s socket with a 3-ply sock, for example, may be different for wool vs. a blend. A further challenge is that sock thickness reduces upon donning as a result of the circumferential strain from stretching the sock over the residual limb, tensile strain applied to pull it up and keep it taut during ambulation, as well as the compression applied during weight bearing. It is unclear how the thickness of a sock straight out of the package is related to that while being worn during ambulation.
The purpose of this research was to measure thickness of amputee socks of different material and ply, and to investigate relationships between sock ply and sock thickness. By reporting these results we aim to facilitate understanding of the meaning of sock ply towards clinical fit. An additional goal was to characterize how sock thickness changed under loading conditions experienced while a person with limb amputation walked in a prosthesis. Results from this investigation led us to propose a new nomenclature for sock thickness that may be more intuitive to practitioners and to the industry.
Methods
Seven different models of prosthetic socks were tested (Table 1). All were new and sent directly from the manufacturer (Knit-Rite, Inc.). Upon opening the package, we placed the sock flat on a table in an unstressed state and with a fine-tip pen inked a thin 12.7 x 12.7 mm black square onto its proximal (upper 1/3) outside surface away from the seam. We used the inked square as a tensile strain reference while preparing the sample in the testing apparatus described below. Three samples of each of the 26 model/ply combinations and a sheath (DAW Industries) listed in Table 1 were tested. All samples were maintained in their package and not put under mechanical stress until the start of the test.
Sock models and ply tested.
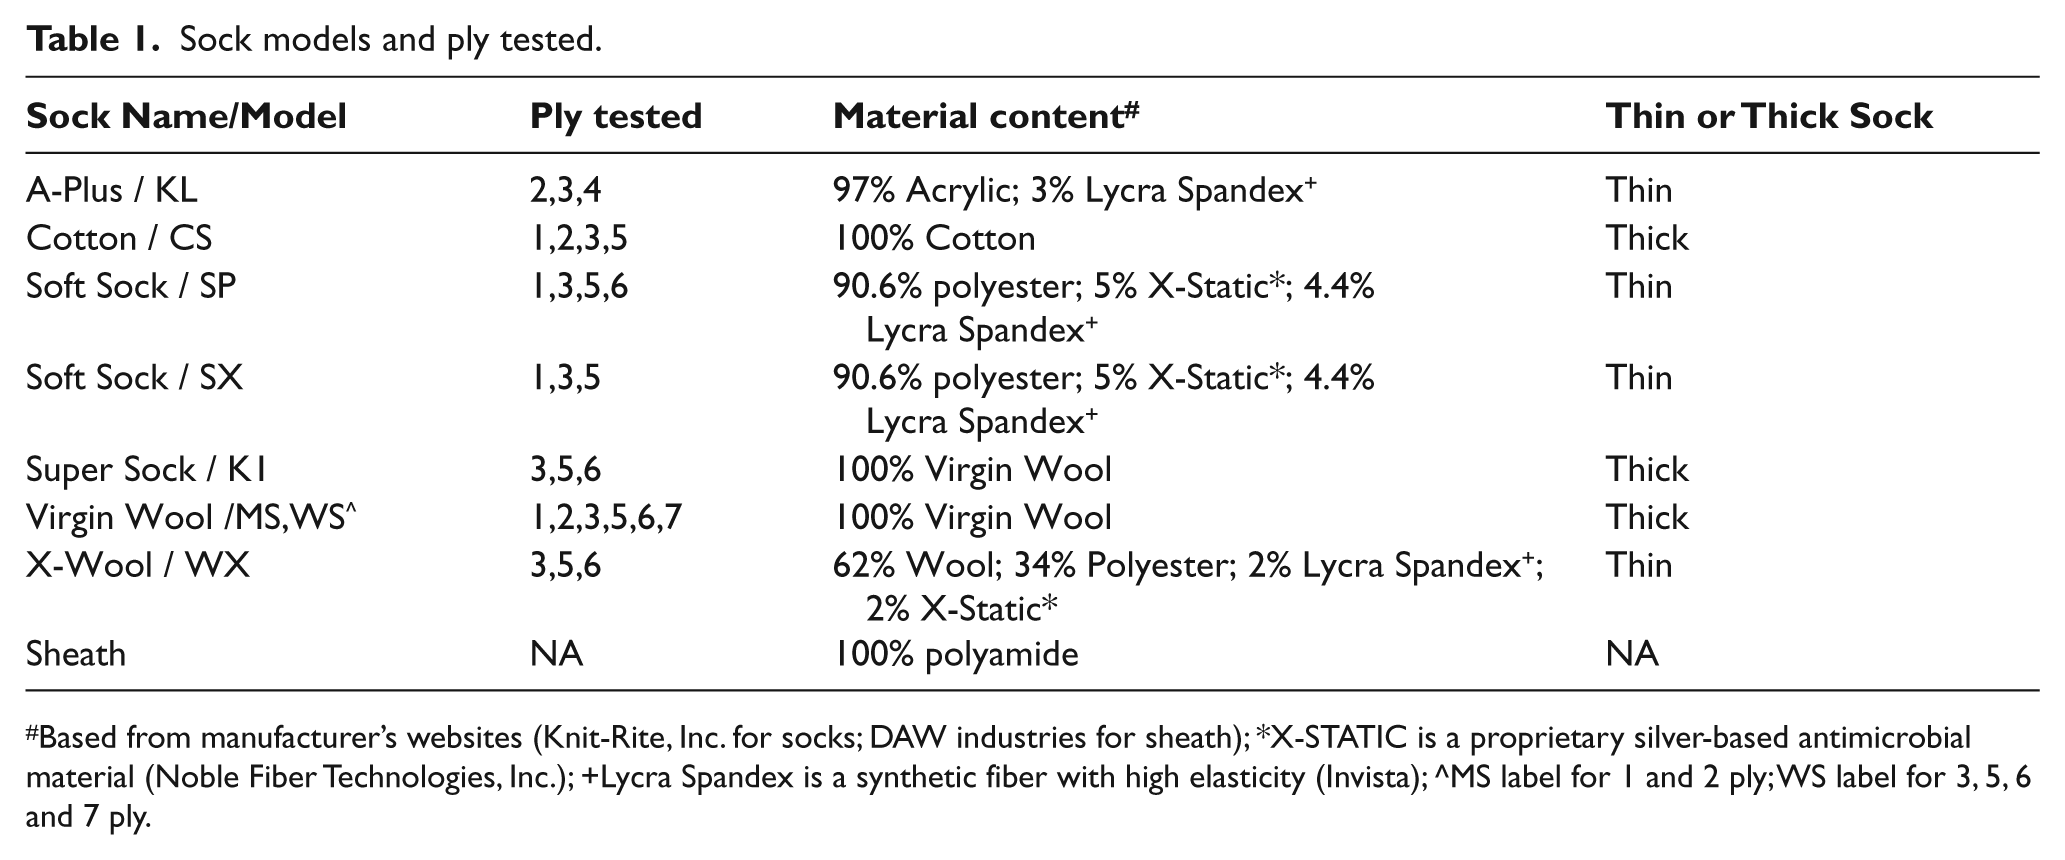
Based from manufacturer’s websites (Knit-Rite, Inc. for socks; DAW industries for sheath); *X-STATIC is a proprietary silver-based antimicrobial material (Noble Fiber Technologies, Inc.); +Lycra Spandex is a synthetic fiber with high elasticity (Invista); ^MS label for 1 and 2 ply; WS label for 3, 5, 6 and 7 ply.
We developed a custom instrument to measure sock thickness. An inductive position sensor (IPS) (BAWM12MF2-UAC40F-BP00, 2-GS04, Balluff) was threaded into a M12 x 1 mm hole in an aluminum base so that it was flush with the surface (Figure 2). The IPS had a linear range of 1 to 4 mm and non-linearity of less than 0.09 mm. The axis of the IPS was perpendicular to the vertical axis of a plunger assembly positioned above the base. The plunger assembly was a 20.0 mm diameter steel disk fastened to a precision, 12.7 mm diameter, steel-ground, low friction shaft (1240K11, McMaster-Carr). The shaft extended through a pillow block (8649T3, McMaster-Carr) mounted to the frame (frame not shown) so that the shaft could displace only in the z-direction. An aluminum support affixed to the top of the shaft supported custom brass weights that slotted onto the support’s 12.7 mm diameter segment (weights not shown). The weights were ridged at their outer edge so that they interlocked with each other when stacked and did not apply off-axis load to the shaft. One 200.7 g and seven 405.4 (sd = 0.5) g mass weights (11.1 cm diameter) were used. Data from the IPS were acquired through a data acquisition system (NI USB-6009, National Instruments; Latitude D620, Dell) running a custom virtual instrument in Labview (v8.5, National Instruments) at a 464 Hz sampling rate. The system displayed data in real time to the experimenter, and also stored the data onto a disk. The signal was also displayed on a digital multi-meter. The system was allowed 30 minutes to warm up before each day’s data collection was initiated.
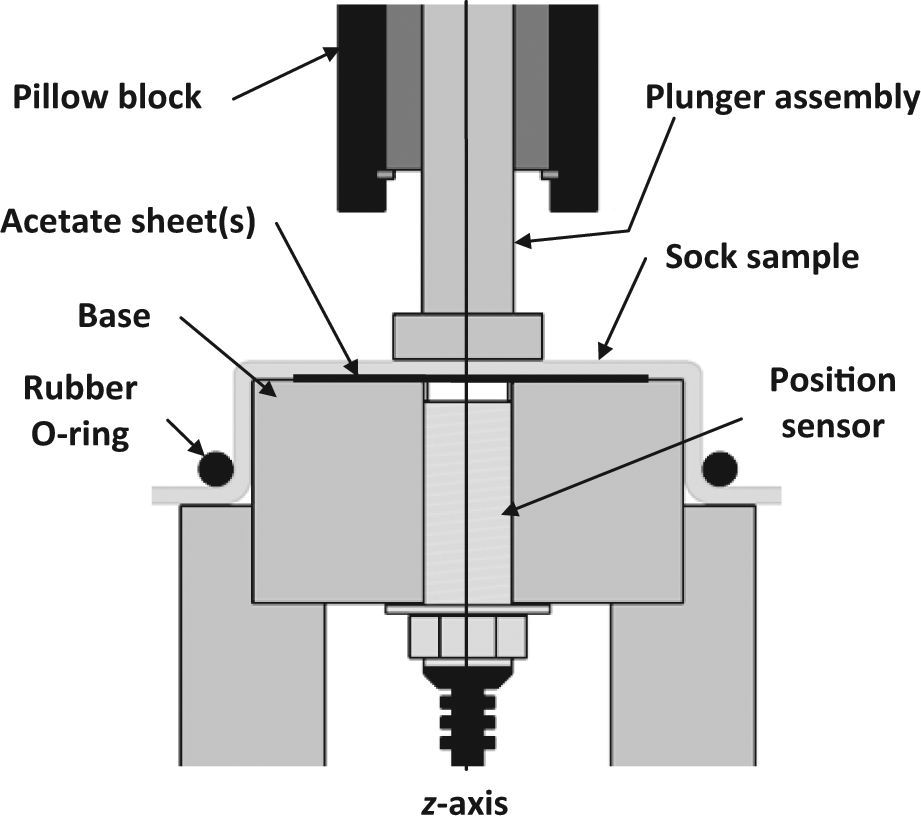
Schematic of the test system.
The IPS had good sensitivity for measurement of sock thickness change under load, but its performance was more prone to error outside of the central 2.25 mm region of measurement. Therefore, a different instrument, an electronic height gauge (EHG) (570-212, Mitutoyo), was used to measure initial sock thickness using the procedure described below, and the IPS was used to measure change in thickness from load. The EHG used an absolute, electrostatic capacitance-type, linear encoder for sensing and had a resolution of 0.01 mm and repeatability of 0.01 mm. To ensure the distance between the IPS and the steel disk (bottom of the plunger assembly) was within the range of the IPS, 0, 1 or 3 acetate sheets of 0.25 mm thickness were placed between the base and the sock. Seven acetate sheets were used when testing sheaths. Calibration tests were conducted to account for any effect of acetate sheet presence on the measurement from the IPS.
A calibration curve was created to map sensitivity over the range of operational output for the IPS. The acetate sheets did not distort the IPS measurement thus all calibration data were combined into one curve. Measurements from the EHG were used as a calibration reference. A total of 205 calibration points well distributed over the thickness range of interest were collected. A sixth order polynomial was used to fit the data to determine the relationship between change in IPS voltage and change in sample thickness measured with the EHG.
The IPS had a sensitivity of 4.49 V/mm within the central section (region of most linear output). The sixth order polynomial well characterized its performance, resulting in low measurement error (RMS error 0.04 mm).
At the outset of a test, the sock was positioned on the surface of the base and held in place at the edge using a 5.4 cm inner diameter, nitrile rubber, O-ring (2418T222, McMaster-Carr) (Figure 2). The sock was positioned so that the inked square was in the center of the ring and over the IPS. The sock was stretched to accomplish one of three in-plane biaxial strain conditions: (1) 0% strain (unstretched) (inked square of dimension 12.7 x 12.7 mm); (2) 60% strain (inked square of dimension 20.3 x 20.3 mm); (3) 20% strain (inked square of dimension 15.2 x 15.2 mm). Conditions (2) and (3) reflected strains in socks worn by prosthesis users. A value of 60% was selected based on tests conducted using a blend sock (Soft Sock-A-SP-1) on a group of 20 subjects with trans-tibial amputation. Strains in the sock after donning compared with those before donning were determined by measuring distances between pairs of dots spaced at 12.7 mm distances inked on the mid-limb section of the sock. The sock was worn over the outside of the subject’s liner, as is typically done in clinical practice. We found that tangential strains and vertical strains were comparable to each other and averaged 63% (sd = 22%). Twenty per cent strain was used for cotton, Super Socks, and virgin wool because this was the common maximum strain we could induce in all of these materials when in the test system. Use of this strain was considered appropriate because we expected that if thickness results were relatively insensitive to 20% strain then lower strains would likewise have minimal impact on the data.
After the sock was set up on the base, the experimenter lowered the plunger assembly (150.6 g) so that the 20.0 mm diameter steel disk contacted the sock surface. A single load cycle (< 99.6 kPa applied pressure) was manually applied to the plunger to ensure that the plunger was well seated on the sock material. A single load cycle was applied as opposed to multiple cycles because we were interested in sock thickness straight out of the package. Multiple pre-conditioning cycles would have reduced sock thickness. Then the EHG was brought near the top of the steel disk and lowered in 0.01 mm increments until a drop in voltage was noted on the digital multi-meter. This measurement was subtracted from the EHG height when no sock was present (acetate sheets left in place), taken before the sock was put on to the base, to determine initial sock thickness. The virtual instrument was started, then after 10 seconds a 200.7 g mass was added to the support, taking care to minimize impulsive loads applied to the plunger which would have induced oscillations in the measurement. After 10 seconds, a 405.4 g mass was added. Additional 405.4 (sd = 0.5) g masses were added at 10 second intervals until the total weight reached 3188.9 g. Assuming the load was uniformly distributed on the bottom of the 20.0 mm diameter steel disk, 3188.9 g resulted in a pressure of 99.6 kPa. Then the weights were removed sequentially in the reverse order at 10 second intervals. Data acquisition was terminated and the IPS data saved to disk. The sock was removed and then repositioned in the test fixture under the strained test condition (60% or 20%), and then the test procedure was repeated.
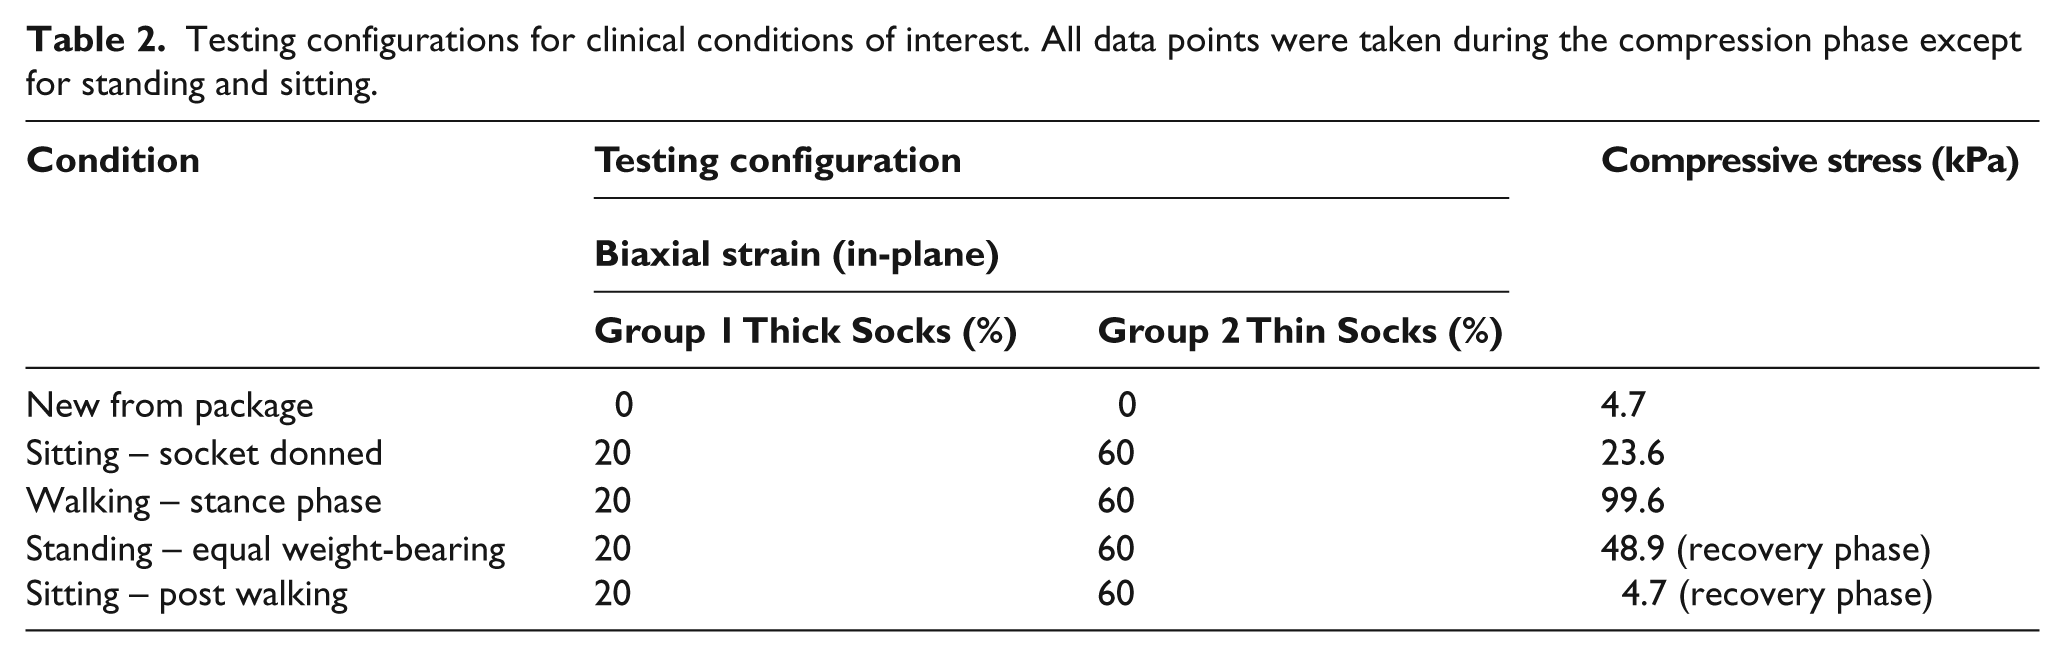
The sample thickness measured with the EHG at the outset of testing (under compression from the compressive stress of the plunger (4.7 kPa)) was defined as the initial thickness. Data from the IPS were referenced to this value. For each 10 second loading interval, a data point after the IPS measurement stabilized was selected, typically at ~4 s. A compressive stress vs. compressive strain curve was generated for each sample, and then the values at select points reflecting clinical conditions of interest (Table 2) used in analysis. The chosen compressive stresses reflected interface stress measurements reported in the literature for sitting, standing and walking conditions.4-6
Testing configurations for clinical conditions of interest. All data points were taken during the compression phase except for standing and sitting.
Results
Straight out of the package, socks of the same ply were of comparable thickness (left sets of columns, Figures 3A–C) with two exceptions: virgin wool, which tended to be thicker than average at medium to high ply (>3 ply); and cotton, which tended to be thinner than average at low to medium ply (<3 ply). For all socks tested, mean thickness straight out of the package were: 1.6 (sd = 0.4) mm for 1 ply; 2.3 (sd = 0.3) mm for 3 ply; and 2.6 (sd = 0.3) mm for 5 ply.
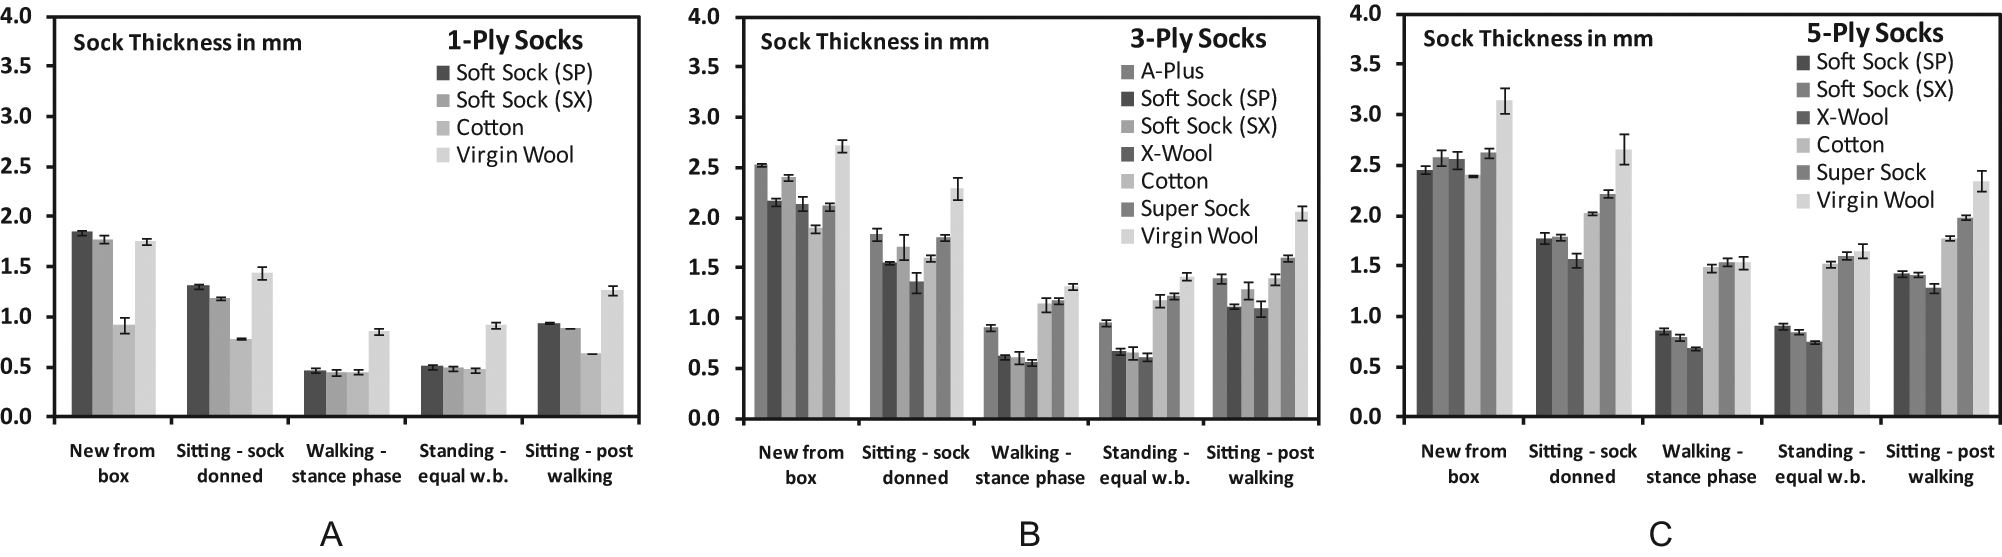
Sock thickness results for 1, 3 and 5 ply. Means and standard deviations (error bars) are shown for each material. Vertical axes are thickness in mm. The testing configurations listed on the x-axes are defined in Table 2.
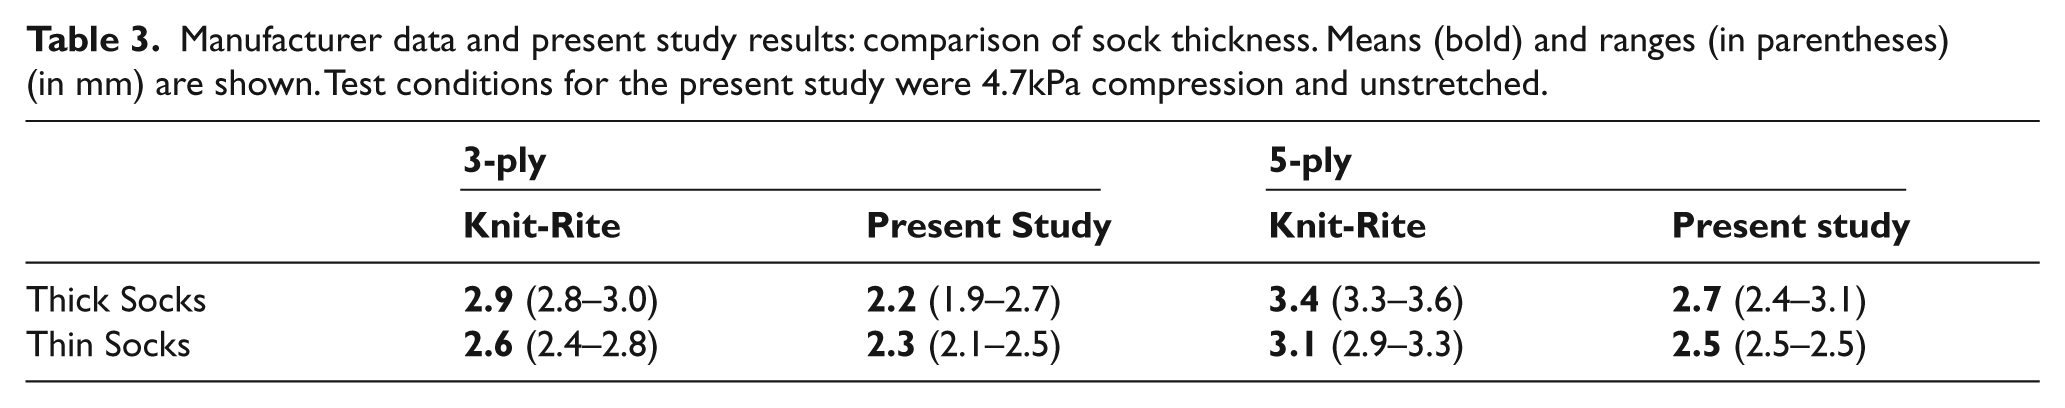
Samples tested straight out of the package were thinner than listed in the manufacturer’s product datasheet. Knit-Rite classified their socks into two groups according to material content. Group 1, which we term here ‘Thick Socks,’ included socks woven from a single material. They included cotton, Super Sock, and, virgin wool. Group 2, which we term here ‘Thin Socks,’ were socks woven from several materials, with Lycra Spandex a common component. Lycra Spandex is a synthetic fiber with high elasticity. Thus Thin Socks stretched easier than Thick Socks. Group 2 socks included A-Plus, Soft Sock SP, Soft Sock SX, and X-Wool. When we divided socks into these groups, our ‘initial thickness’ results (under 4.7 kPa compression) averaged 14% less than Knit-Rite’s data sheet (using the low ends of the thickness ranges provided by Knit-Rite) (Table 3). The difference may reflect the 4.7 kPa pressure we applied compared with Knit-Rite’s loading condition, which may have been a lower compressive stress. Our testing strategy was similar to ASTM D1777-96. 7 Alternatively, the differences may have resulted from sock compression during packaging and transport. We made this comparison only for 3- and 5-ply socks because they were the sizes for which we had samples for most materials.
Manufacturer data and present study results: comparison of sock thickness. Means (bold) and ranges (in parentheses) (in mm) are shown. Test conditions for the present study were 4.7kPa compression and unstretched.
Thickness changed appreciably when the socks were mechanically stressed. In general, for standing and walking loading conditions (Table 2), socks of comparable ply were not of the same thickness but instead delineated into the two groups stated above. Thick Socks averaged 0.7 (sd = 0.3) mm for 1 ply; 1.2 (sd = 0.1) mm for 3 ply; and 1.5 (sd = 0.0) mm for 5 ply, under ‘walking stance phase’ conditions. Thin Socks averaged 0.4 (sd = 0.1) mm for 1 ply; 0.7 (sd = 0.2) mm for 3 ply; and 0.8 (sd = 0.1) mm for 5 ply, under ‘walking stance phase’ conditions. Thus Thick Socks were about 80% thicker than Thin Socks.
The socks reduced in thickness under greater compression, but thickness did not decrease in proportion to pressure. Pressure-thickness curves demonstrated much more thickness reduction under low pressure than high pressure (Figure 4). The change in thickness between 0.0 kPa and 23.6 kPa (24% of maximum stress) averaged 50% (range 42–68%) of the total change. The change in thickness for 48.9 kPa to 99.6 kPa (49–100% of maximum stress), stresses representative of standing or walking conditions, averaged 24% (range 14–35%) of the total change. The curve for loading was not the same as that for unloading (Figure 4).
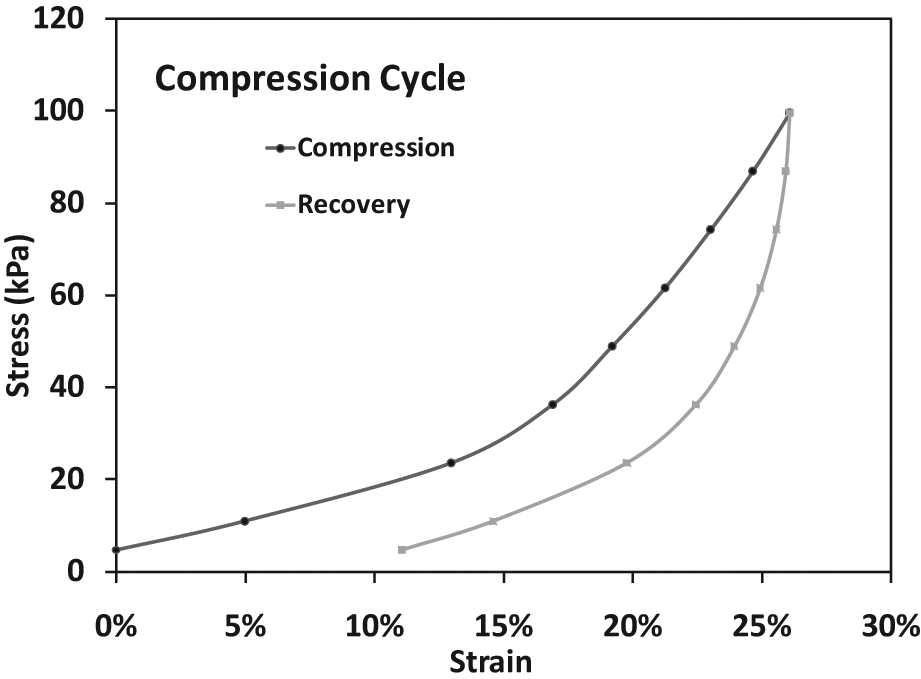
Typical stress-strain result. Socks compressed more at low stress than at high stress and exhibited hysteresis (A-plus, 3-ply sock).
Compared with straight out of the package, materials subjected to compression (99.6 kPa) were thinner for Thick Socks by an average of 47% (sd = 3%) for 1 ply; 36% (sd = 5%) for 3 ply; and 36% (sd = 5%) for 5 ply. These mean percentage differences corresponded to thickness differences of 0.6 mm, 0.8 mm and 1.0 mm, respectively. Thin Socks subjected to compression compared with straight out of the package were thinner by an average of 31% (sd = 4%) for 1 ply; 31% (sd = 4%) for 3 ply; and 30% (sd = 5%) for 5 ply. These mean percentage differences corresponded to thickness differences of 0.6 mm, 0.7 mm and 0.8 mm, respectively.
To put on a sock, a person using a lower limb prosthesis typically stretches the sock around the residual limb and pulls it up the thigh. This action puts the sock under biaxial in-plane tensile strain. In the present study, biaxial strain (stretching in the plane of the sock surface) affected sock thickness response to compression (loading perpendicular to the sock surface). When Thin Socks were tested under biaxial strain, they compressed significantly more than when subjected to compression without biaxial in-plane strain. The average change in thickness for compression with biaxial strain vs. compression without biaxial strain for Thin Socks was: 32% (sd = 6%) for 1 ply; 28% (sd = 5%) for 3 ply; and 25% (sd = 4%) for 5 ply (Figure 5). Mean percentage differences corresponded to thickness differences of 0.2 mm, 0.2 mm, and 0.2 mm, respectively. Thick Socks showed minimal dependence on presence of biaxial in-plane strain. The average change in thickness for compression with biaxial strain vs. compression without biaxial strain for Thick Socks was: −6% (sd = 2%) for 1 ply, < −1% (sd = 3%) for 3 ply, and −3% (sd = 3%) for 5 ply socks (Figure 5). Mean percentage differences corresponded to thickness differences of −0.2 mm, −0.1 mm, and −0.2 mm, respectively. The differences were less than zero because the tensioned socks compressed less than the untensioned socks but their initial thickness were also less.
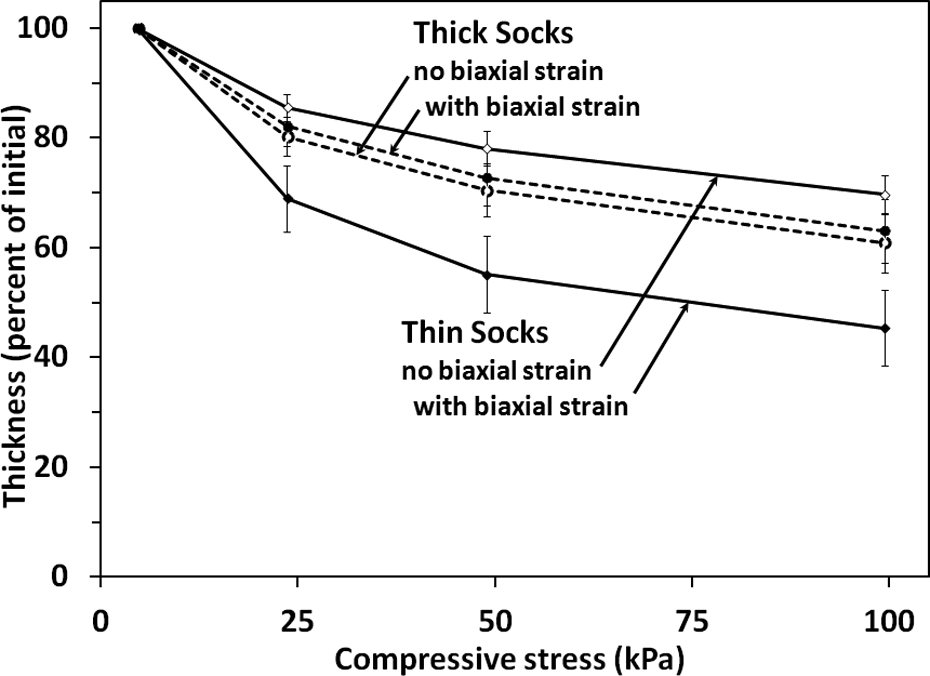
Thickness loss: dependence on presence of biaxial strain. Thin sock thickness loss increased when in-plane biaxial strain was present but thick sock thickness loss did not.
Computational mechanical models (e.g. finite element models) may facilitate understanding of how sock changes affect mechanical pressures and shear stresses at the limb-socket interface, helping practitioners with volume accommodation prescriptions. To facilitate this future effort, we fit our data to models to relate the variables. We used the orders of polynomials shown in the Appendix to accomplish an average RMS error of 0.02 mm (range 0.00 mm to 0.06 mm), just under the resolution limit of the IPS.
When we plotted mean thickness vs. ply under walking stance phase conditions for the two sock groups, Thin Socks and Thick Socks, for 1, 3 and 5 ply, linear fits to the data did not go through the origin (0,0) (Figure 6). Thus sock ply did not sum. A 3-ply sock was not three times the thickness of a 1-ply sock, and a 5-ply sock was not the sum of a 3-ply and two 1-ply socks. The sum thickness of multiple socks overestimated ply.
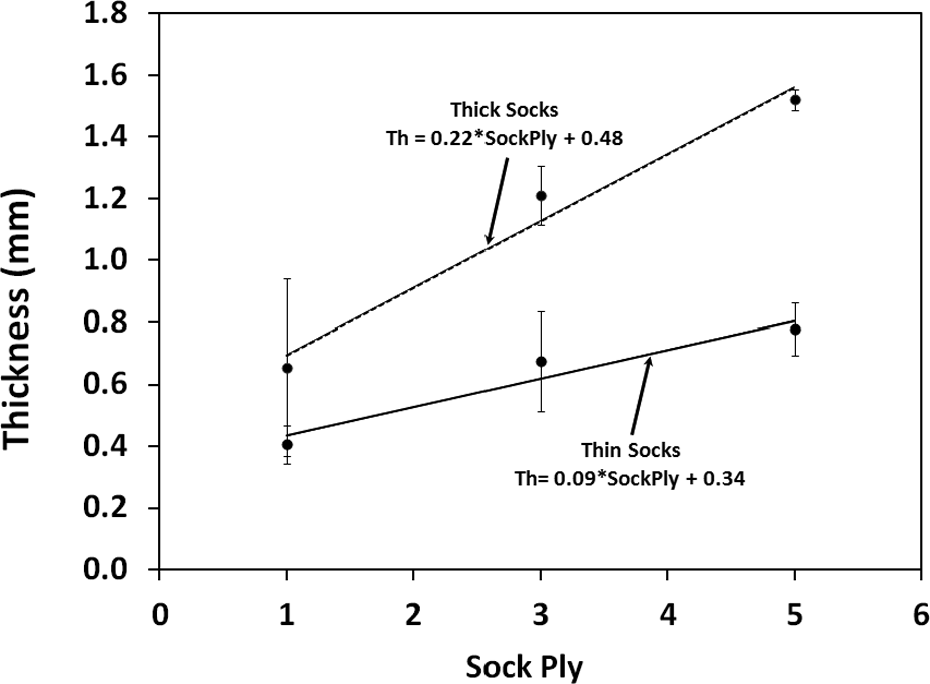
Sock ply did not sum. Results from walking stance phase loading conditions are shown. A 3-ply sock was not three times the thickness of a 1-ply sock, and a 5-ply sock was not the sum of a 3-ply and two 1-ply socks.
Sheaths were much thinner than socks. A new sheath straight out of the package averaged 0.3 (sd = 0.0) mm thickness. Its thickness under compression only (99.6 kPa) was 0.2 (sd = 0.0) mm, and under walking conditions (99.6 kPa compression with biaxial in-plane tensile strain (20%)) was 0.2 (sd = 0.0) mm. We defined ‘1 sheath equivalent’ as mean sheath thickness under walking conditions, 0.2 mm.
To present the results in a format for use in clinical prescription, we grouped the walking condition test results by material (Figure 7). Three horizontal scales are shown at the bottom of the figure: thickness in mm, number of sheaths (termed ‘sheath equivalence’), and number of cotton socks (termed ‘1-ply cotton equivalence’). The latter two axes provide clinically familiar references, which may facilitate practitioner interpretation of the results. These graphs may be useful to practitioners making decisions on which sock ply to prescribe to a patient.
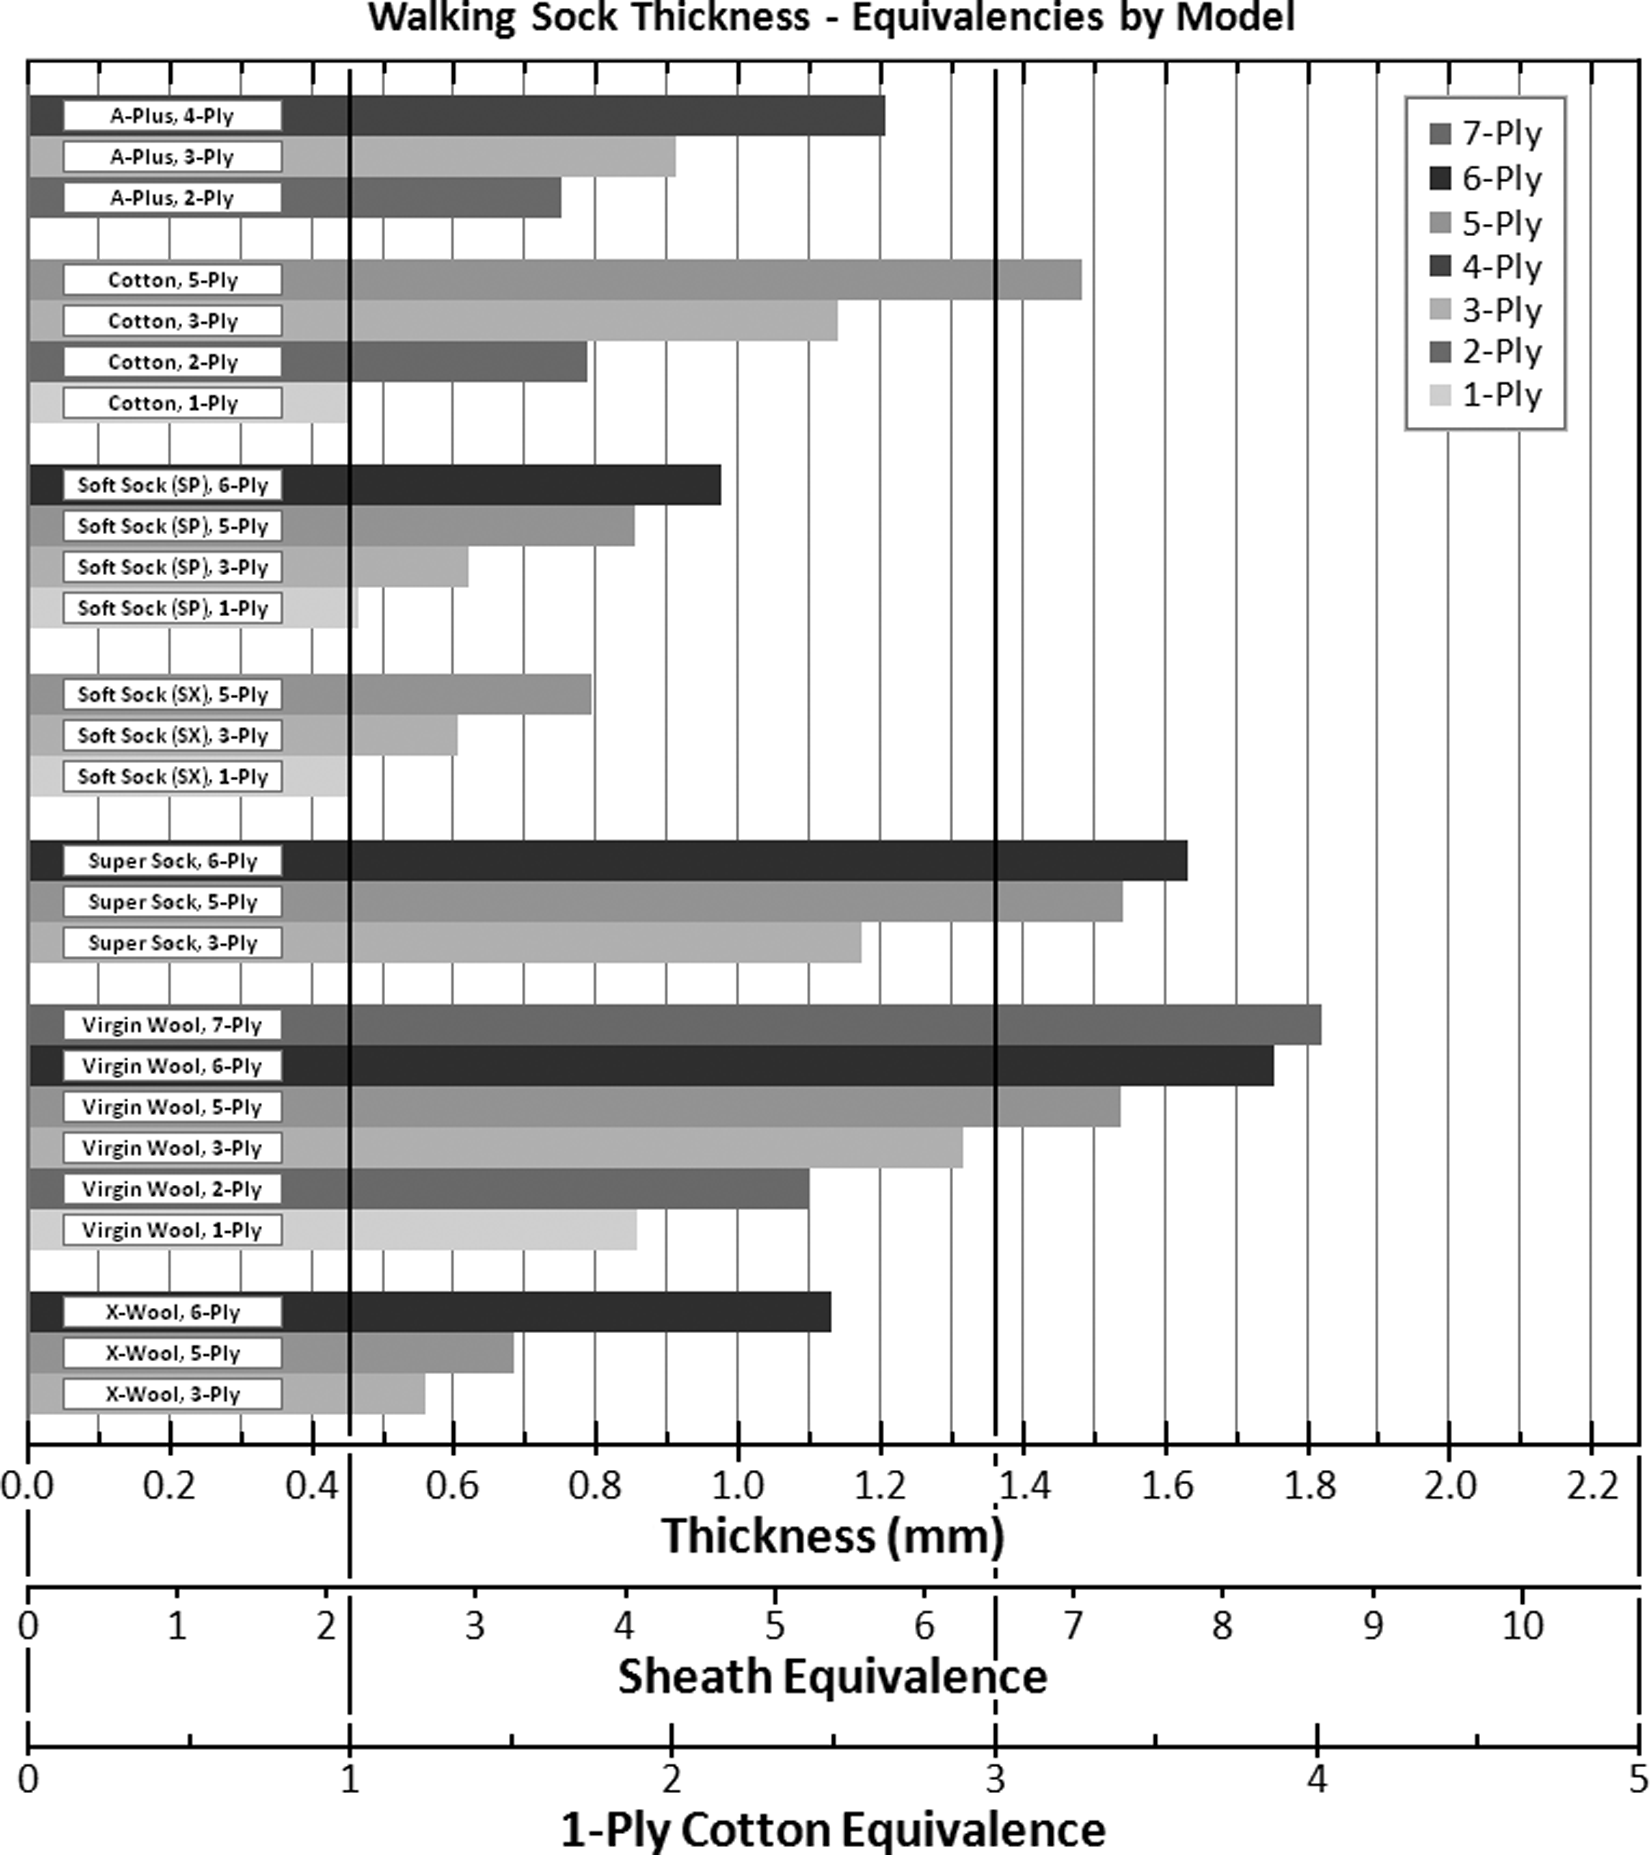
Mean sock thickness for each model tested. Results under the walking stance phase test configuration are shown.
Discussion
Consistent with clinical experience, sock thickness was not the same for different sock products of the same ply. By definition, ply depends on the yarn thickness in the material, and different materials (e.g. wool vs. blends) had different yarn thickness. We found that, on average, under walking stance phase loading conditions, Thick Socks were 80% thicker than Thin Socks, pointing to the severity of the discrepancy.
Quasi-static loading conditions were applied here instead of cyclic conditions because that was the capability of our testing system. Cyclic loading would be expected to result in greater compression and thus lower thickness results than those reported here, though because of the steep slope of the stress-strain plots at high loads differences under stance phase walking conditions are expected to be minimal.
We found that compressive stress (pressure) and in-plane biaxial strain (stretching) substantially changed sock thickness measurements from those straight out of the package. The fibers may have deformed under stress. They may have compressed, gotten closer together, and changed from round to elliptical in cross section. Because fibers were made of different materials with different stiffness, there was no consistent relationship between uncompressed and compressed testing results. However, we found that the change in percent compression for uncompressed to maximally compressed was relatively consistent, ranging from 30% to 36% for 3 and 5 ply; and 31 to 47% for 1 ply, depending on the material. Thus, in general, presence of compression reduced the amount a sock compressed by about 1/3.
We found that in-plane strain, however, had a different impact. All socks thinned when put under biaxial strain. However, there was a clear dependence on material when compression was added. Biaxial strain in Thin Socks added another 25% to 32% thickness loss to the effects of compression alone. But for Thick Socks there was very little impact. We expect that this result reflects the greater spacing between fibers for Thin Socks. Thin Socks easily elongated under biaxial tension, creating space between fibers which, when the socks were compressed, may have allowed the fibers to deform (Figure 8). If Thin Socks were not put under biaxial tension, adjacent fibers may have prevented lateral expansion, creating a higher compressive stiffness. In-plane tension did not affect Thick Sock response to compression maybe because the material was so taut there was no place for the fibers to expand. Results for Thick Socks under bi-axial strain were thus similar to results without bi-axial strain.
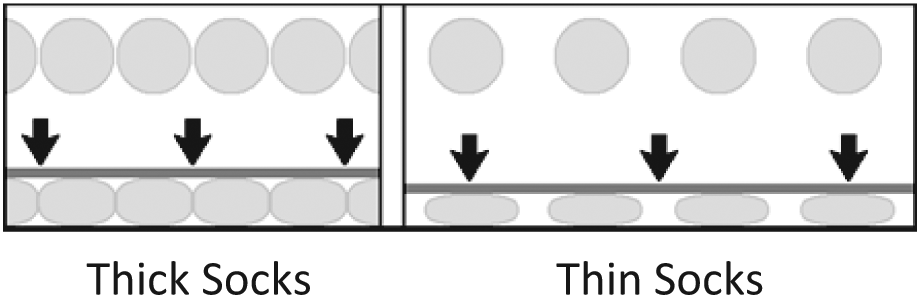
Postulated explanation for differences between Thick Sock and Thin Sock response. When put under in-plane biaxial strain, Thin Socks stretched, increasing distances between adjacent fibers (right panel) and allowing greater fiber deformation during compression loading. For Thick Socks fibers butted against each other (left panel) thus did not deform. As a result Thin Socks compressed more than Thick Socks when in-plane biaxial strain was present.
Clinically, this result means that Thin and Thick Socks should be considered two different types of materials. Even though they may be of the same ply, while worn Thin Socks are much less stiff and compress a lot more than Thick Socks. Thus the practitioner can expect more compression from Thin Socks and thus a looser socket when a Thin Sock is used compared with a Thick Sock. It is also noteworthy that Thin Socks stretch a lot more in the plane of the sock than Thick Socks.
For all socks, thickness under stance phase walking conditions was much less than new from the package. The thickness reduction was not consistent across all materials tested. For these reasons and because the volume of the socket is such an important aspect of prosthetic fit, 8 the current nomenclature of ‘ply’ might not be the best convention for prosthetic socks. A nomenclature that instead describes socks in units of thickness may be more intuitive. Further, the nomenclature should reflect conditions of relevance to using a prosthesis, i.e. pressure (from ambulation) and stretch (from putting on and pulling up the sock) rather than unloaded conditions.
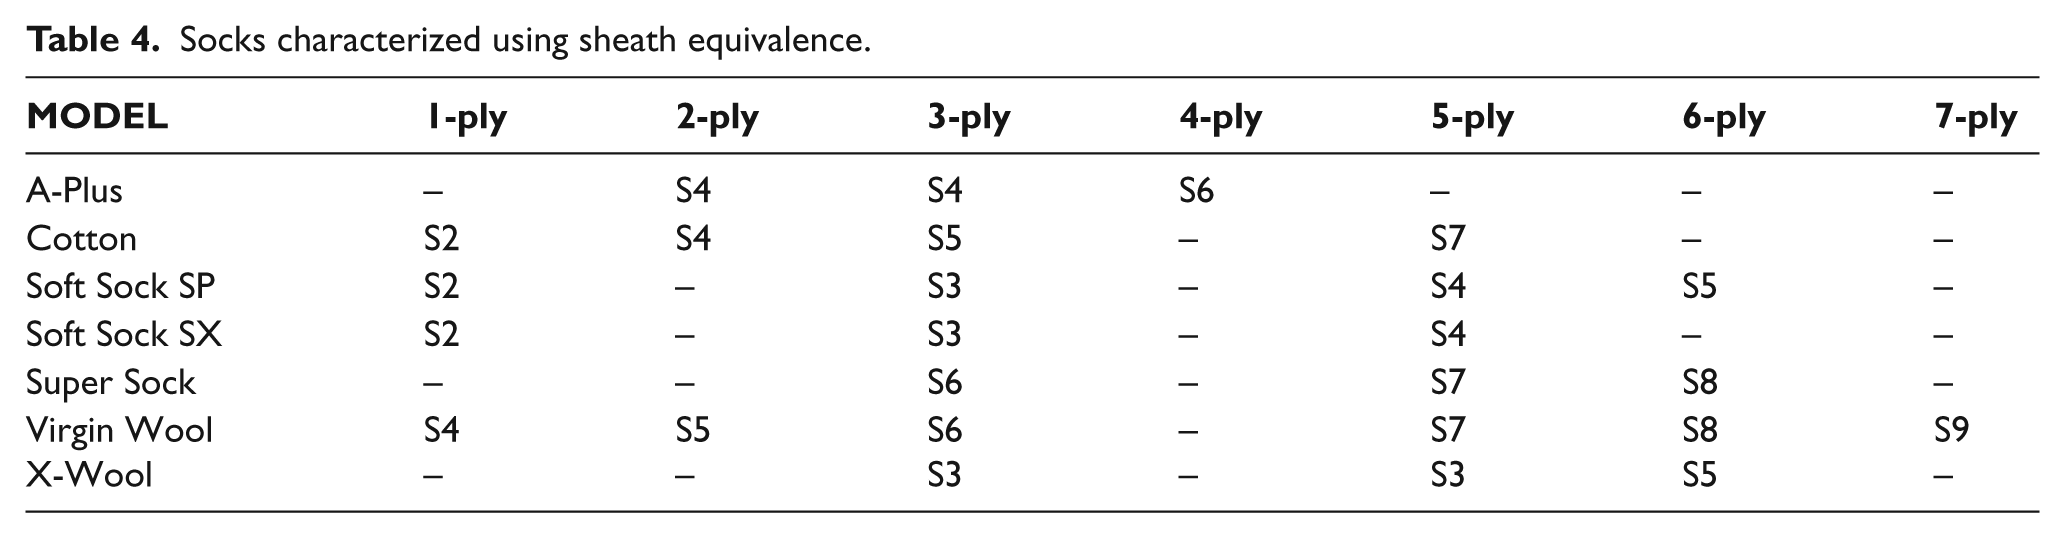
Results from the present study suggest that equivalent sheath count, the number of polyamide sheaths that equal a sock’s thickness, might be an appropriate convention. Though practitioners do not typically use sheaths for volume accommodation, they are a material of standard convention that most practitioners are familiar with and thus sheath count is somewhat intuitive. Our testing showed that one sheath is of 0.21 mm thickness. Using sheath count (with units we define as ‘S’), Soft Socks SP 1,3, and 5 ply corresponded to two, three and four sheaths, respectively (Figure 7), which we term here ‘S2’, ‘S3’ and ‘S4’. The sheath counts for all socks tested in the present study are listed in Table 4.
Socks characterized using sheath equivalence.
Part of the reason we suggest using sheath count, instead of millimeters, 1-ply cotton equivalence, or some other unit, is because of the easy-to-remember relationship between sheath count addition and socket volume change. Adding a thickness of one sheath to a standard residual limb model used in previous research to represent an ‘average’ trans-tibial residual limb 9 corresponds to a 1% increase in limb volume (Figure 9). Thus with this convention the sheath count corresponds to the percentage volume change. So for an average-sized residual limb, a practitioner can expect a sock of thickness S2 to induce a 2% socket volume reduction, a sock of thickness S3 a 3% socket volume reduction, a sock of thickness S4 to induce a 4% socket volume reduction, and so on. This convention simplifies effort to become familiar with clinical meaning of per cent limb volume change. While stating a relationship between sheath count and per cent volume change is possible, developing a relationship between sock ply and percent volume change is not because, as demonstrated in the present study, ply is not proportional to thickness.
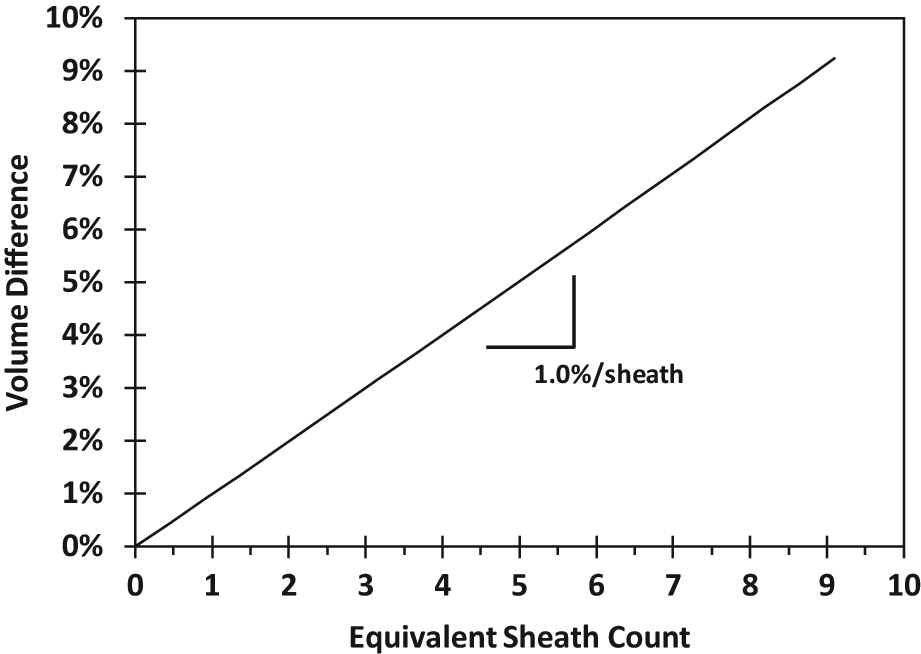
Relationship between sheath count and volume increase. A standard residual limb model described previously was implemented. 9
Becoming familiar with relationships between sock addition and per cent socket volume change is important towards prescription of volume management strategies. New volume management products are expected to emerge in upcoming years. These technologies, which may adjust socket size either via user adjustment or automated control, are expected to require a practitioner to set a maximum socket volume change. The practitioner should set this value based on clinical judgment for the individual patient. If a practitioner knows that adding a sock of thickness S4 accommodates a patient’s diurnal volume change, then an automated socket adjustment device set to a maximum 4% change would be expected appropriate. Setting the maximum change incorrectly may put soft tissues at risk of injury.
It is important to recognize that the data presented here are for new, unworn socks sent directly from the manufacturer. Most certainly, sock thickness will decrease with use, and the practitioner and patient may need to adjust volume accommodation (daily sock changes) accordingly. Evaluating how much socks thin with use is a needed topic of future research. Providing practitioners and patients with these data will help enhance prescription and clinical effectiveness of sock selection, and volume accommodation practices.
A second area of needed research has to do with cumulative sock ply. From the data shown in Figure 6, it is clear that sock ply were not cumulative. In other words, a 3-ply sock was not equal in thickness to three single 1-ply socks. However, this interpretation assumes that the socks were in discrete layers when stacked, which might not be a valid assumption. Fibers for one sock might intersperse with fibers from an adjacent sock, thus reducing the stack’s thickness and bringing it closer to the thickness of the single sock of equivalent ply. Testing needs to done to determine how much fiber interspersion affects total thickness.
Conclusion
Under stance phase loading conditions, Thick Socks were approximately 80% thicker than Thin Socks. Stretching the sock around the residual limb and pulling it up on the thigh increased thickness loss under compression by ~30% for Thin Socks but had minimal effect for Thick Socks. Equivalent sheath count may be a more intuitive nomenclature to characterize sock thickness than ply. For an average residual limb, one sheath count reduces socket volume by ~1%.
Footnotes
Appendix
Constants for all of the socks tested, using the equation shown below relating thickness (in mm) to ply and pressure (in kPa).
Thickness = Ply Terms + Pressure Terms + Pressure/Ply Terms
= [A+B×Ply+ C×Ply2+D×Ply3] + [E × Pr + F × Pr2+G × Pr3+H × Pr4] + [I × Pr × Ply + J × Pr2 × Ply + K × Pr × ply2 + L × Pr2 × Ply2]
Funding
We gratefully acknowledge funding provided by the National Institutes of Health (National Institute of Child Health and Human Development) (grant number 1R01HD069387).